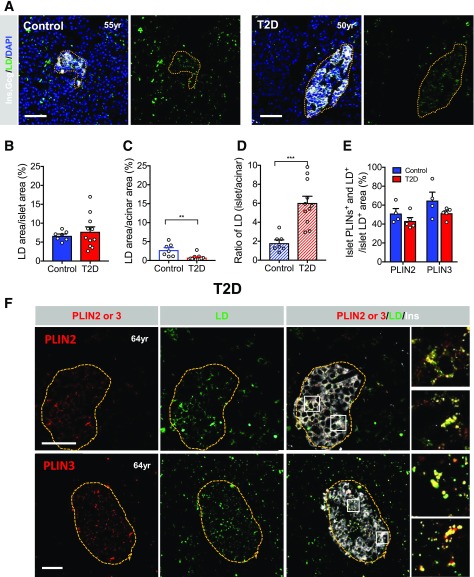
Figure 7.
LDs are enriched in T2D islets. A: Representative images contrasting the uniform BODIPY pattern in pancreas islet and acinar cells of a healthy donor to the enriched pattern of a T2D donor islet. Yellow dotted lines outline the islet area and DAPI (blue) shows the pancreas cell nuclei. B: Quantification of the percent LD area in islets. C: Quantification of the percent LD area in acinar cells. D: Quantification of the ratio of percent LD islet to acinar cell area. E: Quantitation of the islet PLIN2 or PLIN3. F: Islet PLIN2 or PLIN3 (red) colocalization with BODIPY+ (LD [green]) cells in the T2D pancreas. The yellow dotted lines outline the islet insulin+ (Ins) (white) area. Magnified insets are provided to more clearly show PLIN2/3 and LD colocalization. Scale bar = 50 μm. Error bars indicate SEM. **P < 0.01, ***P < 0.001. yr, years old.

