

Abstract
Chinese Hamster Ovary (CHO) cells are used for industrial production of protein-based therapeutics (i.e. ‘biologics’). Here we describe a method for combining systems-level kinetic models with a synthetic biology platform for multi-gene overexpression to rationally perturb N-linked glycosylation. Specifically, we sought to increase galactose incorporation on a secreted Immunoglobulin G (IgG) protein. We rationally design, build, and test a total of 23 transgenic cell pools that express single or three-gene glycoengineering cassettes comprising a total of 100 kilobases of engineered DNA sequence. Through iterative engineering and model refinement, we rationally increase the fraction of bi-galactosylated glycans five-fold from 11.9% to 61.9% and simultaneously decrease the glycan heterogeneity on the secreted IgG. Our approach allows for rapid hypothesis testing and identification of synergistic behavior from genetic perturbations by bridging systems and synthetic biology.
Keywords: IgG glycosylation, CHO cells, DNA assembly, systems-level modeling, post-translational modification
Graphical Abstract

Mammalian cell lines have applications as biological factories for protein-based therapeutics, gene therapies, and vaccines. Towards this end, cell lines have been developed that are capable of industrial-scale production of human therapeutics and other valuable biomolecules1. Cell lines used for industrial production today are the result of iterative, empirically-guided improvement efforts that include random transgene integration, amplification, and screening2. Several aspects of cell physiology, including growth, metabolism, and protein-processing work together to contribute to product quality and overall production titers3. However, many naturally-evolved traits are not desirable for applications in industrial biomanufacturing. Developing next-generation mammalian cell factories will require reshaping cell physiology to improve product quality, reproducibility, and economy of production. We focus here on controlling protein glycosylation pathways.
Asparagine-(N-) linked glycosylation is an ubiquitous post-translational modification on therapeutic proteins. During protein synthesis, a 14-sugar oligosaccharide containing two N-acetylglucosamines (GlcNAc), nine mannoses, and three glucoses is transferred en-bloc to an asparagine residue4. This oligosaccharide is further modified by the addition and removal of diverse sugar monomers in the endoplasmic reticulum and Golgi apparatus to produce the final glycan structure5. The final population of secreted proteins contains a mixture of N-linked glycans, and the structural composition of these glycans varies from one cell line to another. Importantly, the chemical structure of N-linked glycans affects physical and chemical stability, pharmacokinetic/pharmacodynamic properties, and ultimately biological activity of a therapeutic protein6. For example, galactose content influences complement-dependent cytotoxicity and affinity for C1q in the complement cascade7–10. In addition, high galactose content is required for sialic acid incorporation, which mediates the pro- or anti-inflammatory responses of therapeutic proteins containing the IgG Fc region11. Improved ability to control N-linked glycosylation will provide the opportunity to tune clinically-relevant properties of therapeutic proteins.
Systems-level approaches to understand protein processing have been used to demonstrate the dynamic nature of the glycosylation network via simulation models12 and parameter fitting to experimental data13, and to predict the outcomes of engineering efforts14. A challenge with such models is a relative limitation in data compared to the complexity of the systems, leading to potential overfitting13. Perturbation analyses, particularly those that vary multiple parameters at once, are rarely employed to validate systems-level predictions.
Previous efforts towards glycoengineering of therapeutic proteins have spanned from rational genetic manipulations to indirect methods such as medium supplementation and random mutagenesis15. Fucose incorporation was the target of several early glycoengineering efforts. Blocking fucose incorporation to N-glycans on human IgGs enhanced their binding to the FcγRIIIa receptor of natural killer cells and increased their antibody-dependent cell-mediated cytotoxicity (ADCC) activities. Cell lines were identified that naturally produced afucosylated product, but these were not suitable for industrial production16. Chemical mutagenesis and selection yielded CHO cell lines lacking the ability to produce and incorporate GDP-fucose17,18. Later, genes involved in GDP-fucose synthesis were rationally disrupted using sequential homologous recombination19 and sequence-programmable nucleases20. Transcriptional regulation for glycoengineering was demonstrated using siRNA to knock down the levels of fucosyltransferase, Fut821. Lastly, heterologous expression of single transgenes has been shown to change N-linked glycan profiles. There are few examples wherein multiple glycosylation genes are overexpressed in concert which have been shown to improve engineering efforts22. The above examples are not comprehensive, but illustrate the diversity of approaches that have been applied to control glycan structure in CHO cells.
Here, we combine approaches from systems and synthetic biology to guide N-linked protein glycosylation in CHO cells. First, we characterized the glycan profile of IgG secreted by CHO-2C10, a CHO K1 derived strain that produces 18 pg/cell/day of the recombinant IgG23. We then used an iterative approach of systems-level modeling followed by genetic construct design, fabrication, and testing (Fig. 1A) to increase the galactose content on the secreted IgG. This approach led to improvements in the systems-level model and allowed us to rationally increase galactose content by five-fold. Our pipeline for engineering multi-gene systems in mammalian cells is applicable to systems beyond N-linked glycosylation. For example, this iterative multi-gene engineering approach could be used to modify other metabolic or physiological properties of CHO cells to develop next generation industrial cell lines.
Figure 1.

Design and assembly of glycoengineering cassettes. (A) Schematic illustration of model-based iterative glycoengineering. Synthetic Biology Open Language (SBOL) iconography is used to represent genetic constructs here and throughout this manuscript. (B) Genetic design of reporter construct with red fluorescent protein (rfp) internal reference standard (top) and relative expression data (bottom) for mammalian promoters and 3’-UTR elements used in glycoengineering constructs. The variant promoter and terminator positions are marked with dashed boxes. (C) Representative UPLC trace for glycan structures cleaved from IgG isolated from CHO-2C10 cells (sugar legend in D). (D) Systems-level schematic of N-linked protein glycosylation, including (i) NDP-sugar biosynthesis in the cytoplasm, (ii) transport into the ER/Golgi lumen, and (iii) oligosaccharide extension and remodeling. Coding sequences for genes underlined are included in the CDS library.
RESULTS
DNA assembly pipeline and genetic parts for glycoengineering.
We began by adapting a previously described pipeline for building multi-gene expression constructs to make it compatible with mammalian host cells28. A hierarchical DNA assembly strategy was used to assemble genetic elements (promoter/5’-UTRs, CDSs, 3’-UTRs) into monocistronic expression constructs and later into multi-gene expression constructs (Fig. 1A). Cis-regulatory elements used in glycoengineering cassettes were quantitatively compared using a transient fluorescent reporter gene assay. Two biological replicates were analyzed and error bars represent the standard error of the mean (Fig. 1B). Variant GFP expression was normalized by RFP expression to control for DNA copy number variation. Promoter hEF1a provided the highest expression strength with CMV and SV40 demonstrating the next highest and lowest expression, respectively. Expression was not impacted by changing 3’-UTR.
Coding DNA Sequences (CDSs) for 21 proteins involved in N-linked glycosylation (Fig. 1C) were refactored to remove unwanted restriction recognition sites and synthesized. In some cases, multiple isoforms of a single gene were included. CDSs in our library include those involved with precursor oligosaccharide production, nucleotide-sugar biosynthesis, nucleotide-sugar transport into the Golgi, and extension of N-linked glycans in the Golgi (Fig. 1D).
All single-gene and multi-gene plasmids contain vector backbones that allow for site-specific integration via dual recombinase mediated cassette exchange (RMCE) at FRT and LoxP flanked sites in the genome. Alternatively, constructs could be randomly integrated by lipofection and selection. This pipeline allows for rapid production of expression constructs up to 12 kilobases. A table listing the name and function of each CDS is found in Supplementary Data File 1.
Structural analysis of N-linked glycans on recombinant IgG.
CHO-2C10 is a CHO-K1 derived cell line previously engineered to express human IgG from a construct integrated into the host cell genome23. The IgG heavy and light chains are expressed from a single CMV promoter with an intervening P2A (porcine teschovirus-1 2A) linker for translational coupling29.
A baseline glycan profile (Fig. 1C and Supplemental Data File 1) was obtained for the CHO-2C10 cell line. IgG produced by the cells was purified by affinity chromatography, digested with PNGase F, and oligosaccharides were labeled with 2-aminobenzamide fluorophores as previously described30. Chemical structure of labeled glycans was determined by comparison to reference standards via ultra-high performance liquid chromatography (UPLC). The majority of IgG glycans were lacking galactose (‘G0’, 57.1% ± 4.6%), followed by monogalactosylated (‘G1’, 30.1%± 3.1%) and bigalactosylated (‘G2’, 11.9% ± 2.8%) compounds. Analysis of biological replicates revealed an average between-replicate standard deviation of less than 1% for the majority of the nineteen characterized glycan structures (Supplementary Data File 1).
Model-driven glycoengineering.
We mapped the IgG glycan profile to the glycosylation network using GlycoVis (Fig. 2A, Supplementary Fig. S3). GlycoVis maps the network of possible glycan structures as nodes connected by the enzymes that catalyze their interconversion. Many of the glycans that are abundant on IgG from CHO-2C10 cells are immediately upstream of β−1,4-galactosyltransferase (β4GalT) mediated reactions, an enzyme encoded by seven distinct genes in the human genome (Fig. 2B)32.
Figure 2.
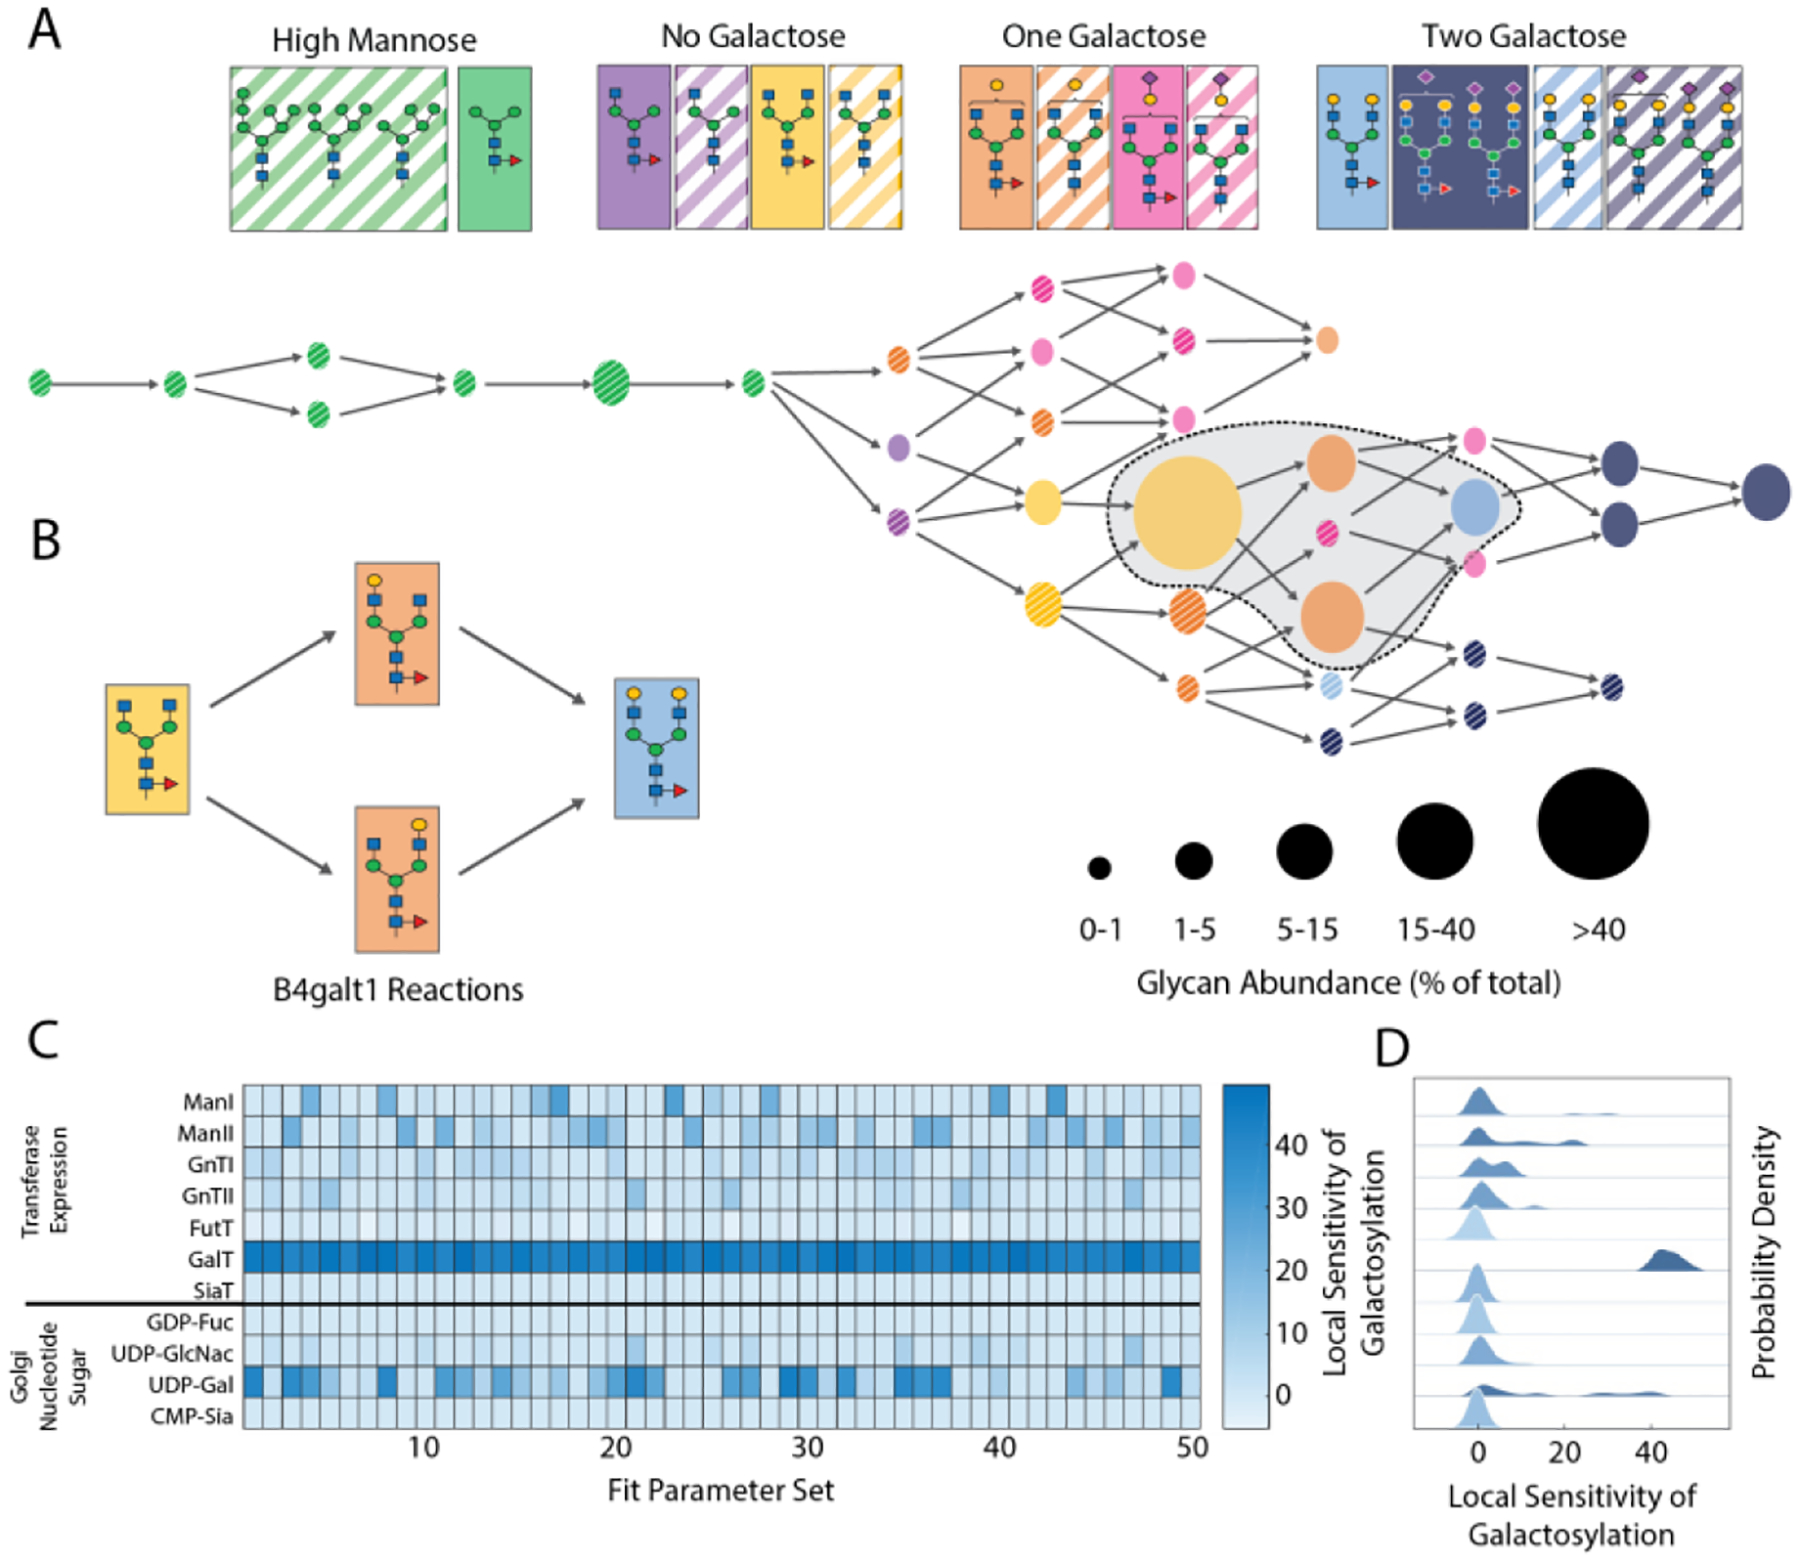
Model-driven design of single-gene overexpression constructs. (A) Baseline glycan profile in CHO-2C10 visualized using GlycoVis31 network. Nodes in the network diagram are colored according to the legend above, with node size denoting glycan abundance from the baseline UPLC analysis. Arrow (edges) represent known chemical transformations catalyzed by glycotransferases or mannosidases. (B) Structures of predominant glycans, corresponding to the shaded sub-network in (A). Arrows in (B) correspond to B4GalT1-catalyzed reactions. (C) Simulated sensitivity analysis of kinetic N-linked glycosylation model to perturbations in glycotransferase, mannosidase, or nucleotide-sugar concentration. Heatmap shows predicted sensitivity of galactose content in total glycan profile. Galactosylation is defined as percentage of ‘G1’ glycans plus 2x percentage of ‘G2’ glycans. (D) Probability density plot of local sensitivity analysis from (C), with plot order corresponding to rows in heatmap. Color intensity corresponds to mean sensitivity.
A kinetic model for N-linked glycosylation12 was used to predict how the glycan profile would be effected by altering glycosyltransferase and mannosidase concentrations as well as nucleotide sugar concentrations in the Golgi. As a baseline, the model parameters were first fit to match the baseline glycan profile of the CHO-2C10 cell line via the following approach. Local parameter optimization was performed using a Nelder-Mead hill-climbing algorithm33. This algorithm identifies combinations of parameters that minimize the sum of squared residuals (SSR) between the experimental glycan profile and the composition of glycans in the final Golgi compartment in the kinetic model. The parameter estimation consisted of eleven variables: two mannosidases (ManI, ManII), five transferases (FucT, GnTI, GnTII, GalT, and SiaT) and four nucleotide sugars (GDP-fucose, UDP-GlcNAc, UDP-galactose, and CMP-sialic acid). As Nelder-Mead is a local optimization method, the optimization was repeated from 50 different starting points to produce 50 locally optimal parameter sets. Next, a local sensitivity analysis was performed on each parameter set. Specifically, we investigated the impact of a ± 10% perturbation of the intra-Golgi concentrations for each glycosyltransferase and nucleotide-sugar on the amount of galactose incorporation (Fig. 2C). Increasing the concentration of galactosyltransferases (GalTs) and UDP-galactose were expected to have the largest impact on galactose incorporation (Fig. 2D). The qualitative similarity in behavior and sensitivity of many of these parameter sets with regards to glycosylation (Fig. 2C, D) implies that the major phenomena and limitations of the starting CHO-2C10 cells have been identified as far as the experimental data available can support. The impact of the number of initial starting points used for the Nelder-Mead optimization was determined by plotting how the mean galactosylation sensitivity for each parameter would have changed if the number of starting points varied from 1–50. The results (Supplementary Fig. S11) indicate that sampling 50 starting points is likely sufficient to capture the diversity of model behaviors.
β4GalT1 and β4GalT2, two human galactosyltransferases, were selected as candidates for overexpression because of their previously reported importance to β−1,4 galactosylation34–36. In parallel, we selected genes encoding enzymes predicted to increase the concentration of UDP-galactose in the Golgi, including biosynthetic enzymes (GALE, UGP2a/b, GALK1, GALT) and nucleotide sugar transporters (SLC35A2/D1). Together these represent the top targets based on kinetic modeling (Fig. 2D), and their overproduction was predicted to increase the galactose content on IgG (Supplementary Fig. S4). Lastly, we selected two genes (MGAT2, DOLK) predicted to increase the concentration of the agalactosylated ‘G0’ glycans that are substrates for the galactosyltransferase.
Single-gene glycoengineering.
We built eleven single-gene glycoengineering constructs by assembling candidate CDSs with characterized cis-regulatory elements. Genetic design and complete nucleotide sequences for each construct are reported in Supplementary Data File 1. For rapid screening of overexpression constructs, we transfected CHO-2C10 cells and selected for random genomic integration events using the blasticidin resistance marker. Recombinant cells were isolated as non-clonal pools, and their glycan profile analyzed as described above (Fig. 3A). Expression of glycosylation genes were confirmed with RT-PCR (Supplementary Figure S5). Cell growth and IgG productivity of cell pools were not affected by the single-gene overexpression cassettes (data not shown).
Figure 3.

Single-gene overexpression and model refinement. (A) Glycan profile for CHO-2C10 and single-gene overexpression cells. Bars are colored according to glycan structure using the legend in Fig. 2 and are arranged to highlight the different total fractions of agalactosylated (‘G0’, left of dashed line) and mono- or bi-galactosylated glycans (‘G1’ and ‘G2’, respectively; right of dashed line). † denotes glycan analysis from triplicate experiments, * denotes significantly different galactose incorporation based on χ2-analysis, with p-value < 0.05 after Bonferonni correction for multiple comparisons (raw p-value < 0.0045). (B) Kinetic model robustness analysis for overexpression of UDP-galactose biosynthesis/transport genes and glycosyltransferases from single-gene overexpression experiment. Red and blue traces represent different parameter combinations, with blue indicated the down-selected subset carried forward to future modeling. (C) Principle components analysis of 50 parameter sets with points colored as in (B).
The only single-gene perturbation that significantly changed galactose incorporation (based on a modified χ2-test, Supplementary Note 1) was the overexpression of β4GalT1. That β4GalT1 would impact galactose incorporation is expected; every parameter combination tested in the kinetic model predicted that changing galactosyltransferase concentration would increase the amount of ‘G1’ and ‘G2’ glycans. β4GalT2 overexpression did not significantly change glycan composition, but this enzyme has been reported have a higher Km than the β4GalT1 isoform37, and thus it may be less efficient under some circumstances.
None of the cell pools engineered to overexpress genes involved in UDP-galactose synthesis or transport yielded a change in glycan galactose content. There are three explanations for this result: (i) overexpressing the biosynthetic or transport genes did not change the corresponding protein levels, (ii) the UDP-galactose concentration in the Golgi was not effected by the change in gene expression, or (ii) that UDP-galactose concentration is not limiting in CHO-2C10 cells. Regardless of the underlying reason, this suggests that the kinetic model can be improved using the new experimental data and used to better guide glycoengineering efforts. We pursued this with the following experiments.
Improving the kinetic glycosylation model.
We sought to improve the kinetic model based on results from the single-gene overexpression experiment. The large number of model parameters relative to the amount of input data from the CHO-2C10 glycan profile likely resulted in overfitting of locally-optimal parameters, which is observed during the sensitivity analysis (Fig. 2C). Notably, certain parameter sets incorrectly identified UDP-galactose concentrations as limiting galactose incorporation into the IgG glycans. The model performance with respect to UDP-galactose concentration was multi-modal (Fig. 2D), suggesting that some parameter combinations are more accurate than others.
We then compared model predictions and experimental results at each of our 50 parameter combinations (Fig. 3B). For different targets in the single-gene experiment, we calculated the sum of squared residuals between the single gene experimental results and the model predictions at different relative enzyme or nucleotide sugar concentrations. We note that although we confirmed overexpression of the introduced genes, the actual change in enzyme activity in our overexpression experiments is difficult to measure, as it is affected by protein concentrations and kinetics in each Golgi cisternae which gene expression cannot fully predict. By performing this analysis across a range of enzyme levels, we can observe differences in the robustness of parameter sets.
The glycosyltransferases and UDP-galactose biosynthesis/transport genes show stark differences regarding the model’s robustness towards variations in input parameters. The model’s ability to predict the single-gene overexpression results was virtually identical across all 50 parameter sets for β4GalT1/2 and MGAT2. For the seven UDP-galactose biosynthesis/transport genes, only a subset of parameter combinations (represented as blue traces in Fig. 3B) generated predictions that agreed with overexpression data. We performed a principle components analysis on log-transformed values of the 50 parameter sets, and the retained parameter sets (blue traces and points in Fig. 3B,C) separated from the removed sets (red traces and points) along a principle component that is dominated by CMP-sialic acid and UDP-galactose levels. In the retained sets, UDP-galactose levels are on average 225-fold greater than in the removed sets (i.e. not rate-limiting), and CMP-sialic acid levels are approximately 2-fold lower (Supplementary Fig. S6). The difference in parameter combinations that were identified by the Nelder-Mead optimization are expected. Since we allowed both NDP-sugar concentrations and glycosyltransferase activity to vary during the optimization, there were two functionally equivalent solutions to limiting galactose incorporation. The results from our single-gene overexpression experiment show that the parameter combinations that had low GalT activity but high UDP-galactose levels were more accurate than those that predicted the opposite.
The results in Fig. 3B,C were used to down-select a total of thirty parameter sets for future modeling. The retained sets still include diverse values (Fig. 3C), but these sets better predicted the experimental results, both for the starting CHO-2C10 cells and the single gene overexpression mutants.
These parameter subsets were used to simulate the effects of gene overexpression on galactose incorporation. This time, we allowed for multiple genes to be perturbed at the same time (Fig. 4A). The narrower set of parameter combinations greatly reduces the variability among the predictions (Supplementary Fig. S7). The model now predicts that UDP-galactose levels are not limiting in CHO-2C10, but become limiting only upon GalT overexpression exerts some influence on galactose incorporation. This is apparent by the slight curve in the response surface (Fig. 4A) along the UDP-galactose axis only at higher levels of GalT expression. This non-independence of gene expression on glycan structure is common in complex multi-gene systems and has been observed in other multi-gene systems28,38,39. Importantly, the model suggests that multi-gene overexpression is important to produce greater changes in the galactose content of IgG glycans.
Figure 4.

Model-driven multi-gene glycoengineering. (A) Kinetic modeling of the interdependence of UDP-galactose levels and galactosyltransferase activity on galactose incorporation levels. (B) Glycan profile of original CHO-2C10 and engineered cells with randomly integrated three-gene glycosylation constructs. Bars are colored according to glycan structure using the legend in Fig. 2 and are arranged to highlight the different total fractions of agalactosylated (‘G0’, left of dashed line) and mono- or bi-galactosylated glycans (‘G1’ and ‘G2’, respectively; right of dashed line). † denotes glycans measured from triplicate experiments, * denotes significantly different galactose incorporation based on χ2-analysis, with p-value < 0.05 after Bonferonni correction for multiple comparisons (raw p-value < 0.007). (C) Genomic location and organization of dual RMCE landing pad, including integration design for three-gene glycosylation constructs. (D) Glycan profile of original CHO-2C10 and engineered cell lines highlighting reproducibility of glycan perturbation following site-specific integration. n.s. denotes non-significant difference of swapping clones from randomly integrated B4GalT1-SLC35D1-GALK1 construct, based on χ2-analysis. All are significantly different from CHO-2C10.
Glycoengineering through expression of multi-gene cassettes.
Adjusting expression levels of individual metabolic enzymes can shift the pathway bottleneck (i.e. rate-limiting component) between intermediate steps without altering final glycosylation profiles. While the single-gene overexpression experiment suggested that low β4GalT1 levels in the original cell line limited the degree of galactose incorporation to IgG, our refined model suggested that UDP-galactose concentration may have increased effect after overexpression of galactosyltransferase (Fig. 4A).
To address this, we designed, built, and tested multi-gene constructs that simultaneously overexpress β4GalT with genes that target UDP-galactose biosynthesis or transport (Fig. 4B). In addition, several other multi-gene constructs were designed that overexpress genes involved in sialic acid precursor synthesis, sialic acid transfer, and increased glycan branching (Supplementary Fig. S8). The latter group was designed based on previous literature22,40,41 and GlycoVis simulations, but not the kinetic model. Each multi-gene construct is comprised of three separate mono-cistronic expression cassettes. Each monocistron has a unique promoter (Fig. 1B) and the SV40 or rbGlob polyA tail. As with the single-gene overexpression experiment, these were originally integrated randomly to the CHO-2C10 genome and pools of transformed cells were isolated by selecting with blasticidin.
Our first design included β4GalT1, UDP-galactose transporter SLC35A2, and galactose kinase GALK1. This design did not lead to more galactose incorporation than β4GalT1 alone. Our next set of designs included the UDP-sugar transporter SLC35D1. SLC35D1 is reported as a UDP-N-acetylgalactosamine (UDP-GalNAc) transporter, although it also transports other UDP-sugars, including UDP-galactose, with lower efficiency40. Multi-gene expression constructs that included SLC35D1 produced the highest rates of galactose incorporation, regardless of which UDP-galactose biosynthetic enzyme was included in the three-gene cassette.
The success rate of constructs engineered to increase galactose incorporation was higher than in the single-gene experiment. Each of the seven cell pools generated showed a significantly increased level of galactose incorporation (Fig. 4B) compared to the CHO-2C10 control. The best cells, overexpressing β4GalT1, SLC35D1, and GALK1, have 61.4 ± 6.7 % bi-galactosylated (‘G2’) glycans, compared to only 11.8 ± 2.7 % ‘G2’ in CHO-2C10 and 47.3 ± 5.5 % in the β4GalT1-overexpressing cell pools. Importantly, the improvement in galactose incorporation in our best three-gene cell line highlights the shifting bottlenecks that arise when engineering complex systems. Neither SLC35D1 nor GALK1 overexpression impacted galactose incorporation individually, but these were able to synergize the impact of β4GalT1 overexpression.
Reproducible glycoengineering using site-specific integration to a genomic landing pad.
The decision to randomly integrate overexpression constructs to the genome was driven by low rates of dual Recombinase-Mediated Cassette Exchange (RMCE) into the target locus within CHO-2C1023. However, we tested whether similar levels of glycan perturbation would be seen following integration of our best three-gene construct site-specifically to the genomic landing pad. The β4GalT1-SLC35D1-GALK1 construct was introduced to CHO-2C10 integration at FRT and loxP sites (Fig. 4C). Several clonal cell lines were isolated by single-cell cloning and assayed as described above. Each clonal cell line showed high levels of ‘G1’/’G2’ glycans, ranging from 88% - 90% (Fig. 4D). IgG titers and cell growth were not affected by the three-gene overexpression cassettes (Supplementary Fig. S9). This experiment highlights the reproducibility of this system.
DISCUSSION
Glycosylation is a critical post-translation modification that affects the therapeutic properties of antibodies. Steering glycan structure towards a specific target is a long-standing challenge in biopharmaceutical production. In this study we employed a two-pronged approach using synthetic and systems biology to engineer increased galactosylation of IgG. We increased total galactose glycan species (‘G1’+’G2’) from 42.8% in the IgG-producing CHO-2C10 cell line to 90.4% in a targeted insertion engineered cell line. The fraction of bi-galactosylated glycan increased five-fold. Galactosylatyion is important in modulating the inflammatory potential of IgG and binding of C1q to initiate complement dependent cellular cytotoxicity7–10. Galactose incorporation is also a prerequisite for sialylation, which is a primary determining factor in serum retention6.
In this study we sought to use systems-level models to directly guide construct design and optimization. We started by using empirical glycan composition data from an engineered IgG-producing CHO cell line to fit parameters from a kinetic model. The kinetic model treats the four Golgi compartments (cis, medial, trans, and TGN) as four continuous well-mixed reactors in series12. The model considers not only enzyme kinetics and concentrations of substrates in the Golgi, but also the distribution of enzymes between compartments. To simplify the initial parameter optimization, we fixed variables defining flow of substrates between compartments as well as the relative distribution of each enzyme among the different compartments. The only parameters we varied were the Vmax of seven key glycosyltransferases and the Golgi concentration of four NDP-sugars. Even within these eleven variables, wildly different parameter combinations equally fit the experimental data. This speaks to the complexity of N-linked glycosylation but also to the paucity of fitting data present in the single endpoint analysis of IgG glycan profile.
The most striking difference in the parameter combination were the respective fits or GalT and UDP-Galactose levels. The starting conditions predicted that the Golgi concentration of UDP-Galactose exceeded the Km of GalT for UDP-Galactose. To fit the experimental data from 2C10, where there is low UDP-Galactose incorporation, the optimization algorithm adjusted parameters either by making GalT rate limiting, or by dramatically lowering UDP-Galactose levels to the point where they became limiting. A priori, we could not distinguish between these two possibilities.
By allowing both NDP-sugar and glycosyltransferase levels to vary during our model simulations, we invited bi-phasic solution states for the incorporation of each sugar (i.e. either the NDP-sugar level would optimize to become rate limiting to explain final glycan incorporation or the glycosyltransferase would optimize to become rate limiting). An alternative approach would have been to lock in one of these sets of parameters (e.g. NDP-sugar concentrations) at several discrete levels and optimize only on glycosyltransferase activity. When combined with the single- or three-gene overexpression data, this would potentially provide more insights towards the state of the system, and is something we would likely try in future experiments.
Our strategy to discriminate between these differing parameter combinations was to perform a perturbation analysis of the model. By overexpressing several enzymes involved in NDP-sugar biosynthesis, transport, or incorporation into N-linked glycans, we could conclude that it was low GalT activity, and not UDP-Galactose availability, that caused low Galactose incorporation. Specifically, the single-gene overexpression experiment (Fig. 3) showed that increased transcription of each of the enzymes tested required for UDP-galactose biosynthesis or transport into the Golgi failed to increase Galactose incorporation. The most likely explanation is that UDP-galactose is limiting in 2C10 cells. However, there are several other possible explanations of these results. In light of recent multi-omics systems analysis of IgG glycosylation in CHO cells, it is plausible that metabolites and/or cofactors that increase overall UDP-galactose flux into Golgi apparatus or the transferase activity itself were limiting43. It is also possible that expression levels of UDP-galactose biosynthesis enzymes, including GALE, GALK1, and GALT, do not correlate with UDP-galactose concentrations43.
It was observed that pairing overexpression of β4GalT1 with genes aimed at increasing UDP-Gal supply increased galactosylation. The apparent increased sensitivity of galactosylation to UDP-Gal supply only upon β4GalT1 overexpression, implies that the increased utilization of UDP-Gal may have decreased its concentration in the Golgi below the region of saturation, thus allowing synergistic effects from enzymes which increase its supply. While two genes were paired with β4GalT1 overexpression in this work, it is plausible that overexpression of one of the extra genes with β4GalT1 may be responsible for the improved galactose incorporation.
The high level of galactose incorporation afforded by three-gene constructs that include SLC35D1 may seem counterintuitive due to this transporter’s annotation as a UDP-GalNAc transporter involved in O-glycosylation. Several explanations could explain this result. During CHO cell culture, UDP-GalNAc levels are known to rise considerably over the several day cultivation period43,44. Like SLC35D1, SLC35A2 is promiscuous in the UDP-sugars it transports, and has activity with UDP-GalNAc as well as UDP-GlcNAc45,46. These alternative substrates can act as competitive inhibitors of UDP-galactose transport through SLC35A2. The impact of overexpressing SLC35D1 on galactose incorporation could come from relieving inhibition of the SLC35A2 channel through lowering the cytoplasmic concentration of UDP-GalNAc. Alternatively, the ability for SLC35D1 to function as a low efficiency UDP-galactose transporter could directly increase levels of UDP-galactose in the Golgi apparatus. Regardless of the explanation, SLC35D1 was able to reproducibly increase galactose incorporation to the IgG glycans in several different genetic designs. Compared to β4GalT1 alone from the single-gene experiment, in which 68% of the glycans were ‘G1’ or ‘G2’ (Fig. 3A), adding SLC35D1 to β4GalT1 constructs increased ‘G1’/’G2’ levels to 78%−90% (Fig. 4B,D).
While our kinetic model performed reasonably well at predicting the results from three-gene overexpression experiments (Fig. 4 and Supplementary Fig. S10), it is noteworthy that its predictions are limited by availability of experimental data. Transcription of introduced genes were confirmed with RT-PCR (Supplementary Fig. S5), but level of overexpression and the kinetic effects of it were not. Additionally, the final optimal model parameters (e.g. apparent Vmax values for glycosyltranferases) are likely influenced by the specific biochemistry of IgG glycosylation. One example of this, is that certain enzymes appear to have a kinetic preference for one arm of branched glycans over the other in vitro, whereas the model has equal preference, resulting in concentration differences12. Nevertheless, the model was able to recapitulate the approximate results of the experiments. Additionally, each optimized parameter set contains a low Vmax value for the sialyltransferase, SiaT (Supplementary Fig. S6). The model produced this result because of the low frequency of sialic acid incorporation to IgG, which previous studies have suggested is due in part to steric blocking of the site of sialylation by bulky amino acids in the Fc region47. As such, the predictive ability of parameter combinations identified in this study is limited to IgG glycosylation, and not N-linked glycosylation in general. However, our approach of coupling kinetic modeling with single- and multi-gene over-expression should work for a variety of cellular processes.
The largest construct that we integrated to the CHO genome comprised 3 monocistronic expression cassettes in 9.1 kb of total sequence. When inserted into the genomic landing pad that included an IgG expression construct, the total amount of rDNA integrated site-specifically to the CHO genome was 13.7 kb. Modern tools for DNA synthesis and assembly allow for the construction of substantially larger constructs25,48. Currently, transfection efficiency of large constructs limits the size/complexity of rDNA that can be routinely integrated to CHO genomes. While plasmid assembly has improved dramatically in the past decade, methods available for delivering large genetic constructs have not seen similar improvements. Effective delivery of 48 kb cosmid DNA to primary cells was described in the early 1990’s. Recent state-the-art efforts, including delivery of rDNA constructs comprising ~40 kb to HEK293FT cells48, are of the same order of magnitude. Delivery methods that allow for routine delivery of 100 kb or more in a single event, which are available for bacterial engineering49, would dramatically accelerate multi-gene engineering workflows.
In conclusion, we present a workflow for iterative kinetic modeling and strain design/construction to engineer N-linked glycan structure in CHO cells. We demonstrated a proof of concept by rationally increasing galactose incorporation to human-IgG. We saw that coupling the systems- and synthetic biology workflows led to improvements in each. Our cell lines that incorporate high levels of galactose retain their good per cell productivity levels and represent platform cells for future glycoengineering efforts, for example to increase sialylation.
Materials and Methods.
Media and reagents.
Escherichia coli NEB Stable cells (New England Biolabs #C3040H, Ipswitch, MA) were used for routine cloning and plasmid propagation. Difco LB-Miller (BD #244620) media was used for E. coli strain growth and maintenance. Antibiotic selection was done using Kanamycin (50mg/L, Sigma-Aldrich, #K1377), Carbenicillin (100mg/L, IBIScientific, #IB02025), and Blasticidin (12mg/L, InvivoGen, # ant-bl-05). Primers and gene fragments (G-blocks) were ordered from Integrated DNA Technologies (Coralville, IA), while sequence verified genes were ordered from Twist Bioscience (San Francisco, CA). CHO-K1 cells were obtained from ATCC (CHO-K1, ATCC CCL-61) and cultured in F12K Medium (Kaighn’s Modification, Gibco, Waltham, MA) supplemented with 10% Fetal Bovine Serum (Gibco, Waltham, MA) and incubated at 37 °C in 5% CO2.
Construction of expression vectors.
Complete sequences of all key plasmids used in this study, as well as a genetic parts-level description of single multi-gene expression constructs and PCR primers, are provided in Supplementary Fig. S1 and Supplementary Data File 1. Here we briefly describe construction of key plasmids. Each plasmid was transformed into chemically competent E. coli NEB Stable cells, selected on solid medium with appropriate antibiotics, isolated by plasmid mini-prep (Qiagen #27106, Valencia, CA), and confirmed by Sanger sequencing.
pCDS vector.
pCDS was constructed via with a one-pot Golden Gate assembly as previously described24 using 5 U BbsI (New England Biolabs, R0539S) and 5 U T4 Ligase (Promega, # M1804) from two PCR fragments. The origin of replication and selectable Kanamycin marker was amplified using oligonucleotide primers (pCDS_vecF, pCDS_vecR) from plasmid pMJS1AE and lacZα gene product was amplified from plasmid pMJS1AE using oligonucleotide primers (pCDS_lacZF, pCDS_lacZR) that contain lacZ-specific sequences, a SapI recognition site, 4-bp assembly scar sequence, and an AarI recognition site.
pSG-DV vector.
pSG-DV was constructed via an isothermal assembly reaction25 from multiple PCR fragments (Integrated DNA Technologies, Coralville, IA) (primers and G-blocks listed in Supplementary Table 2). The lacZα gene product flanked on each side with BbsI followed by AarI restriction sites with 4- base pair “AB” assembly scars was PCR amplified from pMG-DV (CSS_ScarAF_LacZ, CSS_LacZ_ScarBR). The promoter driving Blasticidin resistance was amplified from pMG-DV as 2 fragments to remove an AarI site ((CSS_ScarB_UBCpromF, CSS_UBCR_RemAarIR; fragment 1), (CSS_UBCF_RemAarIF, CSS_UBCR_Blast; fragment 2)). A portion of the vector backbone was amplified from pMG-DV as 2 fragments to remove a SapI site ((CSS_SynPolyAF, CSS_SpacerR_RemSap; fragment 1), (CSS_RemSapIF_Spacer, CSS_SpacerR_Beta-lac; fragment 2). The origin of replication was amplified from pMG-DV as 2 fragments to remove a SapI site ((SpacerF, CSS_ColE1_RemSapIR; fragment 1), (CSS_Rem_SapIF_ColE1, CSS_ColE1R_ISce; fragment 2)). The remaining fragment of the vector backbone was amplified from pMG-DV using primers CSS_Vector_BB_ScarAR and CSS_ISceIF. Carbenicillin resistance marker was amplified from pMJS_GFP (CSS_Beta-LacF, CSS_Beta_LacR-Spacer). Blasticidin resistance marker was amplified from a G-block (CSS_G-Block Blasticidin) (CSS_BlastF, CSS_Blast_R_SynPolyA). Plasmids were assembled using NEBuilder HiFi DNA Assembly Master Mix (New England Biolabs, #E2621S) following manufacturer’s protocols. The AarI and BbsI restriction sites flanking the lacZα gene contained 4- base pair assembly scars; A-GGAG; B-TACT; C-TTGG; and D-AGGT. A lacZα gene containing BC (CSS_Vec_ScarBR, CSS_ScarB_LacZF, CSS_LacZ_ScarCR, CSS_ScarC_UBCF), or CD (CSS_Vec_ScarCR, CSS_ScarC_LacZF, CSS_LacZ_ScarDR, CSS_ScarD_UBCF) scars was also amplified and used in place of the lacZα “AB” fragment to generate variants. Three pSG-DV vectors designated as pSG-DVAB, pSG-DVBC, or pSG-DVCD were generated.
pMG-DV vector.
pMG-DV (CHO-DV) was assembled using an isothermal assembly reaction from multiple PCR and G-block fragments (primers and G-blocks listed in Supplementary Table 2) (Integrated DNA Technologies, Coralville, IA). A fragment containing the origin of replication and selectable Kanamycin marker was amplified from plasmid pMC.CMV-MCS-EF1a-RFP-SV40pA (#1pMC_fwd, #1 pMC_rev). The lacZα gene product flanked on each side with BbsI followed by AarI restriction sites was synthesized (LacZ Fragment G_block) the with “AD” 4-bp scar combination. The Blasticidin selectable marker fragment was synthesized (Blast(R)_G-Block), while the promoter driving Blasticidin expression was amplified from pSF-CMV-Ub-Blast via PCR (#3 UbcP(a)_fwd, #4 Ubcp(b)-gcg_rev). The fragments were assembled using NEBuilder HiFi DNA Assembly Master Mix (New England Biolabs, #E2621S) following manufacturer’s protocols. A BFP expressing variant of pMG-DV was also generated. The BFP was amplified from pCDSBFP (CSS_BFPswtchBFPF, CSS_BFPswtchBFPR). The vector backbone which includes lacZα flanked on each side with BbsI followed by AarI restriction the with “AD” 4-bp scar combination, Carbenicillin selectable marker, Blasticidin selectable marker, origin of replication and recombination sites was amplified from CHODVRFPSwitch (CSS_BFPswtchCHDVF, CSS_BFPswtchCHDVR). The fragments were assembled using one-pot SapI restriction digestion-ligation reaction from multiple PCR fragments (using 10 U SapI (New England Biolabs, #R0569) and 5 U T4 ligase (Promega, # M1804).
CDS-part plasmids.
Human CDSs were redesigned with silent mutations that eliminated recognition sites for AarI, BbsI, and SapI restriction enzymes. CDSs were synthesized by Twist Bioscience (San Francisco, CA) with (5’- atgcaCACCTGCTACTA-) and (-TATGGGCAGGTGatgca-3’) appended to the 5’ and 3’ ends, respectively, to enable modular cloning. CDSs were cloned into the pCDS vector via a one-pot AarI restriction digestion-ligation reaction (GeneArt™ Type IIs Assembly Kit, Aar I ThermoFisher Scientific, # A15916)24.
pFACS plasmids.
pFACS plasmids were assembled using a one-pot AarI restriction digestion-ligation reaction using a promoter, a GFP gene, and a polyadenylation sequence. The GFP gene was amplified from pMJS2-GFP with flanking AarI and SapI restriction sites with AATG and TGAT overhangs. The promoters and polyadenylation sequences were PCR amplified with oligonucleotides appending 4-base pair scar sites corresponding to A, B, or C and B, C, or D scars respectively for assembly into pSG-DVAB, pSG-DVBC, or pSG-DVCD (primers listed in Supplementary Table 2). pCMV promoter was amplified from pMC.CMV-MCS-EF1a-RFP-SV40p (CSS_CMVF_ScarA, CSS_CMVR_AATG). pSV40 promoter was amplified from pCDNA3.1_Hygro (+) (CSS_SV40promF_ScarB, CSS_SV40promR_AATG). pEF1a promoter was PCR amplified from pMC.CMV-MCS-EF1a-RFP-SV40p (CSS_EF1F_ScarC, CSS_EF1R_AATG). SV40pA polyadenylation signal was PCR amplified from pMC.CMV-MCS-EF1a-RFP-SV40p (CSS_SV40TermAF_tgat, CSS_SV40TermAR_ScarC). bGpA polyadenylation signal was PCR amplified from pCAG-Cre:GFP (CSS_rbglobTermAF_tgat and CSS_rbglobTermAR_ScarB or CSS_rbglobTermAR_ScarD).
Single-gene expression plasmids.
Single-gene expression vectors were built by replacing the fluorophore gene in pFACS plasmids with a CDS from a CDS-part plasmid. For each reaction, a one-pot Golden Gate assembly was performed as previously described24 using 10 U SapI (New England Biolabs, #R0569) and 5 U T4 ligase (Promega, # M1804).
Multi-gene expression plasmids.
Multi-gene plasmids were built by combining single-gene plasmids with flanking ‘AB’, ‘BC’, and ‘CD’ four-base overhangs, respectively, into the pMG-DV vector with ‘AD’ four-base overhangs. Each multi-gene plasmid assembly was performed with a one-pot Golden Gate assembly as previously described24 using 5 U BbsI (New England Biolabs, R0539S) and 5 U T4 Ligase (Promega, # M1804).
Quantification of cis-regulatory elements.
The relative strength of promoter elements used to drive transgene expression was determined using fluorescent reporters in CHO-K1 cells. A promoter characterization vector (pCSSRFP, Fig. 1B) with an invariant RFP expression cassette was used for copy-number normalization. CHO-K1 cells were transfected with 500ng of each construct using DNA-In CHO transfection reagent from MTI-GlobalStem (MTI-GlobalStem, 73781). Cells were seeded at 2 × 10⁵ cells/well in a 24 well plate in 500uL of F12K medium supplemented with 10% FBS. At 24 hours post-seeding, 500 ng of DNA complexed with 7.5 μL DNA-In CHO in 250 μL Opti-MEM I medium (Thermo Fisher Scientific 31985062) was added dropwise to each well. Twenty-four hours post transfection cells were trypsinized and analyzed using flow cytometry. The GFP/RFP signal was determined by plotting a best fit line through all cells gated as GFP+ and RFP+, and the slope of the line was used as the measure of mean promoter strength.
Generation of stable pools.
Plasmids were linearized via MauBI (multi-gene plasmids), SphI, or NdeI (single-gene plasmids) digestion and desalted with the Zymogen DNA Clean and Concentrator 5 kit (multi-gene plasmds) or the Qiaex II gel extraction kit (single-gene plasmids) prior to transfection into CHO-2C10. Linearized plasmids were introduced to the cells using DNA-In® CHO transfection reagent. One day prior to transfection, cells were seeded in 6-well plates at 1.6 × 10⁵ cells/well in 3 mL of F12K medium, supplemented with 10% FBS. At 24h post-seeding, 2.5 μg of DNA complexed with 7.5 μL DNA-In® CHO in 250 μL Opti-MEM I medium was added dropwise to each well following a 15-minute incubation at room temperature. Medium was removed from the cells 24 hours post-transfection and replaced with 3 mL of fresh F12K supplemented with 10% FBS.
At 72 hours post-transfection, cells were transferred to 75 cm2 tissue culture flasks and plated in F12K medium supplemented with 10% FBS and 12 μg/mL blasticidin. Blasticidin-containing medium was replaced every 3 days until cells became confluent. Next, cells were expanded in F12K medium with 5% FBS and 12 μg/mL blasticidin, at a 1:6 ratio every 3 days until five 175 cm2 tissue culture flasks per condition were obtained.
Targeted integration of multi-gene cassettes.
Site-specific integration of a multi-gene cassette into the genome of CHO-2C10 was achieved via dual recombinase mediated cassette exchange (RMCE)23. The genomic landing pad has the organization: pCMV-Lox511-IgG-miniFRT-IRES-dGFP-LoxP. Multi-gene plasmids containing minimal FRT and LoxP sites were co-transfected at a 1:4 ratio with recombinase-encoding plasmid, pCRE2aFLP. pCRE2aFLP codes for flippase (Flpe) linked to CRE recombinase via a Theoseaasigna virus (T2A) linker26 and was provided courtesy of Dr. Yuri Voziyanov.
Following transfection BFP-positive cells were sorted using fluorescence activated cell sorting (FACS) and isolated as clonal populations via limiting dilution. Clones were screened for correct integration of the glycosylation cassette in the landing pad via PCR, see Supplementary Fig. S2.
Cell growth and IgG production.
Cells in T-175 flasks reached confluency at 3 days. At this point, they were washed twice with PBS and cultured overnight in 25 mL serum-free medium (Ex-Cell CHO DHFR-; Sigma-Aldrich, C8862) supplemented with 2.5 mM L-Glutamine and 3.5 mL/L phenol red. The following day, media was replaced with 40 mL fresh serum-free medium. After 3 days, the cell supernatant was collected and 40 mL of fresh media was added to cells. This was then repeated with supernatant harvested at 3, 6, and 9 days post wash. Collected supernatant was filtered through a 0.22 μm filter and stored at −20°C.
Reverse-transcriptase – polymerase chain reaction.
When seeding T-175 flasks, additional cells were collected for RNA analysis. RNA was extracted using the Qiagen RNeasy kit with DNAse treatment performed in-solution (10X Turbo™ DNase buffer; Invitrogen, AM2238). Complimentary DNA (cDNA) was then synthesized using the Invitrogen SuperScript™ III First-Strand Synthesis Supermix with random hexamer priming (Invitrogen, 11752050). With cDNA, 35 cycles of PCR were performed, and the resulting product visualized with a 1% agarose DNA gel containing SYBR Safe DNA Gel Stain (Invitrogen S33102) and UV light.
Determination of IgG concentration using Enzyme-linked Immunosorbant Assay.
IgG concentration was determined using an ELISA assay in 96-well plate format as described previously23.
Purification of IgG and cleavage of N-Glycans.
Filtered supernatants collected from days 3 and 6 were immobilized Protein A column (GE, rProtein A Sepharose Fast Flow antibody purification resin 17127901) and eluted with 100mM Glycine, pH 3.0. Eluate was then pH adjusted to 8.0 with 1 M Tris-HCl (pH 9.0) before buffer exchange into 20 mM sodium phosphate buffer, pH 7.4. Next, 200 μg IgG was digested with PNGase-F (NEB P0705). Cleaved N-Glycans were purified by an ethanol precipitation of protein and subsequently lyophilized prior to analysis.
N-Glycan analysis via liquid chromatography (LC).
Lyophilized N-glycans were reconstituted in 2-amino benzamide labeling solution (Prozyme) and incubated at 65 °C for 3 hours. After labeling, samples were analyzed on a Waters UPLC (H-class Bio System) equipped with a BEH-amide UPLC column (Waters, Milford, USA) and a fluorescence detector (Ex: 330 nm, Em: 420 nm). Mobile phase A was 100 mM ammonium formate (pH 4.5) and mobile phase B was acetonitrile. N-glycan separation was performed using a linear gradient from 75% B to 54% B in 40 minutes at 0.4 mL/min.
Statistical analysis.
Comparison of multi-class glycan profiles was performed using a modified χ2-test. Specifically, a custom conversion factor for comparing χ2-values to p-values was needed to account for the fact that glycan profile data was recorded as a percentage and not a count value. Briefly, nine independent replicates of the starting cell line, CHO-2C10 were compared in all pairwise combinations using the same test and χ2-values were plotted to fit a standard Probability Distribution Function for a 2-degrees of freedom analysis. This fit produced a scaling factor that was used to determine p-values for all χ2–tests. More detailed descriptions of the statistical methods are present in the Supplementary Note 1.
Model refinement.
The kinetic model is based on an assembly of four stirred tank reactors connected in series, with seven types of enzymes and four Golgi nucleotide sugar concentrations. The enzyme kinetics and nucleotide sugar concentrations starting parameter values for this model have been described previously12. Each compartment of the Golgi was considered to have a different enzyme composition, but for simplicity this distribution was held fixed and only the total enzyme amount was adjusted during parameter estimation. The transport of the nucleotide sugars was neglected, and were instead represented by a static pool in the Golgi compartment. Transport or other precursor supply limitation is thus modeled through a decreased Golgi concentration of nucleotide sugars. Additionally, retrograde transport was not considered as a part of this model, proteins flow only downstream. For parameter estimation, the relative concentration of these 11 components were used as the unknown parameters. The starting values for these parameters were allowed to vary between 0.01 and 100 times their original values.
Nonlinear regression was performed to fit the model to the baseline glycan profile of CHO-2C10 using the output of the final reactor in the model as the point of comparison. The Nelder-Mead simplex method was used to obtain the initial fit27. Due to the non-convexity of the model and the local nature of the optimization method, the optimization was performed multiple times from different starting points to obtain different fit sets of parameters. To reduce computation time of the optimization, initial points were selected as the lowest sum of squared residuals (SSR) starting points from a Latin hypercube sampling as implemented in MATLAB of 20,000 parameters sets where each of the 11 parameters varied between 0.01 and 100. Single gene results were used to further refine the model. This refinement was achieved by simulating single gene overexpression for each identified parameter set for CHO-2C10. The SSR for each parameter set as a function of single gene overexpression was computed against each experiment. All modeling and parameter estimation were performed in MATLAB.
Supplementary Material
ACKNOWLEDGEMENTS
We thank Thu Phan for help in setting up our high-throughput protein purification system. We thank Professor Yuri Voziyanov for the Flp-2A-Cre recombinase vector and his advice on its use. We thank Noelle Schumaker for help in execution of various experiments involved in generation of this manuscript. Computational resources were provided by the Minnesota Supercomputing Institute.
FUNDING SOURCES
C.S.S. and M.G.M. are supported in part by a grant from the University of Minnesota Office of the Vice President of Research. M.G.M. is supported in part by the NIGMS Biotechnology Training Program (T32GM008347-22). M.J.S. is supported by The Defense Advanced Research Projects Agency (grant number D17AP00028). The views, opinions, and/or findings contained in this article are those of the author and should not be interpreted as representing the official views or policies, either expressed or implied, of the Defense Advanced Research Projects Agency or the Department of Defense.
Footnotes
Publisher's Disclaimer: This document is the unedited Author’s version of a Submitted Work that was subsequently accepted for publication in ACS Synethetic Biology, copyright © American Chemical Society after peer review. To access the final edited and published work see https://pubs.acs.org/articlesonrequest/AOR-jWmQ9X6GquqpKmwJFF9v
CONFLICT OF INTEREST
The authors declare no competing financial interest.
SUPPORTING INFORMATION
Glycoengineering SI contains Supplementary Note 1: Statistical Analysis, Figures S1–S11, Supplementary Tables 1 – 3.
Supplementary Datafile 1 contains parts-level description, complete sequence information, and characterization data for all constructs generated as part of this study. The .xlsx file is organized into four worksheets, titled ‘Parts’, ‘Single Gene Constructs’, ‘Three Gene Constructs’, and ‘Glycan Profile.’
REFERENCES
- 1.Walsh G Biopharmaceutical benchmarks 2014. Nat. Biotechnol 32, 992 (2014). [DOI] [PubMed] [Google Scholar]
- 2.Browne SM & Al-Rubeai M Selection methods for high-producing mammalian cell lines. Trends Biotechnol. 25, 425–432 (2007). [DOI] [PubMed] [Google Scholar]
- 3.Wells E & Robinson AS Cellular engineering for therapeutic protein production: product quality, host modification, and process improvement. Biotechnol. J 12, (2017). [DOI] [PubMed] [Google Scholar]
- 4.Kornfeld R Assembly of Asparagine-Linked Oligosaccharides. Annu. Rev. Biochem 54, 631–664 (2002). [DOI] [PubMed] [Google Scholar]
- 5.Helenius A & Aebi M Roles of N-Linked Glycans in the Endoplasmic Reticulum. Annu. Rev. Biochem 73, 1019–1049 (2004). [DOI] [PubMed] [Google Scholar]
- 6.Dwek RA Biological importance of glycosylation. Dev. Biol. Stand 96, 43–47 (1998). [PubMed] [Google Scholar]
- 7.Wright A & Morrison SL Effect of C2-associated carbohydrate structure on Ig effector function: studies with chimeric mouse-human IgG1 antibodies in glycosylation mutants of Chinese hamster ovary cells. J Immunol 160, 3393–3402 (1998). [PubMed] [Google Scholar]
- 8.Boyd PN, Lines AC & Patel AK The effect of the removal of sialic acid, galactose and total carbohydrate on the functional activity of Campath-1H. Mol. Immunol 32, 1311–1318 (1995). [DOI] [PubMed] [Google Scholar]
- 9.Hodoniczky J, Yuan ZZ & James DC Control of recombinant monoclonal antibody effector functions by Fc N-glycan remodeling in vitro. Biotechnol. Prog 21, 1644–1652 (2005). [DOI] [PubMed] [Google Scholar]
- 10.Raju TS Terminal sugars of Fc glycans influence antibody effector functions of IgGs. Curr. Opin. Immunol 20, 471–478 (2008). [DOI] [PubMed] [Google Scholar]
- 11.Kaneko Y, Nimmerjahn F & Ravetch JV Anti-inflammatory activity of immunoglobulin G resulting from Fc sialylation. Science 313, 670–673 (2006). [DOI] [PubMed] [Google Scholar]
- 12.Hossler P, Mulukutla BC & Hu WS Systems analysis of N-glycan processing in mammalian cells. PLoS One 2, (2007). [DOI] [PMC free article] [PubMed] [Google Scholar]
- 13.Jimenez del Val I, Nagy JM & Kontoravdi C A dynamic mathematical model for monoclonal antibody N-linked glycosylation and nucleotide sugar donor transport within a maturing Golgi apparatus. Biotechnol. Prog 27, 1730–1743 (2011). [DOI] [PubMed] [Google Scholar]
- 14.Krambeck FJ & Betenbaugh MJ A mathematical model of N-linked glycosylation. Biotechnol. Bioeng 92, 711–728 (2005). [DOI] [PubMed] [Google Scholar]
- 15.Clausen H, Wandall H, Catharina C, Stanley P & Schnaar R Glycosylation Engineering. Essent. Glycobol 3, (2017). [Google Scholar]
- 16.Shinkawa T et al. The Absence of Fucose but Not the Presence of Galactose or Bisecting N -Acetylglucosamine of Human IgG1 Complex-type Oligosaccharides Shows the Critical Role of Enhancing Antibody-dependent Cellular Cytotoxicity J. Biol. Chem 278, 3466–3473 (2003). [DOI] [PubMed] [Google Scholar]
- 17.Ripka J & Stanley P Lectin-Resistant CHO Cells: Selection of Four New Pea Lectin-Resistant Phenotypes. Somatic Cell Mol. Gen 12, 51–62 (1986). [DOI] [PubMed] [Google Scholar]
- 18.Shields RL et al. Lack of Fucose on Human IgG1 N -Linked Oligosaccharide Improves Binding to Human FcγRIII and Antibody-dependent Cellular Toxicity. J. Biol. Chem 277, 26733–26740 (2002). [DOI] [PubMed] [Google Scholar]
- 19.Yamane-ohnuki N, Kinoshita S & Inoue-urakubo M Establishment of FUT8 Knockout Chinese Hamster Ovary Cells: An Ideal Host Cell Line for Producing Completely Defucosylated Antibodies With Enhanced Antibody-Dependent Cellular Cytotoxicity. Biotechnol. Bioeng 8, (2004). [DOI] [PubMed] [Google Scholar]
- 20.Malphettes L et al. Highly Efficient Deletion of FUT8 in CHO Cell Lines Using Zinc-Finger Nucleases Yields Cells That Produce Completely Nonfucosylated Antibodies. Biotechnol. Bioeng 106, 774–783 (2010). [DOI] [PubMed] [Google Scholar]
- 21.Imai-nishiya H et al. Double knockdown of α1,6-fucosyltransferase (FUT8) and GDP-mannose 4,6-dehydratase (GMD) in antibody-producing cells: a new strategy for generating fully non-fucosylated therapeutic antibodies with enhanced ADCC. BMC Biotechnol. 13, 1–13 (2007). [DOI] [PMC free article] [PubMed] [Google Scholar]
- 22.Jeong YT et al. Enhanced sialylation of recombinant erythropoietin in CHO cells by human glycosyltransferase expression. J. Microbiol. Biotechnol (2008). doi: 10.4014/jmb.0800.546 [DOI] [PubMed] [Google Scholar]
- 23.O’Brien SA et al. Single Copy Transgene Integration in a Transcriptionally Active Site for Recombinant Protein Synthesis. Biotechnol. J 13, (2018). [DOI] [PMC free article] [PubMed] [Google Scholar]
- 24.Hsu SY & Smanski MJ in Methods in Molecular Biology 1671, 131–147 (2018). [DOI] [PubMed] [Google Scholar]
- 25.Gibson DG et al. Complete chemical synthesis, assembly, and cloning of a Mycoplasma genitalium genome. Science 319, 1215–1220 (2008). [DOI] [PubMed] [Google Scholar]
- 26.Kim JH et al. High cleavage efficiency of a 2A peptide derived from porcine teschovirus-1 in human cell lines, zebrafish and mice. PLoS One 6, (2011). [DOI] [PMC free article] [PubMed] [Google Scholar]
- 27.Lagarias JC, Reeds JA, Wright MH & Wright PE Convergence Properties of the Nelder--Mead Simplex Method in Low Dimensions. SIAM J. Optim 9, 112–147 (1998). [Google Scholar]
- 28.Smanski MJ et al. Functional optimization of gene clusters by combinatorial design and assembly. Nat. Biotechnol 32, 1241–1249 (2014). [DOI] [PubMed] [Google Scholar]
- 29.Szymczak AL et al. Correction of multi-gene deficiency in vivo using a single’self-cleaving’2A peptide–based retroviral vector. Nat. Biotechnol 22, 589–594 (2004). [DOI] [PubMed] [Google Scholar]
- 30.Bigge JC et al. Nonselective and efficient fluorescent labeling of glycans using 2-amino benzamide and anthranilic acid. Anal. Biochem 230, 229–238 (1995). [DOI] [PubMed] [Google Scholar]
- 31.Hossler P, Goh LT, Lee MM & Hu WS GlycoVis: Visualizing glycan distribution in the protein N-glycosylation pathway in mammalian cells. Biotechnol. Bioeng 95, 946–960 (2006). [DOI] [PubMed] [Google Scholar]
- 32.Qasba PK, Ramakrishnan B & Boeggeman E Structure and Function of β−1,4-Galactosyltransferase. Curr. Drug Targets 9, 292–309 (2008). [DOI] [PMC free article] [PubMed] [Google Scholar]
- 33.Nelder JA & Mead R A Simplex Method for Function Minimization. Comput. J 7, 308–313 (1965). [Google Scholar]
- 34.Keusch J, Lydyard PM & Delves PJ The effect on IgG glycosylation of altering β1,4-galactosyltransferase-1 activity in B cells. Glycobiology 8, 1215–1220 (1998). [DOI] [PubMed] [Google Scholar]
- 35.Yang Z et al. Engineered CHO cells for production of diverse, homogeneous glycoproteins. Nat. Biotechnol 33, 842–844 (2015). [DOI] [PubMed] [Google Scholar]
- 36.Dekkers G et al. Multi-level glyco-engineering techniques to generate IgG with defined Fc-glycans. Sci. Rep 6, (2016). [DOI] [PMC free article] [PubMed] [Google Scholar]
- 37.Bydlinski N et al. The contributions of individual galactosyltransferases to protein specific N- glycan processing in Chinese Hamster Ovary cells. J. Biotechnol 282, 101–110 (2018). [DOI] [PubMed] [Google Scholar]
- 38.Kauffman S The Origins of Order. (Oxford University Press, 1993). [Google Scholar]
- 39.Heinsch SC, Das SR & Smanski MJ Simulation Modeling to Compare Optimization Strategies for Metabolic Engineering. Front. Microbiol 9, 1–8 (2018). [DOI] [PMC free article] [PubMed] [Google Scholar]
- 40.Muraoka M, Kawakita M & Ishida N Molecular characterization of human UDP-glucuronic acid / UDP-N-acetylgalactosamine transporter, a novel nucleotide sugar transporter with dual substrate specicity. FEBS Lett. 495, 87–93 (2001). [DOI] [PubMed] [Google Scholar]
- 41.Wong NSC, Yap MGS & Wang DIC Enhancing recombinant glycoprotein sialylation through CMP-sialic acid transporter over expression in Chinese hamster ovary cells. Biotechnol. Bioeng (2006). doi: 10.1002/bit.20815 [DOI] [PubMed] [Google Scholar]
- 42.Yin B et al. Glycoengineering of Chinese hamster ovary cells for enhanced erythropoietin N-glycan branching and sialylation. Biotechnol. Bioeng (2015). doi: 10.1002/bit.25650 [DOI] [PubMed] [Google Scholar]
- 43.Sumit M et al. Dissecting N-Glycosylation Dynamics in Chinese Hamster Ovary Cells Fed-batch Cultures using Time Course Omics Analyses Dissecting N-Glycosylation Dynamics in Chinese Hamster Ovary Cells Fed-batch Cultures using Time Course Omics Analyses. iScience 12, 102–120 (2019). [DOI] [PMC free article] [PubMed] [Google Scholar]
- 44.Kochanowski N, Blanchard F, Cacan R & Chirat F Intracellular nucleotide and nucleotide sugar contents of cultured CHO cells determined by a fast, sensitive, and high-resolution. Anal. Biochem 348, 243–251 (2006). [DOI] [PubMed] [Google Scholar]
- 45.Song Z Roles of the nucleotide sugar transporters (SLC35 family) in health and disease. Mol. Aspects Med 34, 590–600 (2013). [DOI] [PubMed] [Google Scholar]
- 46.Hadley B et al. Structure and function of nucleotide sugar transporters: Current progress. Comput. Struct. Biotechnol. J 10, 23–32 (2014). [DOI] [PMC free article] [PubMed] [Google Scholar]
- 47.Yu X et al. Engineering Hydrophobic Protein − Carbohydrate Interactions to Fine-Tune Monoclonal Antibodies. J. Am. Chem. Soc 135, 9723–9732 (2013). [DOI] [PMC free article] [PubMed] [Google Scholar]
- 48.Guye P, Li Y, Wroblewska L, Duportet X & Weiss R Rapid, modular and reliable construction of complex mammalian gene circuits. Nucleic Acids Res. 41, 3–8 (2013). [DOI] [PMC free article] [PubMed] [Google Scholar]
- 49.Jones AC et al. Phage P1-Derived Artificial Chromosomes Facilitate Heterologous Expression of the FK506 Gene Cluster. PLoS ONE 8, (2013) 10.1371/journal.pone.0069319. [DOI] [PMC free article] [PubMed] [Google Scholar]
Associated Data
This section collects any data citations, data availability statements, or supplementary materials included in this article.