

ABSTRACT
Background
Indoor dampness has consistently been associated with respiratory symptoms and exacerbations. The causal mechanisms may involve increased microbial exposures. However, the evidence regarding the influence of indoor microbial exposures under damp- and non-damp conditions on the risk of asthma and allergy has been inconclusive.
Objective
The aim of this study was to investigate the association between dampness and microbial exposure with allergy and respiratory health in Danish adults using a cross-sectional design.
Methods
From 1,866 participants of the Health2006 cohort, we selected three non-overlapping groups: 196 at random, 107 with confirmed atopy, and 99 without atopy. Bedroom dust was sampled using electrostatic dust fall collectors and analysed for endotoxin, β-(1,3)-D-glucan, 19 microbial species or groups, and total fungal load. Household moisture-related problems and asthma were self-reported by questionnaire. Atopy was determined by skin-prick-testing and lung function was measured by spirometry.
Results
Household moisture damage was positively associated with asthma outcomes, although this was statistically significant only in atopics for self-reported asthma (odds ratio (OR) 3.52; 95%CI 1.01–12.7). Mould odor was positively associated with wheezing (OR 6.05; 95%CI 1.19–30.7) in atopics. Inconsistent associations were found for individual microbial exposures and health outcomes. Inverse associations were observed between microbial diversity and rhinitis in the random sample and both doctor-diagnosed and self-reported asthma in non-atopics.
Conclusions
In conclusion, our findings suggest that household moisture damage may increase the risk of asthma and wheeze with mould odor in atopics. In addition, asthma and allergy may be affected by the indoor microbial composition in urban domestic environments. Further studies are needed to identify and understand the causal agents and underlying mechanisms behind the potential effects of environmental microbial exposure on human health.
KEYWORDS: Moisture and mould, household microbial exposure, endotoxin, house dust, respiratory health, allergy, asthma
Introduction
The prevalence of household dampness in European dwellings has been estimated to be around 15% [1] and reports for Danish residences have estimated the prevalence of self-reported dampness problems to be: 11% (1995); 8% (1997); 9% (1999); 11% (2000) [2]. Indoor dampness has consistently been associated with respiratory symptoms and exacerbations, and there is some evidence for association with new-onset asthma and allergies [3–7] and a stronger negative health effect of household dampness in atopics [1]. The causal mechanisms may involve increased microbial exposures, but the evidence is inconclusive.
To date, most epidemiological studies have been limited to assessing health effects associated with exposure to microbial components, especially endotoxin, and culturable moulds [8]. The results have been inconsistent, suggesting protective, detrimental, and no health effects in relation to asthma and allergy [8]. However, comparisons between studies have been hampered by the lack of standardization and validation of methods for measuring indoor microbial exposure. Recently, the use of molecular techniques such as quantitative polymerase chain reaction (qPCR) to identify specific viable and non-viable bacterial and fungal agents to assess indoor exposure has become more common. Although some associations between single microbial markers and asthma outcomes have been demonstrated, there are only a few studies using qPCR and these have largely focused on respiratory health effects in children [9–13]. Nonetheless, due to the high sensitivity and reproducibility of qPCR, this method has been recommended for epidemiological investigations to assess the role of individual species or genera in the development and expression in respiratory and allergic diseases [14–17].
Besides focusing on individual microorganisms, there is also an interest in the potential effect of quantity and diversity of microbial exposure on respiratory health. Greater diversity of fungal and bacterial agents has been shown to reduce the risk of asthma in children living on farms [18]. Similarly, one study found an inverse association between total fungal DNA and wheeze and nighttime cough in Spanish school children [19]. In contrast, another study found a positive association between elevated levels of total viable mould and risk of rhinitis and night cough and persistent cough [12], whereas others found no associations between total fungal DNA and respiratory health outcomes [11]. These studies highlight the need to study both the potential effect of individual microbial exposures and quantity and diversity of these exposures. Therefore, the aim of our study was to evaluate the prevalence of dampness and microbial exposure in urban homes and assess their association with allergy and respiratory health in adult residents. We also assessed whether health effects associated with dampness and microbial exposure were different for atopics and non-atopics as atopics may be more susceptible.
Material and methods
Study design and study population
This was a cross-sectional study nested within the Health2006 cohort. The baseline Health2006 cohort was randomly drawn from the urban background population aged 18–69 years, living in 11 municipalities in the south-west of suburban Copenhagen [20]. A total of 3,471 individuals (45%) entered the study and underwent health examination at the Research Centre for Prevention and Health (Glostrup University Hospital, Copenhagen) between 2006 and 2008. In 2011–2012, the baseline Health2006 cohort was invited for a 5-year follow-up examination following essentially the same study protocol [21]. A total of 3,405 were eligible for a follow-up invitation and of these, 2,308 (69%) were reexamined between November 2011 and November 2012. Of those, 1,866 participants completed questionnaires on their home indoor environment and consented to collection of settled dust from their bedroom. For this study, we selected three distinct groups. We extracted a random sample of 196 participants reflecting the 5-year follow-up population of the Health2006 cohort. For investigation of potential different reactions related to atopic status, we added two groups in the age-range 30 to 50 years; a random group of 107 participants with atopy (described below) and a group of 99 non-atopic participants. The design and selection of participants is illustrated in Figure 1. The study was approved by the Ethical Committee of the Capital Region of Denmark (H-3-2011-080) and by the Danish Data Protection Agency (2006-53-1283). Participants had received written, oral and video information about the project and provided written consent prior to participation.
Figure 1.
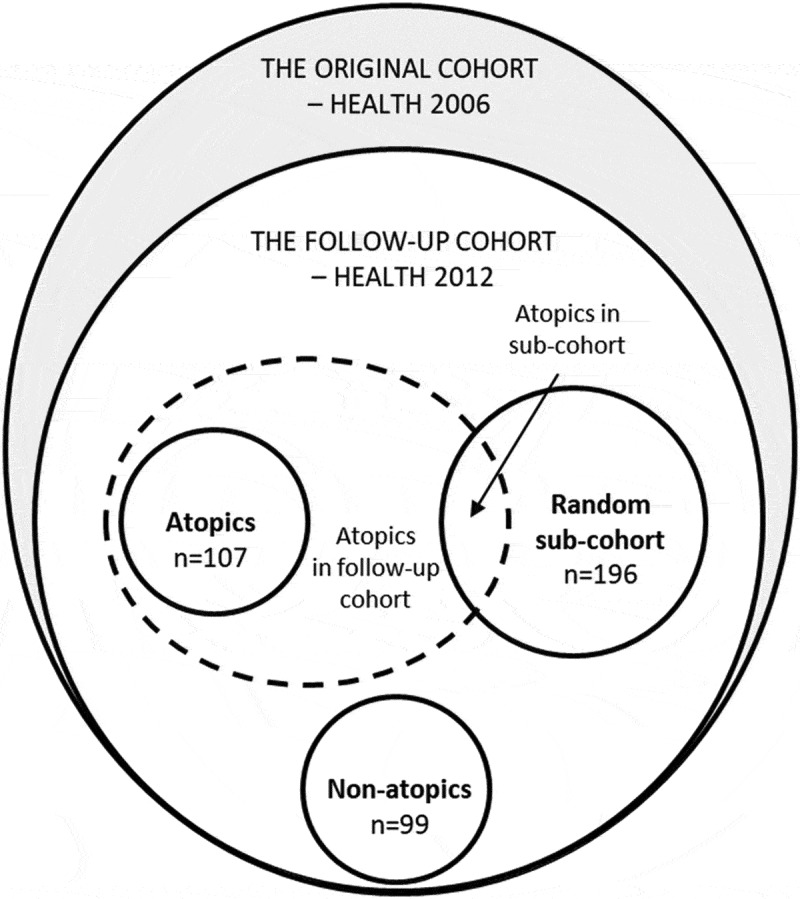
Study design and selection of participants.
Exposure assessment
Household dampness and other indoor environment characteristics
Dampness was determined based on self-reports to yes/no-questions of four dampness indicators: (1) Have you noticed any damp stains on surfaces, i.e. floor, walls or ceiling in your bedroom? (damp stains in bedroom); (2) Is there any odor of moisture or mould in your home? (mould odor); (3) Is there any condensation on the inside of your windows? (condensation on windows); and (4) Have you ever had moisture damage in your home? (moisture damage). Additionally, participants reported the following information: hours spend in the home during one weekday, type of dwelling (apartment, detached house, attached house, other type of dwelling), crowding (occupants per square meter), pet keeping (yes/no), and smoking (daily, occasionally, ex-smoker, never smoker).
Dust sampling, extraction and analysis
Detailed information on dust sampling, extraction and analysis is provided in the supplementary information. Briefly, settled house dust was collected by participants using an electrostatic dust fall collector (EDC) (Zeeman, Utrecht, the Netherlands) placed 1.5 m above the floor in the participant’s bedroom during a 14-day period [22]. The EDC was returned in an envelope to Aarhus University and no later than 1 day after receipt, electrostatic cloths were stored at −20°C until undergoing extraction for dust and bio-aerosols in a sterile liquid solution as described by Noss et al. [22].
Two microbial components, endotoxin and β-(1,3)-D-glucan, were quantified using the Limulus Amebocyte Lysate (LAL) assay. The detection limits (LOD) were 9.6 EU/m2 for endotoxin and 366 µg/m2 for β-(1,3)-D-glucan. Among samples, 13% were below detection limit for endotoxin and 10% for β-(1,3)-D-glucan. These samples were assigned half of the LOD value [23]. Data were presented as loads equivalent to endotoxin units (EU) per m2 (EU/m2) and β-(1,3)-D-glucan in µg per m2 (µg/m2).
qPCR assays were prepared using SYBR Green Master Mix (Bio-Rad Laboratories Inc., California, USA). DNA from the following microorganisms was detected using primers for (1) one group of bacteria (Streptomyces spp.), (2) 15 fungal species (Acremonium strictum, Alternaria alternata, Aspergillus fumigatus, Aspergillus versicolor, Aspergillus niger, Chaetomium globosum, Cladosporium cladosporioides, Cladosporium herbarum, Cladosporium sphaerospermum, Penicillium chrysogenum, Rhizopus stolonifer, Stachybotrys chartarum/chlorohalonata, Trichoderma viride, Ulocladium chartarum, Wallemia sebi), (3) three fungal groups (Mucor/Rhizopus spp., Aspergillus glaucus spp., Penicillium/Aspergillus/-Paecilomyces variotiii spp.), and (4) one universal fungal primer for the total fungal load. Standard curves were produced for respective analysis based on total genomic DNA extracts from pure cultures and were quantified using limiting dilution analysis [24]. Microorganisms were calculated at cell level, expressing results as cell equivalents (CE) per m2 (CE/m2) referring to the number of spores per m2.
Outcome assessment
Atopy and allergy
Skin-prick-testing (SPT) to a standard panel of 10 aeroallergens was performed by a trained nurse using the Soluprick SQ system (ALK Abelló A/S, Hørsholm, Denmark) and included the allergen extracts: (1) pollen: birch (Betula verrucosa), grass (Phleum pratense) and mugwort (Artemisia vulgaris); (2) pets: cat (Felis domesticus), dog (Canis familiaris), and horse (Equus caballus); (3) two house dust mites (dermatophagoides pteronyssinus and Dermatophagoides farina); and (4) two moulds (Cladosporium herbarum and Alternaria alternata). Histamine chloride was used as positive control and saline as negative control. Atopy was defined by having a positive test (mean wheal of 3 mm or more after subtraction of the negative control) to at least 1 of the 10 allergens. Participants were asked to abstain from use of antihistamines 3 days before the test. Allergic conditions (eczema and rhinitis) were identified by self-reported doctor diagnosis: Has a doctor ever told you that you have eczema? and Has a doctor ever told you that you have rhinitis?
Asthma
Asthma was determined by a positive response to each of the following four yes/no-questions: (1) Has a doctor ever told you that you have asthma? (doctor-diagnosed asthma); (2) Have you ever had asthma? (self-reported asthma); (3) Do you currently use asthma medication? (asthma medication use); and (4) Have you had wheezing or whistling in your chest at any time? (wheeze, the last 12 months) [25].
Lung function
Lung function was measured by spirometry according to American Thoracic Society/European Respiratory Society (ATS/ERS) guidelines [26] using Spiro USB Spirometers (MicroMedical Limited, Rochester, Kent, UK) [25]. Spirometers were checked daily with a 3-l calibrated syringe, and checked every 6 months with a decompression flow simulator [27]. Lung function data were obtained for 99% of the participants. Information on participant’s sex, age, height, forced expiratory volume in first second (FEV1) and forced volume capacity (FVC) were applied to calculate z-scores of FEV1, FVC and the FEV1/FVC-ratio based on the Global Lung Function Initiative (GLI) spirometry equations [28].
Statistical analyses
Initial analyses described basic-, indoor environmental-, and health characteristics. Chi-squared tests and t-tests were used to assess differences between atopic and non-atopic participants. Microbial loads (per m2 of sampling area) followed a lognormal distribution and were presented as geometric means (GM) with geometric standard deviations (GSD). Differences in microbial exposure between bedrooms of atopics, non-atopics and the random sample were assessed by t-tests.
Multiple logistic regression analyses were conducted to assess associations between dampness indicators and microbial exposures and allergy and asthma outcomes. Multiple linear regression analyses were used to assess associations with lung function. In addition to specific microbial markers, we also measured associations with the total fungal load and microbial diversity calculated as the number of different detected fungi (excluding the fungal group of Penicillium/Aspergillus/Paecilomyces varioti spp.) and Streptomyces spp. (range, n = 1–18). All regression analyses were adjusted for sex, age, smoking, hours spent in the home, season, and additionally in sensitivity analyses for crowding (occupants per m2), type of dwelling, indoor area (m2), and pet keeping. Confounders were chosen a priori on the basis of previous evidence or posteriori due to differences in their association with selected groups. Multivariate results are presented as odds ratios (OR) for airway symptoms, doctor-diagnosed asthma, and allergy and as β-coefficients for lung function parameters, both with 95% confidence intervals (95% CI). The ORs and β-coefficients represent the estimated health effect expressed as the change associated with an increase in unit of load of microbial exposures, total fungal load, diversity or presence versus absence of dampness indicators. A significance level of p < 0.05 was applied. Statistical analyses were conducted using Stata version 13 (StataCorp LP, College Station, Texas, USA).
Results
Characteristics of the study population
Significant differences in characteristics between the study groups were found (Table 1). The atopic and non-atopic groups differed from the random sample on several characteristics: they were younger (due to the age-based selection), spent less time at home, had a larger living area, had more co-habitants, were more likely to keep pets, and were more likely to report condensation on windows. Generally, the atopic and non-atopic groups were similar in characteristics, but the atopic group was significantly more likely to report presence of condensation on windows and live in smaller homes. Sensitization against pollen allergens was most prevalent followed by pet- and house dust mite allergens (Table 2). Atopics were significantly more likely to report rhinitis, eczema, doctor-diagnosed asthma, self-reported asthma, and wheezing compared to non-atopics and to the random sample. Lung function was lower in atopic participants than in the random sample and non-atopic group, when taking into account age, sex, height and ethnicity shown in the z-scores.
Table 1.
Characteristics of the study population.
| Random sample |
Atopics |
Non-atopics |
|||||
|---|---|---|---|---|---|---|---|
| n | (%) | n | (%) | n | (%) | p-value | |
| Basic characteristics | |||||||
| Number of participants | 196 | (100) | 107 | (100) | 99 | (100) | - |
| Sex | |||||||
| Male | 94 | (48) | 42 | (40) | 42 | (42) | 0.64a |
| Female | 102 | (52) | 65 | (60) | 57 | (58) | |
| Age (year), mean (SD) | 54 | (12.6) | 42 | (5.19) | 44 | (5.47) | 0.21b |
| 20-29 years | 7 | (4) | 0 | (0) | 0 | (0) | |
| 30-39 years | 18 | (9) | 32 | (30) | 26 | (26) | |
| 40-49 years | 49 | (25) | 75 | (70) | 73 | (74) | |
| 50-59 years | 43 | (22) | 0 | (0) | 0 | (0) | |
| 60-69 years | 59 | (30) | 0 | (0) | 0 | (0) | |
| >70 years | 20 | (10) | 0 | (0) | 0 | (0) | |
| Home characteristics | |||||||
| Hours spend in the home, mean (SD) | 14.6 | (4.7) | 12,8 | (3.2) | 13,1 | (2.9) | 0.59b |
| Type of dwelling | |||||||
| Apartment | 49 | (25) | 26 | (24) | 22 | (22) | 0.35a |
| Detached house | 107 | (55) | 62 | (58) | 61 | (62) | |
| Attached house/Rowhouse | 39 | (19) | 18 | (17) | 15 | (15) | |
| Other type of dwelling | 1 | (1) | 1 | (1) | 1 | (1) | |
| Indoor area (m2) | 126 | (45.8) | 122 | (39.3) | 137 | (61.5) | 0.04b |
| <70 m2 | 15 | (8) | 10 | (10) | 6 | (6) | 0.68a |
| 70-110 m2 | 68 | (35) | 30 | (28) | 29 | (30) | |
| >110 m2 | 113 | (57) | 68 | (62) | 64 | (64) | |
| Number of occupants | 2,3 | (1.01) | 3,3 | (1.25) | 3,3 | (1.18) | 0.84b |
| 1 | 31 | (16) | 12 | (11) | 10 | (10) | 0.40a |
| 2 | 114 | (58) | 18 | (18) | 14 | (14) | |
| 3 | 20 | (10) | 16 | (15) | 24 | (25) | |
| 4 | 24 | (12) | 47 | (44) | 37 | (38) | |
| ≥5 | 7 | (4) | 14 | (12) | 13 | (13) | |
| Crowding, mean (SD) | 0.02 | (0.01) | 0,03 | (0.01) | 0,03 | (0.01) | 0.30b |
| Pet keeping (yes) | 62 | (32) | 48 | (45) | 55 | (56) | 0.12a |
| Smoking, current (yes) | 18 | (9) | 17 | (16) | 16 | (16) | 0.95a |
| Daily | 13 | (7) | 12 | (11) | 10 | (10) | 0.30a |
| Occasionally | 5 | (3) | 5 | (5) | 6 | (6) | |
| Ex-smoker | 51 | (26) | 32 | (30) | 41 | (41) | |
| Never smoker | 126 | (64) | 58 | (55) | 42 | (42) | |
| Dampness indicators | |||||||
| Damp stains in bedroom (yes) | 12 | (6) | 12 | (12) | 8 | (8) | 0.45a |
| Mould odor (yes) | 5 | (3) | 9 | (8) | 2 | (2) | 0.38a |
| Condensation on windows (yes) | 48 | (25) | 43 | (40) | 34 | (34) | 0.04a |
| Moisture damage, ever (yes) | 47 | (27) | 23 | (25) | 27 | (29) | 0.85a |
Definition of abbreviations: n denotes number, SD denotes standard deviation. Statistical significance between atopics and non-atopics is denoted by a p-value <0.05.
aChi2-test.
bt-test.
Table 2.
Allergy, asthma and lung function in the random sample, atopics and non-atopics.
| Random sample |
Atopics |
Non-atopics |
|||||
|---|---|---|---|---|---|---|---|
| N = 196 |
N = 107 |
N = 99 |
|||||
| n | (%) | n | (%) | n | (%) | p-value | |
| Allergy | |||||||
| SPT, any positive | 64 | (33) | 107 | (100) | 0 | (0) | 0.00a |
| Pollen | 49 | (25) | 84 | (78) | 0 | (0) | 0.00a |
| Pets | 27 | (14) | 52 | (48) | 0 | (0) | 0.00a |
| Molds | 4 | (2) | 10 | (9) | 0 | (0) | 0.01a |
| House dust mites | 21 | (11) | 44 | (41) | 0 | (0) | 0.00a |
| Rhinitis | 33 | (17) | 57 | (53) | 5 | (5) | 0.00a |
| Eczema | 3 | (2) | 10 | (9) | 4 | (4) | 0.01a |
| Asthma | |||||||
| Doctor-diagnosed asthma | 14 | (7) | 21 | (20) | 10 | (10) | 0.02a |
| Self-reported asthma | 16 | (8) | 22 | (21) | 11 | (11) | 0.03a |
| Asthma medication | 8 | (4) | 9 | (8) | 4 | (4) | 0.92a |
| Wheeze | 19 | (10) | 24 | (22) | 10 | (10) | 0.01a |
| Lung function | |||||||
| Observed | |||||||
| FEV1 (l), mean (SD) | 3.08 | 0.82 | 3.37 | 0.69 | 3.45 | 0.82 | 0.01b |
| FVC (l), mean (SD) | 4.01 | 1.03 | 4.31 | 0.92 | 4.45 | 0.99 | 0.03b |
| FEV1/FCV (%), mean (SD) | 0.77 | 0.07 | 0.79 | 0.06 | 0.77 | 0.06 | 0.01b |
| z-scores | |||||||
| zFEV1, mean (SD) | −0.34 | 0.94 | −0.49 | 0.75 | −0.37 | 0.99 | 0.03b |
| zFVC, mean (SD) | −0.19 | 0.92 | −0.28 | 0.75 | −0.11 | 0.84 | 0.05b |
| zFEV1/zFCV, mean (SD) | −0.31 | 0.95 | −0.37 | 0.92 | −0.48 | 0.97 | 0.81b |
Definition of abbreviations: n, number; SD, standard deviation; SPT, skin prick test (atopic sensitisation); FEV1, forced expiratory volume in first sec.; FVC, forced vital capacity; zFEV1, z-score for FEV1; zFVC, z-score for FVC; zFEV1/FVC, z-score for the ratio between FEV1 and FVC. Statistical significance between atopics and non-atopics is denoted by p-value <0.05.
aChi2-test.
bt-test.
Prevalence and diversity of microbial exposure
The most common microbes found in the dust were: Aspergillus versicolor, Penicillium/Aspergillus/Paecilomyces varioti spp., Cladosporium spp., Streptomyces spp., and Wallemia sebi (Table S1 (supplementary material)). Microbial loads varied greatly between homes, although at least three of the microorganisms were quantifiable in all samples (mean, 7; SD, 2.71). Significant seasonal variation was seen for several microorganisms. Cladosporium spp., Alternaria alternata and the total fungal load were highest during warm months (summer) and lowest during winter months, and Penicillium spp. and Aspergillus spp. was the opposite. Additionally, microbial diversity was lowest during winter (Table S2). On average, dust sampled from homes of atopics contained significantly less Aspergillus fumigatus, Cladosporium sphaerospermum, Penicillium/Aspergillus/Paecilomyces varioti spp., Penicillium chrysogenum, Stachybotrys chartarum/chlorohalonata than dust from homes of non-atopics (Table 3). Significantly less endotoxin and Penicillium/Aspergillus/Paecilomyces varioti spp. were found in dust samples from homes of atopics compared to the random sample. Significantly less Acremonium strictum, Aspergillus fumigatus, Cladosporium herbarum, Cladosporium sphaerospermum, Penicillium chrysogenum, Stachybotrys chartarum/chlorohalonata, but more endotoxin was found in dust from the households in the random sample, and the dust was less diverse in microbial composition than the dust sampled in the homes of non-atopics. Generally, positive but weak correlations were found between groups of microorganisms (r < 0.50), but subgroups of Cladosporium spp. were moderately to highly correlated (r = 0.72 to 0.88), as were Cladosporium spp. and total fungi (r = 0.76 to 0.83) (Table S3). Microbial diversity was significantly but only weakly to moderately correlated with the individual microorganisms (r = 0.18 to 0.73). Few significant differences were found in microbial loads or indicators between homes with and without visible damp stains, mould odor, condensation on windows and moisture damage (Table S4). Among these, a higher load of endotoxin was detected for participant’s reporting having mold odor indoors, whereas the load of endotoxin was lower among participant’s reporting having damp stains in their bedroom.
Table 3.
Microbial detection in household dust by the random sample, atopics and non-atopics.
| Random sample |
Atopics |
Non-atopics |
Difference between atopics and non-atopics |
Difference between atopics and the random sample |
Difference between non-atopics and the random sample |
|||||||
|---|---|---|---|---|---|---|---|---|---|---|---|---|
| % >LODa | GM | GSD | % >LODa | GM | GSD | % >LODa | GM | GSD | p-valueb | p-valueb | p-valueb | |
| Microbial components | ||||||||||||
| Endotoxin (103 EU/m2) | 92 | 0.21 | 5.29 | 64 | 0.04 | 9.16 | 91 | 0.05 | 3.70 | 0.61 | 0.00 | 0.00 |
| β-(1,3)-D-glucan (µg/m2) | 92 | 3.55 | 3.37 | 87 | 3.87 | 4.02 | - | - | - | - | 0.62 | - |
| Microorganisms (106 CE/m2) | ||||||||||||
| Streptomyces spp. | 82 | 2.45 | 3.17 | 82 | 2.58 | 3,13 | 78 | 2.98 | 4.52 | 0.43 | 0.73 | 0.21 |
| Acremonium strictum | 5 | 0.24 | 1.78 | 13 | 0.26 | 1.70 | 17 | 0.32 | 2.59 | 0.03 | 0.45 | <0.01 |
| Alternaria alternata | 24 | 0.11 | 2.70 | 41 | 0.15 | 2.95 | 37 | 0.15 | 3.49 | 0.98 | 0.06 | 0.06 |
| Aspergillus fumigatus | 24 | 0.66 | 2.23 | 38 | 0.81 | 2.51 | 51 | 1.42 | 4.59 | <0.01 | 0.10 | <0.01 |
| Aspergillus versicolor | 94 | 3.54 | 3.75 | 97 | 3.13 | 3.19 | 93 | 3.81 | 4.08 | 0.30 | 0.45 | 0.66 |
| Aspergillus niger | 6 | 0.11 | 3.12 | 4 | 0.09 | 2.72 | 10 | 0.09 | 4.49 | 0.87 | 0.35 | 0.43 |
| Aspergillus glaucus spp. | 26 | 0.22 | 2.57 | 28 | 0.23 | 2.42 | 32 | 0.25 | 2.67 | 0.59 | 0.82 | 0.41 |
| Chaetommium globosum | 8 | 0.05 | 1.86 | 6 | 0.05 | 1.61 | 11 | 0.06 | 2.49 | 0.06 | 0.64 | 0.09 |
| Cladosporium cladosporioides | 95 | 9.38 | 4.31 | 99 | 13.4 | 3.75 | 90 | 10.4 | 7.03 | 0.26 | 0.07 | 0.59 |
| Cladosporium herbarum | 96 | 18.8 | 6.30 | 100 | 23.1 | 4.87 | 96 | 30.6 | 8.75 | 0.29 | 0.37 | 0.04 |
| Cladosporium sphaerospermum | 67 | 1.94 | 3.86 | 60 | 1.51 | 3.52 | 75 | 3.59 | 5.34 | <0.01 | 0.15 | <0.01 |
| Mucor/Rhizopus spp. | 15 | 0.56 | 2.29 | 12 | 0.52 | 1.71 | 17 | 0.58 | 2.20 | 0.30 | 0.44 | 0.66 |
| Penicillium/Aspergillus/Paecilomyces varioti spp. | 99 | 37.3 | 3.84 | 99 | 27.0 | 3.31 | 100 | 40.0 | 3.61 | 0.04 | 0.04 | 0.67 |
| Penicillium chrysogenum | 14 | 0.17 | 1.81 | 15 | 0.18 | 1.79 | 27 | 0.23 | 2.31 | 0.02 | 0.75 | <0.01 |
| Rhizopus stolonifer | 1 | 0.21 | 1.08 | 0 | 0.21 | 1.00 | 1 | 0.21 | 1.10 | 0.34 | 0.53 | 0.63 |
| Stachybotrys chartarum/chlorohalonata | 5 | 0.05 | 1.37 | 2 | 0.04 | 1.39 | 7 | 0.06 | 2.72 | <0.01 | 0.71 | <0.01 |
| Trichoderma viride | 12 | 0.18 | 2.21 | 13 | 0.19 | 2.65 | 14 | 0.19 | 2.31 | 0.88 | 0.56 | 0.68 |
| Ulocladium chartarum | 6 | 0.05 | 1.46 | 7 | 0.05 | 1.75 | 9 | 0.05 | 1.60 | 0.94 | 0.31 | 0.28 |
| Wallemia sebi | 42 | 0.94 | 3.07 | 43 | 0.97 | 3.10 | 40 | 1.00 | 3.41 | 0.82 | 0.85 | 0.66 |
| Total fungi (108) | 98 | 3.86 | 3.59 | 100 | 4.53 | 2.92 | 100 | 4.78 | 4.47 | 0.76 | 0.32 | 0.18 |
| Diversityc, mean (SD) | 100 | 6.22 | 2.37 | 100 | 6.61 | 2.49 | 100 | 7.04 | 3.40 | 0.26 | 0.24 | 0.02 |
Definition of abbreviations: n, number; LOD, limit of detection; CE, cell equivalents; GM, geometric mean; GSD, geometric standard deviation; SD, standard deviation.
aThe percentage denotes the proportion of samples above the detection limit of the specific microbe or microbial components (total number: (1) endotoxin and glucan assays (n/n, respectively): the random sample (196/150), atopics (107/100), non-atopics (99/-); (2) microorganisms: the random sample (n = 192), atopics (n = 98), non-atopics (n = 96). Samples below the LOD (limit of detection) were assigned half of the LOD value (endotoxin (4.5 EU/m2); β-(1,3)-D-glucan (0.18 µg/m2); LOD for microorganisms, please see table S1). The β-(1,3)-D-glucan assay was not performed in non-atopics.
bt-test for differences in GM between microbial exposures in the different study groups. A p-value ≤0.05 in bold denotes a statistical significant difference between the atopis and non-atopics.
cDiversity denotes the number of different microorganism groups detected (range; 3–14).
Household dampness, allergy, asthma and lung function
Self-reported mould odor was positively associated with wheezing in atopics (OR 6.05; 95%CI 1.19 to 30.7) (Table S5). Additionally, moisture damage was associated with increased doctor-diagnosed asthma, self-reported asthma, and wheeze, although this was only statistical significant for self-reported asthma in atopics (OR 3.52; 95%CI 1.01 to 12.7) (Figure 2). When performing an overall analysis focusing on a potential interaction between dampness indicators and atopy on asthma outcomes, interaction was not found neither with mould odor (p = 0.44) nor with moisture damage (p = 0.15). No statistical significant associations were observed between dampness indicators and lung function and allergic diseases other than asthma, except for a lower zFVC in non-atopics reporting mould odor (β-coeff. −0.04; 95%CI −0.07 to −0.01).
Figure 2.
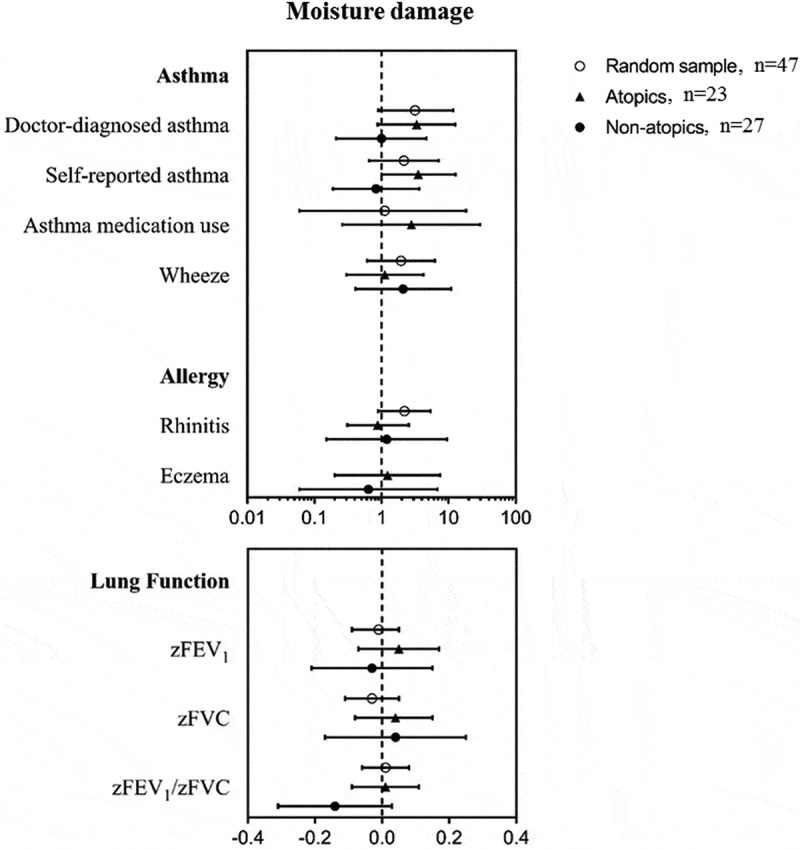
Associations of moisture damage with allergy, asthma and lung function in the random sample, atopics and non-atopics.
Microbial exposure, allergy, asthma and lung function
Associations between microbial exposure and allergy, asthma and lung function are shown in supplementary information (Table S6-S8). For microbial components, higher loads of β-(1,3)-D-glucan and endotoxin tended to be associated with poorer health outcomes in terms of allergy, asthma and lung function, although only the association of endotoxin with self-reported asthma was statistically significant in the random sample (β-coeff. 1.71; 95%CI 1.05 to 2.78).
Analyses of individual species or groups of microorganisms showed generally inconsistent associations, and few of these associations were significant. In the random sample, inverse associations were statistically significant between Streptomyces spp., Aspergillus versicolor, Cladosporium sphaerospermum and rhinitis, and additionally between Cladosporium herbarum and eczema (Table S6). Furthermore, positive associations were shown for Trichoderma viride and rhinitis in both the random sample and in the non-atopic group, and also between Chaetommium globosum and rhinitis in the non-atopic group. In terms of respiratory outcomes, inverse associations were found for Penicillium/Aspergillus/Paecilomyces varioti spp. with doctor-diagnosed asthma and for Aspergillus fumigatus and Cladosporium sphaerospermum with self-reported asthma in non-atopics (Table S7). Moreover, positive associations were found between Trichoderma viride and self-reported asthma in non-atopics and between Acremonium strictum and wheezing in atopics. For lung function outcomes, a pattern of positive associations of species and groups of microorganisms with zFEV1/FVC-ratio were shown in non-atopics, being statistical significant only for Streptomyces spp., Aspergillus versicolor, Chaetommium globosum, Penicillium/Aspergillus/Paecilomyces varioti spp. and Wallemia sebi (Table S8). In contrast, in the random sample inverse associations were found for Alternaria alternata, Cladosporium cladosporioides, Cladosporium herbarum with zFEV1/FVC-ratio and for Aspergillus niger with zFVC, and in the atopics for Chaetommium globosum with zFEV1.
Regarding microbial diversity and total fungal load, an overall pattern was observed with increasing diversity of microorganisms associated with a lower prevalence of rhinitis and asthma outcomes (Figure 3). This was, however, only significant among the random sample for rhinitis (OR 0.79; 95% CI 0.64 to 0.97) and in non-atopics for doctor-diagnosed asthma (OR 0.72; 95%CI 0.54 to 0.96), self-reported asthma (OR 0.78; 95%CI 0.61 to 0.98) and a higher zFEV1/FVC-ratio (β-coeff. 0.09; 95%CI 0.03 to 0.16). Similarly, inverse associations were found for total fungi and eczema (OR 0.48; 95% CI 0.23 to 0.96) and zFEV1/FVC-ratio (β-coeff. −0.12; 95%CI −0.24 to −0.01) in the random sample. Total fungi were associated with a higher zFEV1/FVC-ratio (β-coeff. 0.17; 95%CI 0.01 to 0.32) in the non-atopics. When testing for interaction, we observed neither an increased nor decreased effect of diversity on the above-mentioned outcomes in relation to atopic status (results not shown). Furthermore, to increase power, we pooled all participants and performed analyses on microorganisms (individual species or groups of microorganisms, the total fungal load and diversity) with health outcomes while adjusting for atopy showing similar overall inconsistency in associations (data not shown).
Figure 3.
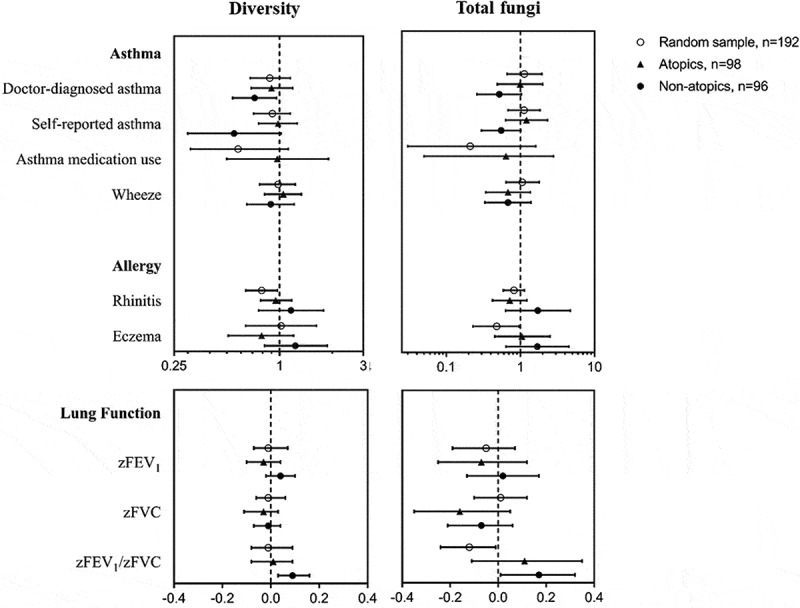
Associations of microbial diversity and total fungi with allergy, asthma and lung function in the random sample, atopics and non-atopics.
Discussion and conclusion
To our knowledge, this is the first study to examine diverse domestic microbial exposures based on microbial DNA analysis of household dust and the associated allergic and respiratory health in adults. Self-reported household moisture damage was positively associated with asthma outcomes, and mould odor with wheezing in atopics. Inconsistent associations were found for individual microbial exposures and health outcomes, but we observed inverse associations between some microorganisms and doctor-diagnosed- and self-reported asthma in the non-atopics. Furthermore, our findings suggest that higher microbial diversity may be associated with less rhinitis and asthma, although this reached statistically significant for only some of the observed associations.
Among the other findings in our study, higher loads of β-(1,3)-D-glucan and endotoxin were associated with poorer health outcomes. This has previously been observed with β-(1,3)-D-glucan and airway obstruction [29] and airway inflammation in adults [29,30], as well as respiratory symptoms and peak expiratory flow variability in children [31–34]. Endotoxin induces airway inflammation and can cause and exacerbate respiratory symptoms in high doses. However, at lower doses, the epidemiological findings on respiratory symptoms, asthma and allergy are conflicting as positive, as well as negative and no associations have been reported in both children and adults [5,6,35,36]. Despite these inconsistencies, the epidemiological evidence indicates that in general, increased endotoxin levels may be associated with a lower risk of atopic sensitization, hay fever and atopic asthma, but a higher risk of respiratory symptoms [37–40].
In accordance with our findings in adults, only few significant associations have previously been reported between individual microbes and respiratory health in children [9,12,41]. A similar inverse association was observed between higher amounts of Aspergillus fumigatus/Neosartorya fischeri spp., Cladosporium spp. and having less asthma and/or wheeze in a study that included additional microbial spp. compared to our study [41]. In contrast to our findings, a positive association has been reported between Streptomyces DNA and doctor-diagnosed asthma [9] and an inverse association with FEV1 [12]. Moreover, a case–control study found that Aspergillus versicolor DNA levels were slightly elevated in homes of allergic persons compared with homes of non-allergic persons’ homes [14]. Also in homes of atopic children with mild and severe asthma, fungal exposure differed significantly in one study [42]. Due to the currently limited and inconsistent findings on the health effects of microbial exposure measured by microbial DNA, further investigation preferably based on a prospective design with repeated measurements is required in order to validate the current findings.
When comparing the present study to previous studies using similar methods for dust sampling and analysis, we found lower endotoxin loads [22,43,44], and lower β-(1,3)-D-glucan loads [19,45]. The reason for this is unknown but is likely to be attributed to methodological differences between studies [46]. Furthermore, in regards to our exposure assessment, the diversity score should be considered as a crude estimate of the overall microbial diversity and essentially only show fungal diversity as only one bacterial species (Streptomyces spp.) was included. Our findings indicate that increased microbial diversity may be associated with reduced allergy and respiratory outcomes in adults. A protective association of microbial diversity has also been shown previously with asthma [18,42] and wheeze [41] in children. Similarly, another study in asthmatic children showed that fungal concentration and composition was associated with increased risk of severe asthma, but in contrast low bacterial richness was associated with reduced risk of severe asthma [47]. Our findings indicate that the protective effect of a diverse microbial environment may also apply to non-farming environments, and to adults, rather than children. However, no conclusions on the potential mechanisms underlying this protective effect can be derived from the current cross-sectional study. The design allows us to establish only associations rather than causal relationships. Furthermore, we have only sampled dust once at single point in time. Health effects depend on prior, not subsequent or posterior exposures and therefore, we may not have measured exposures at the time most relevant for the investigated health outcomes. Additionally, we were unable to fully elucidate the association of total fungal load and specific microbial exposures due to the correlations between species. Nonetheless, our findings indicate that microbial diversity may be associated with allergy and respiratory health after adjustment for essential confounders. Further longitudinal investigation of indoor environmental dynamics and the associations between the indoor microbial flora and occupants’ respiratory health are required to better identify the specific causal agents. An additional limitation of this study is that we performed multiple testing, increasing the risk of false-positive associations. Therefore, as this is a relatively small study with a large number of test performed, the observed associations should be considered as suggestive.
In contrast to the associations observed between moisture damage and asthma and mould and wheeze in atopics, no such associations were found in the non-atopics. However, due to the low prevalence of dampness problems in non-atopics, we were unable to evaluate whether atopics may be more susceptible to household dampness than non-atopics. Moreover, we cannot rule out that the observed associations in the atopics are occurring due to reporting bias as people reporting adverse health outcomes may be more likely to report dampness. The use of observations made by the investigators rather than the participants would be preferable. Moreover, the use of a prospective design is more desirable for temporal separation of exposure and outcome assessment. This design was applied in the European Community Respiratory Health Survey (ECRHS) comprising 7,104 adults from 13 countries, that showed an increased risk of new-onset asthma with water damage (RR, 1.46; 95% CI, 1.09 to 1.94) and with mould odor (RR, 1.30; 95% CI, 1.00 to 1.68) reported at baseline [1]. Additionally, in the ECHRS study, a stronger health effect of household dampness was observed in atopics compared with non-atopics [1], similar to our findings of an effect in atopics.
A strength of our study is the inclusion of lung function, which is a more objective measure than self-reported symptoms. However, we found no decline in lung function associated with dampness despite the fact that it has been observed in other studies [8,48,49] and no clear or consistent associations were found between species and groups of microorganisms and lung function. Furthermore, we were unable to identify potential microbial agents responsible for the observed association between dampness indicators and asthma, since we found only a few significant associations between individual microbial exposures and dampness indicators. It should, however, be noted that due to the low prevalence of some dampness indicators, we were underpowered to show any difference in levels of microbial exposure.
In conclusion, household moisture damage was associated with increased risk of asthma and mould odor with an increased risk of wheeze in atopics. Moreover, our findings suggest that asthma and allergy in adults may, in some cases, be associated with species composition and microbial load present in urban domestic environments.
Supplementary Material
Acknowledgments
This study was supported by Realdania and contributes to the research entity of Centre for Indoor Air and Health in Dwellings (CISBO). The authors wish to thank study participants, personnel of the Research Centre for Prevention and Health (Glostrup University Hospital, Copenhagen) and HouseTest ApS for performing the qPCR analyses on microorganisms.
Biographies
Jeroen Douwes is Professor of Public Health and Director of Massey University’s Centre for Public Health Research in Wellington, New Zealand. He leads a comprehensive programme of research on the causes, mechanisms and prevention of respiratory disease; he also conducts a wide range of environmental and occupational health research.
Jonas Nørrelund Lindgreen is CEO and co-founder of HouseTest, which has specialized in developing qPCR-based analyses to measure and to evaluate microbial contaminants of the indoor climate. He completed his PhD degree on cancer immunology from University of Southern Denmark in 2011.
Betina Heinsbæk Thuesen is a Senior Researcher and Head of Section for Population-based Epidemiology at Center for Clinical Research and Prevention, Bispebjerg and Frederiksberg Hospital, Copenhagen, Denmark. She is an experienced researcher within the field of epidemiology with a main focus on NCDs in relation to different life style factors and has taken part in the coordination of several national as well as international research projects.
Jakob Hjort Bønløkke received the MD and PhD degrees from Aarhus University, Denmark in 1995 and 2005 respectively. He became a specialist in occupational medicine in 2009 and is currently working as a senior consultant at the Department of Occupational and Environmental Medicine at Aalborg University Hospital, Denmark. His main research interests are environmental and occupational lung diseases, effects of ageing on performance among workers, and interventions aimed at reducing work hazards.
Anne Hyvärinen is a Research Professor and Head of the Environmental Health Unit at Finnish Institute for Health and Welfare and a Docent at University of Eastern Finland. She has a focus in research of indoor microbial assessments and has a long experience in coordination of national and international research projects and she is deeply involved in national expert assignments, including the ongoing Finnish national indoor air and health program (2018-2028).
Grethe Elholm is an Assistant Professor at the Department of Public Health at Aarhus University. Her research is focusing on risk factors of asthma and allergy and she has worked with methods ranging from human experimental studies, various types of epidemiological designs and real-life intervention studies.
Kirsten Østergaard is a Laboratory Technician at the Department of Public Health at Aarhus University. She is specialized in analyzing dust samples from extraction of filters to detection of dust components.
Steffen Loft is Head of Department of Public Health and Professor of Environmental Medicine at the Faculty of Health and Medical Sciences at University of Copenhagen, Denmark. The aim of his research is to improve prevention of disease caused by environmental factors by better understanding the exposures and mechanisms involved using of epidemiology and toxicology. Particularly research focus areas include the fields of health effects of particulates, molecular epidemiology, cardiovascular disease mechanisms and oxidative damage to DNA and repair.
Collin Brooks is a Research Fellow at the Centre for Public Health Research, Massey University, Wellington, New Zealand. His research is primarily focused on the assessment of immunopathology, biomarkers, risk factors, and causative or protective exposures underlying asthma and allergy, and other non-communicable conditions, such as cancer and occupational disease.
Gitte Juel Holst is a post doctoral scholar at Aarhus University at Department of Public Health. She received a master’s degree in Health Science and completed her PhD degree from Aarhus University with a thesis entitled: “Dampness and microbial exposure in relation to asthma and allergy in children and adults – An epidemiological approach”. She is interested in how the environment influences on our health with emphasis on air quality and health.
Ann Dorte Pørneki is a master of science and co-founder of HouseTest, a Danish company performing DNA-based identification and quantification of indoor microorganisms.
Allan Linneberg is director at the Center for Clinical Research and Disease Prevention, Bispebjerg and Frederiksberg Hospital, and Professor of Epidemiology at Department of Clinical Medicine, University of Copenhagen. He has mainly worked in the field of population-based, clinical, and genetic epidemiology, studying the distribution and causes of various NCDs such as allergic and immunological diseases, diabetes, and cardiovascular disease.
Torben Sigsgaard MD, PhD, FERS, is professor of Occupational and Environmental Medicine at Dept. of public Health, Aarhus University, since 2004. His main research is within the field of gene-environment interaction and the impact on respiratory health and aging. The studies range from toxicological investigations with human exposures under controlled environmental conditions via cohort studies to registry based studies on the entire Danish population.
Disclosure statement
No potential conflict of interest was reported by the authors.
Supplementary material
Supplemental data for this article can be accessed here
References
- [1].Norback D, Zock JP, Plana E, et al. Mould and dampness in dwelling places, and onset of asthma: the population-based cohort ECRHS. Occup Environ Med. 2013;70(5):325–13. [DOI] [PubMed] [Google Scholar]
- [2].European Environment and Health Information System (ENHIS) . Fact sheet: children living in homes with problems of damp (EUROSTAT database). World Health Organization; 2009. p. 1–4. Available from: http://www.euro.who.int/en/health-topics/environment-and-health/Housing-andhealth/publications/2009/children-living-in-homes-with-problems-of-damp-2009 [Google Scholar]
- [3].Fisk WJ, Lei-Gomez Q, Mendell MJ.. Meta-analyses of the associations of respiratory health effects with dampness and mold in homes. Indoor Air. 2007;17(4):284–296. [DOI] [PubMed] [Google Scholar]
- [4].Kirjavainen PV, Täubel M, Karvonen AM, et al. Microbial secondary metabolites in homes in association with moisture damage and asthma. Indoor Air. 2015;26:1–9. [DOI] [PubMed] [Google Scholar]
- [5].Mendell MJ, Mirer AG, Cheung K, et al. Respiratory and allergic health effects of dampness, mold, and dampness-related agents: a review of the epidemiologic evidence. Environ Health Perspect. 2011;119(6):4. [DOI] [PMC free article] [PubMed] [Google Scholar]
- [6].Tischer C, Gehring U, Chen CM, et al. Respiratory health in children, and indoor exposure to (1,3)-beta-D-glucan, EPS mould components and endotoxin. Eur Respir J. 2011;37(5):1050–1059. [DOI] [PubMed] [Google Scholar]
- [7].WHO E . Guidelines for indoor air quality: dampness and mould. Copenhagen: World Health Organization; 2009. [PubMed] [Google Scholar]
- [8].Norbäck D, Cai G. Dampness, indoor mould, fungal DNA and respiratory health–molecular methods in indoor epidemiology. Clin Exp Allergy. 2015;45(5):840–843. [DOI] [PMC free article] [PubMed] [Google Scholar]
- [9].Cai G, Hashim JH, Hashim Z, et al. Fungal DNA, allergens, mycotoxins and associations with asthmatic symptoms among pupils in schools from Johor Bahru, Malaysia. Pediatr Allergy Immunol. 2011;22(3):290–297. [DOI] [PubMed] [Google Scholar]
- [10].Karvonen AM, Hyvärinen A, Rintala H, et al. Farming, moisture damage, microbes and development of asthma in childhood: A birth cohort study. Eur Respir J. 2014;44(Suppl 58):4240. [Google Scholar]
- [11].Reponen T, Lockey J, Bernstein DI, et al. Infant origins of childhood asthma associated with specific molds. J Allergy Clin Immunol. 2012. 9;130(3):639,644.e5. [DOI] [PMC free article] [PubMed] [Google Scholar]
- [12].Simoni M, Cai G, Norback D, et al. Total viable molds and fungal DNA in classrooms and association with respiratory health and pulmonary function of European schoolchildren. Pediatr Allergy Immunol. 2011;22(8):843–852. [DOI] [PubMed] [Google Scholar]
- [13].Vesper S, McKinstry C, Haugland R, et al. Higher Environmental Relative Moldiness Index (ERMI sm) values measured in detroit homes of severely asthmatic children. Sci Total Environ. 2008;394(1):192–196. [DOI] [PubMed] [Google Scholar]
- [14].Bellanger A, Reboux G, Roussel S, et al. Indoor fungal contamination of moisture‐damaged and allergic patient housing analysed using real‐time PCR. Lett Appl Microbiol. 2009;49(2):260–266. [DOI] [PubMed] [Google Scholar]
- [15].Kaarakainen P, Rintala H, Vepsäläinen A, et al. Microbial content of house dust samples determined with qPCR. Sci Total Environ. 2009;407(16):4673–4680. [DOI] [PubMed] [Google Scholar]
- [16].Meklin T, Haugland RA, Reponen T, et al. Quantitative PCR analysis of house dust can reveal abnormal mold conditions. J Environ Monit. 2004;6(7):615–620. [DOI] [PMC free article] [PubMed] [Google Scholar]
- [17].Vesper SJ, Varma M, Wymer LJ, et al. Quantitative polymerase chain reaction analysis of fungi in dust from homes of infants who developed idiopathic pulmonary hemorrhaging. J Occup Environ Med. 2004;46(6):596–601. [DOI] [PubMed] [Google Scholar]
- [18].Ege MJ, Mayer M, Normand A, et al. Exposure to environmental microorganisms and childhood asthma. N Engl J Med. 2011;364(8):701–709. [DOI] [PubMed] [Google Scholar]
- [19].Jacobs J, Borras-Santos A, Krop E, et al. Dampness, bacterial and fungal components in dust in primary schools and respiratory health in schoolchildren across Europe. Occup Environ Med. 2014;71(10):704–712. [DOI] [PubMed] [Google Scholar]
- [20].Thuesen BH, Cerqueira C, Aadahl M, et al. Cohort profile: the health2006 cohort, research centre for prevention and health. Int J Epidemiol. 2014. April;43(2):568–575. [DOI] [PubMed] [Google Scholar]
- [21].Horwitz A, Skaaby T, Kårhus LL, et al. Screening for celiac disease in Danish adults. Scand J Gastroenterol. 2015;50(7):824–831. [DOI] [PMC free article] [PubMed] [Google Scholar]
- [22].Noss I, Doekes G, Sander I, et al. Passive airborne dust sampling with the electrostatic dustfall collector: optimization of storage and extraction procedures for endotoxin and glucan measurement. Ann Occup Hyg. 2010;54(6):651–658. [DOI] [PubMed] [Google Scholar]
- [23].Hornung RW, Reed LD. Estimation of average concentration in the presence of nondetectable values. Appl Occup Environ Hyg. 1990;5(1):46–51. [Google Scholar]
- [24].Rutledge RG, Stewart D. A kinetic-based sigmoidal model for the polymerase chain reaction and its application to high-capacity absolute quantitative real-time PCR. BMC Biotechnol. 2008;8(47):6750–6847. [DOI] [PMC free article] [PubMed] [Google Scholar]
- [25].Hersoug LG, Husemoen LL, Sigsgaard T, et al. Indoor exposure to environmental cigarette smoke, but not other inhaled particulates associates with respiratory symptoms and diminished lung function in adults. Respirology. 2010;15(6):993–1000. [DOI] [PubMed] [Google Scholar]
- [26].Miller MR, Hankinson J, Brusasco V, et al. Standardisation of spirometry. Eur Respir J. 2005;26(2):319–338. [DOI] [PubMed] [Google Scholar]
- [27].Pedersen OF, Naeraa N, Lyager S, et al. A device for evaluation of flow recording equipment. Bull Eur Physiopathol Respir. 1983;19(5):515–520. [PubMed] [Google Scholar]
- [28].Quanjer PH, Stanojevic S, Cole TJ, et al. Multi-ethnic reference values for spirometry for the 3–95-yr age range: the global lung function 2012 equations. Eur Respir J. 2012;40(6):1324–1343. [DOI] [PMC free article] [PubMed] [Google Scholar]
- [29].Thorn J, Rylander R. Airways inflammation and glucan in a rowhouse area. Am J Respir Crit Care Med. 1998;157(6):1798–1803. [DOI] [PubMed] [Google Scholar]
- [30].Sigsgaard T, Bonefeld-Jorgensen EC, Kjaergaard SK, et al. Cytokine release from the nasal mucosa and whole blood after experimental exposures to organic dusts. Eur Respir J. 2000;16(1):140–145. [DOI] [PubMed] [Google Scholar]
- [31].Bønløkke JH, Stridh G, Sigsgaard T, et al. Upper-airway inflammation in relation to dust spiked with aldehydes or glucan. Scand J Work Environ Health. 2006;32:374–382. [DOI] [PubMed] [Google Scholar]
- [32].Rylander R, Hsieh V, Courteheuse C. The first case of sick building syndrome in Switzerland. Indoor Built Environ. 1994;3(3):159–162. [Google Scholar]
- [33].Rylander R. Indoor air-related effects and airborne (1,3)-beta-D-glucan. Environ Health Perspect. 1999;107(Suppl 3):501–503. [DOI] [PMC free article] [PubMed] [Google Scholar]
- [34].Douwes J, Zuidhof A, Doekes G, et al. 1–>3)-beta-D-glucan and endotoxin in house dust and peak flow variability in children. Am J Respir Crit Care Med. 2000;162(4):1348–1354. [DOI] [PubMed] [Google Scholar]
- [35].Liu AH, Redmon AH. Endotoxin: friend or foe? Allergy Asthma Proc. 2001;22(6):337–340. [PubMed] [Google Scholar]
- [36].Liebers V, Raulf-Heimsoth M, Bruning T. Health effects due to endotoxin inhalation (review). Arch Toxicol. 2008;82(4):203–210. [DOI] [PubMed] [Google Scholar]
- [37].Gehring U, Bischof W, Schlenvoigt G, et al. Exposure to house dust endotoxin and allergic sensitization in adults. Allergy. 2004;59(9):946–952. [DOI] [PubMed] [Google Scholar]
- [38].von Mutius E, Braun-Fahrlander C, Schierl R, et al. Exposure to endotoxin or other bacterial components might protect against the development of atopy. Clin Exp Allergy. 2000;30(9):1230–1234. [DOI] [PubMed] [Google Scholar]
- [39].Smit LA, Heederik D, Doekes G, et al. Occupational endotoxin exposure reduces the risk of atopic sensitization but increases the risk of bronchial hyperresponsiveness. Int Arch Allergy Immunol. 2010;152(2):151–158. [DOI] [PubMed] [Google Scholar]
- [40].Carnes MU, Hoppin JA, Metwali N, et al. House dust endotoxin levels are associated with adult asthma in a U.S. farming population. Ann Am Thorac Soc. 2017;14:324–331. [DOI] [PMC free article] [PubMed] [Google Scholar]
- [41].Karvonen A, Hyvärinen A, Rintala H, et al. Quantity and diversity of environmental microbial exposure and development of asthma: a birth cohort study. Allergy. 2014;69(8):1092–1101. [DOI] [PMC free article] [PubMed] [Google Scholar]
- [42].Dannemiller K, Mendell M, Macher J, et al. Next‐generation DNA sequencing reveals that low fungal diversity in house dust is associated with childhood asthma development. Indoor Air. 2014;24(3):236–247. [DOI] [PMC free article] [PubMed] [Google Scholar]
- [43].Madsen AM, Matthiesen CB, Frederiksen MW, et al. Sampling, extraction and measurement of bacteria, endotoxin, fungi and inflammatory potential of settling indoor dust. J Environ Monit. 2012;14(12):3230–3239. [DOI] [PubMed] [Google Scholar]
- [44].Liebers V, van Kampen V, Bünger J, et al. Assessment of airborne exposure to endotoxin and pyrogenic active dust using electrostatic dustfall collectors (EDCs). J Toxicol Environ Health, Part A. 2012;75(8–10):501–507. [DOI] [PubMed] [Google Scholar]
- [45].Krop EJM, Jacobs JH, Sander I, et al. Allergens and β-Glucans in dutch homes and schools: characterizing airborne levels. PloS ONE. 2014;9:88871. [DOI] [PMC free article] [PubMed] [Google Scholar]
- [46].Brooks CR, Siebers R, Crane J, et al. Measurement of β‐(1,3)‐glucan in household dust samples using Limulus amebocyte assay and enzyme immunoassays: an inter‐laboratory comparison. Environ Sci Process Impacts. 2013;15:405–411. [DOI] [PubMed] [Google Scholar]
- [47].Dannemiller K, Gent JF, Leaderer BP, et al. Indoor microbial communities: influence on asthma severity in atopic and nonatopic children. J Allergy Clin Immunol. 2016;138:76–83.e1. (Epub ahead of print). [DOI] [PMC free article] [PubMed] [Google Scholar]
- [48].Williamson IJ, Martin CJ, McGill G, et al. Damp housing and asthma: a case-control study. Thorax. 1997;52(3):229–234. [DOI] [PMC free article] [PubMed] [Google Scholar]
- [49].Norbäck D, Björnsson E, Janson C, et al. Current asthma and biochemical signs of inflammation in relation to building dampness in dwellings. Int J Tuberc Lung D. 1999;3(5):368–376. [PubMed] [Google Scholar]
Associated Data
This section collects any data citations, data availability statements, or supplementary materials included in this article.