

Abstract
Objective:
To examine the factors associated with healthy aging in a cohort of Mexican adults after a follow-up period of 14 years.
Study design:
Participants are part of a prospective cohort of the Mexican Healthy Aging Study (MHAS), of which we included 5142 individuals aged 63 and older.
Main outcome:
Healthy aging defined as reaching age 77 or 90 without major chronic conditions or physical limitations.
Measures:
Information on age, education, marital status, smoking, alcohol consumption, physical activity, self-perceived depression, health conditions and history of age-related diseases was collected at baseline and follow-up.
Results:
Among the overall cohort, 57.8% experienced healthy survival to age 77 and 42.2 % had died before age 77 or were undergoing normal aging. Participants with long-lived parents and who exercised had a lower risk of being non-healthy agers. Being overweight, obese or smoker increased the risk of being non-healthy agers. Physically active participants had increased odds of healthy aging at age 77 (OR: 1.17; 95% CI: 1.01–1.46) and at age 90 (OR: 1.5; 95% CI: 1.01–2.24)
Depression has a negative relationship with healthy aging at age 90 (OR: 0.66; 95% CI: 0.45–0.97). Maternal longevity was associated with healthy aging only at age 77 (OR= 1.34; 95% CI: 1.04–1.72).
Conclusions:
Our findings support the view that a combination of genetic and behavioral factors is associated with healthy aging. In accordance with findings in Caucasian populations, our data suggest for the first time that there might also be a genetic determinant for healthy ageing in Latin Americans.
Keywords: older adults, healthy aging, longevity, obesity, physical activity, maternal longevity
1. Background
The world’s oldest population is growing at a faster rate than any other age group [1]. In 2012, people aged 60 or more represented nearly 11.5% of the global population and this proportion is expected to nearly double to 22% by 2050 [1]. Attaining healthy aging (HA) has become a public health challenge, and it is fundamental to identify the variables that are associated with it. Previous studies in Europe and US have found that a combination of genetic and lifestyle factors plays a critical role in HA [2–7]. Prior studies in Caucasian populations showed that individuals with long-lived parents tend to be healthy agers [3, 8], and some studies have found associations with the Apolipoprotein E (APOE) gene [8]. Evidence regarding lifestyle factors (such as physical activity, non-smoking, low alcohol consumption, maintaining a healthy weight) shows consistent associations with successful aging; however, most of these studies have been performed in Caucasian and Asian populations [5, 7, 9, 10]. There are limited data on risk factors for healthy aging in low-and-middle income countries [2]. In the case of Mexico, 9.06% of the national population is over 60 years old, and it is expected to double by 2030 [11]. A few studies have analyzed HA and survival in Mexico and found important relationships with lifestyle factors and health conditions [2, 4, 12, 13]; however, they did not consider the importance of parental longevity, which is indicative of genetic longevity factors, and the follow-up time was short (i.e., less than 10 years). In this study, we aimed to examine the factors associated with healthy aging in a cohort of Mexican adults after a follow-up period of 14 years.
2. Methodology
2.1. Study population and design
The Mexican Health and Aging Study (MHAS) is a national representative cohort of Mexican adults 50 years of age or older, interviewed face to face in their homes. Currently, there are four waves: baseline in 2001 and follow-ups in 2003, 2012, and 2015 [14, 15].
The survey followed a stratified and multistage sampling design; it was national representative. In the baseline in 2001, the sampling frame was the National Employment Survey, (ENE) carried out by the National Institute of Statistics and Geography in Mexico INEGI [14, 16]. All households with at least one resident aged 50 years or older were eligible. Spouses or partners of the selected participants, when they had one, were also recruited independently of their age. 11000 households across all states of Mexico prevalent cases, which led to a final sample of N=15186 participants.
In this study we restricted our analysis to individuals aged 50 years and older, which led to a sample of 13463. To analyze the factors related to healthy ageing, we used the following two approaches:
To study individuals aged 50 −63 years, excluding prevalent cases, to prospectively asses the associations between genetic factors and modifiable risk factor with the loss of healthy ageing status (incidence of a chronic disease, loss of normal physical function or dead) (N=4308)
To analyze the factors that might be related to healthy ageing at age 77: the analysis was restricted to participants between 63 and 77 years old because they would reach 77 years during the follow-up period, and, in this way, we excluded prevalent cases, which led to a sample of N=2068.
We decided to include both analyses because it was important to determine factors related to HA in both midlife and late-life; in the second analysis, we excluded prevalent cases, so many individuals who developed a chronic disease or died younger than 63 years old were not part of the analysis.
Finally, only participants who had complete information on the variables involved in the analysis were included. In the group aged 50–63 the final sample was 4220 (88 due to incomplete information) and in the group aged 63–77 years old the final sample was 1845 (166 due to loss in follow-up and 57 due to missing information).
A flowchart depicting the study inclusion process is shown in Figure 1.
Figure 1:

Flow diagram of participants. The diagram depicts the number of participants selected at baseline and follow-up.
HA77: Healthy ageing at 77 years, ~ AHE: Adverse health event: It might be a chronic disease (diabetes, coronary heart disease, stroke, and cancer) or non-normal physical function., *Individuals to be followed up: is the sum of the participants with missing data in the corresponding wave and participants with no AHE or healthy ageing status, Gray rectangles with white fonts indicate participants that will be followed-up, Rectangles with dotted border indicate final status of the participants
2.2. Study variables
At baseline, participants were asked about age, sex, marital status, current or former smoking, current or former alcohol consumption, physical activity (exercised or hard physical activity at least three times a week), self-perceived depression (feeling depressed the majority of time during the last week) and some other health-related aspects. Body weight and height were self-reported. In order to define BMI categories, cut-off points proposed by the Official Mexican Regulation to treat obesity and overweight (NOM-008-SSA3–2017) in adults aged 60 years or older and by the Social Security in Mexico to evaluate and treat the nutritional status of adults aged 60 years or older, were used and are as follows: underweight (< 22), normal weight (22–27), overweight (27–30) and obese (> 30) [17, 18]. We define drinking categories according to the NIAAA: “for women, low-risk drinking is defined as no more than 3 drinks on any single day and no more than 7 drinks per week. For men, it is defined as no more than 4 drinks on any single day and no more than 14 drinks per week” [19]. Finally, participants were asked whether their biological mother and father was still alive, at what age they died, or about their current age. We defined parental longevity as having a mother or father who survived to ≥90 years.
2.3. Study outcome
All-cause mortality and date of death was reported by next-of-kin at waves 2, 3 and 4. There is no general consensus about the definition of HA, but most previous studies based theirs on Rowe and Kahn’s model [20] with minor modifications. In accordance with Rowe and Kahn’s, we defined HA as reaching age 77 without major chronic diseases and the maintenance of physical function. History of age-related diseases was assessed using self-reported information about previous diagnosis. The chronic diseases included were: diabetes, coronary heart disease, stroke, and cancer. Information about basic Activities of Daily Living (ADLs) and Instrumental Activities of Daily Living (IADLs) were used to assess functional status. Normal physical function was defined, in accordance with previous studies in Mexican population [21], as not reporting limitation in any ADLs and maximum one limitation in IADLs. Five activities were included in the ADLs: bathing, dressing, eating, going to bed, using the toilet, walking around their home. IADLS activities included: preparing a hot meal, shopping for groceries, taking medications and managing money. The reference category for healthy survival was 77 years, which is the average current life expectancy at birth in Mexico [22]. We considered that a participant lost the healthy ageing status when any of the studied risks were observed before age 77: chronic disease, non-normal physical function or death. Once an individual was considered a healthy ager, this status was not changed.
We identified prevalent cases at baseline and analyzed them separately. Then, at each wave, we evaluated incident cases considering:
Participants aged 77 years or older: in which case we determined if they were HA or not depending on their chronic diseases and normal physical function.
Participants younger than 77 years: where we analyzed if they had developed a chronic condition or had non-normal physical function, in which case they were considered as non- healthy agers.
In the event that individuals died in-between waves, we obtained information about the age at which they had died and determined if they held the healthy ageing status. At the end of the study, all participants who had reached 77 years old were assigned to one group of healthy ageing. A detailed flow diagram is presented in Figure 2 to clarify this process.
Figure 2:
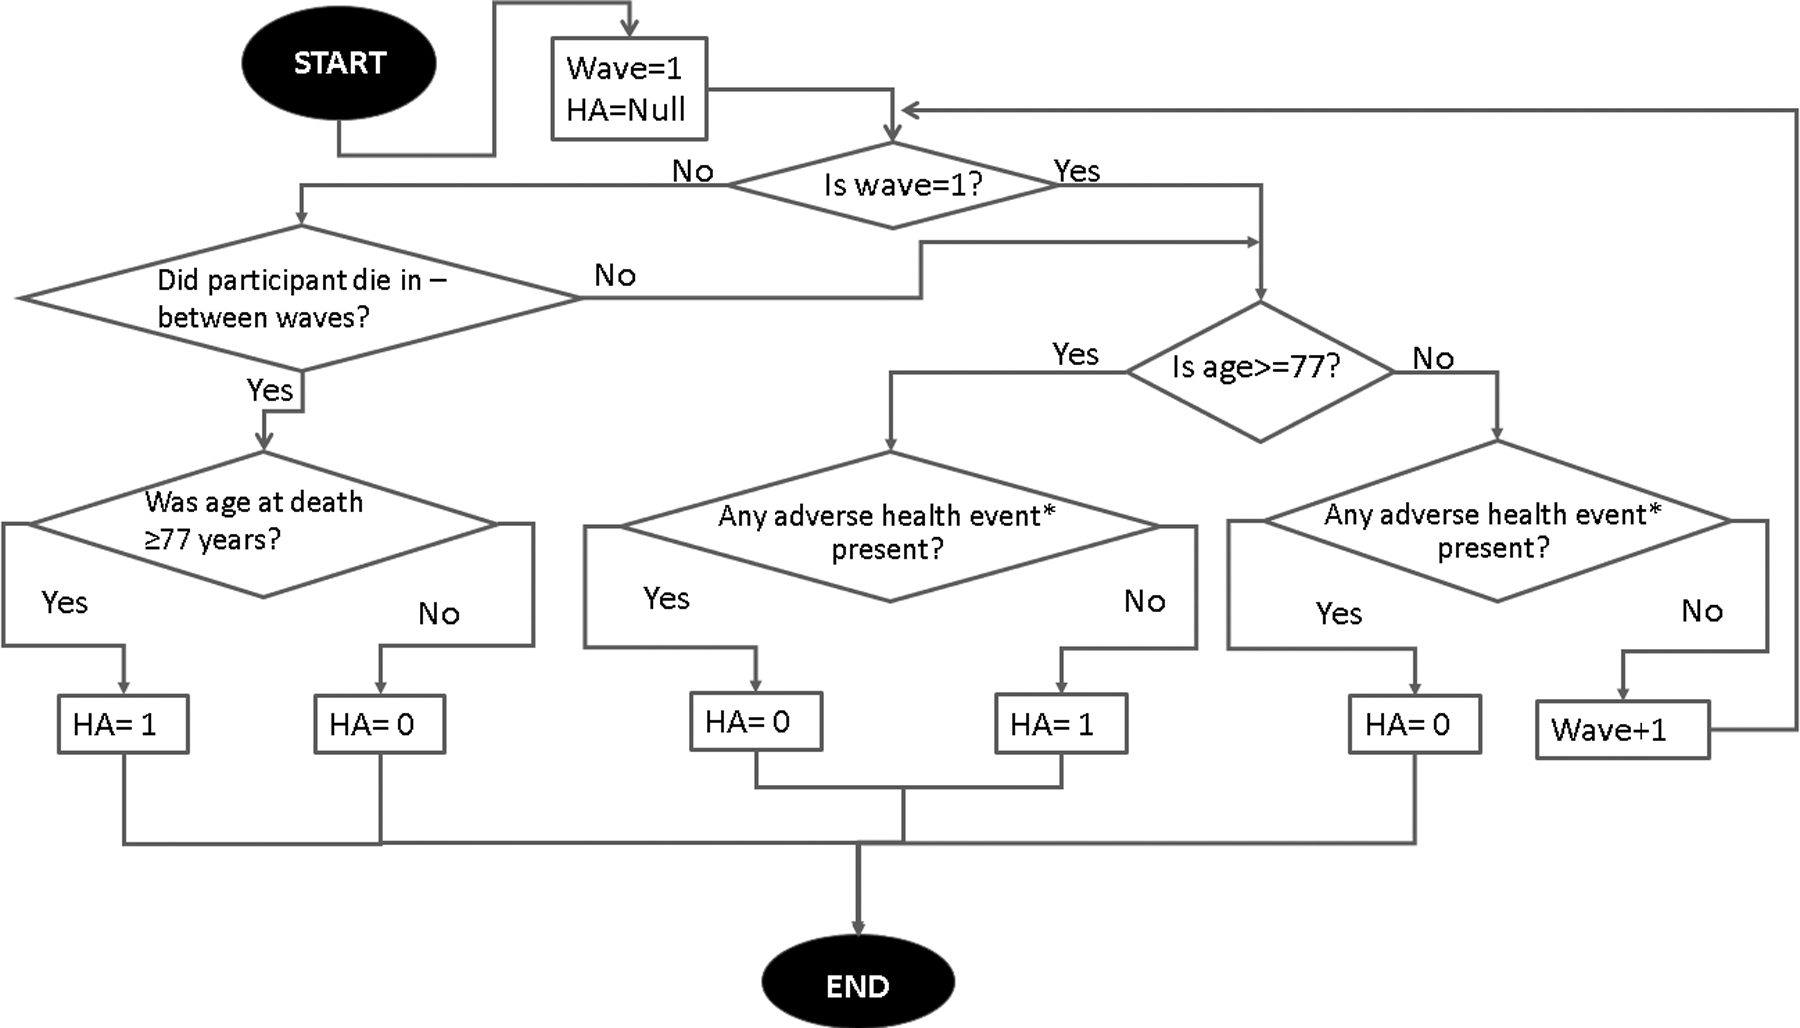
Algorithm of decision for healthy ageing status.
*Adverse health event: It might be a chronic disease (diabetes, coronary heart disease, stroke, and cancer) or non-normal physical function.
We additionally studied HA at 90 because this is the usual reference for longevity studies [3, 23]. Participants who did not reach age 77 or developed the chronic age-associated conditions defined previously were considered to undergo normal aging.
2.4. Statistical analysis
We fitted Cox proportional hazards models to the time to event outcome of data of losing the healthy ageing status (incident chronic diseases, incident non-normal physical function or death), yielding hazard ratios (HR) and their 95% confidence intervals (CI). Person-years were estimated for each participant from baseline to the date of the failures, or the date of response to their last questionnaire. The date of failure was, in the case of death, that reported by the informant interviewed; in the case it was not known, it was attributed to the mid-point between the date of the response to the previous answered questionnaire and the date of the interview. The model was adjusted for age, sex, education, marital status, smoking, alcohol consumption, physical activity, self-perceived depression, overweight or obesity and parental longevity.
We performed two separate logistic regression analyses to estimate the odds ratios (ORs) of HA, the first one was for HA at the age of 77 years and the second one was restricted to individuals who were born on 1925 or before, so that they were able to reach 90 years by the end of the study. Multivariable models were adjusted for age, sex, education, marital status, smoking, alcohol consumption, physical activity, self-perceived depression, overweight or obesity, follow-up time and parental longevity.
All analyses were performed using STATA version 14.0 software (Stata Corporation, College Station, TX).
3. Results
The participants’ mean age at baseline was 63 years (standard deviation 5.3). Among the overall study group, 57.8 % experienced HA to age 77 (HA77) and 42.2 % had died before age 77 or were undergoing normal aging (Table 1). There were statistically significant differences in many of the variables studied among the HA categories compared. Participants in the normal aging group were more likely to be younger, overweight, have depressive symptoms and be physically inactive. No significant differences were observed in percentage of women, alcohol consumption or smoking between the HA77 and normal aging group.
Table 1:
Baseline characteristics by age-group and healthy survival status*
| All participants | 50-63 years old | 63–77 years old | P-value | ||
|---|---|---|---|---|---|
| Non HA77 | HA77 | ||||
| N=6065 | N=4220 | N=1176 | N=669 | ||
| Age (mean (SD)) | 63.18 (5.3) | 56.0 (3.4) | 77.5 (2.6) | 82.7 (4.8) | <0.01’ |
| Sex (% Female) | 3195 (52.7) | 2325 (55.1) | 379(47.2) | 491(44.6) | 0.26 |
| Years of education (mean (SD)) | 4.63 (6.2) | 5.3 (4.6) | 3.2 (2.6) | 3 (7.3) | <0.01’ |
| Marital status (% married) | 4455 (73.5) | 3239 (76.8) | 517(64.4) | 699(63.5) | 0.69 |
| Long-lived mother | 1341 (22.1) | 905 (21.4) | 165(20.6) | 271(24.6) | 0.04 |
| Long-lived father | 1556 (25.7) | 1118 (26.5) | 184(22.9) | 254(23.1) | 0.94 |
| Modifiable Risk Factors | |||||
| Depression (% yes) | 2127 (35.1) | 1504 (35.7) | 280(34.9) | 343(31.2) | 0.09 |
| Smoking behavior | 0.91 | ||||
| Never smoked | 3656 (60.3) | 2587 (61.3) | 451(56.2) | 618(56.1) | |
| Previous smoker | 1437 (23.7) | 920 (21.8) | 215(26.8) | 302(27.4) | |
| Current smoker | 1029 (17) | 711 (16.9) | 137(17.1) | 181(16.4) | |
| Alcohol intake (% non-drinker) | 0.25 | ||||
| Non-drinker | 5390 (88.9) | 3619 (85.8) | 756(94.2) | 1015(92.2) | |
| Low-risk drinker | 606 (10) | 489 (11.6) | 41(5.1) | 76(6.9) | |
| Heavy drinker | 126 (2.1) | 110 (2.6) | 6(0.8) | 10(0.9) | |
| Physical activity (% active) | 2241 (36.9) | 1600 (37.9) | 256 (32.0) | 385 (35.0) | 0.08 |
| BMI (Kg/m2) | 27.3 (5.1) | 27.6 (5.2) | 27.6 (4.8) | 24.9 (5.1) | <0.01’ |
| Weight status | |||||
| Underweight | 452 (7.5) | 373 (8.8) | 61(7.59) | 18(20.76) | 0.01 |
| Normal weight | 2400 (39.6) | 2023 (48) | 325(40.51) | 52(39.75) | 0.89 |
| Overweight | 1209 (19.9) | 999 (23.7) | 193(24.05) | 17(10.34) | <0.01 |
| Obesity | 1061 (17.5) | 823 (19.5) | 224(27.85) | 14(28.9) | 0.84 |
Values are represented as No. (%), unless otherwise indicated
P-value for the comparison between HA77 and non HA77
Chi-squared test unless otherwise indicated
HA77: Healthy ageing at 77 years old
Kruskal-Wallis test
The crude and multivariate adjusted hazard ratios are shown in Table 2. Participants with overweight and obesity had an increased risk of being non-healthy agers (NHA) (HR=1.24, 95% CI: 1.16–1.33) compared to the reference group (normal weight). In addition, participants with long-lived parents had a significant lower risk of being NHA (HR=0.92, (95% CI: 0.85–0.99) and HR=0.91 (95% CI: 0.85–0.98) for long-lived mother and father, respectively). Participants who exercised had a lower risk of being NHA (HR=0.9, 95% CI: 0.84–0.96). Smokers had an increased risk of being NHA, as well as participants reporting depressive symptoms. Alcohol consumption was protective, but only for moderate drinkers.
Table 2:
Hazard Ratios (95% CI) of losing HA status in the MHAS Mexican cohort*
| Basal characteristics | Crude | Adjusted | ||||
|---|---|---|---|---|---|---|
| HR | 95% CI | P- value | HR | 95% CI | P- value | |
| Age | 1.03 | (1.03,1.04) | <0.01 | 1.03 | (1.02, 1.03) | <0.01 |
| Female | 0.92 | (0.87,0.97) | 0.00 | 0.92 | (0.86, 0.99) | 0.02 |
| Schooling | 0.96 | (0.96,0.97) | <0.01 | 0.97 | (0.97, 0.98) | <0.01 |
| Married | 0.92 | (0.87,0.98) | 0.01 | 1.04 | (0.97, 1.12) | 0.30 |
| Alcohol | ||||||
| Low-risk drinker | 0.69 | (0.63,0.77) | <0.01 | 0.81 | (0.73, 0.91) | <0.01 |
| Heavy drinker | 0.73 | (0.51,0.87) | 0.04 | 0.82 | (0.78, 1.12) | 0.11 |
| Smoker (ever) | ||||||
| Former | 1.19 | (1.11,1.27) | <0.01 | 1.16 | (1.07, 1.25) | <0.01 |
| Current | 0.96 | (0.89,1.04) | 0.34 | 1.08 | (0.99, 1.18) | 0.09 |
| Exercise | 0.85 | (0.8,0.91) | <0.01 | 0.9 | (0.84, 0.96) | <0.01 |
| Depression | 1.23 | (1.15,1.31) | <0.01 | 1.12 | (1.04, 1.19) | <0.01 |
| Overweight and obesity | 1.22 | (1.15,1.29) | <0.01 | 1.24 | (1.16, 1.33) | <0.01 |
| Low weight | 0.96 | (0.88,1.05) | 0.42 | 0.91 | (0.82, 1) | 0.06 |
| Long-lived mother | 0.95 | (0.88,1.01) | 0.12 | 0.92 | (0.85, 0.99) | 0.02 |
| Long-lived father | 0.92 | (0.86,0.98) | 0.01 | 0.91 | (0.85, 0.98) | 0.01 |
Individuals aged 50 years and older
The odds ratios and confidence intervals for the bivariate and multivariable logistic models for HA at the end of the follow-up period are presented in Table 3 There were significant associations in the multivariate model between HA at age 77 and physical activity, age, underweight, schooling and maternal longevity (figure 3). Compared with physically inactive participants, those who were physically active at baseline had 1.17 (95% CI: 1.01 – 1.46) times greater odds of being healthy agers. Maternal longevity was significantly associated with HA at age 77 (OR=1.34, 95% CI: 1.04–1.72) as well as being underweight (OR=1.37, 95% CI: 1.01–1.85). The rest of the variables included in the analysis (depression, marital status, alcohol consumption, smoking habit, being obese or overweight, having a long-lived father), were not significantly associated with HA.
Table 3:
OR’s for healthy ageing at age 77 (HA77) in the MHAS Mexican cohort.
| Basal characteristics | Crude | Adjusted | ||||
|---|---|---|---|---|---|---|
| OR | P- value | 95% CI | OR | P- value | 95% CI | |
| Age | 1.17 | <0.01 | (1.14, 1.19) | 1.26 | <0.01 | (1.22, 1.3) |
| Female | 0.91 | 0.3 | (0.77, 1.09) | 0.81 | 0.08 | (0.63, 1.03) |
| Schooling | 1.02 | 0.11 | (1, 1.04) | 1.05 | <0.01 | (1.03, 1.08) |
| Married | 1.02 | 0.84 | (0.85, 1.21) | 0.97 | 0.79 | (0.77, 1.22) |
| Follow-up | 0.02 | 1.17 | (1.25, 0) | 1.34 | <0.01 | (1.28, 1.4) |
| Depression | 0.85 | 0.09 | (0.7, 1.03) | 0.90 | 0.34 | (0.72, 1.12) |
| Alcohol | ||||||
| Low-risk drinker | 1.29 | 0.17 | (0.9, 1.86) | 1.32 | 0.20 | (0.86, 2.02) |
| Heavy drinker | 1.13 | 0.79 | (0.46, 2.77) | 1.40 | 0.54 | (0.48, 4.15) |
| Smoker (ever) | 0.09 | 0.83 | (0.67, 1.17) | 0.83 | 0.10 | (0.66, 1.04) |
| Exercise | 1.14 | 0.16 | (0.95, 1.38) | 1.17 | 0.05 | (1.01, 1.46) |
| Overweight | 0.9 | 0.39 | (0.72, 1.13) | 0.85 | 0.27 | (0.65, 1.13) |
| Obesity | 0.72 | 0.01 | (0.57, 0.91) | 0.97 | 0.87 | (0.72, 1.32) |
| Underweight | 1.4 | 0.01 | (1.1, 1.79) | 1.37 | 0.04 | (1.01, 1.85) |
| Long-lived mother | 1.22 | 0.06 | (0.99, 1.5) | 1.34 | 0.03 | (1.04, 1.72) |
| Long-lived father | 1.05 | 0.63 | (0.86, 1.29) | 1.05 | 0.73 | (0.81, 1.34) |
Figure 3:
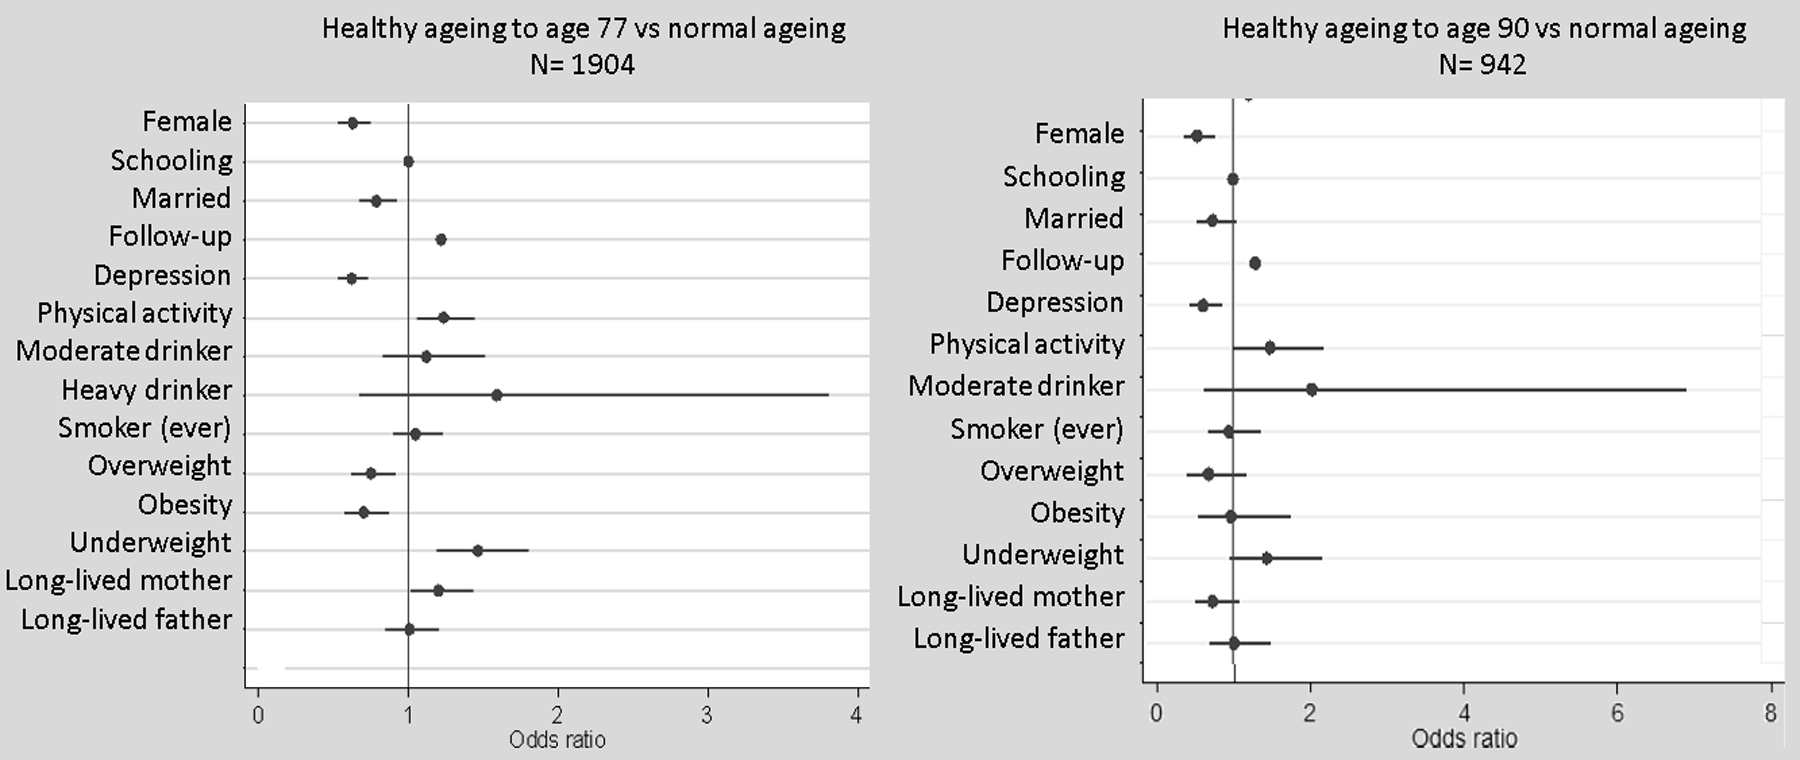
OR (95% CI) for the association of healthy ageing and health related variables from the Mexican Healthy Aging Study 2001–2015.
OR: odds ratio; CI: confidence Interval, Multivariate logistic models adjusted for age, sex and education level., Healthy ageing defined as survival to age 77 or 90 free of major chronic diseases, ‘Current or former
In contrast, healthy aging at age 90 was only significantly associated with age, sex, physical activity and depression, (Table 4). Physically active participants were 1.5 (95% CI: 1.01–2.24) more likely to be healthy agers in comparison with inactive participants in the multivariate model. Participants who reported depressive symptoms were less likely to be healthy agers at 90 years (OR= 0.59 (95% CI: 0.41–0,85). Being female was negatively associated with HA (OR=0.58; 95% CI: 0.37 – 0.89)).
Table 4:
OR’s for healthy ageing at age 90 (HA90). Logistic models.
| Basal characteristics | Bivariate model | Multivariate model | ||||
|---|---|---|---|---|---|---|
| OR | P- value | 95% CI | OR | P- value | 95% CI | |
| Age | 1.09 | <0.01 | (1.05, 1.14) | 1.21 | <0.01 | (1.15, 1.27) |
| Female | 0.85 | 0.35 | (0.61, 1.19) | 0.51 | <0.01 | (0.34, 0.76) |
| Schooling | 1.02 | 0.17 | (0.99, 1.04) | 1.00 | 0.74 | (0.98, 1.03) |
| Married | 1.1 | 0.58 | (0.79, 1.53) | 0.72 | 0.09 | (0.5, 1.05) |
| Follow-up | 0.04 | 1.22 | (1.38, 0) | 1.30 | <0.01 | (1.23, 1.38) |
| Depression | 0.72 | 0.08 | (0.5, 1.04) | 0.59 | <0.01 | (0.41, 0.85) |
| Alcohol | ||||||
| Low-risk drinker | 2.99 | 0.11 | (0.8, 11.26) | 2.08* | 0.25 | (0.6, 7.19) |
| Heavy drinker | 1.2 | 0.88 | (0.11, 13.28) | |||
| Smoker (ever) | 0.18 | 0.73 | (0.03,1.43) | 0.95 | 0.80 | (0.66, 1.39) |
| Exercise | 1.59 | 0.02 | (1.07, 2.35) | 1.50 | 0.05 | (1.01, 2.24) |
| Overweight | 1.17 | 0.55 | (0.7, 1.97) | 0.67 | 0.17 | (0.38, 1.18) |
| Obesity | 0.6 | 0.01 | (0.4, 0.9) | 0.98 | 0.94 | (0.53, 1.79) |
| Underweight | 1.46 | 0.05 | (0.99, 2.14) | 1.46 | 0.08 | (0.96, 2.21) |
| Long-lived mother | 0.87 | 0.44 | (0.6, 1.25) | 0.73 | 0.13 | (0.48, 1.1) |
| Long-lived father | 0.97 | 0.88 | (0.68, 1.39) | 1.02 | 0.94 | (0.68, 1.52) |
In the multivariate model we just adjusted by current drinker because the low percentage of heavy drinkers
4. Discussion
In a large population-based study of older individuals living in Mexico we observed that HA at age 77 was positively associated with physical activity, underweight and having a long-lived mother. In contrast, at age 90, only participants being physically active had increased odds of aging healthily.
Our findings agree with most previous studies which have shown the importance of lifestyle factors on HA [2, 5–7, 9]. In prior longitudinal observational studies, a positive association between physical activity and HA has consistently been shown [5–7], independently of the definition and variable operationalization. In a study in five Latin American countries [2], physically active participants were most likely to be successful agers at follow-up. When restricting the analysis to the Mexican participants, authors found a significant association with physical activity and smoking. In contrast, in our study, smoking was not associated with HA, but it was negatively associated with achieving HA in the younger population. A possible explanation is that the main deleterious effects of smoking are presented at younger ages, and when we excluded this population in the second analysis (HA77 and HA90), this effect was not significant. Another possible explanation is that in this population, intensity of smoking was low. Only 40% of those who have ever smoked were current smokers, and about 60% of them smoked ≤ 6 cigarettes/day. We found a positive relationship between moderate alcohol consumption and achieving HA. However, these results were only observed in the HR analysis which included younger participants, while the effect of alcohol was not significant in the HA77 and HA90 analysis. Also, only a limited number of participants (<1%) were considered heavy-drinkers, therefore our sample is limited and results might be inconclusive. It is important to note that the reported association of alcohol consumption with HA is not consistent, and many have not found a significant relationship [24]
In Mexico, two previous studies analyzed the association between excess body weight and overall mortality and found a significant relationship [4, 12]. In our study, in the HR analysis, overweight and obesity increased the risk of losing HA, and no relationship was found with HA77 and HA90. This result might be explained because higher BMI in midlife has been associated with unhealthy survival [6], which in our study would lead to loss of the HA status in midlife. Therefore, many prevalent cases, which lost HA status in midlife, were excluded from the analysis and this relationship might be understated. Further studies with a longer period of follow-up are needed. In addition to overweight, also a low BMI was associated with non-survival in an earlier study [9]. In our study however, being underweight was a significant protective factor for HA77. This result might be explained by the cut-off point used: only 13% of those categorized as underweight had a BMI<18, the rest of the group had BMI’s between 18–22, which might be considered as “normal” in other populations.
In our study, women tend to live longer, but male participants had greater odds for HA. Although previous studies show conflicting results, a study in elderly in western Mexico found a higher prevalence of HA in male participants [13]. A possible explanation is that all of the disease-related information was self-reported and that some chronic conditions are underdiagnosed in the Mexican population, especially in men [25], so we cannot discard misclassification. For example, almost half of the diabetics do not know their condition and this percentage is even higher (55%) in the case of diabetic men [25].
Depression is recognized as the leading cause of disability worldwide [26] and an important mortality risk factor [27]. For example, a recent study found that depression was associated with all-cause mortality (HR=1.17; 95% CI 1.15–1.18) [27]. In our study, in midlife adults, depression was associated with a 12% greater hazard risk of losing HA status (chronic disease, non-normal physical functioning or dying) after 14 years of follow-up. Self-reported depression was also a risk factor for losing the HA status in the HA90 group. There is a limited number of studies in Mexico analyzing the effect of depression on health outcomes late in life [28]; the results presented in our study highlight the need to prevent and treat this condition.
Several previous studies have found that individuals with long-lived parents tend to age healthier [3, 29]. Parental longevity influences aging not only because of genetics, but also because of shared lifestyle and environmental factors [3]. Results from a recent study from the Women’s Health Initiative found that having a mother that achieved HA correlated with HA in postmenopausal women (OR, 1.25; 95% CI, 1.11–1.42) [3]. In contrast, the HA status of the fathers was not significantly associated with their daughters’ HA [3]. Similar results were obtained in our study: maternal longevity was associated with HA but only at age 77. In concordance with Shadyab et al.[3], paternal longevity was not significantly associated with HA, which might be because we lacked information on parental cause of death. This is relevant because injuries and violence are the leading causes of death for young Mexican males [30]. In our study, parental longevity was not significantly associated with HA90. One possible explanation to the absence of significance is the subsample size, only 942 were followed up, which are less than half of the original sample.
Our study has some limitations. Potential measurement error could have occurred, especially because all of the information was self-reported. Furthermore, questions were too broad to completely assess the impact of different frequencies and intensities in lifestyle factors, which could have reduced the effect size of some associations, for example in the case of smoking. In addition, only the lifestyle factors collected in the study were analyzed, and residual confounding by unmeasured factors, such as dietary or sleeping habits, cannot be dismissed. Finally, in contrast with the original cohort, in our study there was an overrepresentation of men; however, we did not find any other significant difference in the studied variables.
The main strength of our study is the long, 14-year follow-up of old Mexican individuals which included people with exceptional longevity. Our prospective study has also considered the effect of parental longevity, whereas previous studies have only included lifestyle factors [2]. To the best of our knowledge, this is the first study that found a relationship between healthy ageing in Mexicans and maternal longevity.
5. Conclusion
We have found that in a representative Mexican population study, modifiable lifestyle factors, including physical activity, depression and body weight, are associated with healthy aging. Maternal longevity is related to healthy aging at age 77 which might suggest a genetic determinant. In accordance with studies carried out in Caucasian and Asian populations, our findings suggest that not only genetic but also behavioral factors have an important influence on healthy aging and longevity. Future studies with life course data are needed to clarify how lifestyle and genetic factors interact to influence healthy aging.
Acknowledgements
CAQ holds a postdoctoral fellowship from the Metropolitan Autonomous University. RB is a participant in the US Bone & Joint Initiative’s Young Investigator Program.
The MHAS (Mexican Health and Aging Study) is partly sponsored by the National Institute of Health/National Institute on Aging (grant number NIH r01ag018016) and the INEGI in Mexico. Data files and documentation are for public use and available at http://www.MHASweb.org
Footnotes
Declaration of interest. The authors have no interests to declare.
Data Statement.
Data used in the preparation of this manuscript are freely available from the sources cited.
Ethical issues.
Our study is a secondary analysis of existing data from the Mexican Health and Aging Study. In the original study, a signed informed consent was obtained from each participant prior to data collection. The study protocol was approved by the Institutional Review Boards or Ethics Committees of the University of Texas Medical Branch in the United States, the Instituto Nacional de Estadística y Geografía, the Instituto Nacional de Salud Pública and the Instituto Nacional de Geriatría in Mexico [19].
References
- [1].United Nations, World Population Ageing 2015, New Yor, USA, 2015. [Google Scholar]
- [2].Daskalopoulou C, Koukounari A, Ayuso-Mateos JL, Prince M, Prina AM, Associations of Lifestyle Behaviour and Healthy Ageing in Five Latin American and the Caribbean Countries-A 10/66 Population-Based Cohort Study, Nutrients 10(11) (2018). [DOI] [PMC free article] [PubMed] [Google Scholar]
- [3].Shadyab AH, Manson JE, Li W, Gass M, Brunner RL, Naughton MJ, Cannell B, Howard BV, LaCroix AZ, Parental longevity predicts healthy ageing among women, Age Ageing 47(6) (2018) 853–860. [DOI] [PMC free article] [PubMed] [Google Scholar]
- [4].Palloni A, Beltran-Sanchez H, Novak B, Pinto G, Wong R, Adult obesity, disease and longevity in Mexico, Salud Publica Mex 57 Suppl 1 (2015) S22–30. [DOI] [PMC free article] [PubMed] [Google Scholar]
- [5].Atallah N, Adjibade M, Lelong H, Hercberg S, Galan P, Assmann KE, Kesse-Guyot E, How Healthy Lifestyle Factors at Midlife Relate to Healthy Aging, Nutrients 10(7) (2018). [DOI] [PMC free article] [PubMed] [Google Scholar]
- [6].Urtamo A, Huohvanainen E, Pitkala KH, Strandberg TE, Midlife predictors of active and healthy aging (AHA) among older businessmen, Aging Clin Exp Res 31(2) (2019) 225–231. [DOI] [PMC free article] [PubMed] [Google Scholar]
- [7].Jia H, Zack MM, Gottesman II, Thompson WW, Associations of Smoking, Physical Inactivity, Heavy Drinking, and Obesity with Quality-Adjusted Life Expectancy among US Adults with Depression, Value Health 21(3) (2018) 364–371. [DOI] [PubMed] [Google Scholar]
- [8].Beekman M, Blanche H, Perola M, Hervonen A, Bezrukov V, Sikora E, Flachsbart F, Christiansen L, De Craen AJ, Kirkwood TB, Rea IM, Poulain M, Robine JM, Valensin S, Stazi MA, Passarino G, Deiana L, Gonos ES, Paternoster L, Sorensen TI, Tan Q, Helmer Q, van den Akker EB, Deelen J, Martella F, Cordell HJ, Ayers KL, Vaupel JW, Tornwall O, Johnson TE, Schreiber S, Lathrop M, Skytthe A, Westendorp RG, Christensen K, Gampe J, Nebel A, Houwing-Duistermaat JJ, Slagboom PE, Franceschi C, G. consortium, Genome-wide linkage analysis for human longevity: Genetics of Healthy Aging Study, Aging Cell 12(2) (2013) 184–93. [DOI] [PMC free article] [PubMed] [Google Scholar]
- [9].Bell CL, Chen R, Masaki K, Yee P, He Q, Grove J, Donlon T, Curb JD, Willcox DC, Poon LW, Willcox BJ, Late-life factors associated with healthy aging in older men, J Am Geriatr Soc 62(5) (2014) 880–8. [DOI] [PMC free article] [PubMed] [Google Scholar]
- [10].Aida J, Cable N, Zaninotto P, Tsuboya T, Tsakos G, Matsuyama Y, Ito K, Osaka K, Kondo K, Marmot MG, Watt RG, Social and Behavioural Determinants of the Difference in Survival among Older Adults in Japan and England, Gerontology 64(3) (2018) 266–277. [DOI] [PMC free article] [PubMed] [Google Scholar]
- [11].CONAPO (Consejo Nacional de Población), Proyecciones de la Población 2010–2050, Mexico City, Mexico: , 2012, 78–99. [Google Scholar]
- [12].Monteverde M, Novak B, Obesidad y Esperanza de Vida en Mexico Obesity and life expectancy in Mexico, Poblac Salud Mesoam 6(1) (2008). [PMC free article] [PubMed] [Google Scholar]
- [13].Arias-Merino ED, Mendoza-Ruvalcaba NM, Arias-Merino MJ, Cueva-Contreras J, Vazquez Arias C, Prevalence of successful aging in the elderly in Western Mexico, Curr Gerontol Geriatr Res 2012 (2012) 460249. [DOI] [PMC free article] [PubMed] [Google Scholar]
- [14].M.H.a.A.S. MHAS, Data Files and Documentation (public use): Mexican Health and Aging Study, 2015. [Google Scholar]
- [15].INEGI, Informe de resultados del operativo de campo de la Encuesta Nacional sobre Salud y Envejecimiento enMéxico (ENASEM) Fieldwork report. , 2015. [Google Scholar]
- [16].Wong R, Michaels-Obregon A, Palloni A, Cohort Profile: The Mexican Health and Aging Study (MHAS), International Journal of Epidemiology 46(2) (2015) e2–e2. [DOI] [PMC free article] [PubMed] [Google Scholar]
- [17].CENETEC, Guía de Referencia rápida. Evaluación y Seguimiento Nutricional del Adulto Mayor en el Primer Nivel de Atención, Mexico City, Mexico., 2014 [Google Scholar]
- [18].Secretaria de Salud, NORMA Oficial Mexicana NOM-008-SSA3–2017, Para el tratamiento integral del sobrepeso y la obesidad, Mexico City, Mexico., 2017. [Google Scholar]
- [19].N.I.o.A.A.a.A. (NIAAS), Drinking Levels Defined, 2015. https://www.niaaa.nih.gov/alcohol-health/overview-alcohol-consumption/moderate-binge-drinking. (Accessed 08/27/2019 2019).
- [20].Rowe JW, Kahn RL, Successful Aging1, The Gerontologist 37(4) (1997) 433–440. [DOI] [PubMed] [Google Scholar]
- [21].Mejia-Arango S, Gutierrez LM, Prevalence and incidence rates of dementia and cognitive impairment no dementia in the Mexican population: data from the Mexican Health and Aging Study, J Aging Health 23(7) (2011) 1050–74. [DOI] [PMC free article] [PubMed] [Google Scholar]
- [22].Bank World, Mexico country profile Washington, D.C. USA, 2017. [Google Scholar]
- [23].Yates LB, Djousse L, Kurth T, Buring JE, Gaziano JM, Exceptional longevity in men: modifiable factors associated with survival and function to age 90 years, Arch Intern Med 168(3) (2008) 284–90. [DOI] [PubMed] [Google Scholar]
- [24].Daskalopoulou C, Stubbs B, Kralj C, Koukounari A, Prince M, Prina AM, Associations of smoking and alcohol consumption with healthy ageing: a systematic review and meta-analysis of longitudinal studies, BMJ Open 8(4) (2018) e019540. [DOI] [PMC free article] [PubMed] [Google Scholar]
- [25].Villalpando S, de la Cruz V, Rojas R, Shamah-Levy T, Avila MA, Gaona B, Rebollar R, Hernandez L, Prevalence and distribution of type 2 diabetes mellitus in Mexican adult population: a probabilistic survey, Salud Publica Mex 52 Suppl 1 (2010) S19–26. [DOI] [PubMed] [Google Scholar]
- [26].Friedrich MJ, Depression Is the Leading Cause of Disability Around the World, JAMA 317(15) (2017) 1517. [DOI] [PubMed] [Google Scholar]
- [27].Zivin K, Yosef M, Miller EM, Valenstein M, Duffy S, Kales HC, Vijan S, Kim HM, Associations between depression and all-cause and cause-specific risk of death: a retrospective cohort study in the Veterans Health Administration, J Psychosom Res 78(4) (2015) 324–31. [DOI] [PubMed] [Google Scholar]
- [28].Garcia-Pena C, Wagner FA, Sanchez-Garcia S, Juarez-Cedillo T, Espinel-Bermudez C, Garcia-Gonzalez JJ, Gallegos-Carrillo K, Franco-Marina F, Gallo JJ, Depressive symptoms among older adults in Mexico City, J Gen Intern Med 23(12) (2008) 1973–80. [DOI] [PMC free article] [PubMed] [Google Scholar]
- [29].Bucci L, Ostan R, Cevenini E, Pini E, Scurti M, Vitale G, Mari D, Caruso C, Sansoni P, Fanelli F, Pasquali R, Gueresi P, Franceschi C, Monti D, Centenarians’ offspring as a model of healthy aging: a reappraisal of the data on Italian subjects and a comprehensive overview, Aging (Albany NY) 8(3) (2016) 510–9. [DOI] [PMC free article] [PubMed] [Google Scholar]
- [30].Gonzalez-Perez GJ, Vega-Lopez MG, Souza ER, Pinto LW, Violence deaths and its impact on life expectancy: a comparison between Mexico and Brazil, Cien Saude Colet 22(9) (2017) 2797–2809. [DOI] [PubMed] [Google Scholar]