Abstract
Objective:
Quantitative apparent diffusion coefficient (ADC) values of diffusion weighted imaging (DWI) could be applied to grade gliomas. This meta-analysis was conducted to assess the accuracy of ADC analysis in differentiating high-grade (HGGs) from low-grade gliomas (LGGs).
Methods:
PubMed, Cochrane library, Science Direct, and Embase were searched to identify suitable studies up to September 1, 2018. The quality of studies was evaluated by the quality assessment of diagnostic accuracy studies (QUADAS 2). We estimated the pooled sensitivity, specificity, positive and negative likelihood ratios (LR), diagnostic accuracy ratio (DOR) with 95% confidence intervals (CI), and determined the accuracy of the data by using the summary receiver operating characteristic (SROC) and calculating the area under the curve (AUC) to identity the accuracy of ADC analysis in grading gliomas.
Results:
Eighteen studies including 1172 patients were included and analyzed. The pooled sensitivity, specificity, PLR, NLR, DOR, and AUC with 95% CIs of DWI with b values of 1000 s/mm2 for separating HGGs from LGGs were 0.81 (95% CI 0.75–0.86), 0.87 (95% CI 0.81–0.91), 6.1 (95% CI 4.2–8.9), 0.22 (95% CI 0.17–0.29), 28 (95% CI 17–45), and 0.91 (95% CI 0.88–0.93), respectively. DWI with b values of 3000 s/mm2 showed slightly higher accuracy than that of 1000 (sensitivity 0.80, specificity 0.90 and AUC 0.92). Meta-regression analyses showed that field strengths and b values had significant impacts on diagnostic efficacy. Deeks testing confirmed no significant publication bias in all studies.
Conclusions:
This meta-analysis suggested that ADC analysis of DWI have high accuracy in differentiating HGGs from LGGs. Standardized methodology is warranted to guide the use of this technique for clinical decision-making.
Keywords: apparent diffusion coefficient, diffusion weighted imaging, glioma, meta-analysis
1. Introduction
Gliomas are the most common vtype of primary malignant brain tumor. According to the 2007 World Health Organization (WHO) tumor classification, gliomas are categorized into grades I–IV, where III–IV are high-grade gliomas (HGGs), and I–II are low-grade gliomas (LGGs).[1] HGG is highly aggressive tumor, which exhibit great aggression and proliferative activity and has a dismal prognosis despite various therapeutic managements. While LGG is low malignant tumor associated with a longer life expectancy.[2–4] Surgical resection is the preferred treatment for most gliomas. After surgery, HGG normally requires adjuvant therapy, such as radiotherapy and chemotherapy to prevent rapid recurrence, while LGG is usually followed by close observation.[5] Due to the high malignancy of HGG, complete surgical resection of tumor is critical for individualizing therapeutic strategies. Hence, identification of tumor level prior to surgery is of important significance for intraoperative decision-making.
Magnetic resonance imaging (MRI) is the imaging method of first choice for depicting gliomas. Most assessments used to differentiate gliomas were based on contrast enhancement of the tumor.[6] With the development of technology, several physiological MRI techniques including MR spectroscopy, diffusion-weighted imaging (DWI), and perfusion-weighted imaging (PWI), have also been applied to grading gliomas.[7,8] The ADC derived from DWI is negatively correlated with cell proliferation indices, which has shown increasing potential as a noninvasive imaging biomarker for preoperative tumor grading.[9,10] Various studies have investigated the role of DWI with quantitative ADC in the differentiation between HGGs from LGGs.[11,12] However, these studies were inconclusive because of insufficient sample and different diagnostic algorithms. The aim of this meta-analysis was to systematically evaluate the accuracy of DWI- derived ADC for discriminating HGGs from LGGs.
2. Methods
2.1. Search strategy
As this is a meta-analysis, ethical approval was not necessary. This systematic review and the meta-analysis was performed following the guidelines for the diagnostic studies.[13]
PubMed, Cochrane library, Science Direct, and Embase were searched on September 1, 2018, and no start date limit was applied. The search key words were “diffusion weighted imaging,” “DWI,” “apparent diffusion coefficient,” “glioma,” “brain neoplasm,” and “brain tumor.” No language restriction was exposed. Reference lists of relevant articles were also manually searched. Two reviewers independently reviewed the articles. Disagreements were resolved by consensus.
2.2. Study selection criteria
The studies were selected on the basis of the following criteria:
-
1.
Clinical trials assessing the diagnostic accuracy of DWI for differentiating HGGs from LGGs;
-
2.
using histopathology as criterion standard;
-
3.
Sufficient information to calculate true positive (TP), false-positive (FP), true-negative (TN), and false negative (FN).
Excluded criteria: combination with other methods, animal studies, case reports, abstracts, without sufficient calculable data, duplicated reports, or studies based on the same study.
One author (Wang QP) conducted the initial searching according to the inclusion and exclusion criteria. Then, two investigators (Lei DQ and Yuan Y) independently examined all potentially relevant articles. Disagreements were resolved by consensus.
2.3. Date extraction and quality assessment
Two investigators (Wang QP and Lei DQ) independently assessed the quality and potential bias and extracted the data of included studies. We extracted the following data: first author, year of publication, country, study design (retrospective or prospective), sample size, patient age, MRI field strengths, b values, mean ADC, cut-off values, TP, FP, TN, FN, sensitivity, and specificity values in regards to tumor grading. If the TP, FP, TN, and FN were not reported, we calculated backwards using indexes including sensitivity, specificity, positive predictive value (PPV), and negative predictive value (NPV).
The quality of each study was assessed based on the Quality Assessment of Diagnostic Accuracy Studies (QUADAS) guidelines, which is an established, evidence-based tool for systematic reviews of diagnostic studies designed.
2.4. Statistical analysis
Meta-analyses were performed using the software Stata 11.0. The pooled sensitivity, specificity, positive and negative likelihood ratios (LRs), and diagnostic odds ratio (DOR) were calculated using the extracted data of TP, TN, FP, and FN. The accuracy of the data was determined using a summary receiver operating characteristic plot (SROC) and summarizing that curve by calculating the area under the curve (AUC). In general, a diagnostic tool is regarded failed when AUC values were between 0.5 and 0.6, poor when AUC values were between 0.6 and 0.7, fair when AUC values were between 0.7 and 0.8, good when AUC values were between 0.8 and 0.9, and excellent when AUC values were between 0.9 and 1.[14]
2.5. Meta-regression and subgroup analyses
We performed meta-regression and subgroup analyses to observe the effects caused by substantial heterogeneity of the different diagnostic algorithms. Studies were grouped based on MRI performed at different field strengths (3.0 or 1.5 T), study design (retrospective or prospective) and b values (3000 or 1000 s/mm2).
2.6. Publication bias
The publication bias was assessed using Deeks funnel plot asymmetry test, where P < .05 suggests a potential publication bias.
3. Results
3.1. Literature research
A total of 181 studies were initially identified using the above mentioned search strategy, which were then screened in title and abstract. Of these, 75 articles were further evaluated in full text. According to the inclusion criteria, 18 studies[7,11,12,15–29] were retrieved. Five articles were excluded because relevant data could not be extracted. Three studies which could not provide enough data to construct the 2 × 2 table were also excluded. The study selection process is shown in Figure 1.
Figure 1.
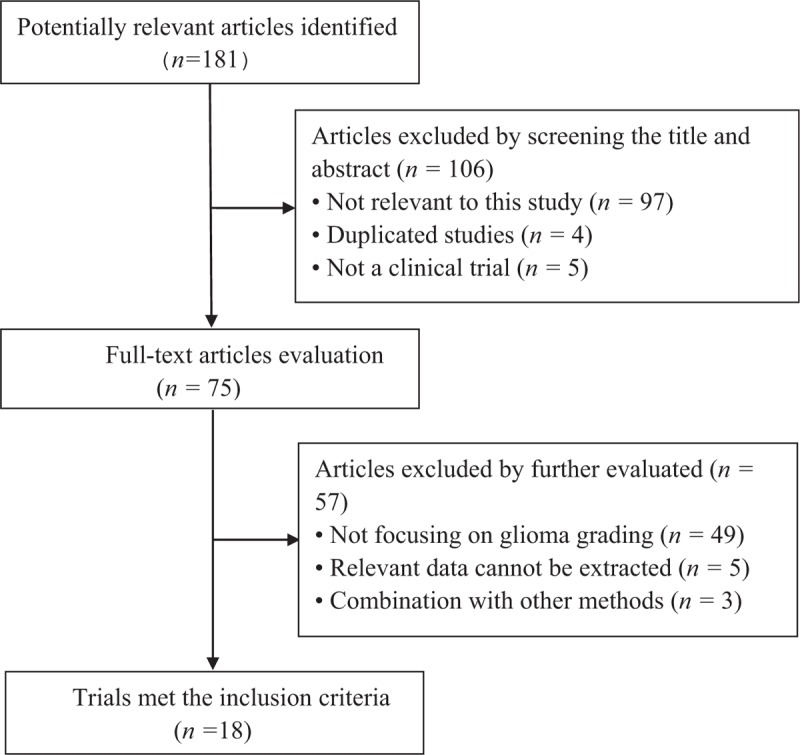
Results of literature search.
3.2. Study characteristics
Ultimately, 18 studies with 1172 participants were enrolled in this meta-analysis. The detailed characteristics of included studies were given in Table 1. Three studies were prospective and others were retrospective cohort studies. The MR examinations were performed on a 1.5 T scanner in eight studies, 3.0 T in nine studies and one study not mentioned. ADC maps were generated from DWI in the b-value of 1000 s/mm2 in 13 studies and 3000 s/mm2 in 1 study. Four studies evaluated the diagnostic performance of ADC maps at these two b values. The mean ADC values of HGGs and LGGs ranged from 0.647–1.274 and 0.863–1.534, respectively. Eight studies took minimum ADC as differentiation criterion with cut-off values ranging from 0.216 to 1.60. Three studies used ADC ratio (ADCR) as differentiation criterion and the cut-off values ranged from 0.86 to 1.50. Mean ADC values were taken as differentiation criterion in 7 studies and the cut-off values ranged from 0.70 to 1.252.
Table 1.
Baseline characteristics of included studies.

3.3. Quality of included studies
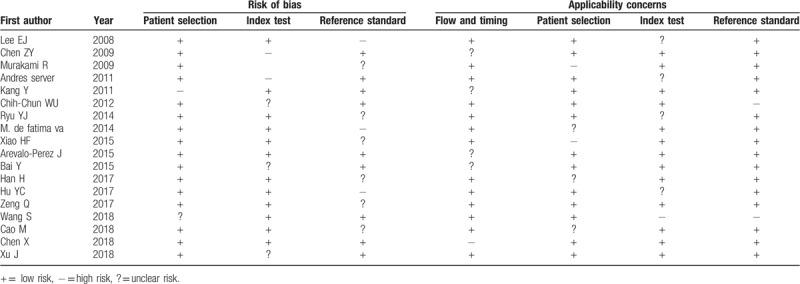
The quality assessment of included studies is presented in Table 2 using QUADAS checklist. Overall, the study quality was satisfactory.
Table 2.
Results of the QUADAS-2 quality assessment of included studies.
3.4. Pooled results of ADC3000
Five studies evaluated the diagnostic performance of ADC maps at b values of 3000 s/mm2. The pooled sensitivity and specificity of DWI for separating HGGs from LGGs were 0.80 (95% CI 0.74–0.85) and 0.90 (95% CI 0.82–0.94), respectively. The forest plots were shown in Figure 2. The pooled PLR and NLR were 7.7 (95% CI 4.4–13.6) and 0.22 (95% CI 0.16–0.29), respectively. The DOR was 35 (95% CI 17–73). The AUC was 0.92 (95% CI 0.90–0.94). The SROC curve was shown in Figure 3. The results demonstrating excellent diagnostic performance of ADC derived from DWI with b values of 3000 s/mm2 in discrimination of HGGs from LGGs.
Figure 2.
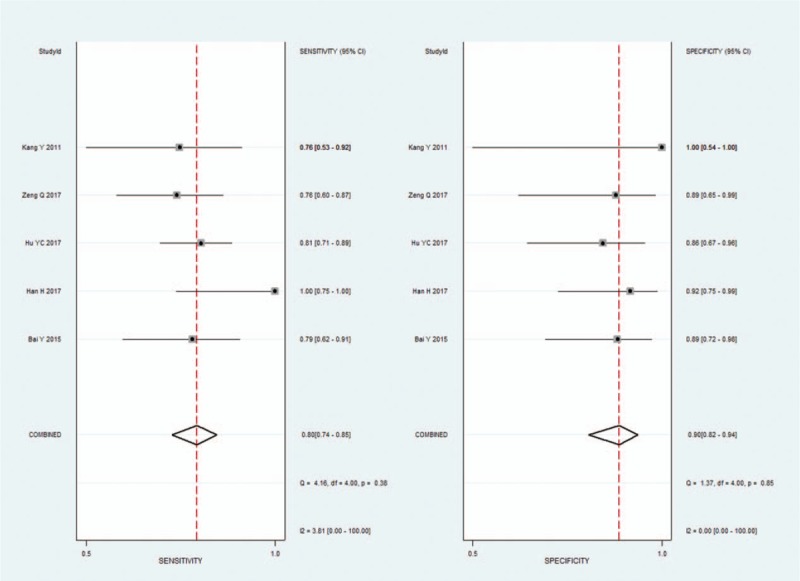
Pooled estimates of diagnostic performance of ADC values derived from DWI at b values of 3000 s/mm2 to differentiate high-grade from low-grade gliomas.
Figure 3.

Summary receiver operating characteristics (SROC) curve of ADC values derived from DWI at b values of 3000 s/mm2 to differentiate high-grade from low-grade gliomas.
3.5. Pooled results of ADC1000
Seventeen studies evaluated the diagnostic performance of ADC maps at b values of 1000 s/mm2. The pooled sensitivity, specificity, PLR, NLR, and DOR with 95% CIs of DWI with b values of 1000 s/mm2 for separating HGGs from LGGs were 0.81 (95% CI 0.75–0.86), 0.87 (95% CI 0.81–0.91), 6.1 (95% CI 4.2–8.9), 0.22 (95% CI 0.17–0.29), and 28 (95% CI 17–45), respectively. The forest plots were shown in Figure 4. The SROC curve analysis was used to summarize overall diagnostic accuracy. The AUC was 0.91 (95% CI 0.88–0.93). The SROC curve was shown in Figure 5. ADC1000 showed high diagnostic performance, but slightly lower than that of ADC3000 in discrimination of HGGs from LGGs.
Figure 4.

Pooled estimates of diagnostic performance of ADC values derived from DWI at b values of 1000 s/mm2 to differentiate high-grade from low-grade gliomas.
Figure 5.
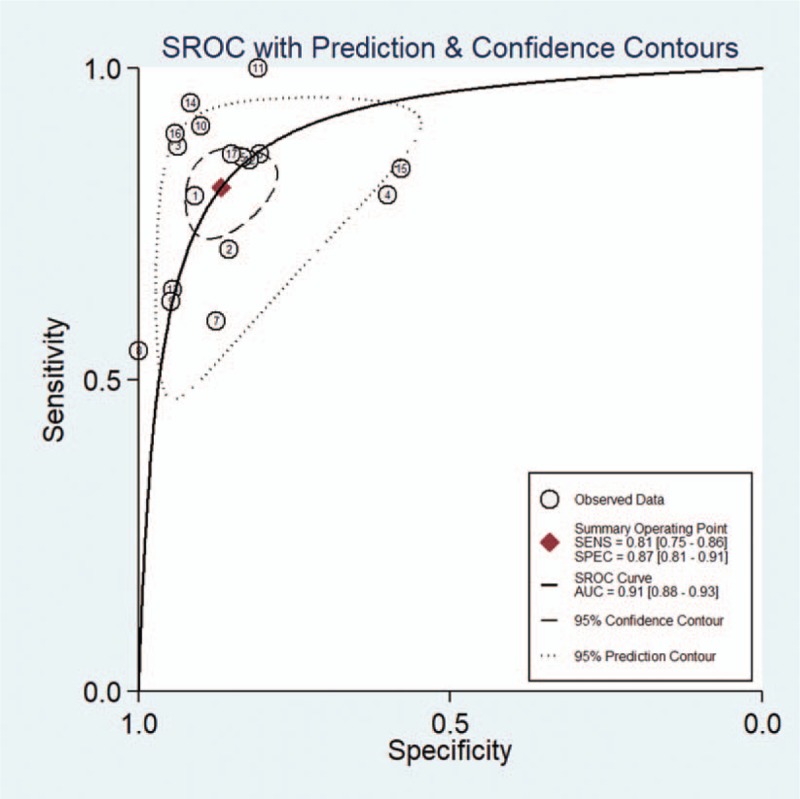
Summary receiver operating characteristics (SROC) curve of ADC values derived from DWI at b values of 1000 s/mm2 to differentiate high-grade from low-grade gliomas.
3.6. Meta-regression and subgroup analyses
The results of the meta-regression and subgroup analyses were presented in Figure 6. The study design type (prospective or retrospective) had no impact on diagnostic accuracy. Two other factors field strengths and b values had significant impact on both sensitivity and specificity. The results indicated that higher field strengths and b values might improve the diagnostic performance of ADC derived from DWI in grading gliomas.
Figure 6.

Meta-regression and subgroup analyses of ADC values derived from DWI to differentiate high-grade from low-grade gliomas.
3.7. Publication bias
Publication bias was examined using Deeks plot asymmetry test, and the funnel plot based on ADC1000 did not reveal significant publication bias (P = .48). The funnel plots were shown in Figure 7.
Figure 7.
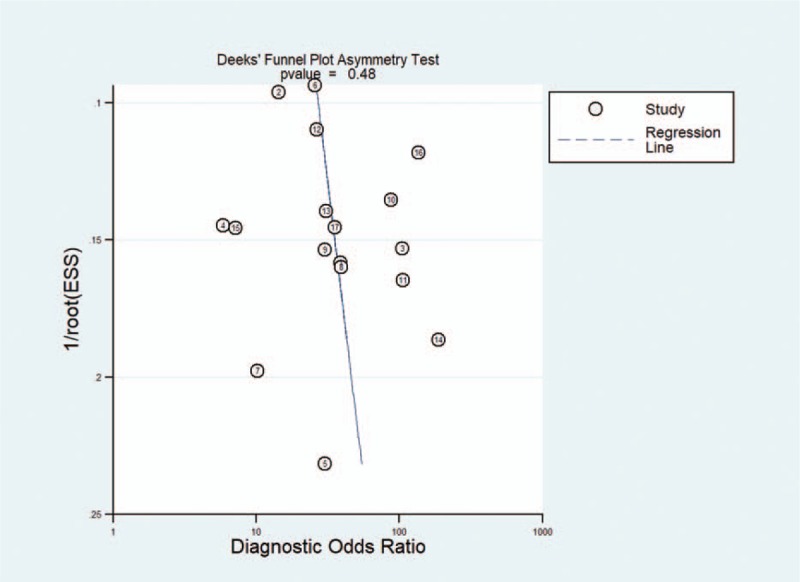
Deeks funnel plots indicating no publication bias (P = .48).
4. Discussion
We assessed the accuracy of ADC derived from DWI in differentiating HGGs from LGGs. The pooled meta-analysis showed the AUC of b values of 3000 and 1000 s/mm2 were 0.92 and 0.91, respectively. The results demonstrated that ADC derived from DWI had high diagnostic performance in discrimination of HGGs from LGGs.
Because the prognosis and the therapeutic approach differ considerably according to the grade of glioma, accurate grading of tumor is of vital importance. The histopathology is the gold standard for diagnosis of glioma, but it is an invasive procedure. To provide more accurate information and avoid unnecessary operations of glioma, the role of MR cannot be neglected. With the development of techniques, more and more metabolic and physiologic MR imaging, such as diffusion tensor imaging (DTI), MR spectroscopy, DWI, Dynamic susceptibility contrast (DSC) and Dynamic Contrast-enhanced (DCE) MRI, have been utilized in the assessment of glioma.[30–32] The utilization of DWI has facilitated the observation of microscopic movement of water protons in tissues.[33] Studies have discovered that ADC values derived from DWI are significantly higher in LGG than in HGG patients owing to the decreased cellularity and nuclear cytoplasmic ratio, which make it possible to apply DWI in grading glioma.[34] To date, there have been numerous reports on glioma grading using ADC values derived from DWI.[32,33] However, these studies with insufficient sample and differential diagnostic algorithms could not yield inconclusive results. We conduct this meta-analysis to systematically evaluate the accuracy of DWI for discriminating HGGs from LGGs.
This research demonstrated that DWI was useful for discrimination between HGGs and LGGs. In a published meta-analysis based on two kinds of diffusion MRI (DWI and DTI) for glioma grading, the total pooled sensitivity, specificity, and AUC were 85%, 80%, and 0.90%, respectively.[35] However, due to the differential diagnostic algorithms between two sequences, the results might be influenced by a number of heterogeneous factors. In another meta-analysis based on PWI for glioma grading, the pooled sensitivity, specificity and diagnostic odds ratio were 93%, 81%, and 55%, respectively.[36] The results shows that PWI is also a useful tool for discriminating glioma, however, PWI examination requires injection of contrast medium and the results are influenced by many factors, which makes it difficult to widely applicate. According to evidence from a comprehensive meta-analysis, the diagnostic accuracy of DWI in grading glioma is lower than MR spectroscopy, DSC and DCE MRI.[37] However, DWI has specific advantages over other metabolic and physiologic MR imaging that it is easy accessible, nonradioactive and less expensive, thus, this technique is easy to widespread utilize. Moreover, when combined with other MR sequences, the accuracy could be significantly improved.[29]
However, obvious heterogeneity between studies needs further consideration. Different field strengths (3.0 and 1.5 T), different b values used, and different cut-off values could give unexpected substandard results and affect the accuracy of the conclusion. Consistent with previous reports, the present study found that ADC maps obtained from higher b value DWI performed at higher field strengths MR systems were more effective than those obtained from lower parameters.[38] The literature reported inconsistent cut-off values. It's hard to draw a conclusion that which is the most appropriate cut-off value for different DWI parameters. We recommend that future studies adopt higher DWI parameters and lay down a standardized technique procedure.
It is worth noting that this study also had several limitations. First, different field strengths, b values used, and cut-off values and other heterogeneous factors among studies might influence the consistency of measurements. Second, a number of studies were based on limited participants, which might affect the accuracy of the results. Finally, although no publication bias was detected in this meta-analysis, its potential impact on conclusion could not be neglected. Therefore, well-conducted investigations using a standardized methodology are needed to confirm the discrimination value of ADC derived from DWI on gliomas.
In conclusion, our study suggested that DWI could be an accurate tool for discriminating gliomas. Higher MRI parameters and combination with other techniques might help to improve the diagnostic accuracy. However, more studies are warranted to verify a standardized methodology in the clinical practice.
Author contributions
Conceptualization: Qiang-ping Wang, Nanxiang Xiong.
Data curation: Qiang-ping Wang, De-qiang Lei.
Formal analysis: Qiang-ping Wang, De-qiang Lei.
Funding acquisition: Qiang-ping Wang, Ye Yuan.
Investigation: De-qiang Lei.
Methodology: De-qiang Lei, Ye Yuan, Nanxiang Xiong.
Resources: Ye Yuan.
Software: Ye Yuan.
Supervision: Nanxiang Xiong.
Writing – review & editing: Nanxiang Xiong.
Footnotes
Abbreviations: ADC = apparent diffusion coefficient, AUC = area under the curve, CI = confidence intervals, DOR = diagnostic accuracy ratio, DTI = diffusion tensor imaging, DWI = diffusion weighted imaging, FN = false negative, FP = false-positive, HGG = high-grade glioma, LGG = low-grade glioma, LR = likelihood ratios, MRI = magnetic resonance imaging, PWI = perfusion-weighted imaging, QUADAS = Quality Assessment of Diagnostic Accuracy Studies, SROC = summary receiver operating characteristic, TN = true-negative, TP = true positive.
How to cite this article: Wang Qp, Lei Dq, Yuan Y, Xiong Nx. Accuracy of ADC derived from DWI for differentiating high-grade from low-grade gliomas: Systematic review and meta-analysis. Medicine. 2020;99:8(e19254).
QW and DL contributed equally to this work.
The study was funded by The Funds for Creative Research of Union Hospital, Tongji Medical College, Huazhong University of Science and Technology (02.03.2017–65).
The authors have no conflicts of interest to disclose.
References
- [1].Louis DN, Ohgaki H, Wiestler OD, et al. The 2007 WHO classification of tumours of the central nervous system. Acta Neuropathol 2007;114:97–109. [DOI] [PMC free article] [PubMed] [Google Scholar]
- [2].Helseth R, Helseth E, Johannesen TB, et al. Overall survival, prognostic factors, and repeated surgery in a consecutive series of 516 patients with glioblastoma multiforme. Acta Neurol Scand 2010;122:159–67. [DOI] [PubMed] [Google Scholar]
- [3].Johnson DR, O’Neill BP. Glioblastoma survival in the United States before and during the temozolomide era. J Neurooncol 2012;107:359–64. [DOI] [PubMed] [Google Scholar]
- [4].McGirt MJ, Woodworth GF, Coon AL, et al. Independent predictors of morbidity after image-guided stereotactic brain biopsy: a risk assessment of 270 cases. J Neurosurg 2005;102:897–901. [DOI] [PubMed] [Google Scholar]
- [5].Woodworth GF, McGirt MJ, Samdani A, et al. Frameless image-guided stereotactic brain biopsy procedure: diagnostic yield, surgical morbidity, and comparison with the frame-based technique. J Neurosurg 2006;104:233–7. [DOI] [PubMed] [Google Scholar]
- [6].Brant-Zawadzki M, Berry I, Osaki L, et al. Gd-DTPA in clinical MR of the brain: 1. Intraaxial lesions. AJR Am J Roentgenol 1986;147:1223–30. [DOI] [PubMed] [Google Scholar]
- [7].Ryu YJ, Choi SH, Park SJ, et al. Glioma: application of whole-tumor texture analysis of diffusion-weighted imaging for the evaluation of tumor heterogeneity. PLoS One 2014;9:e108335. [DOI] [PMC free article] [PubMed] [Google Scholar]
- [8].Jackson A, O’Connor JP, Parker GJ, et al. Imaging tumor vascular heterogeneity and angiogenesis using dynamic contrast-enhanced magnetic resonance imaging. Clin Cancer Res 2007;13:3449–59. [DOI] [PubMed] [Google Scholar]
- [9].Guo AC, Cummings TJ, Dash RC, et al. Lymphomas and high-grade astrocytomas: comparison of water diffusibility and histologic characteristics. Radiology 2002;224:177–83. [DOI] [PubMed] [Google Scholar]
- [10].Higano S, Yun X, Kumabe T, et al. Malignant astrocytic tumors: clinical importance of apparent diffusion coefficient in prediction of grade and prognosis. Radiology 2006;241:839–46. [DOI] [PubMed] [Google Scholar]
- [11].Chen Z, Ma L, Lou X, et al. Diagnostic value of minimum apparent diffusion coefficient values in prediction of neuroepithelial tumor grading. J Magn Reson Imaging 2010;31:1331–8. [DOI] [PubMed] [Google Scholar]
- [12].Wu CC, Guo WY, Chen MH, et al. Direct measurement of the signal intensity of diffusion-weighted magnetic resonance imaging for preoperative grading and treatment guidance for brain gliomas. J Chin Med Assoc 2012;75:581–8. [DOI] [PubMed] [Google Scholar]
- [13].Moher D, Shamseer L, Clarke M, et al. Preferred reporting items for systematic review and meta-analysis protocols (PRISMA-P) 2015 statement. Syst Rev 2015;4:1. [DOI] [PMC free article] [PubMed] [Google Scholar]
- [14].Metz CE. Basic principles of ROC analysis. Semin Nucl Med 1978;8:283–98. [DOI] [PubMed] [Google Scholar]
- [15].Lee EJ, Lee SK, Agid R, et al. Preoperative grading of presumptive low-grade astrocytomas on MR imaging: diagnostic value of minimum apparent diffusion coefficient. AJNR Am J Neuroradiol 2008;29:1872–7. [DOI] [PMC free article] [PubMed] [Google Scholar]
- [16].Murakami R, Hirai T, Sugahara T, et al. Grading astrocytic tumors by using apparent diffusion coefficient parameters: superiority of a one- versus two-parameter pilot method. Radiology 2009;251:838–45. [DOI] [PubMed] [Google Scholar]
- [17].Server A, Kulle B, Gadmar OB, et al. Measurements of diagnostic examination performance using quantitative apparent diffusion coefficient and proton MR spectroscopic imaging in the preoperative evaluation of tumor grade in cerebral gliomas. Eur J Radiol 2011;80:462–70. [DOI] [PubMed] [Google Scholar]
- [18].Kang Y, Choi SH, Kim YJ, et al. Gliomas: Histogram analysis of apparent diffusion coefficient maps with standard- or high-b-value diffusion-weighted MR imaging—correlation with tumor grade. Radiology 2011;261:882–90. [DOI] [PubMed] [Google Scholar]
- [19].de Fatima Vasco Aragao M, Law M, Batista de Almeida D, et al. Comparison of perfusion, diffusion, and MR spectroscopy between low-grade enhancing pilocytic astrocytomas and high-grade astrocytomas. AJNR Am J Neuroradiol 2014;35:1495–502. [DOI] [PMC free article] [PubMed] [Google Scholar]
- [20].Xiao HF, Chen ZY, Lou X, et al. Astrocytic tumour grading: a comparative study of three-dimensional pseudocontinuous arterial spin labelling, dynamic susceptibility contrast-enhanced perfusion-weighted imaging, and diffusion-weighted imaging. Eur Radiol 2015;25:3423–30. [DOI] [PMC free article] [PubMed] [Google Scholar]
- [21].Arevalo-Perez J, Peck KK, Young RJ, et al. Dynamic contrast-enhanced perfusion MRI and diffusion-weighted imaging in grading of gliomas. J Neuroimaging 2015;25:792–8. [DOI] [PMC free article] [PubMed] [Google Scholar]
- [22].Bai Y, Lin Y, Tian J, et al. Grading of gliomas by using monoexponential, biexponential, and stretched exponential diffusion-weighted MR imaging and diffusion kurtosis MR imaging. Radiology 2016;278:496–504. [DOI] [PMC free article] [PubMed] [Google Scholar]
- [23].Han H, Han C, Wu X, et al. Preoperative grading of supratentorial nonenhancing gliomas by high b-value diffusion-weighted 3 T magnetic resonance imaging. J Neurooncol 2017;133:147–54. [DOI] [PubMed] [Google Scholar]
- [24].Hu YC, Yan LF, Sun Q, et al. Comparison between ultra-high and conventional mono b-value DWI for preoperative glioma grading. Oncotarget 2017;8:37884–95. [DOI] [PMC free article] [PubMed] [Google Scholar]
- [25].Zeng Q, Dong F, Shi F, et al. Apparent diffusion coefficient maps obtained from high b value diffusion-weighted imaging in the preoperative evaluation of gliomas at 3T: comparison with standard b value diffusion-weighted imaging. Eur Radiol 2017;27:5309–15. [DOI] [PubMed] [Google Scholar]
- [26].Wang S, Meng M, Zhang X, et al. Texture analysis of diffusion weighted imaging for the evaluation of glioma heterogeneity based on different regions of interest. Oncol Lett 2018;15:7297–304. [DOI] [PMC free article] [PubMed] [Google Scholar]
- [27].Cao M, Suo S, Han X, et al. Application of a simplified method for estimating perfusion derived from diffusion-weighted MR imaging in glioma grading. Front Aging Neurosci 2017;9:432. [DOI] [PMC free article] [PubMed] [Google Scholar]
- [28].Chen X, Jiang J, Shen N, et al. Stretched-exponential model diffusion-weighted imaging as a potential imaging marker in preoperative grading and assessment of proliferative activity of gliomas. Am J Transl Res 2018;10:2659–68. [PMC free article] [PubMed] [Google Scholar]
- [29].Xu J, Xu H, Zhang W, et al. Contribution of susceptibility- and diffusion-weighted magnetic resonance imaging for grading gliomas. Exp Ther Med 2018;15:5113–8. [DOI] [PMC free article] [PubMed] [Google Scholar]
- [30].Yang D, Korogi Y, Sugahara T, et al. Cerebral gliomas: prospective comparison of multivoxel 2D chemical-shift imaging proton MR spectroscopy, echoplanar perfusion and diffusion-weighted MRI. Neuroradiology 2002;44:656–66. [DOI] [PubMed] [Google Scholar]
- [31].Majos C, Julia-Sape M, Alonso J, et al. Brain tumor classification by proton MR spectroscopy: comparison of diagnostic accuracy at short and long TE. AJNR Am J Neuroradiol 2004;25:1696–704. [PMC free article] [PubMed] [Google Scholar]
- [32].Emblem KE, Nedregaard B, Nome T, et al. Glioma grading by using histogram analysis of blood volume heterogeneity from MR-derived cerebral blood volume maps. Radiology 2008;247:808–17. [DOI] [PubMed] [Google Scholar]
- [33].Yamasaki F, Kurisu K, Satoh K, et al. Apparent diffusion coefficient of human brain tumors at MR imaging. Radiology 2005;235:985–91. [DOI] [PubMed] [Google Scholar]
- [34].Yan R, Haopeng P, Xiaoyuan F, et al. Non-Gaussian diffusion MR imaging of glioma: comparisons of multiple diffusion parameters and correlation with histologic grade and MIB-1 (Ki-67 labeling) index. Neuroradiology 2016;58:121–32. [DOI] [PubMed] [Google Scholar]
- [35].Zhang L, Min Z, Tang M, et al. The utility of diffusion MRI with quantitative ADC measurements for differentiating high-grade from low-grade cerebral gliomas: evidence from a meta-analysis. J Neurol Sci 2017;373:9–15. [DOI] [PubMed] [Google Scholar]
- [36].Min ZG, Liu HJ, Li M, et al. Accuracy of MR perfusion weighted imaging for cerebral glioma grading: a meta-analysis. Zhonghua Yi Xue Za Zhi 2010;90:2927–31. [PubMed] [Google Scholar]
- [37].van Dijken BRJ, van Laar PJ, Holtman GA, et al. Diagnostic accuracy of magnetic resonance imaging techniques for treatment response evaluation in patients with high-grade glioma, a systematic review and meta-analysis. Eur Radiol 2017;27:4129–44. [DOI] [PMC free article] [PubMed] [Google Scholar]
- [38].Doskaliyev A, Yamasaki F, Ohtaki M, et al. Lymphomas and glioblastomas: differences in the apparent diffusion coefficient evaluated with high b-value diffusion-weighted magnetic resonance imaging at 3T. Eur J Radiol 2012;81:339–44. [DOI] [PubMed] [Google Scholar]


