Abstract
Background
Aggressive metastasis of tumor cells assumed a constructive role in strengthening chemoresistance of tumors, so this investigation was intended to elucidate if lncRNA CCAT2 sponging downstream miR-424 regulated chemotolerance of glioma cells by boosting metastasis of glioma cells.
Methods
One hundred and twenty-eight pairs of glioma tissues and corresponding adjacent tissues were resected from glioma patients during their operation, and we also purchased a series of glioma cell lines, including U251, U87, A172 and SHG44. Furthermore, pcDNA3.1-CCAT2, si-CCAT2, miR-424 mimic and miR-424 inhibitor were transfected into SHG44 and U251 cell lines, so as to evaluate impacts of CCAT2 and miR-424 on chemosensitivity of the glioma cells. Besides, proliferation, invasion and metastasis of the cells were determined through the implementation of colony formation assay, transwell assay and scratch assay.
Results
Glioma tissues and cells were monitored with higher CCAT2 expression and lower miR-424 expression than adjacent normal tissues and NHA cell line (P<0.05). Among the glioma cell lines, the SHG44 cell line showed the strongest resistance against teniposide, temozolomide and cisplatin (P<0.05), whereas the U251 cell line was more sensitive to teniposide, temozolomide, vincristine and cisplatin than any other cell line (P<0.05). Besides, pcDNA3.1-CCAT2 and miR-424 inhibitor could enhance tolerance of glioma cell lines against drugs (P<0.05). Moreover, in-vitro transfection of si-CCAT2 and miR-424 mimic could significantly retard proliferation, invasion and migration of SHG44 and U251 cells (P<0.05), and CCAT2 was found to negatively regulate miR-424 expression by sponging it (P<0.05). In addition, CHK1 was deemed as the molecule targeted by upstream miR-424, and its overexpression can changeover the effects of miR-424 mimic on proliferation and metastasis of SHG44 and U251 cells.
Conclusion
lncRNA CCAT2/miR-424/Chk1 axis might serve as a promising target for improving chemotherapeutic efficacies in glioma treatment.
Keywords: glioma, lncRNA CCAT2, miR-424, CHK1, chemoresistance
Introduction
Glioma, stemming from gliocytes in the central nervous system, was responsible for more than a half of brain-related tumors,1 and it was usually categorized into astrocytoma, oligodendroglioma, vasculoma and mixed glioma as per its pathological traits.2 Annually, 22,070 people were newly diagnosed as cerebral tumor in the United States,3 and the death toll triggered by brain tumor reached up to 3.13/100,000 per year.4 Confronted with the frustrating prevalence and morbidity, surgery was preferred as the principal treatment for glioma, and adjuvant therapies included chemotherapy, radiotherapy and comprehensive chemoradiotherapy.5,6 Nevertheless, it was tough to completely eliminate tumor tissues that have metastasized elsewhere, and chemotolerance also weakened the therapeutic efficacy.7 Hence, thorough inquiry of glioma pathogenesis and discovery of key glioma biomarkers could avail diagnosis and treatment of glioma.
A growing number of documentations have established the connection between lncRNAs and progression of tumors (e.g., glioma).8 In particular, both viability and metastasis of glioma cells were attenuated by silencing of lncRNA NEAT1,9 while the reduction of H19 expression slowed down the migration of U87 and U251 cell lines.10 Not only that, knock-out of XIST achieved the glioma-restraining goal by sponging downstream miR-152 and elevating its expression.11 In terms of lncRNA CCAT2, its incremental expression, driven by risk allele G of rs6983267, favored metastasis of colorectal cancer cells via activation of MYC, miR-17-5p and miR-20a.12 Zeng and his colleagues also portrayed that there was huge potential for CCAT2 to strengthen epithelial–mesenchymal transition (EMT) and proliferation of glioma cells.13 Though a direct correlation was displayed between CCAT2 and glioma progression, signaling that CCAT2 functioned on and the association of CCAT2 with chemoresistance of glioma cells remained uncertain.
Of note, a sponging relationship was demonstrated between CCAT2 and miR-424, which cooperatively urged aggravation of ovarian cancer.14 Virtually, the lowly expressed miR-424 was discoverable in a broad array of other neoplasms, including glioma, cervical cancer, endometrial cancer, ovarian cancer, prostate cancer and lung cancer.15–20 Viewed mechanically, miR-424 was capable of interfering with the expression of genes (i.e., Chk1) that were pivotal to the G1-S phase transition of cell cycle and infiltration of tumor cells (i.e., SiHa and CaSki cell lines).16,21 Interestingly, targeting Chk1 could sensitize glioma cells against temozolomide,22 which thereby insinuated a regulatory part of miR-424 in chemoresistance of glioma cells. However, a finite number of evidences were concentrated on whether targeting CCAT2, miR-424 and Chk1 was competent in ameliorating chemoresistance of glioma.
Therefore, this investigation was aimed to partly elucidate if CCAT2 was able to modulate the in-vitro expression of miR-424 and Chk1, and whether the CCAT2/miR-424/Chk1 axis was promising in sensitizing glioma cells against chemotherapies. These series of evidences might provide a novel direction for glioma treatment.
Materials and Methods
Collection of Glioma Tissues
From October 2013 to December 2014, totally 128 pathologically identified glioma patients were recruited from the neurosurgery department of Shanghai Jiao Tong University Affiliated Sixth People’s Hospital. We collected their neoplastic tissues and corresponding adjacent non-tumor tissues during their surgeries. All these patients received neither radiotherapy nor chemotherapy before the surgery, and they were graded according to the standard revised by world health organization (WHO) in 2007. Of note, this project has acquired informed consents from patients and their families. Also, this project has obtained permissions from Shanghai Jiao Tong University Affiliated Sixth People’s Hospital and the ethics committee of Shanghai Jiao Tong University Affiliated Sixth People’s Hospital.
Cell Culture and Cell Transfection
The normal human astrocyte (NHA) cell line supplied by Lonza (Basel, Switzerland) and 4 human glioma cell lines purchased from the cell culture bank of Chinese Academy of Sciences (Shanghai, China) were cultured in optimized Eagle medium that incorporated 10% fetal bovine serum. The culture atmosphere was set as 37°C and 5% CO2, and cells were digested by the addition of 0.25% trypsin. Until cell confluence achieved around 30%~50%, miR-424 mimic (5ʹ-CAGCAGCAAUUCAUGUUUUGAA-3ʹ, RiboBio, China), miR-424 inhibitor (5ʹ-GUCGUCGUUAAGUACAAAACUU-3ʹ, RiboBio, China), si-CCAT2-1 (sense: 5ʹ-UUAACCUCUUCCUAUCUCATT-3ʹ, anti-sense: 5ʹ-UGAGAUAGGAAGAGGUUAATT-3ʹ, Sangon, China), si-CCAT2-2 (sense: 5ʹ-AUUAACUCUGGCUACACCUTT-3ʹ, anti-sense: 5ʹ-UAGGAGGAGAGUUUAUUCGTT-3ʹ, Sangon, China), si-NC (sense: 5ʹ-UUCUCCGAACGUGUCACGUTT-3ʹ, anti-sense: 5ʹ-ACGUGACACGUUCGGAGAATT-3ʹ, GenePharma, Shanghai, China) and pcDNA3.1-CCAT2 were transfected into glioma cells in line with specifications of Lipofectamine 2000 kit (Invitrogen, USA). Six hours later, the medium was replaced with a standard medium to continue cultivating cells for 48 hrs.
Evaluation of Chemoresistance of Glioma Cells by Conduction of CCK8 Assay
The glioma cells growing in the exponential period were inoculated into 96-well plates at a concentration of 8×10³/well. Until cells became adherent to the wall and achieved 80% confluence, drugs of different concentrations were prepared to incubate cells for 48 hrs. The proliferative condition of the cells was assessed by the feat of CCK8 assay.
CCK8 Assay
Cells at the density of 1×10³/well were inoculated into 96-well plate for 48 hrs, and then cell culture was terminated followed by discarding culture solution. Afterward, 10 μL CCK8 reagent (DOJINDO, Japan) was blended with cells in each well, and the mixture was incubated for 10 mins. The absorbance of each well was measured at the wavelength of 450 nm using a multi-function microplate reader (Molecular Devices, Sunnyvale, CA, USA).
Transwell Assay
In the first place, the surface of upper transwell chambers (Corning, USA) was paved with 40 μL diluted Matrigel gel (1:3, BD, USA). Then, glioma cells adjusted to a concentration of 2×10⁵/mL were transferred to the upper chamber, and 600 μL DMEM containing 10% fetal bovine serum (FBS) was supplemented to the lower chamber. After cultivating the cells in 5% CO2 at 37°C for 24 hrs, we removed the nutrient solution in the upper chamber, and fixated the cells with anhydrous methanol for 30 mins. The glioma cells that failed to penetrate through membranes were wiped out using a wet cotton swab, whereas the remaining cells were stained with 0.1% crystal violet for 20 mins. Thereafter, the cell number in the upper membrane was counted under an inverted microscope. With regard to the assessment of cell migration, experimental steps almost agreed with ones of the cell invasion assay, except that the upper membrane was not coated by Matrigel.
Scratch Assay
Precisely 8×10⁵ cells at the logarithmic phase were incubated into culture dishes (model: diameter=35 mm), and we utilized the tip of a microsyringe to draw a straight line in the center of culture dishes. Photographs were made at time points of 0 hrs and 24 hrs, and the distance gap was calculated to evaluate the migratory capacity of glioma cells.
Colony Formation Assay
A total of 200 cells were seeded into each well of 6-well plates, and they were cultured at 37°C for 11 days. Then, the cell colonies were handled with 4% paraformaldehyde for 30 mins at room temperature, and were then dyed by Giemsa for 10 mins. After rinsing and air drying the colonies, we recorded the number of colonies that incorporate >50 cells under a fluorescence microscope.
Cell Apoptosis Assay
The glioma cells digested by 0.25% trypsin to a density of 5×10⁵~1×10⁶ cells/mL were centrifuged at a speed of 1000 rpm for 10 mins, after which the supernatant was discarded. Subsequently, the cells were re-suspended within 200 μL binding buffer, and were gently mixed with 10 μL Annexin V-FITC and 3 μL PI. After 15-min quiescent reaction in the dark, the apoptotic condition of cells was figured out with the assistance of Flow cytometry (Beckman Coulter ELITE, USA).
Reverse Transcriptase-Polymerase Chain Reaction (RT-PCR)
Abiding by the Trizol method (Invitrogen, USA), total RNAs were isolated from tissues and cells. Then, the concentration of total RNAs was measured on a nucleic acid-protein detector (model: Nanodrop 2000), and the RNAs were considered as pure when the A260/280 ratio lied between 1.8 and 2.0. Later, the up-to-standard RNAs were managed to undergo reverse transcription, as per the instruction of corresponding kits (TAKARA, Japan). The reaction system consisted of 10 μL total RNA, 4 μL 5×PrimeScript Buffer, 1 μL RT Primer Mix, 1 μL PrimeScript RT Enzyme Mix I and RNase-free dH2O that made the mixture to achieve 20 μL. Next, the acquired cDNAs were amplified by PCR on a specific system (model: 7300HT, ABI, USA) with primers synthesized by Sangon (Shanghai, China) (Table 1). Guided by the fluorescence quantitation kit (TAKARA, Japan), the PCR reaction was completed following 1) pre-denaturation at 95°C for 30 s and 2) 40 cycles of denaturation at 95°C for 5 s and annealing at 60°C for 30 s. Eventually, the 2−△△CT method was employed to quantify the relative expression of target genes, with GAPDH and U6 set as the internal reference of lncRNA CCAT2 and miR-454, separately.
Table 1.
Primer Sequences Used in Reverse Transcriptase-Polymerase Chain Reaction of This Study
| Gene | Primer Sequence (5ʹ→3ʹ) | |
|---|---|---|
| CCAT2 | Forward | AGACAGTGCCAGCCAACC |
| Reverse | TGCCAAACCCTTCCCTTA | |
| miR-424 | Forward | GTCGTATCCAGTGCAGGGTCCGAGGTATTCGCACTGG |
| Reverse | CGAACGAGCAGCAATTCATG | |
| GAPDH | Forward | CTGCACCAACAATATCCC |
| Reverse | GTAGAGACAGGGTTTCAC | |
| U6 | Forward | CGAACGATACAGAGAAGATTAGCA |
| Reverse | GTGCAGGGTCCGAGGT | |
Western Blotting
The concentration of total proteins was validated using a BCA protein detection kit (Beyotime, China). A precise amount of total protein, 40 μg for each sample, was loaded for performing 2-h sodium dodecyl sulfate-polyacrylamide gel electrophoresis. Subsequently, the proteins, driven by 150 mA were continuously transferred onto the PVDF membrane for 2 hrs. With 50 g/L skim milk adopted to block proteins for 2 hrs, the rabbit anti-human primary antibodies (Abcam, USA) for E-cadherin (1:500, Catalog no.: ab15148), N-cadherin (1:1000, Catalog no.: ab76057), Vimentin (1:1500, Catalog no.: ab137321), CHK1 (1:10,000, Catalog no.: ab40866) and GAPDH (1:10,000, Catalog no.: ab181602) were prepared to incubate proteins, which was then maintained at 4°C for overnight. After washing the membrane with 1×Tris buffered saline Tween for 10 mins, corresponding secondary antibodies tabbed by horseradish peroxidase (goat anti-rabbit, 1:3000, Catalog no.: ab97051) were supplemented to incubate proteins for 1 hrs. In addition, electrochemiluminescence agent (Millipore, Billerica, MA, USA) was added onto the membrane for development, and gray values of protein bands were quantified by Image-Pro Plus software, with GAPDH designated as the internal reference.
Luciferase Reporter Gene Assay
The wild-type sequences of CCAT2 and CHK1 that contained binding sites of miR-424 were, respectively, cloned into the pGL3 vector (GenePharma), based on which pGL3-CCAT2 Wt and pGL3-CHK1 Wt were obtained. Correspondingly, miR-424-binding sites were mutated on the above CCAT2 and CHK1 segments, through which pGL3-CCAT2 Mut and pGL3-CHK1 Mut (GenePharma) were constructed. According to instructions of Lipofectamine 2000 kit (Invitrogen, USA), U87 and U251 cells were, respectively, transfected by pGL3-CCAT2 Wt and miR-424 mimic, pGL3-CCAT2 Mut and miR-424 mimic, pGL3-CCAT2 Wt and miR-NC, pGL3-CHK1 Wt and miR-424 mimic, pGL3-CHK1 Mut and miR-424 mimic, as well as pGL3-CHK1 Wt and miR-NC. Four hours of transfection later, the cells were cultivated in a CO2 incubator (v/v, 5%) at 37°C for 48 hrs. Led by the guidance of dual-luciferase reporter assay kit (Promega, Madison, WI, USA), the luciferase activity of cells was estimated, and its value was equivalent to the ratio of firefly luciferase and renilla luciferase.
Statistical Analyses
The whole set of statistical analyses was completed with the support of SPSS21.0 software. Student’s t test and one-way analysis of variance (ANOVA) were, respectively, applied to analyze measurement data [mean±standard deviation] between (= 2) groups and among (≥3) groups, while chi-square test was performed to compare categorical data. Moreover, survival curves were portrayed on the strength of Kaplan–Meier method, with log-rank test applied for evaluating statistical differences. On the other hand, Cox regression models were built to evaluate the association of clinicopathological items with a 4-year survival of glioma patients. The comparisons were statistically significant when the P value was <0.05.
Results
Significance of CCAT2 and miR-424 in Reflecting Severity of Clinical Symptoms and Prognostic Condition Among Glioma Patients
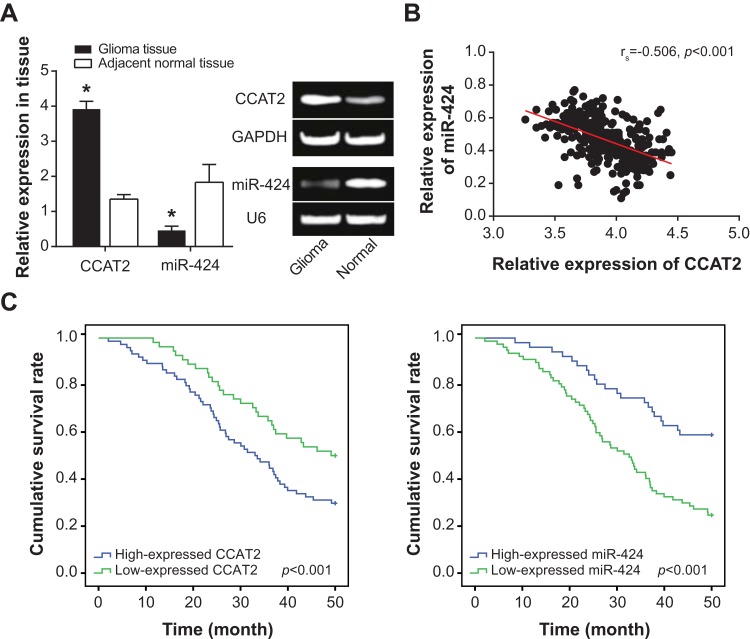
CCAT2 expression in glioma tissues was around 2-folds more than that in adjacent non-tumor tissues (P<0.05), while miR-424 expression in tumor tissues fell to merely 25.14% of that in normal tissues (P<0.05) (Figure 1A). Among the whole glioma population, there revealed an inverse correlation between CCAT2 expression and miR-424 expression (rs=−0.506, P<0.001) (Figure 1B). In addition, highly expressed CCAT2 and lowly expressed miR-424 could mirror larger tumor size (>3 cm), more advanced WHO grade (III-IV) and lower Karnofsky performance score (≤80) of glioma patients, when compared with lowly expressed CCAT2 and highly expressed miR-424 (P<0.05) (Table 2). Further results drawn from multivariate analyses demonstrated the probability that highly expressed CCAT2, lowly expressed miR-424, large tumor size and advanced WHO stage were noteworthy elements to independently predict glioma patients’ unfavorable 4-year survival (Table 3). The Kaplan–Meier curves also visually correlated high CCAT2 expression and low miR-424 expression with poor prognosis of glioma patients (P<0.05) (Figure 1C).
Figure 1.
Association of CCAT2 and miR-424 expressions with clinical characteristics and prognosis of glioma patients. (A) Expression of CCAT2 and miR-424 was compared between 128 pairs of glioma tissues and adjacent non-tumor tissues. *: P<0.05 when compared with adjacent non-tumor tissues. (B) Pearson correlation was conducted between CCAT2 expression and miR-424 expression among glioma patients. (C) Differentially expressed CCAT2 and miR-424 were associated with the prognosis of glioma patients.
Table 2.
Association Between lncRNA CCAT2, miR-424 Expression and Clinical Characteristics
| Clinical Characteristics | CCAT2 Expression | miR-424 Expression | χ2 value | p value | ||
|---|---|---|---|---|---|---|
| High | Low | High | Low | |||
| Gender | ||||||
| Female | 30 | 20 | 16 | 34 | ||
| Male | 44 | 34 | 35 | 43 | 2.11 | 0.147 |
| Age (Year) | ||||||
| ≤49 | 42 | 26 | 29 | 39 | ||
| >49 | 32 | 28 | 22 | 38 | 0.48 | 0.490 |
| Pathological Type | ||||||
| Astrocytoma | 65 | 42 | 45 | 62 | ||
| Oligodendroglioma | 9 | 12 | 6 | 15 | 1.33 | 0.249 |
| Tumor Size (cm) | ||||||
| >3 | 50 | 25 | 24 | 51 | ||
| ≤3 | 24 | 29 | 27 | 26 | 4.65 | 0.031 |
| WHO Classification | ||||||
| III-IV | 57 | 28 | 26 | 59 | ||
| I-II | 17 | 26 | 25 | 18 | 9.04 | 0.003 |
| Peritumoral Edema | ||||||
| Positive | 33 | 20 | 17 | 36 | ||
| Negative | 41 | 34 | 34 | 41 | 2.28 | 0.131 |
| Karnofsky Performance Score | ||||||
| ≤80 | 49 | 25 | 22 | 52 | ||
| >80 | 25 | 29 | 29 | 25 | 7.49 | 0.006 |
Table 3.
Multivariate Analysis of Risk Factors Associated with Overall Survival of Glioma Patients
| Clinical Characteristics | Univariate Analysis | Multivariate Analysis | ||||
|---|---|---|---|---|---|---|
| Hazard Ratio | 95% CI | p value | Hazard Ratio | 95% CI | p value | |
| CCAT2 Expression | ||||||
| High vs Low | 3.62 | 1.71–7.65 | 0.001 | 2.92 | 1.18–7.26 | 0.021 |
| miR-424 Expression | ||||||
| High vs Low | 0.23 | 0.11–0.49 | <0.001 | 0.28 | 0.11–0.73 | 0.009 |
| Gender | ||||||
| Female vs Male | 1.17 | 0.56–2.44 | 0.671 | 0.97 | 0.40–2.38 | 0.948 |
| Age (Years) | ||||||
| ≤49 vs >49 | 1.31 | 0.64–2.68 | 0.460 | 1.99 | 0.82–4.86 | 0.131 |
| Pathological Type | ||||||
| Astrocytoma vs Oligodendroglioma | 0.77 | 0.29–2.08 | 0.611 | 0.28 | 0.07–1.13 | 0.074 |
| Tumor Size (cm) | ||||||
| >3 vs ≤3 | 3.84 | 1.81–8.16 | <0.001 | 2.95 | 1.18–7.36 | 0.021 |
| WHO Classification | ||||||
| III-IV vs I-II | 4.12 | 1.90–8.96 | <0.001 | 2.98 | 1.13–7.88 | 0.028 |
| Peritumoral Edema | ||||||
| Positive vs Negative | 0.79 | 0.39–1.63 | 0.528 | 0.58 | 0.23–1.42 | 0.232 |
| Karnofsky Performance Score | ||||||
| ≤80 vs >80 | 1.05 | 0.51–2.15 | 0.904 | 0.61 | 0.24–1.57 | 0.305 |
Role of CCAT2 and miR-424 in Regulating Chemosensitivity of Glioma Cells
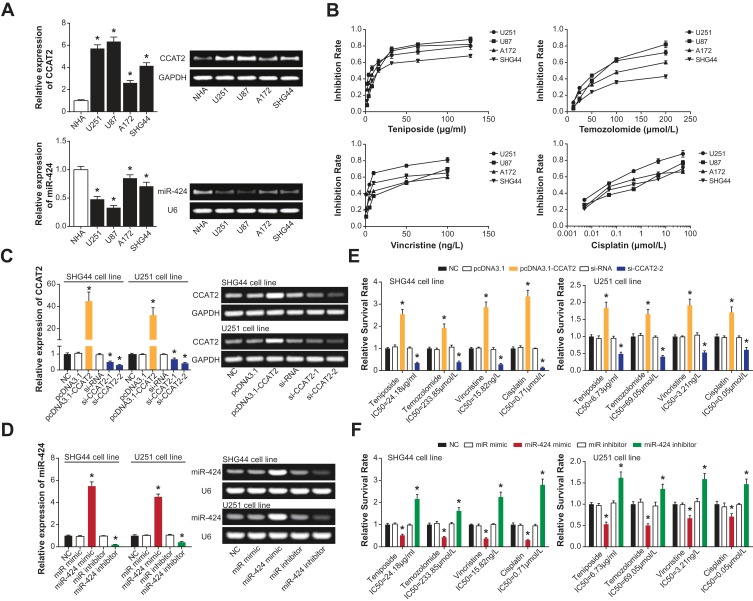
Similar to glioma tissues, higher CCAT2 expression and lower miR-424 expression were detectable within tumor cell lines (i.e., U251, U87, A172 and SHG44) than within NHA cell line (P<0.05) (Figure 2A). Besides, SHG44 cell line appeared as the most tolerant glioma cell line against teniposide (IC50=24.18μg/mL), temozolomide (IC50=233.85 μmol/L) and cisplatin (0.71 μmol/L), whereas U251 cell line displayed the least resistance to four drugs (teniposide: IC50=6.73 μg/mL; temozolomide: IC50=69.05 μmol/L; vincristine: IC50=3.21 ng/L; cisplatin: IC50=0.05 μmol/L). The strongest vincristine-tolerance was detected within the U87 cell line (IC50=30.05 ng/L), when compared with A172 (IC50=29.81 ng/L) and SHG44 (IC50=15.82 ng/L) (Figure 2B). Based on the above, SHG44 and U251 cell lines were scheduled for carrying out subsequent cellular experiments for their respective most resistant and sensitive features.
Figure 2.
Role of CCAT2 and miR-424 in regulating chemosensitivity of glioma cells. (A) CCAT2 and miR-424 expressions were determined within glioma cells (i.e., U251, U87, A172 and SHG44) and NHA cells. *: P<0.05 when compared with NHA cells. (B) The inhibition rates were evaluated within glioma cells (i.e., U251, U87, A172 and SHG44) after the treatment of Teniposide, Temozolomide, Vincristine and Cisplatin. (C) CCAT2 expression was detected in SHG44 and U251 cells after the transfection of NC, pcDNA3.1, pcDNA3.1-CCAT2, si-RNA, si-CCAT2-1 and si-CCAT2-2. *: P<0.05 when compared with the NC group. (D) Expression of miR-424 in SHG44 and U251 cells was drawn when NC, miR mimic, miR-424 mimic, miR inhibitor and miR-424 inhibitor were transfected. *: P<0.05 when compared with the NC group. Survival of glioma cells was compared after treatment of chemo drugs and transfections of (E) pcDNA3.1-CCAT2/si-CCAT2-2 or (F) miR-424 mimic/miR-424 inhibitor. *: P<0.05 when compared with the NC group.
Furthermore, there exhibited an obvious elevation of CCAT2 expression in SHG44 and U251 cell lines transfected by pcDNA3.1-CCAT2 (P<0.05) (Figure 2C). However, expression of CCAT2 was oppositely modified in SHG44 and U251 cells under the transfection of both si-CCAT2-1 and si-CCAT2-2 (P<0.05), and si-CCAT2-2 contributed more significantly than si-CCAT2-1 in silencing CCAT2 expression (P<0.05). When miR-424 was considered, its expression was heightened and lowered significantly in SHG44 and U251 cell lines, after separate transfection of miR-424 mimic and miR-424 inhibitor (P<0.05) (Figure 2D). It was intriguing to notice that transfection of pcDNA3.1-CCAT2 was capable of enhancing chemoresistance of both cell lines, whereas drug-sensitivity of the cell lines was improved under the influence of si-CCAT2-2 (P<0.05) (Figure 2E). Analogously, drug-resistances of SHG44 and U251 cell lines were weakened when miR-424 was over-expressed (P<0.05), yet they were reinforced by under-expressed miR-424 (P<0.05) (Figure 2F).
Regulatory Role of CCAT2 and miR-424 in Activity, Apoptosis and Proliferation of Glioma Cells
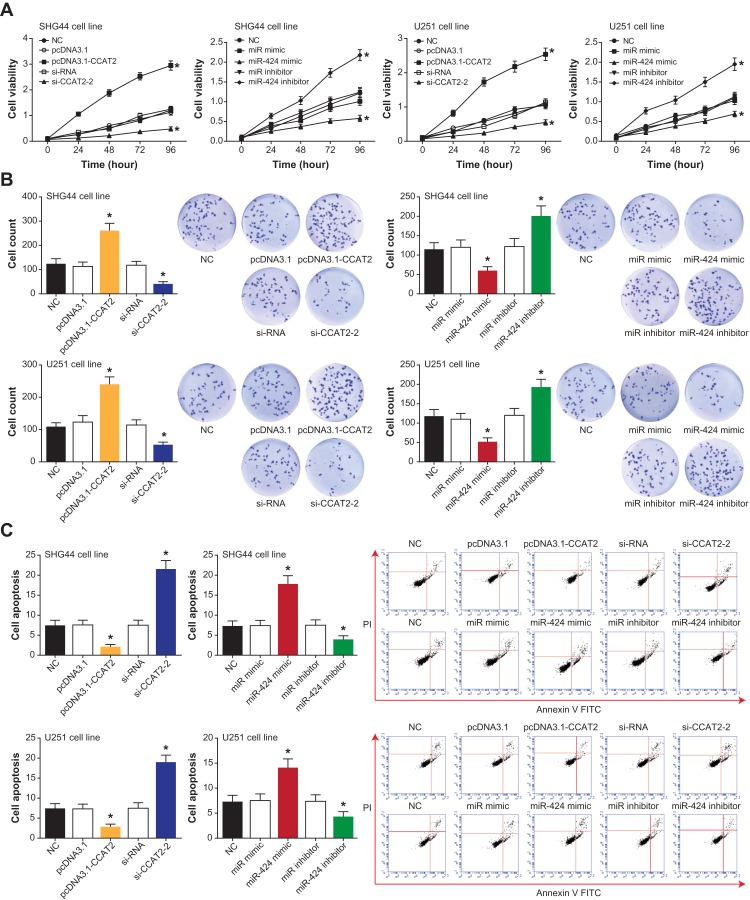
Activities of SHG44 and U251 cell lines were strengthened in the pcDNA3.1-CCAT2 group and miR-424 inhibitor group, when compared with the NC group, pcDNA3.1 group and miR-NC group (P<0.05) (Figure 3A). Conversely, the silencing of CCAT2 and activation of miR-424 both diminished the activity of SHG44 and U251 cells greatly (P<0.05). The variation trend of cell proliferation synchronized with that of cell viability, specifically displayed as a stronger multiplicative capability in pcDNA3.1-CCAT2/miR-424 inhibitor group and weaker proliferative potential in the si-CCAT-2/miR-424 group (P<0.05) (Figure 3B). Distinct from the above two items, apoptosis of the SHG44 and U251 cells was facilitated largely by si-CCAT2-2 and miR-424 mimic (P<0.05), yet pcDNA3.1-CCAT2 group and miR-424 inhibitor group were associated with smaller proportions of apoptosis than NC group, pcDNA3.1 group and miR-NC group (P<0.05) (Figure 3C).
Figure 3.
Regulatory roles of CCAT2 and miR-424 in viability and proliferation of glioma cells. (A) The viability of glioma cells was assessed under the effects of pcDNA3.1-CCAT2 and si-CCAT2-2 or miR-424 mimic and miR-424 inhibitor. *: P<0.05 when compared with the NC group. (B) The pcDNA3.1-CCAT2 and si-CCAT2-2 or miR-424 mimic and miR-424 inhibitor were appraised regarding their influence on the proliferation of glioma cells. *: P<0.05 when compared with the NC group. (C) Contributions of pcDNA3.1-CCAT2 and si-CCAT2-2 or miR-424 mimic and miR-424 inhibitor to the apoptotic rate of glioma cells were compared. *: P<0.05 when compared with the NC group.
Potential of CCAT2 and miR-424 in Modulating Metastasis of Glioma Cells
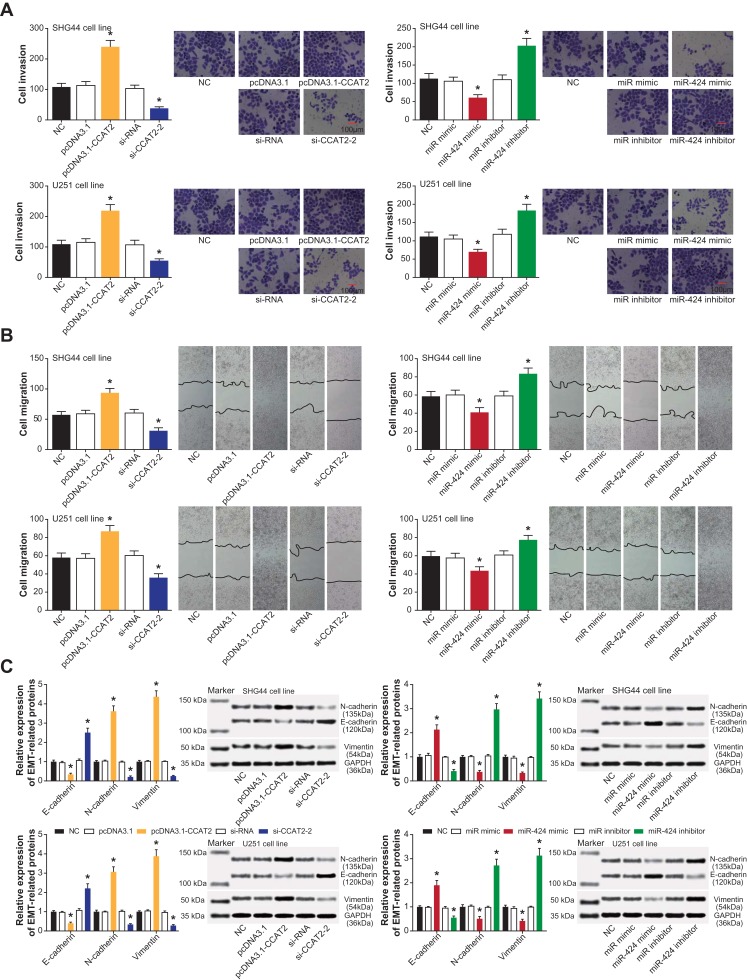
As elaborated by transwell invasion assay (Figure 4A), a large number of SHG44 and U251 cells were found to pass through the basement membrane pores in the pcDNA3.1-CCAT2 group and miR-424 inhibitor group, when compared with NC group, pcDNA3.1 group and miR-NC group (P<0.05). By contrast, the invasive predispositions of SHG44 and U251 cells were blocked when CCAT2 was under-expressed and miR-424 was over-expressed (P<0.05). Concurrently, pcDNA3.1-CCAT2 and miR-424 inhibitor both reinforced migration of SHG44 and U251 cell lines (P<0.05), yet si-CCAT2-2 and miR-424 mimic attenuated migration of the cell lines (P<0.05) (Figure 4B). With regard to EMT-symbolizing proteins, SHG44 and U251 cell lines transfected by pcDNA3.1-CCAT2 and miR-424 inhibitor were associated with distinctly fortified N-cadherin/Vimentin expression and decreased E-cadherin expression (P<0.05) (Figure 4C). Contrary to the above two groups, N-cadherin/Vimentin expression was decreased and E-cadherin expression was augmented in SHG44 and U251 cell lines of si-CCAT2-2 and miR-424 mimic groups (P<0.05).
Figure 4.
Modulation of EMT process by CCAT2 and miR-424 in glioma cells. (A) Invasion of glioma cells was measured under the effects of pcDNA3.1-CCAT2 and si-CCAT2-2 or miR-424 mimic and miR-424 inhibitor. *: P<0.05 when compared with the NC group. (B) Migratory trends of glioma cells were presented under the influence of pcDNA3.1-CCAT2 and si-CCAT2-2 or miR-424 mimic and miR-424 inhibitor. *: P<0.05 when compared with the NC group. (C) Proteins specific to EMT within glioma cells were quantified among pcDNA3.1-CCAT2 and si-CCAT2-2 or miR-424 mimic and miR-424 inhibitor groups. *: P<0.05 when compared with the NC group.
The Sponging Relationship Between CCAT2 and miR-424 in Glioma Cells
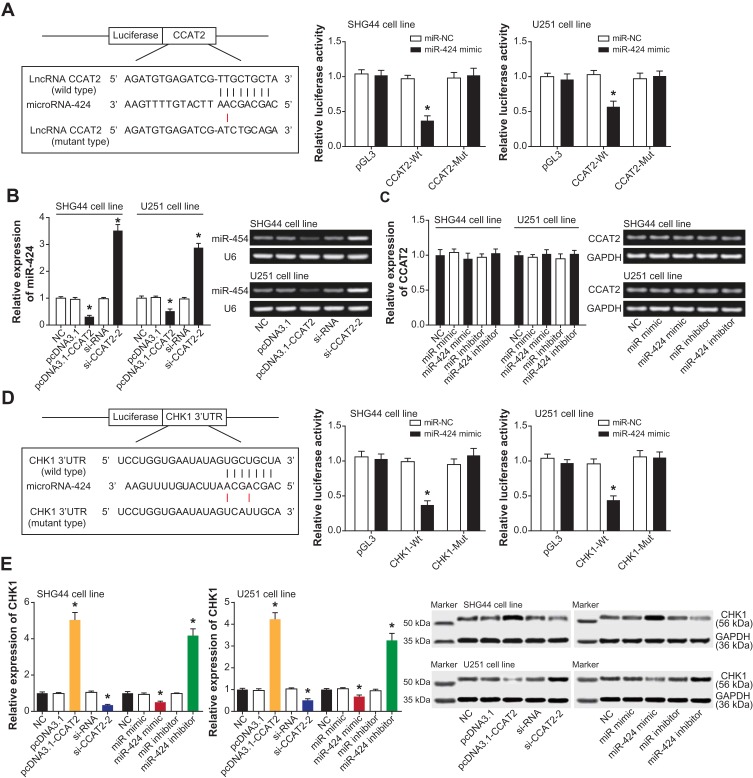
SHG44 and U251 cell lines in the pGL3-CCAT2-Wt+miR-424 mimic group revealed a lower luciferase activity than those in the pGL3-CCAT2-Mut+miR-424 mimic group and pGL3-CCAT2-Wt+miR-NC group (P<0.05), and the latter two groups were approximate regarding their luciferase activity (P>0.05) (Figure 5A). For another, miR-424 expression was markedly reduced within SHG44 and U251 cell lines that carried over-expressed CCAT2 (P<0.05), whereas transfection of si-CCAT2-2 gave rise to a significant increase of miR-424 expression (P<0.05) (Figure 5B). Nonetheless, CCAT2 expression in the SHG44 and U251 cell lines seemed unaffected by either miR-424 inhibitor or miR-424 mimic (P>0.05) (Figure 5C).
Figure 5.
Modulatory effects of CCAT2 on miR-424 in glioma cells. (A) The luciferase activity of glioma cells was contrasted among pGL3-CCAT2-Wt+miR-424 mimic, pGL3-CCAT2-Wt+miR-NC and pGL3+miR-424 mimic groups. *: P<0.05 when compared with pGL3-CCAT2-Wt+miR-NC. (B) Expression of miR-424 was monitored within SHG44 and U251 cells that were transfected by pcDNA3.1-CCAT2 and si-CCAT2-2. *: P<0.05 when compared with the NC group. (C) Impacts of miR-424 mimic and miR-424 inhibitor on CCAT2 expression were also tracked. *: P<0.05 when compared with the NC group. (D) The targeting sites between miR-424 and CHK1 were illustrated, and glioma cells of pGL3-CHK1-Wt+miR-424 mimic, pGL3-CHK1-Wt+miR-NC and pGL3+miR-424 mimic groups were assessed regarding their luciferase activity. *: P<0.05 when compared with pGL3-CHK1-Wt+miR-NC. (E) CHK1 expression in SHG44 and U251 cells was determined after transfection of pcDNA3.1-CCAT2 and si-CCAT2-2 or miR-424 mimic and miR-424 inhibitor. *: P<0.05 when compared with the NC group.
CHK1 Disturbed the Impacts of miR-424 on Activity of Glioma Cells
The luciferase activity of SHG44 and U251 cells receded in the pGL3-CHK1-Wt+miR-424 mimic group, as relative to both pGL3-CHK1-Mut+miR-424 mimic group and pGL3-CHK1-Wt+miR-NC group (P<0.05) (Figure 5D). Moreover, CHK1 expression was elevated with the increase of CCAT2 expression and the decrease of miR-424 expression (P<0.05), and treatments of si-CCAT2-2 and miR-424 mimic both led to a marked reduction of CHK1 expression (P<0.05) (Figure 5E). The results altogether implied that CHK1 was subjected to regulation of miR-424 after being sponged by it.
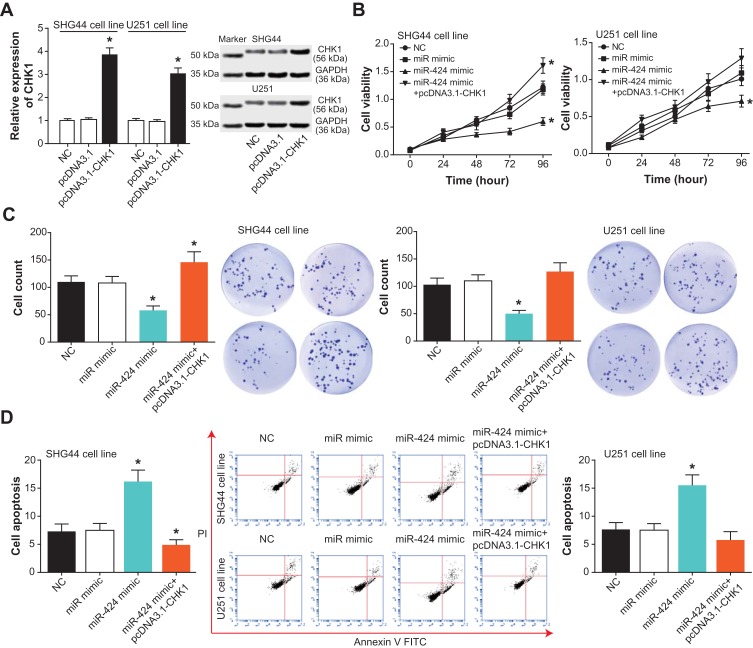
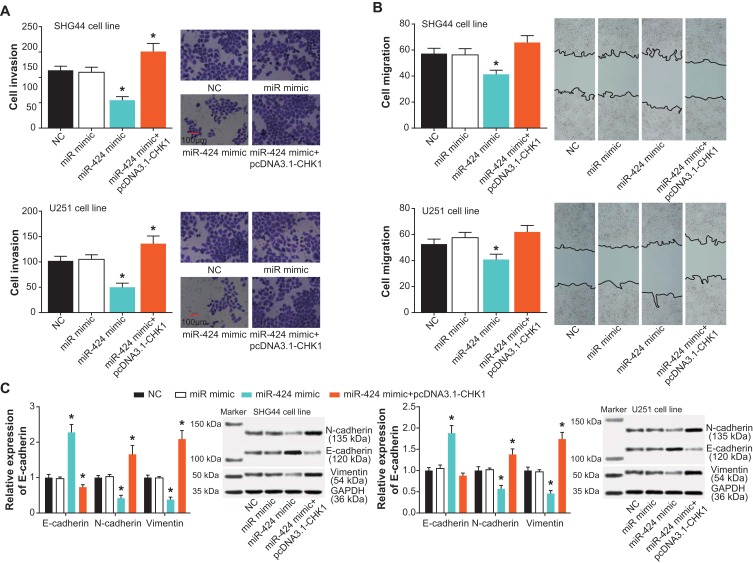
In addition, CHK1 expression rose dramatically within SHG44 and U251 cell lines of the pcDNA3.1-CHK1 group, when compared with cell lines of the pcDNA3.1 group and NC group (Figure 6A). Furthermore, both viability and proliferation of the SHG44 cell line were enhanced in the pcDNA3.1-CHK1+miR-424 mimic group, as compared with a miR-424 mimic group (P<0.05) (Figure 6B and C). However, apoptosis of the SHG44 cell line was greatly inhibited by the co-transfection of pcDNA3.1-CHK1 and miR-424 mimic, in comparison to a single transfection of miR-424 mimic (P<0.05) (Figure 6D). More than that, SHG44 and U251 cell lines in the pcDNA3.1-CHK1+miR-424 mimic group exhibited more aggressive invasion than those in the miR-424 mimic group (P<0.05) (Figure 7A and B). Meanwhile, raised N-cadherin/Vimentin expression and depressed E-cadherin expression were observable within SHG44 and U251 cell lines of the pcDNA3.1-CHK1+miR-424 mimic group, with miR-424 mimic group as the reference (P<0.05) (Figure 7C).
Figure 6.
CHK1 mediated the role of miR-424 in affecting viability, proliferation and apoptosis of glioma cells. (A) The amount of CHK1 in SHG44 and U251 cells was verified after transfection of pcDNA3.1-CHK1. *: P<0.05 when compared with the NC group. (B) The viability of glioma cells was drawn among NC, miR-mimic, miR-424 mimic and miR-424 mimic+pcDNA3.1-CHK1 groups. *: P<0.05 when compared with the NC group. (C) The proliferative capacity of glioma cells was compared among NC, miR-mimic, miR-424 mimic and miR-424 mimic+pcDNA3.1-CHK1 groups. *: P<0.05 when compared with the NC group. (D) The apoptotic percentage of glioma cells was observed after respective treatments of NC, miR-mimic, miR-424 mimic and miR-424 mimic+pcDNA3.1-CHK1 groups. *: P<0.05 when compared with the NC group.
Figure 7.
CHK1 intervened in the effects of miR-424 on metastasis of glioma cells. (A) The invasive abilities of glioma cells were tested under the influence of NC, miR-mimic, miR-424 mimic and miR-424 mimic+pcDNA3.1-CHK1 groups. *: P<0.05 when compared with the NC group. (B) The glioma cells were appraised concerning their migratory capacity among NC, miR-mimic, miR-424 mimic and miR-424 mimic+pcDNA3.1-CHK1 groups. *: P<0.05 when compared with the NC group. (C) Expressions of EMT-related proteins were measured within glioma cells handled with NC, miR-mimic, miR-424 mimic and miR-424 mimic+pcDNA3.1-CHK1 groups. *: P<0.05 when compared with the NC group.
Discussion
Glioma, with attributes of heterogeneity and susceptibility,23,24 endangered lives of numerous sufferers.25 There seemed a positive correlation between glioma malignancy and aggressive behavior of tumor cells, so clarifying mechanistic explanations for glioma invasion and migration could be of great assistance for improving glioma treatment.26
Up to date, a plethora of lncRNAs have been certified to participate in mediating glioma metastasis, including lncRNA UCA1,27 lncRNA H19,28 lncRNA HOTTIP,29 lncRNA CCAT130 and lncRNA CCAT2.13 The current investigation placed the emphasis on lncRNA CCAT2, whose expressional change could reflect glioma onset and prognosis (Tables 2 and 3, Figure 1C). Mechanically, an expressional increase of CCAT2 was found to enable glioma cells to migrate and invade more aggressively than control cells (Figure 4). Besides artificially blocking CCAT2 expression also prohibited metastasis of glioma cells (Figure 4), which proved the carcinogenic role of CCAT2 in glioma from an opposite angle. As a matter of fact, CCAT2 has been certified as an oncogene in other neoplasms.31–33 In particular, suppression of in-vitro CCAT2 expression was able to hinder both proliferation and invasion of breast cancer cells, and tumor growth in animal models was also restrained by lowly expressed CCAT2.34 Moreover, dysfunctional CCAT2, due to mutation of alleles in rs6983267, also boosted aggravation of colorectal cancer through affecting Wnt signaling,35 but whether SNP rs6983267 also played an analogous part underlying glioma pathogenesis was unknown. Intriguingly, it was documented that glioma cells that were highly capable of invading and migrating usually displayed enhancive chemotolerance.36,37 Based on the linkage, it might be tenable that CCAT2 strengthened the chemotolerance of glioma cells as described here (Figure 2E), which was also a novelty of this investigation.
Another bright spot of this study consisted in that we extended a glioma-involved signaling that was located downstream of CCAT2 (i.e., miR-424/Chk1 axis). The miR-424, as illustrated by Figure 5B, was sponged and negatively modulated by CCAT2 in glioma cells, and its overexpression could refrain proliferation, migration, invasion and chemoresistance of glioma cells (Figures 3 and 4). Besides glioma, robust evidences have described the relevance of miR-424 to metastasis and chemoresistance of other tumor cells. For example, miR-424-5p expression was significantly reduced in anoikis-resistant liver cancer cells, and metastasis of the neoplasm cells was suppressed by miR-424-5p.38 Nevertheless, there were controversies regarding the expressional profile of miR-424 within tumors. To be specific, highly expressed miR-424 was detectable within squamous cell carcinoma, non-small cell lung cancer and pancreatic cancer,20,39,40 yet no significant variation of miR-424 expression was observed within bladder epithelial carcinoma.41 These discordances might be explained by that miR-424 functioned distinctly within various tissues and organs, which entailed further proofs.
Additionally, we determined a high expression of Chk1 within glioma cells as relative to normal cells, which agreed with previous studies.22 After thorough inquiries, it was indicated that the Chk1 was a target gene of miR-424 in glioma (Figure 5D), and over-expression of Chk1 could changeover the contribution of miR-424 to blocking proliferation, invasion and migration of glioma cells (Figures 6 and 7). In effect, Chk1 was a vital participant in repairing DNA damage, and it was mainly involved in regulating the G2/M phase of the cell cycle.42 These mechanisms might explain the close association of Chk1 with proliferation, invasion or chemosensitivity of neoplasm cells, including leukemia cells, breast cancer cells (e.g., MCF-7 and HeLa), head and neck squamous cell carcinoma cells (e.g., A253)43–46 and glioma cells studied here. Despite the consistencies, whether Chk1 acted upon identical downstream signaling pathways in diversified neoplasms was still inconclusive, and this point should be further tapped.
Conclusion
Considering the vital role of lncRNA CCAT2/miR-424/Chk1 axis in regulating the biological behavior of human glioma cells, there might be a good prospect to apply this axis for glioma treatment. However, several defects in the experimental design should be attached importance to, and they demanded perfection in future. First, this study did not involve relevant zoological trials to further confirm the effect of CCAT2 on glioma development. Second, although this investigation preliminarily concluded that regulation of CCAT2/miR-424/Chk1 axis was effective for ameliorating chemosensitivity of glioma cells, detailed regulatory mechanisms still demanded intensive studies. Third, we failed to accomplish immunofluorescence staining assays that could vividly illustrate the expression of EMT-characteristic proteins. Finally, the gathered clinical data were all Chinese-centered, and it was uncertain as to whether the results were appropriate for glioma patients of other ethnicities.
Ethical Statement
All participants have signed informed consents prior to conduction of this program. This project has obtained permissions from Shanghai Jiao Tong University Affiliated Sixth People’s Hospital and the ethics committee of Shanghai Jiao Tong University Affiliated Sixth People’s Hospital. And this study was conducted in accordance with the Declaration of Helsinki.
Author Contributions
All authors contributed to data analysis, drafting and revising the article, gave final approval of the version to be published, and agree to be accountable for all aspects of the work.
Disclosure
The authors report no conflicts of interest in this work.
References
- 1.Louis DN, Ohgaki H, Wiestler OD, et al. The 2007 WHO classification of tumours of the central nervous system. Acta Neuropathol. 2007;114:97–109. doi: 10.1007/s00401-007-0243-4 [DOI] [PMC free article] [PubMed] [Google Scholar]
- 2.Louis DN, Perry A, Reifenberger G, et al. The 2016 World Health Organization classification of tumors of the central nervous system: a summary. Acta Neuropathol. 2016;131:803–820. doi: 10.1007/s00401-016-1545-1 [DOI] [PubMed] [Google Scholar]
- 3.Jemal A, Siegel R, Ward E, et al. Cancer statistics, 2009. CA Cancer J Clin. 2009;59:225–249. doi: 10.3322/caac.20006 [DOI] [PubMed] [Google Scholar]
- 4.Ohgaki H, Kleihues P. Epidemiology and etiology of gliomas. Acta Neuropathol. 2005;109:93–108. doi: 10.1007/s00401-005-0991-y [DOI] [PubMed] [Google Scholar]
- 5.Stupp R, Taillibert S, Kanner AA, et al. Maintenance therapy with tumor-treating fields plus temozolomide vs temozolomide alone for glioblastoma: a randomized clinical trial. JAMA. 2015;314:2535–2543. doi: 10.1001/jama.2015.16669 [DOI] [PubMed] [Google Scholar]
- 6.Stupp R, Hegi ME, Mason WP, et al. Effects of radiotherapy with concomitant and adjuvant temozolomide versus radiotherapy alone on survival in glioblastoma in a randomised Phase III study: 5-year analysis of the eortc-ncic trial. Lancet Oncol. 2009;10:459–466. doi: 10.1016/S1470-2045(09)70025-7 [DOI] [PubMed] [Google Scholar]
- 7.Ostrom QT, Gittleman H, Fulop J, et al. Cbtrus statistical report: primary brain and central nervous system tumors diagnosed in the united states in 2008–2012. Neuro Oncol. 2015;17 Suppl 4:iv1–iv62. doi: 10.1093/neuonc/nov189 [DOI] [PMC free article] [PubMed] [Google Scholar]
- 8.Park JY, Lee JE, Park JB, et al. Roles of long non-coding RNAs on tumorigenesis and glioma development. Brain Tumor Res Treat. 2014;2:1–6. doi: 10.14791/btrt.2014.2.1.1 [DOI] [PMC free article] [PubMed] [Google Scholar]
- 9.Zhou K, Zhang C, Yao H, et al. Knockdown of long non-coding RNAneat1 inhibits glioma cell migration and invasion via modulation of sox2 targeted by mir-132. Mol Cancer. 2018;17:105. doi: 10.1186/s12943-018-0849-2 [DOI] [PMC free article] [PubMed] [Google Scholar]
- 10.Shi Y, Wang Y, Luan W, et al. Long non-coding RNAh19 promotes glioma cell invasion by deriving mir-675. PLoS ONE. 2014;9:e86295. doi: 10.1371/journal.pone.0086295 [DOI] [PMC free article] [PubMed] [Google Scholar]
- 11.Yao Y, Ma J, Xue Y, et al. Knockdown of long non-coding RNAxist exerts tumor-suppressive functions in human glioblastoma stem cells by up-regulating mir-152. Cancer Lett. 2015;359:75–86. doi: 10.1016/j.canlet.2014.12.051 [DOI] [PubMed] [Google Scholar]
- 12.Ling H, Spizzo R, Atlasi Y, et al. Ccat2, a novel noncoding RNA mapping to 8q24, underlies metastatic progression and chromosomal instability in colon cancer. Genome Res. 2013;23:1446–1461. doi: 10.1101/gr.152942.112 [DOI] [PMC free article] [PubMed] [Google Scholar]
- 13.Zeng J, Du T, Song Y, et al. Knockdown of long noncoding RNAccat2 inhibits cellular proliferation, invasion, and epithelial-mesenchymal transition in glioma cells. Oncol Res. 2017;25:913–921. doi: 10.3727/096504016X14792098307036 [DOI] [PMC free article] [PubMed] [Google Scholar]
- 14.Hua F, Li CH, Chen XG, Liu XP. Long noncoding RNAccat2 knockdown suppresses tumorous progression by sponging miR-424 in epithelial ovarian cancer. Oncol Res. 2018;26:241–247. doi: 10.3727/096504017X14953948675412 [DOI] [PMC free article] [PubMed] [Google Scholar]
- 15.Jin C, Li M, Ouyang Y, Tan Z, Jiang Y. Mir-424 functions as a tumor suppressor in glioma cells and is down-regulated by DNA methylation. J Neurooncol. 2017;133:247–255. doi: 10.1007/s11060-017-2438-4 [DOI] [PubMed] [Google Scholar]
- 16.Xu J, Li Y, Wang F, et al. Suppressed mir-424 expression via upregulation of target gene chk1 contributes to the progression of cervical cancer. Oncogene. 2013;32:976–987. doi: 10.1038/onc.2012.121 [DOI] [PubMed] [Google Scholar]
- 17.Dong P, Xiong Y, Yue J, Hanley SJB, Watari H. Mir-34a, mir-424 and mir-513 inhibit mmset expression to repress endometrial cancer cell invasion and sphere formation. Oncotarget. 2018;9:23253–23263. doi: 10.18632/oncotarget.25298 [DOI] [PMC free article] [PubMed] [Google Scholar]
- 18.Liu J, Gu Z, Tang Y, et al. Tumour-suppressive microRNA-424-5p directly targets ccne1 as potential prognostic markers in epithelial ovarian cancer. Cell Cycle. 2018;17:309–318. doi: 10.1080/15384101.2017.1407894 [DOI] [PMC free article] [PubMed] [Google Scholar]
- 19.Banyard J, Chung I, Wilson AM, et al. Regulation of epithelial plasticity by mir-424 and mir-200 in a new prostate cancer metastasis model. Sci Rep. 2013;3:3151. doi: 10.1038/srep03151 [DOI] [PMC free article] [PubMed] [Google Scholar]
- 20.Zhang M, Gao C, Yang Y, et al. miR-424 promotes non-small cell lung cancer progression and metastasis through regulating the tumor suppressor gene tnfaip1. Cell Physiol Biochem. 2017;42:211–221. doi: 10.1159/000477314 [DOI] [PubMed] [Google Scholar]
- 21.Li Y, Wang F, Xu J, et al. Progressive miRNA expression profiles in cervical carcinogenesis and identification of hpv-related target genes for miR-29. J Pathol. 2011;224:484–495. doi: 10.1002/path.2873 [DOI] [PubMed] [Google Scholar]
- 22.Hirose Y, Berger MS, Pieper RO. Abrogation of the chk1-mediated g(2) checkpoint pathway potentiates temozolomide-induced toxicity in a p53-independent manner in human glioblastoma cells. Cancer Res. 2001;61:5843–5849. [PubMed] [Google Scholar]
- 23.Zhu W, Lu L, Li Y, Yao J, Xu B. The effects of p53 arg72pro polymorphism on glioma susceptibility: a meta-analysis. Tumour Biol. 2014;35:3725–3730. doi: 10.1007/s13277-013-1494-4 [DOI] [PubMed] [Google Scholar]
- 24.Zhu W, Yao J, Li Y, Xu B. Assessment of the association between xrcc1 arg399gln polymorphism and glioma susceptibility. Tumour Biol. 2014;35:3061–3066. doi: 10.1007/s13277-013-1397-4 [DOI] [PubMed] [Google Scholar]
- 25.Li M, Deng H, Peng H, Wang Q. Functional nanoparticles in targeting glioma diagnosis and therapies. J Nanosci Nanotechnol. 2014;14:415–432. doi: 10.1166/jnn.2014.8757 [DOI] [PubMed] [Google Scholar]
- 26.Huveldt D, Lewis-Tuffin LJ, Carlson BL, et al. Targeting src family kinases inhibits bevacizumab-induced glioma cell invasion. PLoS ONE. 2013;8:e56505. doi: 10.1371/journal.pone.0056505 [DOI] [PMC free article] [PubMed] [Google Scholar]
- 27.Li Z, Liu H, Zhong Q, Wu J, Tang Z. LncRNA uca1 is necessary for tgf-beta-induced epithelial-mesenchymal transition and stemness via acting as a cerna for slug in glioma cells. FEBS Open Bio. 2018;8:1855–1865. [DOI] [PMC free article] [PubMed] [Google Scholar]
- 28.Jia L, Tian Y, Chen Y, Zhang G. The silencing of lncRNA-h19 decreases chemoresistance of human glioma cells to temozolomide by suppressing epithelial-mesenchymal transition via the wnt/beta-catenin pathway. Onco Targets Ther. 2018;11:313–321. doi: 10.2147/OTT.S154339 [DOI] [PMC free article] [PubMed] [Google Scholar] [Retracted]
- 29.Zhang S, Wang W, Liu G, et al. Long non-coding RNAhottip promotes hypoxia-induced epithelial-mesenchymal transition of malignant glioma by regulating the mir-101/zeb1 axis. Biomed Pharmacother. 2017;95:711–720. doi: 10.1016/j.biopha.2017.08.133 [DOI] [PubMed] [Google Scholar]
- 30.Cui B, Li B, Liu Q, Cui Y. LncRNA ccat1 promotes glioma tumorigenesis by sponging mir-181b. J Cell Biochem. 2017;118:4548–4557. doi: 10.1002/jcb.v118.12 [DOI] [PubMed] [Google Scholar]
- 31.Xu Y, Yao Y, Qin W, et al. Long non-coding RNAccat2 promotes cholangiocarcinoma cells migration and invasion by induction of epithelial-to-mesenchymal transition. Biomed Pharmacother. 2018;99:121–127. doi: 10.1016/j.biopha.2018.01.061 [DOI] [PubMed] [Google Scholar]
- 32.Wang B, Liu M, Zhuang R, et al. Long non-coding RNAccat2 promotes epithelial-mesenchymal transition involving wnt/beta-catenin pathway in epithelial ovarian carcinoma cells. Oncol Lett. 2018;15:3369–3375. doi: 10.3892/ol.2017.7669 [DOI] [PMC free article] [PubMed] [Google Scholar]
- 33.Xu Y, Wang B, Zhang F, et al. Long non-coding RNAccat2 is associated with poor prognosis in hepatocellular carcinoma and promotes tumor metastasis by regulating snail2-mediated epithelial-mesenchymal transition. Onco Targets Ther. 2017;10:1191–1198. doi: 10.2147/OTT.S127100 [DOI] [PMC free article] [PubMed] [Google Scholar]
- 34.Cai Y, He J, Zhang D. Long noncoding RNA ccat2 promotes breast tumor growth by regulating the wnt signaling pathway. Onco Targets Ther. 2015;8:2657–2664. doi: 10.2147/OTT.S90485 [DOI] [PMC free article] [PubMed] [Google Scholar]
- 35.Tuupanen S, Turunen M, Lehtonen R, et al. The common colorectal cancer predisposition snp rs6983267 at chromosome 8q24 confers potential to enhanced wnt signaling. Nat Genet. 2009;41:885–890. doi: 10.1038/ng.406 [DOI] [PubMed] [Google Scholar]
- 36.Jia X, Li N, Peng C, et al. Mir-493 mediated dkk1 down-regulation confers proliferation, invasion and chemo-resistance in gastric cancer cells. Oncotarget. 2016;7:7044–7054. doi: 10.18632/oncotarget.v7i6 [DOI] [PMC free article] [PubMed] [Google Scholar]
- 37.Chen R, Zhao H, Wu D, et al. The role of sh3gl3 in myeloma cell migration/invasion, stemness and chemo-resistance. Oncotarget. 2016;7:73101–73113. doi: 10.18632/oncotarget.12231 [DOI] [PMC free article] [PubMed] [Google Scholar]
- 38.Zhang Y, Li T, Guo P, et al. Mir-424-5p reversed epithelial-mesenchymal transition of anchorage-independent hcc cells by directly targeting icat and suppressed hcc progression. Sci Rep. 2014;4:6248. doi: 10.1038/srep06248 [DOI] [PMC free article] [PubMed] [Google Scholar]
- 39.Li D, Liu K, Li Z, Wang J, Wang X. Mir-19a and mir-424 target tgfbr3 to promote epithelial-to-mesenchymal transition and migration of tongue squamous cell carcinoma cells. Cell Adh Migr. 2018;12:236–246. doi: 10.1080/19336918.2017.1365992 [DOI] [PMC free article] [PubMed] [Google Scholar]
- 40.Oneyama C, Kito Y, Asai R, et al. Mir-424/503-mediated rictor upregulation promotes tumor progression. PLoS ONE. 2013;8:e80300. doi: 10.1371/journal.pone.0080300 [DOI] [PMC free article] [PubMed] [Google Scholar]
- 41.Ratert N, Meyer HA, Jung M, et al. Reference mirnas for mirnaome analysis of urothelial carcinomas. PLoS ONE. 2012;7:e39309. doi: 10.1371/journal.pone.0039309 [DOI] [PMC free article] [PubMed] [Google Scholar]
- 42.Crooke ST. Progress in antisense technology: the end of the beginning. Methods Enzymol. 2000;313:3–45. [DOI] [PubMed] [Google Scholar]
- 43.Sugimoto K, Sasaki M, Isobe Y, et al. Hsp90-inhibitor geldanamycin abrogates g2 arrest in p53-negative leukemia cell lines through the depletion of chk1. Oncogene. 2008;27:3091–3101. doi: 10.1038/sj.onc.1210978 [DOI] [PubMed] [Google Scholar]
- 44.Yan Y, Black CP, Cowan KH. Irradiation-induced g2/m checkpoint response requires erk1/2 activation. Oncogene. 2007;26:4689–4698. doi: 10.1038/sj.onc.1210268 [DOI] [PubMed] [Google Scholar]
- 45.Bourke E, Brown JA, Takeda S, Hochegger H, Morrison CG. DNA damage induces chk1-dependent threonine-160 phosphorylation and activation of cdk2. Oncogene. 2010;29:616–624. doi: 10.1038/onc.2009.340 [DOI] [PubMed] [Google Scholar]
- 46.Choi SH, Lyu SY, Park WB. Mistletoe lectin induces apoptosis and telomerase inhibition in human a253 cancer cells through dephosphorylation of akt. Arch Pharm Res. 2004;27:68–76. doi: 10.1007/BF02980049 [DOI] [PubMed] [Google Scholar]


