Abstract
We sought to investigate the effect of total triiodothyronine (TT3) reduction in the follow-up of patients with idiopathic membranous nephropathy (IMN). A total of 121 patients were enrolled and classified into a low TT3 group or a normal group. Clinical indicators were compared between the groups, and changes in estimated glomerular filtration rate (eGFR), albumin (ALB), thyroid-stimulating hormone, serum creatinine, total protein, total cholesterol (TC), triglyceride (TG), and low-density lipoprotein cholesterol (LDL-C) during follow-up were analysed. In the analysis by TT3 level, ALB was significantly lower in the low TT3 group (P < .05), while TC, TG, LDL-C, fibrinogen, and renal pathological staging were significantly higher in the low TT3 group (P < .05). Analysis of variance for repeated measurement during follow-up showed that there were no significant differences in eGFR and ALB between the groups. TC, TG, and LDL-C levels were significantly higher in the low TT3 group (P < .05). Approximately 37% of patients with IMN showed a decrease in TT3, which was accompanied by significantly decreased ALB level, higher pathological stage, and increased serum lipid level compared with patients having a normal TT3 level. The management of TT3, and appropriate intervention, may therefore help to prevent the kidney damage progress in patients with IMN.
Keywords: clinical indicators, follow-up, idiopathic membranous nephropathy, metabolism, triiodothyronine
1. Introduction
Membranous nephropathy (MN) is a common pathological condition of the glomeruli, and characteristic pathological changes include diffuse thickening of the glomerular basement membrane (GBM) and subepithelial deposits. MN is divided into 2 categories: idiopathic membranous nephropathy (IMN), also known as primary MN; and secondary MN. IMN accounts for about 13.28% of primary glomerular disease in China,[1] and has a male-to-female predominance of approximately 1.2:1. IMN is a common glomerular disease that causes nephrotic syndrome in middle-aged and older adults, and accounts for more than half of all cases of nephrotic syndrome in older adults. The clinical manifestations of IMN in most patients are mass proteinuria of non-selective and nephrotic syndrome, although some patients may have microscopic haematuria or hypertension. The natural course of IMN can differ widely among patients, and the condition can resolve spontaneously in approximately 25% of patients while 30% to 40% will progress to end-stage renal disease within 5 to 10 years. IMN can take a considerable length of time to treat, and can result in variable outcomes, multiple side effects, and ineffective corticosteroid monotherapy.[2,3]
The active thyroid hormones are thyroxine (T4) and triiodothyronine (T3), which are primarily found in combination with proteins such as thyroid hormone-binding globulin (TBG), and infrequently in the free form. Thyroid hormones can change from 1 form to the other to maintain a dynamic equilibrium. The state of binding to proteins is a store of thyroid hormones that prevent T3 and T4 from filtering through the glomerulus. The mechanical barrier and charge barrier of GBM are damaged in IMN, especially when nephrotic syndrome is present, leading to the generation of large quantities of negatively charged proteins with high molecular weight (including TBG) that are leached from the glomerulus in large quantities, resulting in a reduction in T3 and T4 levels in circulation, despite normal thyroid function.[4] Patients with nephrotic syndrome frequently have reduced levels of thyroid hormones, primarily T3, which manifests as lower triiodothyronine syndrome, and these factors should be considered during patient treatment. There have been many reports on the relationship between nephrotic syndrome and thyroid hormone levels, most of which support the process describe above. However, a decrease in thyroid hormone level can also occur in patients with ongoing severe disease, which is considered by most researchers as an adaptive response to the state of illness and thus part of the self-protection regulation mechanism.[5,6] Multiple recent studies have examined the relationship between nephrotic syndrome and thyroid hormone levels, although few have examined the effects of decreased thyroid hormone levels, particularly total triiodothyronine (TT3), on the onset and follow-up of IMN patients.[4,7,8] Here, we analysed the influence of TT3 level on clinical indicators of patients with IMN as well as the effect of TT3 reduction on the main clinical indicators during follow-up to investigate the clinical implications of TT3 reduction in IMN patients.
2. Materials and methods
2.1. Case selection
The study protocol was approved by the Ethics Committee of the First Affiliated Hospital of Guangxi Medical University (Approval Number: 2019KY-E-067), and all patients or patients’ authorized persons signed the informed consent form. Data from 121 patients with MN were included in this retrospective analysis. All patients were admitted to the Department of Nephrology at the First Affiliated Hospital of Guangxi Medical University from June 2013 to April 2018, and their diagnosis was confirmed by renal biopsy. Patients with secondary MN; primary hypothyroidism; with confirmed or suspected acute kidney injury; or those not treated according to the 2012 Kidney Disease Improving Global Outcomes[9] guidelines during follow-up were excluded. No patients received thyroid hormone replacement therapy.
2.2. Clinical data
We used data from the patient's first hospitalisation as baseline data and data from each subsequent outpatient or inpatient visit as follow-up data. The baseline clinical data of each patient were obtained from the inpatient medical record system, and follow-up data were obtained from the inpatient and outpatient medical records system. Clinical data included age, sex, routine biochemistry tests, renal function, plasma total protein (TP), serum albumin (ALB), thyroid function, blood lipids, and 24-hours urinary protein (24 hours UP). The estimated glomerular filtration rate (eGFR) was calculated for each patient using sex, age, and serum creatinine (SCr) level. Renal pathology data were also collected (all pathological tissues were examined by light microscopy, electron microscopy, and immunofluorescence, and renal pathological changes were classified into 1 of 4 stages [I–IV]; if 2 or more stages were identified simultaneously, the highest stage was recorded). The end point of follow-up was loss to follow-up, renal replacement therapy, or the cut-off date of April 31, 2017. Data on routine biochemistry testing, renal function, blood lipids, TP, ALB, and 24 hours UP were collected during follow-up.
On the basis of TT3 level, 121 patients were classified into a low-TT3 group (n = 45, 37.19%) or a normal TT3 group (normal group) (n = 76, 62.81%). Differences in sex, age, blood lipids, renal function, 24 hours UP, ALB, total protein, and renal pathological stage were compared between the 2 groups. During follow-up, changes in eGFR, ALB, total cholesterol (TC), triglycerides (TG), and low-density lipoprotein-cholesterol (LDL-C) were compared between the groups.
2.3. Diagnostic criteria
Nephrotic syndrome was evaluated according to the following criteria:
-
(1)
hyperproteinuria (>3.5 g/24 hours),
-
(2)
hypoalbuminemia (plasma ALB <30 g/L),
-
(3)
oedema, and
-
(4)
hyperlipidaemia
Among these, (1) and (2) were considered necessary conditions, and nephrotic syndrome was diagnosed when both (1) and (2) were present.
Based on the reference ranges of the clinical laboratory at our centre, the TT3 range was 1.34 to 2.75 nmol/L, the TT4 range was 78.38 to 157.4 nmol/L, and the TSH range was 0.34–5.65 mIU/L. TT3 and TT4 levels outside of these ranges were considered to be decreased or increased, as applicable.
2.4. Statistical analysis
The SPSS 20.0 statistical software package was used for all statistical analysis. Normality testing was carried out for measurement data, and normal distribution was expressed as  while a t test was used for comparisons between groups. The mean value of non-normal distribution data was represented by the median [M (P25, P75)], and a rank-sum test was used for comparisons between groups. Frequency data were expressed as a percentage, and between-group comparisons were performed using the chi-square test. Spearman correlation analysis was used for correlation analysis of rank variables, while Pearson correlation analysis was used for continuous variables. Follow-up data were analysed by analysis of variance (ANOVA) with repeated measurement data. Values of P < .05 were considered statistically significant.
3. Results
3.1. Patient information
Data from 121 patients, including 71 males and 50 females (1.42:1) with an average age of 46 [32, 54] years (range: 15–75 years), were evaluated. The average course from onset to renal biopsy was 2 [1,6] months (range: 0.13–84 months). There were 57 cases (47.11%) with a diagnosis of nephrotic syndrome at the time of renal biopsy, and 44 cases with hypertension at the time of admission (36.36%). The mean follow-up time after renal biopsy was 16.97 [12.65, 24.03] months (range: 6.33–49.43 months).
3.2. Analysis by serum TT3 level
3.2.1. Comparison of clinical indicators in patients with IMN
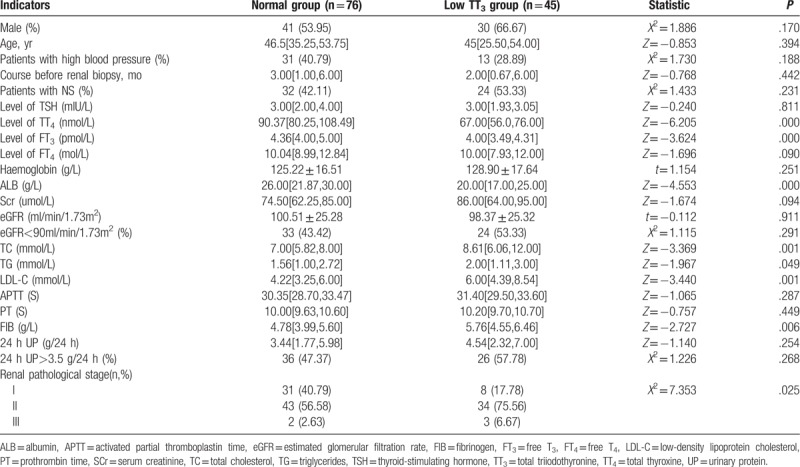
There were no significant differences between the low TT3 group and the normal group in sex ratio, age, proportion of patients with high blood pressure, treatment course before renal biopsy, proportion of patients with nephrotic syndrome, thyroid-stimulating hormone (TSH), FT4, haemoglobin, SCr, eGFR, PT, 24 hours UP, and proportion of patients with 24 hours UP >3.5 g (P>.05). However, the levels of TT4, FT3, and ALB were significantly lower in the low TT3 group than in the normal group (P < .05), while the levels of TC, TG, LDL-C, and FIB were significantly higher in the low TT3 group than in the normal group (P < .05). In patients with renal pathological staging, the proportion of patients with stage II and III disease was significantly higher in the low TT3 group than in the normal group (P = .025) (Table 1).
Table 1.
Comparison of patient characteristics by TT3 level grouping.
3.2.2. Repeated ANOVA for the effect of follow-up time and TT3 grouping on change in eGFR and ALB
3.2.2.1. Change in eGFR
During follow-up, eGFR levels generally followed a downward trend. eGFR levels in the low TT3 group tended to initially increase slowly, followed by a continuous decline, with a maximum value of 90.310 mL/min/1.73 m2. EGFR in the normal group decreased continuously before stabilising at 80 to 90 mL/min/1.73 m2. However, no significant difference in eGFR was observed between the 2 groups (F = 0.097, P = .785). There was a significant difference in eGFR between different time points in the follow-up period (F = 4.085, P = .004) as well as in the normal group (F = 4.932, P = .004). However, there was no significant difference in eGFR at different time points in the low TT3 group (F = 1.727, P = .165), or between the 2 groups at each time point (P > .05). Finally, there was no interaction effect observed between follow-up time and grouping (F = 1.614, P = .176) (Table 2, Fig. 1).
Table 2.
Repeated ANOVA for the effect of follow-up time and TT3 grouping on change in eGFR.

Figure 1.
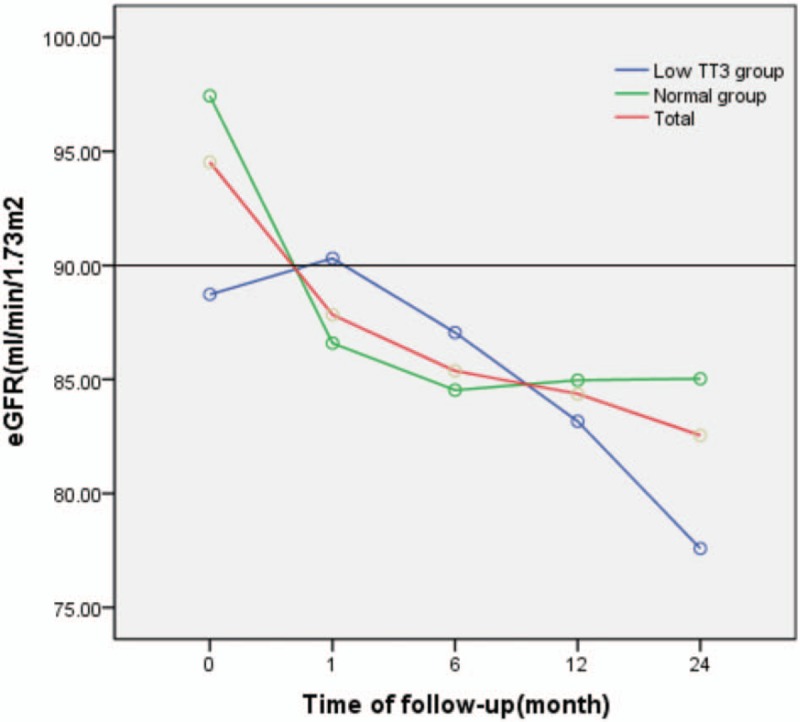
Change in eGFR during follow-up. eGFR = estimated glomerular filtration rate.
3.2.2.2. Change in ALB
During follow-up, ALB levels generally followed an upward trend. ALB levels gradually increased before stabilising at 35 to 40 g/L in both groups. ALB levels were lower in the low TT3 group than in the normal group, but the difference was not statistically significant (F = 1.426, P = .241). A significant difference in ALB was observed between the different time points in the follow-up period (F = 38.561, P = .000), both in the low TT3 group and the normal group, with F values of 11.590 and 33.863, respectively, and P = .000. There was no significant difference in ALB between the 2 groups at each time point (P > .05), and no interaction effect was observed between follow-up time and grouping (F = 0.388, P = .817) (Table 3, Fig. 2).
Table 3.
Repeated ANOVA for the effect of follow-up time and TT3 grouping on change in ALB.

Figure 2.
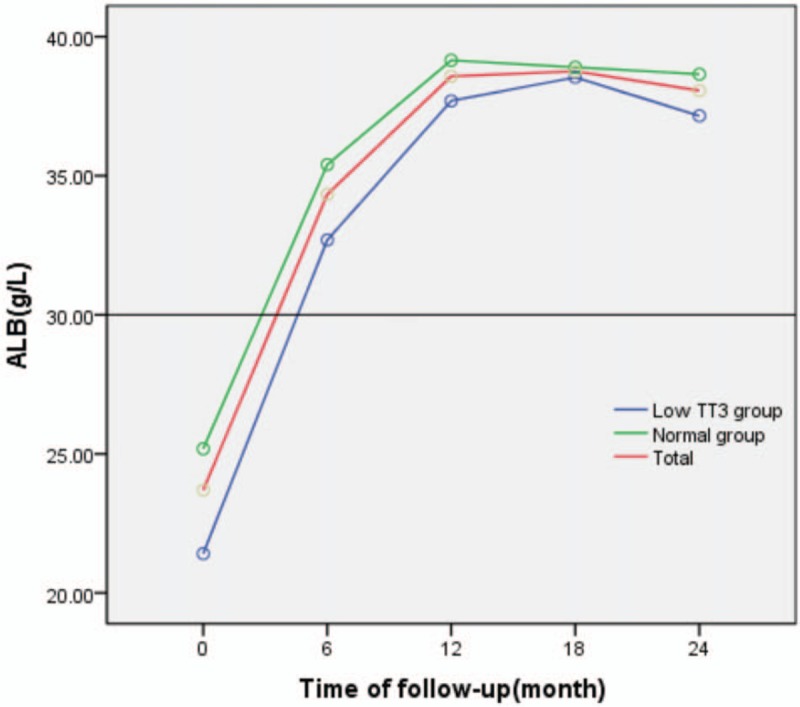
Change in ALB during follow-up. ALB = albumin.
3.3. Repeated ANOVA for the effect of follow-up time and TT3 grouping on change in TC, TG, and LDL-C
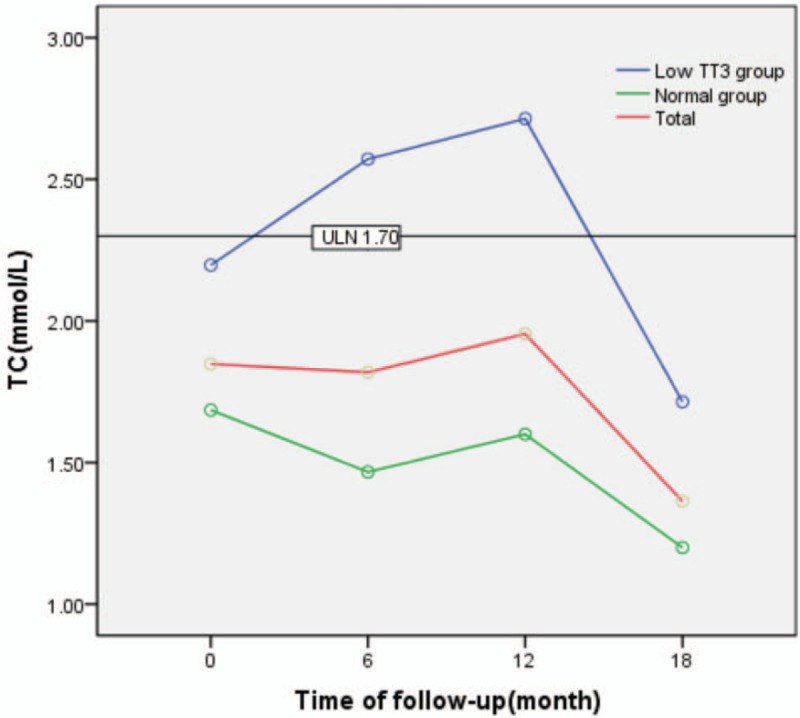
TC levels generally decreased during follow-up, but were significantly higher in the low TT3 group than in the normal group (F = 7.116, P = .014). There was also a significant difference in TC between different time points during follow-up (F = 7.034, P = .002), as well as in the normal group (F = 4.566, P = .032). However, there was no significant difference in TC between different time points during follow-up in the low TT3 group (F = 2.447, P = .138). Except for a significant difference in TC between the 2 groups at 12 months (t = 2.594, P = .025), there was no significant difference observed between the 2 groups at any time point (P > .05), and there was no interaction effect between follow-up time and grouping (F = 1.030, P = .367) (Table 4, Fig. 3).
Table 4.
Repeated ANOVA for the effect of follow-up time and TT3 grouping on changes in TC.

Figure 3.
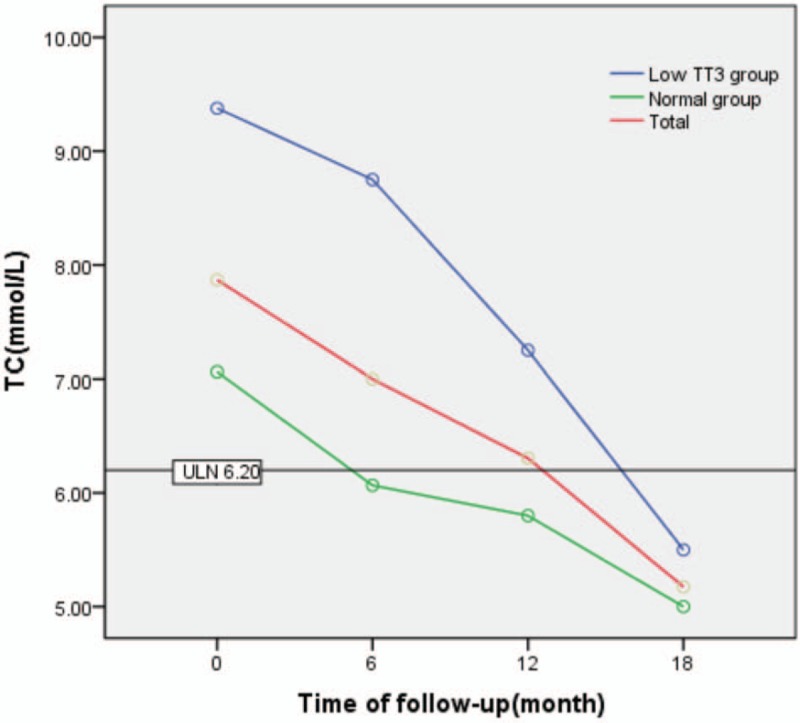
Change in TC during follow-up. TC = total cholesterol.
TG levels generally decreased during follow-up in both groups. TG levels showed an initial trend to increase and subsequently decreased in the low TT3 group, with a maximum value of 2.71 mmol/L. However, a steady decline in TG level was observed in the normal group. TG levels in the low TT3 group were significantly higher than in the normal group (F = 8.496, P = .009). A significant difference in TG was observed at different time points during follow-up (F = 3.513, P = .020), as well as in normal group (F = 3.024, P = .040). However, there was no significant difference in TG observed between different time points during follow-up in the low TT3 group (F = 1.398, P = .336). With the exception of a significant difference in TG between the 2 groups at 6 months (t = 2.461, P = .042), there was no significant difference between the 2 groups at any time point (P > .05). Furthermore, there was no interaction effect observed between follow-up time and grouping (F = 1.124, P = .346) (Table 5, Fig. 4).
Table 5.
Repeated ANOVA for the effect of follow-up time and TT3 grouping on the changes of TG.

Figure 4.
Change in TG during follow-up. TG = triglycerides.
LDL-C levels generally decreased during follow-up, but were significantly higher in the low TT3 group than in the normal group (F = 18.664, P = .000). There was a significant difference in LDL-C observed between different time points during follow-up (F = 11.361, P = .000), both in the low TT3 group and the normal group, with F values of 4.186 and 6.421 and P values of .046 and .007, respectively. There was a significant difference in LDL-C observed between the 2 groups at each time point during follow-up (P < .05). There was no interaction effect observed between the follow-up time and grouping (F = 1.237, P = .301) (Table 6, Fig. 5).
Table 6.
Repeated ANOVA for the effect of follow-up time and TT3 grouping on change in LDL-C.

Figure 5.
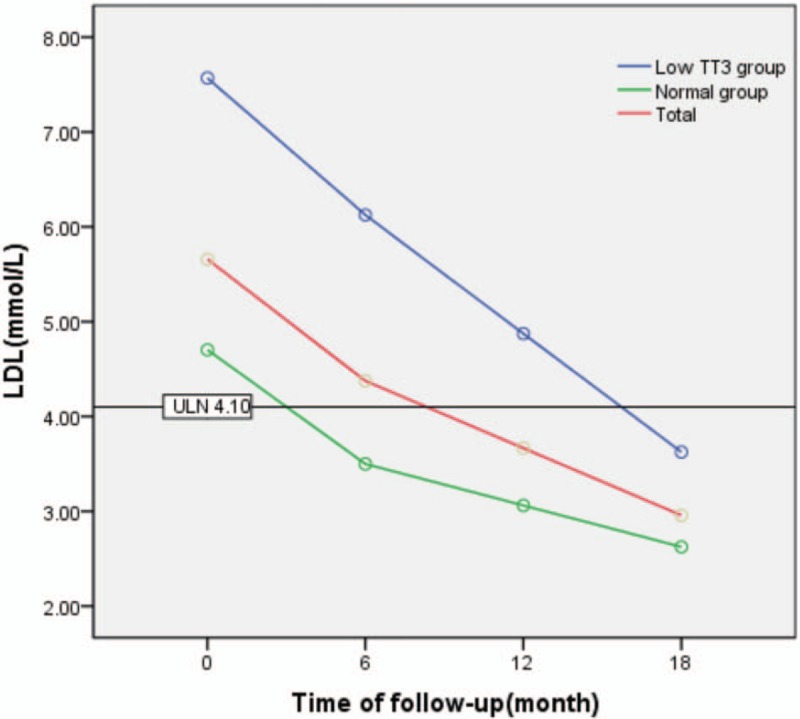
Change in LDL during follow-up. LDL = low-density lipoprotein.
4. Discussion
The incidence of IMN has increased in recent years, from 8.89% of primary glomerular disease in 2005 to 2009 to 19.11% in 2010 to 2014.[1] A close relationship exists between the thyroid, an important endocrine organ, and the kidneys, which can produce, secrete, and regulate hormones. Kidney growth is affected by thyroid hormone, which also influences the haemodynamics, glomerular filtration rate, and regulation of sodium and water in the kidney by direct or indirect action.[10–12] Thyroid hormone is partially metabolised and removed by the kidneys, meaning that kidney disease can effect a significant change in thyroid hormone levels.[13–15] Hypothyroidism, even in a subclinical form, can lead to decreased GFR level and increased incidence of chronic kidney disease (CKD).[16] Previous studies have shown that more than 55% of patients with hypothyroidism may experience a decline in GFR to some extent.[17] Hypothyroidism can also lead to pathological changes in glomerular structure, which may further reduce renal blood flow.[13] In the present study, we showed that the average eGFR level among the 121 patients with IMN was 93.79 ml/min/1.73 m2 and that 53.33% of patients in the low TT3 group had an eGFR level < 90 ml/min/1.73 m2, a similar finding to that reported previously.[9] Furthermore, approximately 63.64% of patients were renal pathological stage II, while stages I and III accounted for 32.23% and 4.13% of patients, respectively. After grouping by TT3 level, eGFR level in the low TT3 group was found to be lower than that in the normal group, the difference was not statistically significant (P > .05),. However, pathological staging in the low TT3 group was significantly higher than that in the normal group (P = .025), potentially indicating that a reduction in TT3 may raise SCr levels over time. Decrease in eGFR was greater in the low TT3 group than in the normal group, but there was no significant difference between the 2 groups (P > .05). This finding may be explained by the observation that the average course of disease onset among patients with IMN in our study was relatively short (2 months), although a decrease in TT3 can affect pathological staging, it cannot alter the glomerular filtration rate significantly. Furthermore, the follow-up period in the present study was too short to observe a significant effect of the reduction of TT3 level on eGFR.
Most T3 and T4 in the circulation is bound to proteins, while the remainder is in the free form. Each form can transform into the other to maintain a dynamic balance. T4 metabolism is the main source of T3 in the body, accounting for about 80% of T3. T3 and T4 cannot readily cross the GBM when combined with protein, owing to a large molecular weight under physiological conditions. However, in nephrotic syndrome, the permeability of the GBM is altered, resulting in the leakage of a large amount of protein from the kidney, including TBG. TBG is the most important thyroid hormone-binding protein, and the loss of large quantities in the urine is 1 contributing factor to a decrease in serum T3 and T4.[18,19] In patients with nephrotic syndrome, hypothyroidism is secondary to the loss of large amounts of protein from the urine rather than the result of a defect in the thyroid itself.[20] In the present study, we found that ALB levels in the low TT3 group were significantly lower than in the normal group (20 g/L vs 26 g/L) (P < .01), while there was no difference in 24 hours UP or in the proportion of patients with 24 hours UP > 3.5 g/d between the 2 groups (P > .05). This finding indicates that the loss of proteins bound to thyroid hormones in the urine is not the only contributing factor in the decrease in T3 observed in patients with IMN. For example, ALB may act as a buffer protein for thyroid hormone in the blood, and when its level is critically low, thyroid hormone transport may be reduced and be unable to dissociate from the protein-hormone complex in sufficient quantities, resulting in low levels of T3, T4, FT3, and FT4. Another factor is a reduction in thyroid hormone synthesis resulting from a reduction in iodine and protein absorption during digestive tract oedema in hypoproteinaemia. Furthermore, no significant correlation was observed between hypothyroidism and urinary protein quantification, partly because hypothyroidism is an adaptive response to IMN and is involved in the self-protection regulation mechanism.
Hyperlipidaemia is 1 of 4 clinical symptoms of nephrotic syndrome, and is characterised by elevated serum TC, TG, and LDL-C.[21] Thyroid hormones play an important role in the metabolism of blood lipids, and are implicated in the synthesis, transport, and degradation of blood lipids.[22] For example, Cooper and Biondi[23] found that TSH >10 mIU/L was related to an increase in serum cholesterol, while Bindels et al[24] found that for each 1 mIU/L increase in TSH, the plasma cholesterol level increased by 0.09 mmol/L (females) or 16 mmol/L (males). In the present study, we found that TC, TG, and LDL-C in the low TT3 group were significantly higher than in the normal group (P < 0.05). By analysing TC, TG, and LDL-C levels during follow-up using repeated ANOVA, we observed an overall decrease in these parameters, although TC, TG, and LDL-C levels were higher in the low TT3 group than in the normal group. However, there was no interaction effect between follow-up time and group (P > .05), that is, there was no significant difference in TC, TG, and LDL-C observed between the 2 groups during follow-up.
In conclusion, the onset age of patients with IMN can vary widely, but is the condition most prevalent in middle-aged and older individuals. The main clinical manifestations of IMN are hypoalbuminemia, massive proteinuria, and hyperlipidaemia, and hypertension and renal insufficiency may also be present. A decrease in TT3 is also common in IMN, affecting approximately 37% of patients, The present study had some limitations; for example, a reduction in TT3 was associated with higher renal pathological staging and higher blood lipid levels compared with normal TT3, although there was no significant difference between the groups regarding change in eGFR. This observation may be explained by a relatively short follow-up time in most patients, as there was insufficient time to observe a significant effect of the reduction of TT3 level on eGFR. In addition, only a few patients underwent regular 24 hours UP testing during the follow-up period, resulting in a significant amount of missing data and an inability to further analyse the correlation between change in TT3 level and remission of proteinuria in patients with IMN.
5. Conclusion
Approximately 37% of patients with IMN showed a decrease in TT3 level, which was accompanied by significantly decreased ALB level, higher pathological stage, and increased serum lipid level compared with patients with a normal TT3 level. The management of TT3, and appropriate intervention, may therefore help to prevent the kidney damage progress in patients with IMN.
Acknowledgments
We would like to express our deep appreciation to all the individuals who contributed to this work.
Author contributions
Conceptualization: Zhenhua Yang.
Data curation: Zhenhua Yang, Luhuai Feng.
Formal analysis: Zhenhua Yang.
Funding acquisition: Zhenhua Yang.
Investigation: Yu Huang.
Methodology: Yu Huang.
Software: Zhenhua Yang, Luhuai Feng.
Supervision: Ning Xia.
Validation: Yu Huang.
Writing – original draft: Yu Huang.
Writing – review and editing: Zhenhua Yang.
Ning Xia orcid: 0000-0003-2812-1202
Footnotes
Abbreviations: ALB = albumin, eGFR = estimated glomerular filtration rate, IMN = idiopathic membranous nephropathy, LDL-C = low-density lipoprotein cholesterol, MN = membranous nephropathy, SCr = serum creatinine, TBG = thyroid hormone-binding globulin, TC = total cholesterol, TG = triglyceride, TP = total protein, TSH = thyroid-stimulating hormone, TT3 = total triiodothyronine.
How to cite this article: Huang Y, Feng L, Li X, Huang S, Deng Y, Liang Ze, Xia N, Yang Z. Clinical observation and analysis of thyroid hormone levels in patients with idiopathic membranous nephropathy. Medicine. 2020;99:7(e19106).
YH and LF These authors contributed equally to this work.
The authors have no conflicts of interest to disclose.
References
- [1].Xu X, Ning Y, Shang W, et al. Analysis of 4931 renal biopsy data in central China from 1994 to 2014. Renal failure 2016;38:1021–30. [DOI] [PubMed] [Google Scholar]
- [2].Perna A, Schieppati A, Zamora J, et al. Immunosuppressive treatment for idiopathic membranous nephropathy: a systematic review. Am J Kidney Dis 2004;44:385–401. [PubMed] [Google Scholar]
- [3].Waldman M, Austin HA., 3rd Controversies in the treatment of idiopathic membranous nephropathy. Nat Rev Nephrol 2009;5:469–79. [DOI] [PMC free article] [PubMed] [Google Scholar]
- [4].Feinstein EI, Kaptein EM, Nicoloff JT, et al. Thyroid function in patients with nephrotic syndrome and normal renal function. Am J Nephrol 2008;2:70–6. [DOI] [PubMed] [Google Scholar]
- [5].Farwell AP. Nonthyroidal illness syndrome. Curr Opin Endocrinol Diabetes Obes 2013;20:478–84. [DOI] [PubMed] [Google Scholar]
- [6].Gao Y, Xiu-Zhen LI, Zhang Y, et al. Correlation between Low-T3 Syndrome and Prognosis of Patients with Critical Illness. Chin J Gen Pract 2013;11:1858–9. [Google Scholar]
- [7].Rao A, Jain D, Aggarwal HK, et al. An enigmatic trio of Klinefelter's syndrome, autoimmune hypothyroidism and nephrotic syndrome. J R Coll Physicians Edinb 2017;47:143–5. [DOI] [PubMed] [Google Scholar]
- [8].Liu H, Yan W, Xu G. Thyroid hormone replacement for nephrotic syndrome patients with euthyroid sick syndrome: a meta-analysis. Ren Fail 2014;36:1360–5. [DOI] [PubMed] [Google Scholar]
- [9].Beck L, Bomback AS, Choi MJ, et al. KDOQI US commentary on the 2012 KDIGO clinical practice guideline for glomerulonephritis. Am J Kidney Dis 2013;62:403–41. [DOI] [PubMed] [Google Scholar]
- [10].Gopal B, Anjali M. Interactions between thyroid disorders and kidney disease. Indian J Endocr Metab 2012;16:204–13. [DOI] [PMC free article] [PubMed] [Google Scholar]
- [11].Periklis D, Konstantina T, Vagenakis GA, et al. The thyroid and the kidney: a complex interplay in health and disease. Int J Artif Organs 2014;37:1–2. [DOI] [PubMed] [Google Scholar]
- [12].Iglesias P, Díez JJ. Thyroid dysfunction and kidney disease. Rev Endocr Metab Disord 2009;160:1–4. [DOI] [PubMed] [Google Scholar]
- [13].Basu G, Mohapatra A. Interactions between thyroid disorders and kidney disease. Indian J Endocrinol Metab 2012;16:204–13. [DOI] [PMC free article] [PubMed] [Google Scholar]
- [14].Dousdampanis P, Trigka K, Vagenakis GA, et al. The thyroid and the kidney: a complex interplay in health and disease. Int J Artif Organs 2014;37:1–2. [DOI] [PubMed] [Google Scholar]
- [15].Iglesias P, Bajo MA, Selgas R, et al. Thyroid dysfunction and kidney disease: an update. Rev Endocr Metab Disord 2017;18:131–44. [DOI] [PubMed] [Google Scholar]
- [16].Asvold BO, Bjoro T, Vatten LJ. Association of thyroid function with estimated glomerular filtration rate in a population-based study: the HUNT study. Eur J Endocrinol 2011;164:101–5. [DOI] [PubMed] [Google Scholar]
- [17].den Hollander JG, Wulkan RW, Mantel MJ, et al. Correlation between severity of thyroid dysfunction and renal function. Clin Endocrinol 2005;62:423–7. [DOI] [PubMed] [Google Scholar]
- [18].Fisher DA. Physiological variations in thyroid hormones: physiological and pathophysiological considerations. Clin Chem 1996;42:135–9. [PubMed] [Google Scholar]
- [19].Mooradian AD, Morley JE. Endocrine dysfunction in chronic renal failure. Arch Intern Med 1984;144:351–3. [PubMed] [Google Scholar]
- [20].Di MF, Pofi R, Gigante A, et al. Hypothyroidism and nephrotic syndrome: why, when and how to treat. Curr Vasc Pharmacol 2017;15:398–403. [DOI] [PubMed] [Google Scholar]
- [21].Appel GB, Valeri A, Appel AS, et al. The hyperlipidemia of the nephrotic syndrome. Am J Med 1989;87(5N):45N–50N. [PubMed] [Google Scholar]
- [22].Pearce EN. Update in lipid alterations in subclinical hypothyroidism. J Clin Endocrinol Metab 2012;97:326–33. [DOI] [PubMed] [Google Scholar]
- [23].Cooper DS, Biondi B. Subclinical thyroid disease. The Lancet 2012;379:1142–54. [DOI] [PubMed] [Google Scholar]
- [24].Bindels AJ, Westendorp RG, Frölich M, et al. The prevalence of subclinical hypothyroidism at different total plasma cholesterol levels in middle aged men and women: a need for case-finding? Clin Endocrinol 2010;50:217–20. [DOI] [PubMed] [Google Scholar]


