Abstract
Lung adenocarcinoma is the most frequently diagnosed subtype of nonsmall cell lung cancer. The molecular mechanisms of the initiation and progression of lung adenocarcinoma remain to be further determined. This study aimed to screen genes related to the progression of lung adenocarcinoma. By weighted gene coexpression network analysis (WGCNA), we constructed a free-scale gene coexpression network to evaluate the correlations between multiple gene sets and patients' clinical traits, then further identify predictive biomarkers. GSE11969 was obtained from the Gene Expression Omnibus (GEO) database which contained the gene expression data of 90 lung adenocarcinoma patients. Data of the Cancer Genome Atlas (TCGA) were employed as the validation cohort. After the average linkage hierarchical clustering, a total of 9 modules were generated. In the clinical significant module (R = 0.44, P < 0.0001), we identified 29 network hub genes. Subsequent verification in the TCGA database showed that 11 hub genes (ANLN, CDCA5, FLJ21924, LMNB1, MAD2L1, RACGAP1, RFC4, SNRPD1, TOP2A, TTK, and ZWINT) were significantly associated with poor survival data of lung adenocarcinomas. Besides, the results of receiver operating characteristic curves indicated that the mRNA levels of this group of genes exhibited high specificity and sensitivity to distinguish malignant lesions from nonmalignant tissues. Apart from mRNA levels, we found that the protein abundances of these 11 genes were remarkably upregulated in lung adenocarcinomas compared with normal tissues. In conclusion, by the WGCNA method, a panel of 11 genes were identified as predictive biomarkers for tumorigenesis and poor prognosis of lung adenocarcinomas.
1. Introduction
Lung cancer is the leading cause of cancer-related deaths all over the world and more than 80% of lung cancers are diagnosed as nonsmall cell lung cancers (NSCLCs) [1, 2]. As the most common subtype of NSCLC, the incidence of lung adenocarcinoma (LUAD) is increasing year by year [3]. Historically, the standard care for advanced LUAD was cytotoxic chemotherapy-involved comprehensive treatment. Due to the deeper understanding of genomics and tumorigenesis-associated molecular pathways, molecularly targeted therapies have been developed and a number of LUAD patients with these specific gene alterations could benefit from these regimens [4].
A growing body of evidence indicates that although gene alterations accumulate during the development of LUADs, a proportion of LUADs are primarily driven by single gene alterations such as epidermal growth factor receptor (EGFR) mutation and (anaplastic lymphoma kinase) ALK or ROS1 rearrangement, which are also known as driven genes [5–8]. As the most frequent oncogenic driver, nearly 10%–15% population harbors EGFR mutation in patients with LUAD especially young nonsmokers [9]. Drugs targeting driven genes show a more potent anticancer effect and lower toxicity compared with conventional chemotherapies; thus multiple molecular targeted agents have been approved by the U.S. Food and Drug Administration for LUAD treatment [10]. The results of phase III clinical trial IPASS strongly support using gefitinib as first line treatment for advanced EGFR mutation-driving LUAD patients [11]. However, in spite of the increasing amount of confirmed targetable oncogenic drivers (including but not limited to EGFR, ALK, ROS1, RET, BRAF, HER2, MET, KRAS, and NTRK), there are about half of LUADs without known driven genes and treatment targets [12, 13]. Therefore, it is meaningful to investigate the molecular mechanisms associated with the initiation and progression of LUAD. Screening more candidate genes might be helpful to molecular diagnosis and the development of targeted agents.
The weighted gene coexpression network analysis (WGCNA) is a widely utilized technique to generate free-scale coexpression network which contributes to screen the modules containing highly correlated genes [14]. By analyzing large-scale gene expression data sets with patients' clinicopathological parameters, WGCNA could be utilized to identify potential treatment targets and predictive biomarkers [15]. In this study, we described gene coexpression patterns via a WGCNA-based systematic biology analysis method and identified a panel of biomarkers associated with the tumorigenesis and outcomes of LUADs.
2. Materials and Methods
2.1. Data Procession
This study was conducted following workflow including data acquisition, WGCNA network construction, and hub genes identification (Figure 1). The gene expression matrix (GSE11969) was downloaded from the Gene Expression Omnibus (GEO) database (https://www.ncbi.nlm.nih.gov/geo/query/acc.cgi?acc=GSE11969) [16]. GSE11969 contains the gene expression values of 90 LUAD patients based on platform GPL7015 (Agilent Homo sapiens 21.6K custom array). After LOWESS normalized, background subtracted, the expression value data were calculated as log10 of processed Red signal/processed Green signal. We utilized pretreated data and selected the top 50% variant genes (8092 genes) via variance analysis for further WGCNA.
Figure 1.
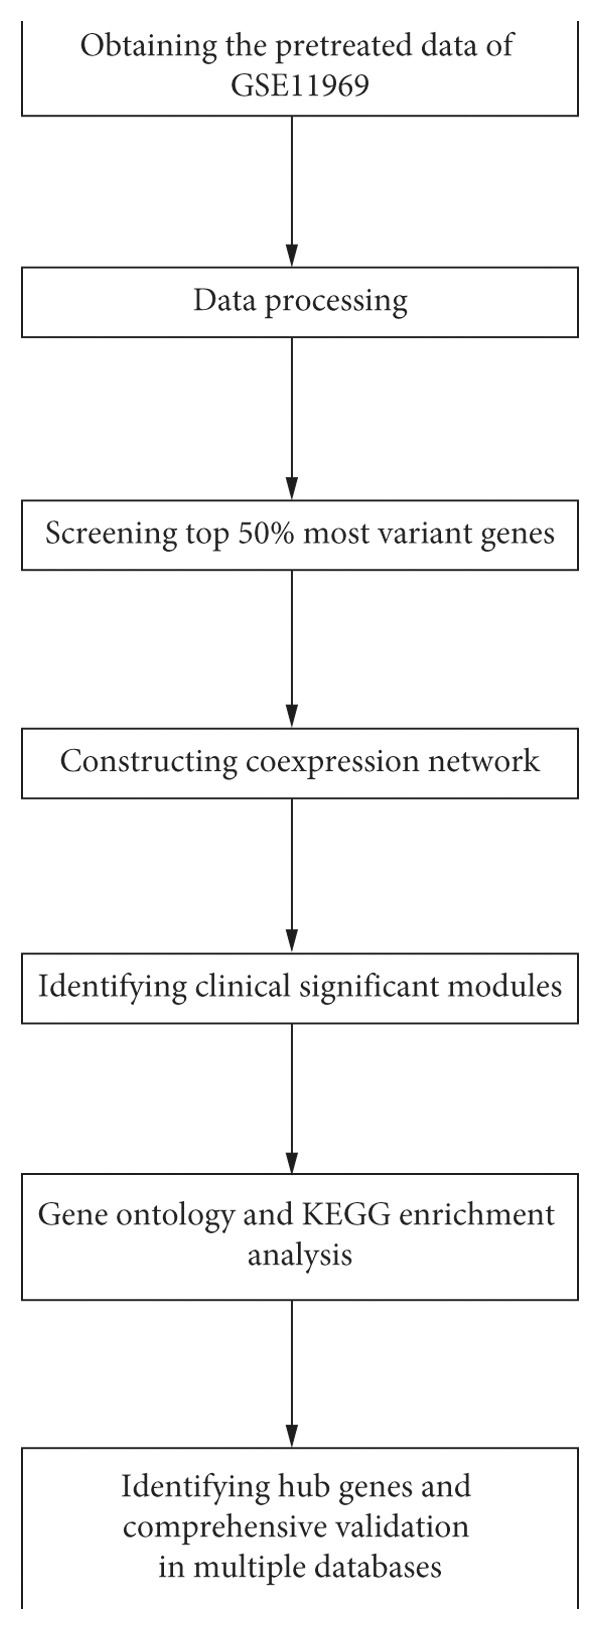
The flow chart of this study.
2.2. Coexpression Network Construction
By R software (version 3.6.0) with the WGCNA package, the gene coexpression network was constructed based on the expression data of 8092 genes [14]. We performed the analysis as previously described [14]. We introduced intermediate quantity coexpression similarity Sij to reflect the connection strength between genes as in the following formula:
| (1) |
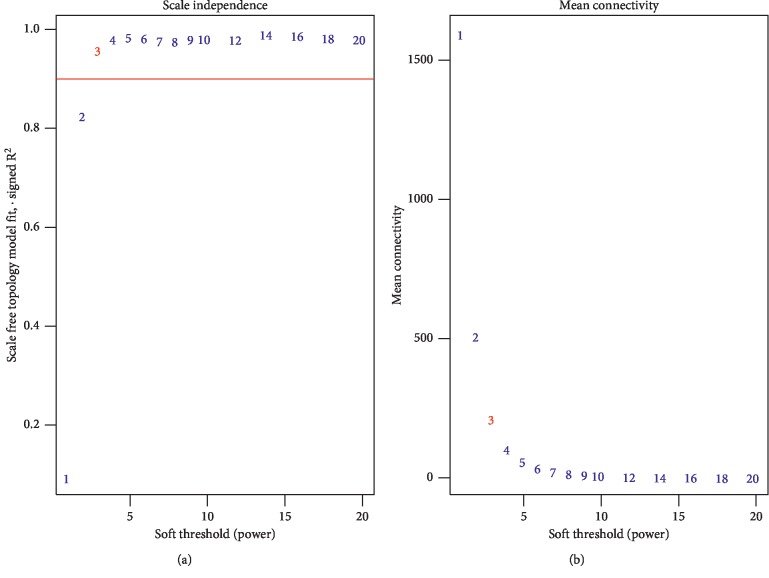
The aforementioned xi and xj are the vectors of the expression values of two different genes i and j. Cor represents the Pearson correlation coefficient of the two vectors. This transition aims to increase the weight of strong connections and decrease the weight of weak connections [17]. In this study, β = 3 (scale-free R2 > 0.90) was adopted as a soft-thresholding index to construct a scale-free coexpression network. In this coexpression network, genes with strong connections would be clustered into one module. Based on adjacency matrix, we calculated topological overlap measure (TOM) which is the surrogate measuring the network connectivity of a certain gene by summing its adjacency of all other components of the network. Then, we created a hierarchical clustering tree. Under the condition of setting minimum cluster size as 50 and height as 0.25, 9 modules were generated via Dynamic Tree Cut algorithm.
2.3. Screening Clinical Significant Modules
The correlations between clustered modules and patients' traits were estimated by module eigengenes (MEs) and module gene significance (MS). MEs referred to the first principal component in each single module. The values of MEs could serve as the surrogate of the expression levels of all genes in the module. Thus, clinical significant modules could be identified by calculating the correlations between MEs and clinic-pathological parameters. Besides, gene significance (GS) referred to the P value (calculated in logs as lgP-value) of the linear regression analysis between gene expressions and samples' characteristics. The MS means the average GS of all genes in one module.
2.4. Gene Ontology Terms and KEGG Pathways Enrichment Analysis
G:Profiler (https://biit.cs.ut.ee/gprofiler) is an online analysis tool for functional enrichment which contains the data of Ensembl database, Gene Ontology (GO) terms, Kyoto Encyclopedia of Genes and Genomes (KEGG) pathway, Reactome, and WikiPathways et al. GO terms, and KEGG pathways enrichment analyses were performed by g:Profiler (version: e95_eg42_p13_f6e58b9). The GO terms consisted of three categories: biological process (BP), cellular component (CC), and molecular function (MF). With the cut-off value as a false positive rate (FDR) < 0.05, the significantly enriched GO terms as well as KEGG pathways were screened out.
2.5. Identifying Hub Genes
Hub genes were defined as genes possessing high connectivity with other genes in the same module (the absolute value of cor.geneModuleMembership ≥ 0.8). Besides, hub genes of modules with clinical significance were prone to highly correlate with corresponding clinical traits (the absolute value of cor.geneTraitSignificance ≥ 0.2). To further confirm the identified hub genes, we utilized the online tool Kaplan–Meier Plotter (http://kmplot.com/analysis/) for prognostic analysis in LUAD populations [18]. Besides, we downloaded pretreated LUAD expression data from the TCGA database (https://xenabrowser.net/) and analyzed the correlation between the hub gene expression and clinical parameters. Apart from the mRNA level, we employed the Human Protein Atlas database (http://www.proteinatlas.org) to confirm the role of hub genes in tumorigenesis in protein abundances.
3. Results
3.1. Constructing Weighted Coexpression Network and Identifying Clinical Significant Module
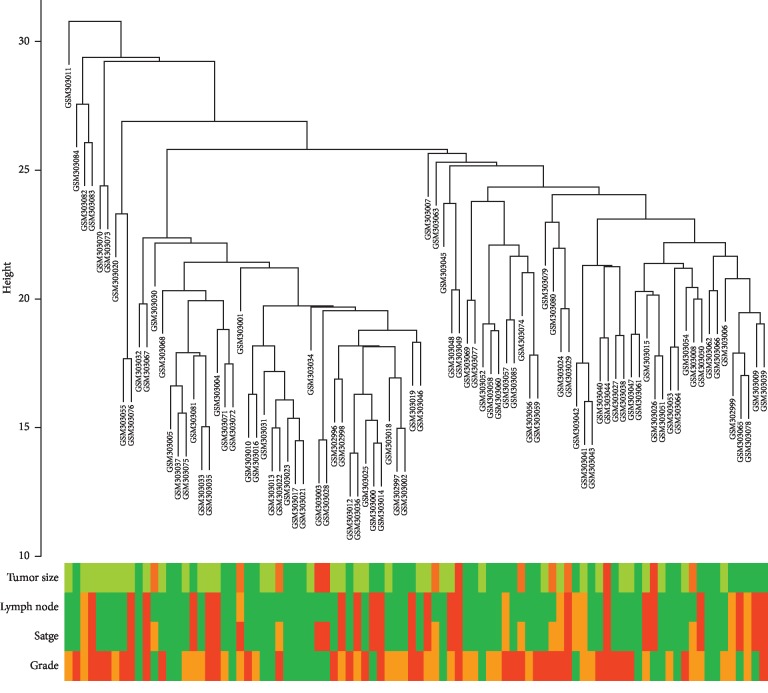
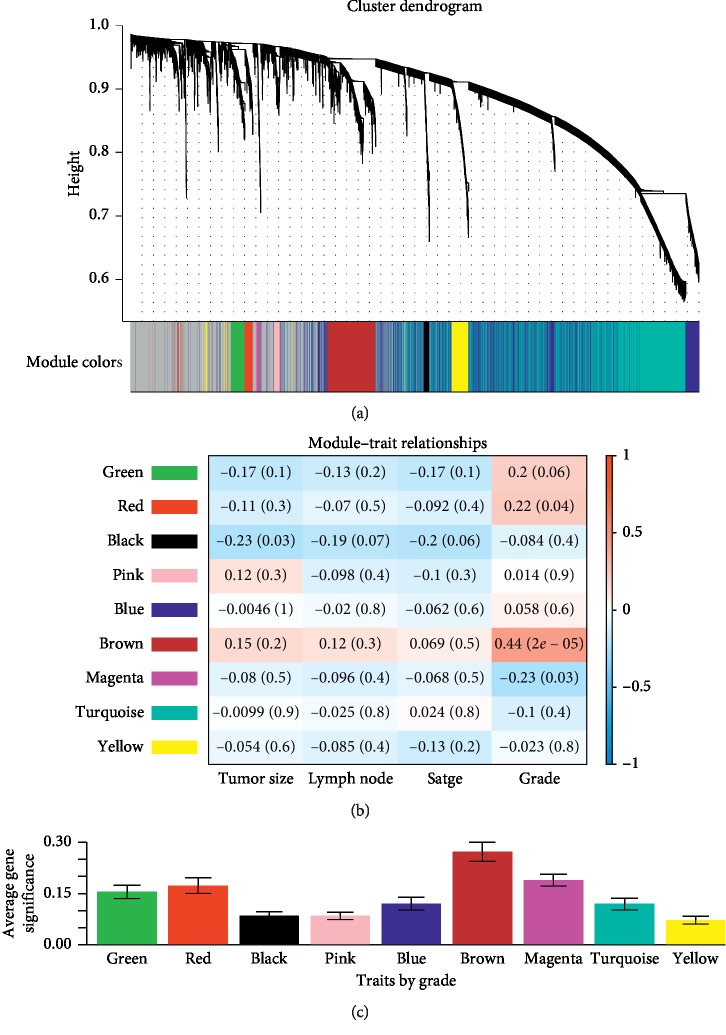
The total 90 LUAD samples were clustered by Pearson's correlation and average linkage algorithms (Figure 2). Then, we conducted coexpression analysis. In this study, the soft-thresholding power was set to β = 3 (R2 > 0.90) to generate a scale-free gene coexpression network (Figure 3). Eventually, 9 modules were generated by average linkage hierarchical clustering. The brown module had the highest correlation with tumor differentiation (R = 0.44, P < 0.0001) (Figure 4). Therefore, the brown module was identified as the one with clinical significance, which was used for the following analysis.
Figure 2.
Clustering dendrogram of 90 LUAD samples.
Figure 3.
Determining the soft-thresholding power. (a) Analyzing the scale-free fit index under the background of different soft-thresholding powers (β). (b) Analyzing mean connectivity when using different soft-thresholding powers.
Figure 4.
Identifying LUAD-associated clinical significant modules. (a) The dendrogram of top 50% most variant genes which were clustered by the Dynamic Tree Cut algorithm. (b) The heat map describing the correlation between all module eigengenes and clinical traits including tumor size, lymph node metastasis, TNM stage, and tumor differentiation grade. (c) The histogram describing the relationship between the average gene significance of all modules and tumor differentiation grade.
3.2. GO Terms and KEGG Pathway Enrichment
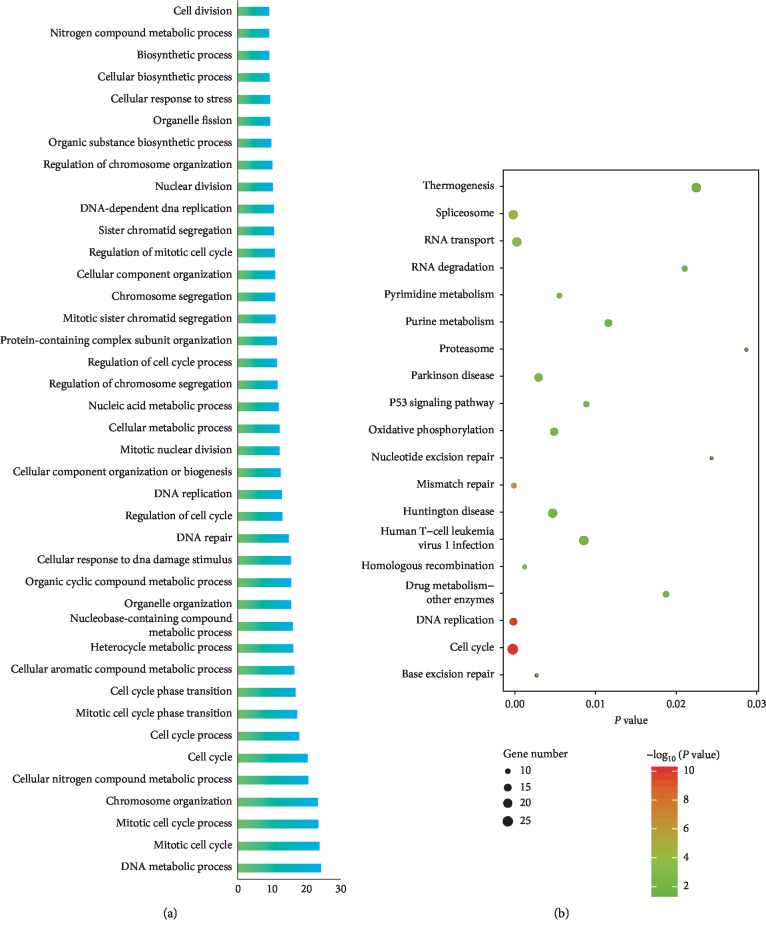
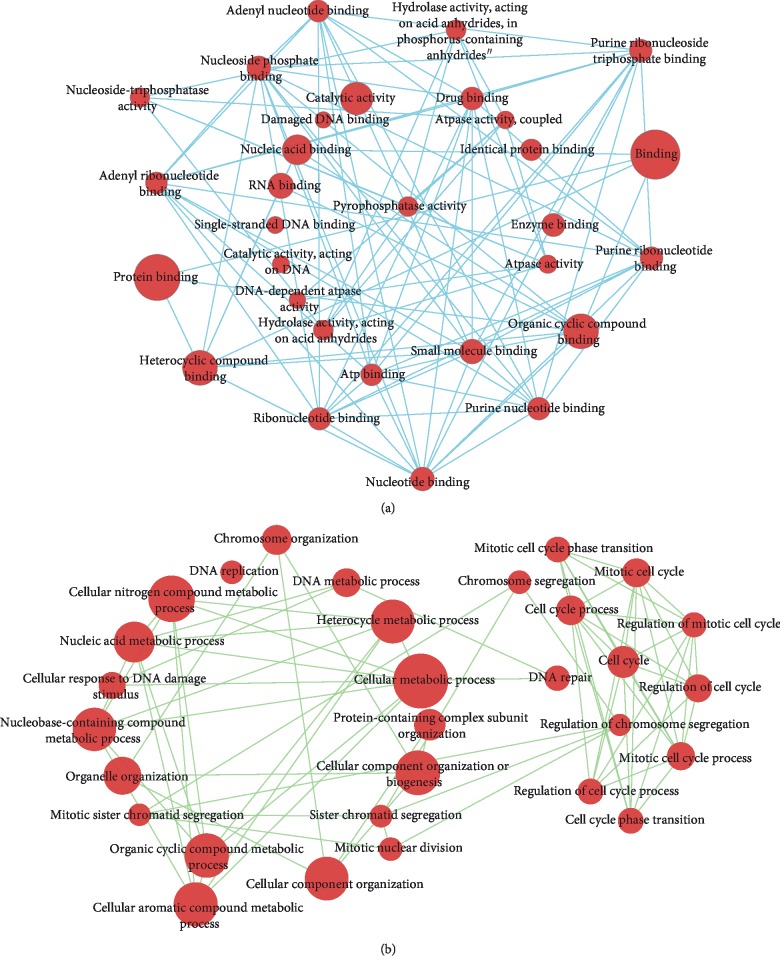
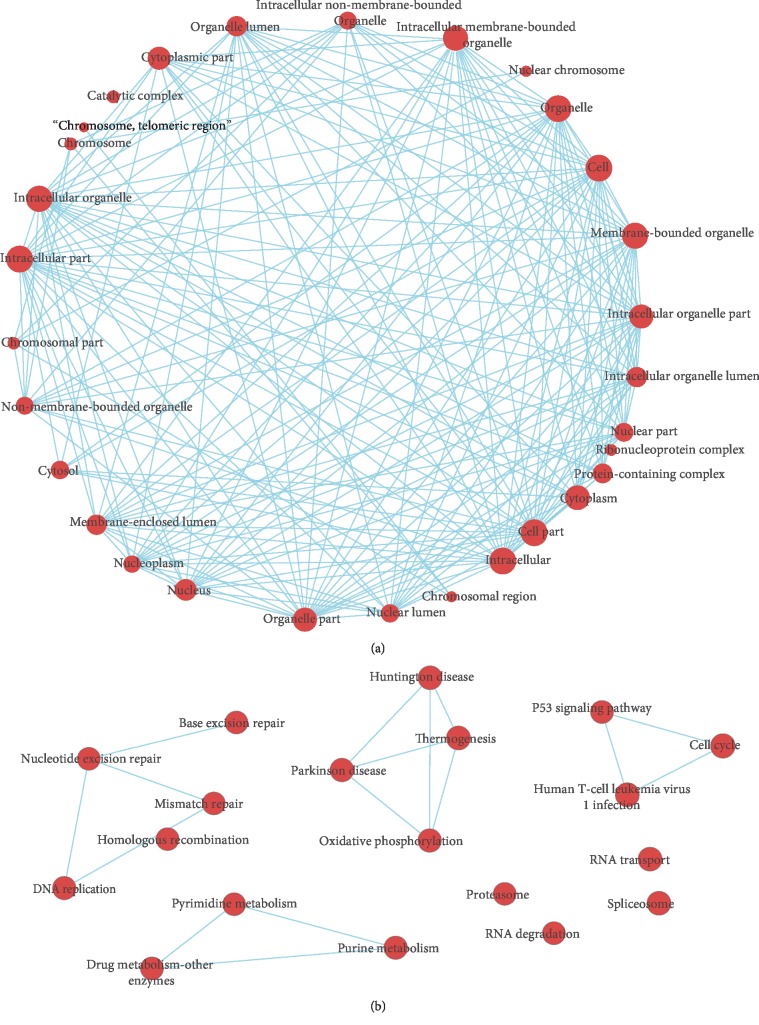
To get an overall understanding of 725 genes in the brown module, we conducted GO terms and KEGG pathway enrichment. The results of GO-BP terms and KEGG pathway enrichment showed that genes within brown modules were significantly enriched in cell cycle-associated processes (such as “mitotic cell cycle,” “mitotic cell cycle process,” “cell cycle,” “mitotic cell cycle phase transition,” “cell cycle phase transition,” and “regulation of cell cycle”) as well as DNA damage repair-related processes (including “cellular response to DNA damage stimulus,” “DNA repair,” “mismatch repair,” “nucleotide excision repair,” and “base excision repair”) (Figure 5). Besides, a significant enrichment in multiple cancer-related pathways such as “p53 signaling pathway” and “human T−cell leukemia virus 1 infection” was observed. Additionally, by Cytoscape software (version 3.6.0), we constructed interaction networks between the enriched GO terms and KEGG pathways (Figures 6 and 7).
Figure 5.
GO terms and KEGG pathway enrichment analysis of genes in the brown module. (a) GO-biological process enrichment analysis. (b) KEGG pathway enrichment analysis.
Figure 6.
Interaction networks between enriched GO-biological process and cellular component terms. (a) Enriched GO-biological process terms based interaction networks. (b) Enriched GO-cellular component terms based interaction networks.
Figure 7.
Interaction networks between enriched GO-molecular function terms and KEGG pathways. (a) Enriched GO-molecular function terms based interaction networks. (b) Enriched KEGG pathways based interaction networks.
3.3. Hub Genes Identification and Comprehensive Validation in Multiple Database
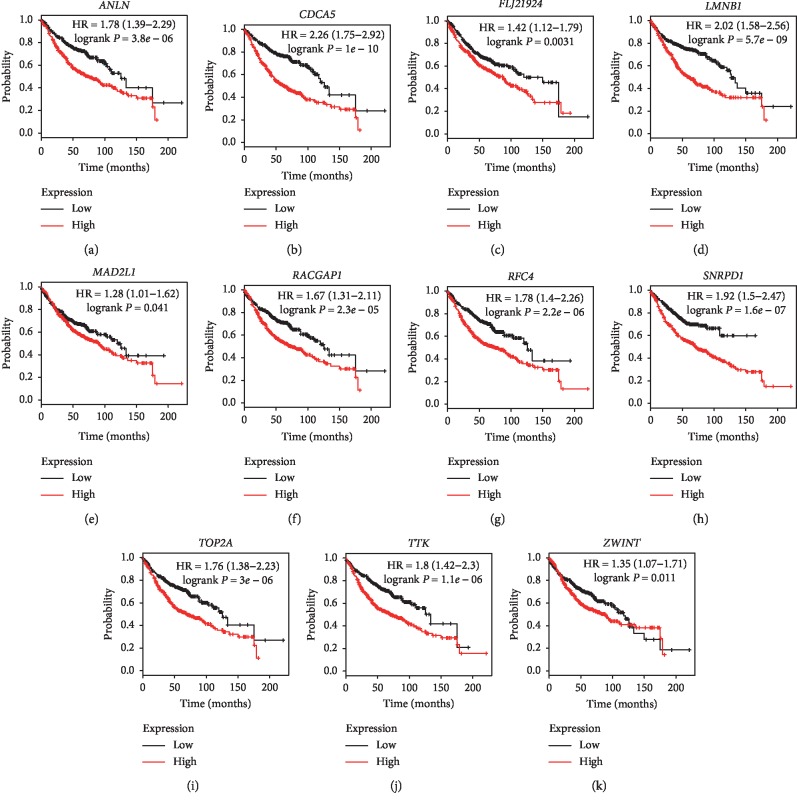
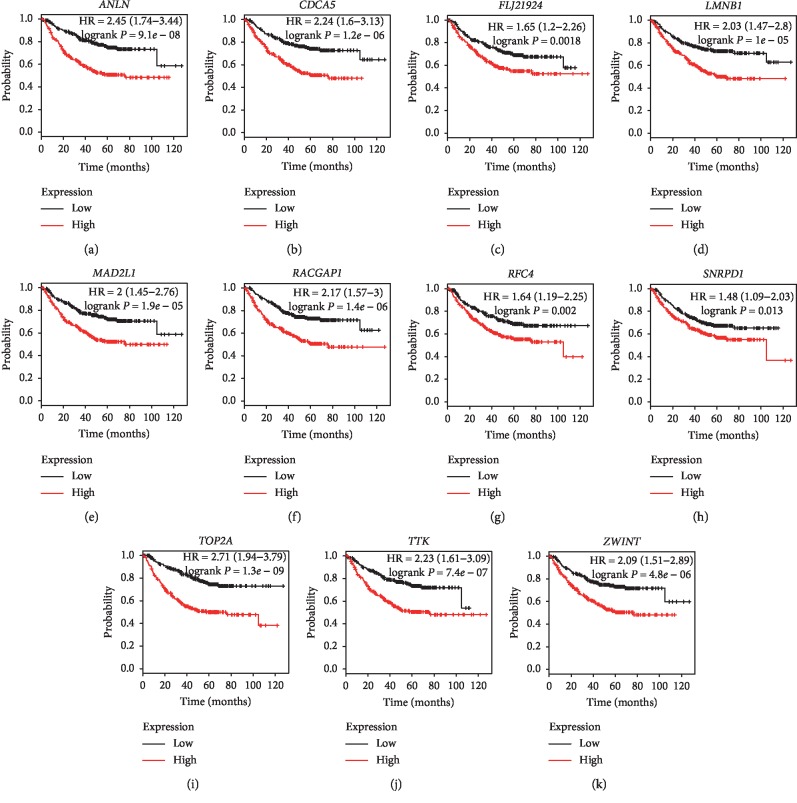
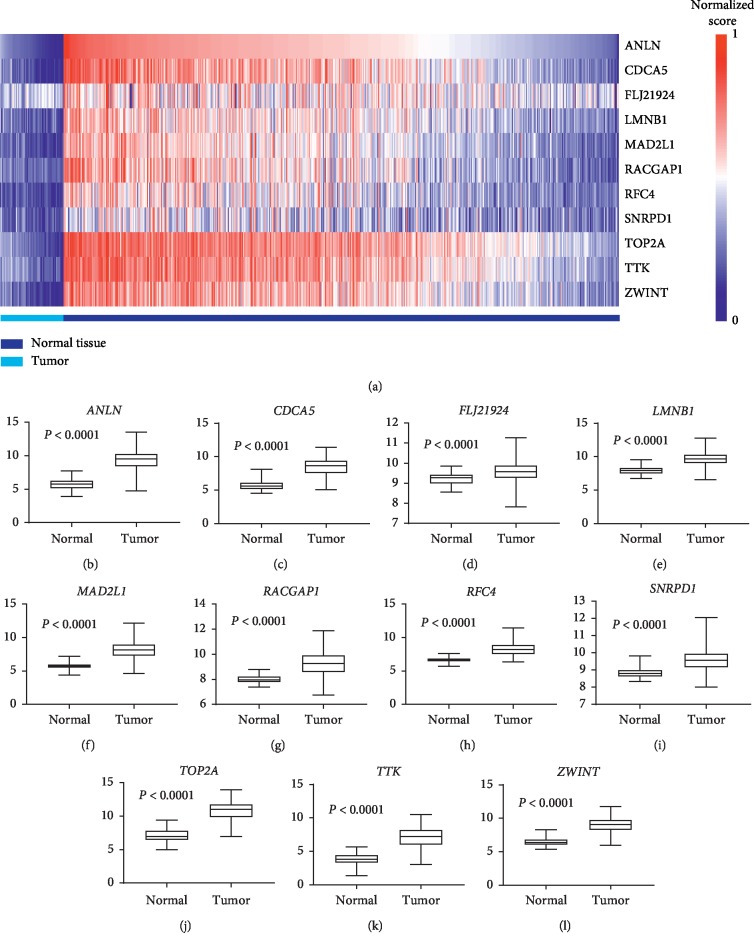
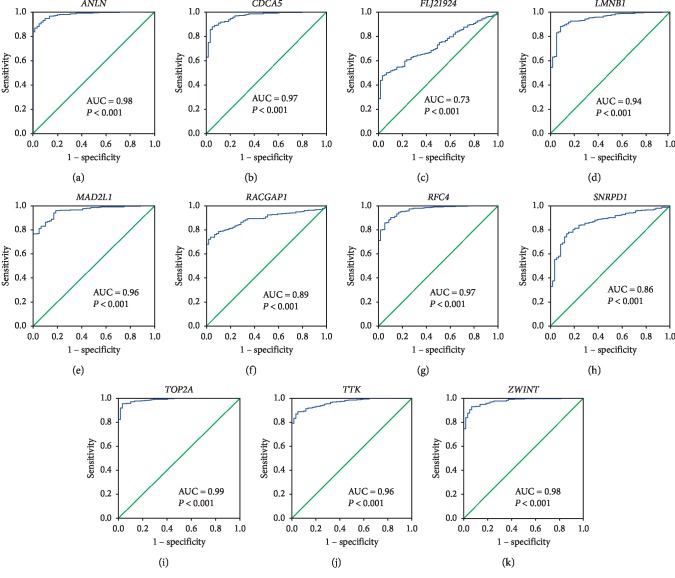
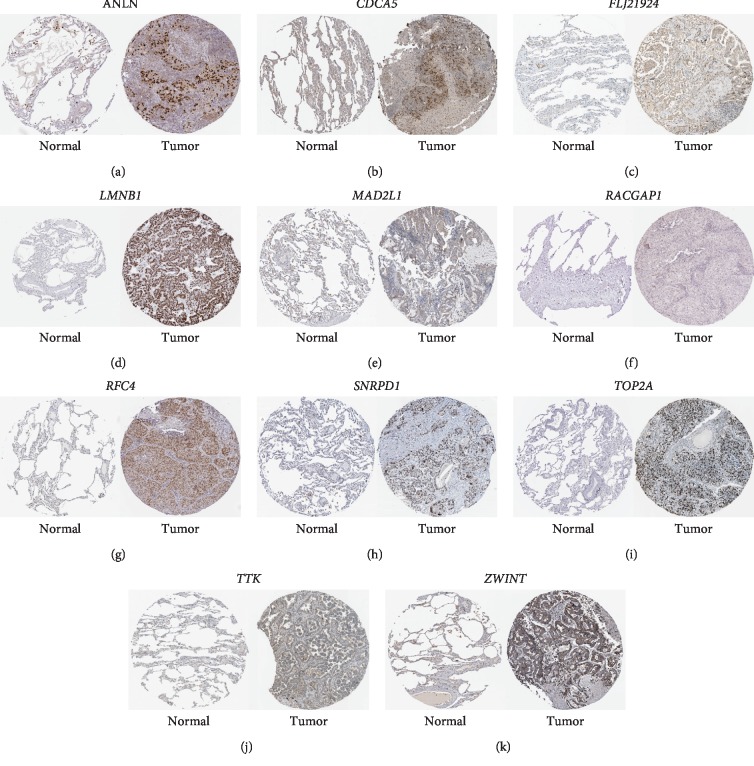
Under the condition of setting cut-off value as |cor.geneModuleMembership| ≥ 0.8 and |cor.geneTraitSignificance| ≥ 0.2, 29 genes in the brown module were identified as hub genes. Among these 29 genes, we found that the expression levels of 11 genes were significantly related with worse overall survival (OS) (Figure 8) and progression-free survival (PFS) (Figure 9), which included ANLN, CDCA5, FLJ21924 (also known as QSER1), LMNB1, MAD2L1, RACGAP1, RFC4, SNRPD1, TOP2A, TTK, and ZWINT. In addition, the data of TCGA showed that the mRNA levels of the panel of genes were significantly (all P values <0.0001) upregulated in primary LUAD tissues compared with normal tissues (Figure 10). Notably, ROC curves showed that the whole 11 identified genes had highly diagnostic efficiencies to distinguish tumors from normal tissues (Figure 11). The results of immunohistochemical staining in the Human Protein Atlas database indicated that the protein abundances of ANLN, CDCA5, FLJ21924, LMNB1, MAD2L1, RACGAP1, RFC4, SNRPD1, TOP2A, TTK, and ZWINT were higher in LUAD tissues than normal lung tissues (Figure 12).
Figure 8.
Overall survival analysis of the 11 hub genes in LUADs by online tool Kaplan–Meier plotter. The patients were classified into high-expression group and low-expression group based on the median mRNA levels of (a) ANLN, (b) CDCA5, (c) FLJ21924, (d) LMNB1, (e) MAD2L1, (f) RACGAP1, (g) RFC4, (h) SNRPD1, (i) TOP2A, (j) TTK, and (k) ZWINT.
Figure 9.
Progression-free survival analysis of the 11 hub genes in LUADs by online tool Kaplan–Meier plotter. The patients were classified into high-expression group and low-expression group based on the median mRNA level of (a) ANLN, (b) CDCA5, (c) FLJ21924, (d) LMNB1, (e) MAD2L1, (f) RACGAP1, (g) RFC4, (h) SNRPD1, (i) TOP2A, (j) TTK, and (k) ZWINT.
Figure 10.
Gene expression levels of the 11 hub genes in normal tissues and LUADs. (a) The heat map of mRNA levels of ANLN, CDCA5, FLJ21924, LMNB1, MAD2L1, RACGAP1, RFC4, SNRPD1, TOP2A, TTK, and ZWINT in primary tumors and normal tissues. The comparisons of mRNA levels of (b) ANLN, (c) CDCA5, (d) FLJ21924, (e) LMNB1, (f) MAD2L1, (g) RACGAP1, (h) RFC4, (i) SNRPD1, (j) TOP2A, (k) TTK, and (l) ZWINT between primary tumors and normal tissues.
Figure 11.
The ROC curves of 11 hub genes. These ROC curves described the diagnostic efficiency of the mRNA levels of (a) ANLN, (b) CDCA5, (c) FLJ21924, (d) LMNB1, (e) MAD2L1, (f) RACGAP1, (g) RFC4, (h) SNRPD1, (i) TOP2A, (j) TTK, and (k) ZWINT for LUADs and normal tissues.
Figure 12.
The results of the immunohistochemistry staining of the 11 hub genes obtained from the Human Protein Atlas database. Representative images of immunohistochemistry staining of (a) ANLN, (b) CDCA5, (c) FLJ21924, (d) LMNB1, (e) MAD2L1, (f) RACGAP1, (g) RFC4, (h) SNRPD1, (i) TOP2A, (j) TTK, and (k) ZWINT in normal (left) and LUADs (right). These images were obtained from the Human Protein Atlas database and the corresponding web links were given in supplementary .
4. Discussion
Within the last decade, the finding of EGFR mutation and ALK rearrangement in LUAD patients have propelled the development and application of targeted therapies including EGFR tyrosine kinase inhibitors (TKIs) and crizotinib. Actually, targeted therapies have been the standard care for advanced LUAD patients harboring EGFR or ALK alterations. Following the implementation of large-scale genomic studies of Clinical Lung Cancer Genome Project, it has been realized that LUADs are more likely to be driven by single somatic alteration than squamous cell carcinomas [19]. Therefore, LUADs could more easily benefit from various molecular targeted therapies. Despite the huge clinical benefits brought by targeted therapies in multiple subtypes of patients, the 5 years survival rate of lung cancer patients is still less than 20% [20]. More alterations related to LUAD are continually discovered. For example, Keap1/Nrf2 and Dach1/Eya/Six signaling pathways are involved in the oncogenesis and therapeutic resistance of NSCLC [21–23]. It is generally believed that due to the high heterogeneity in genome and complex mutation spectrum, genetic alteration-guided molecular targeted therapy has a long way to go. A more comprehensive understanding of the genetic traits of tumors is the foundation of personalized medicine for LUAD. In this study, we analyzed gene expression data from GEO and TCGA databases to identify biomarkers heralding tumorigenesis and the poor outcomes of LUADs.
This WGCNA was performed based on GSE11969 which was aiming to explore the coexpression modules related to clinical outcomes of LUAD patients. To save computer memory and data processing time, we selected top 50% most differentially expressed genes to generate a coexpression network. Eventually, we found the brown modules were significantly correlated with patients' clinical traits and identified 29 hub genes. After validating in multiple public databases, we noticed the elevated mRNA levels of 11 genes strongly indicated the poorer PFS and OS of LUADs. The preliminary results showed that this panel of genes including ANLN, CDCA5, FLJ21924, LMNB1, MAD2L1, RACGAP1, RFC4, SNRPD1, TOP2A, TTK, and ZWINT were potential adverse prognostic factors and tumorigenesis biomarkers for LUAD patients.
Human ANLN is a homologue of anillin (an actin-binding protein in Drosophila) [24]. ANLN is a cell cycle-associated protein which not only participates in cytokinesis but also promotes the growth and migration activities by PI3K-Akt and Rho signaling pathways [24, 25]. Previous studies demonstrated that the high protein abundance of ANLN was the predictive biomarker for multiple cancers such as breast cancer [26], lung squamous cell carcinoma [27], and prostate cancer [28]. Our results showed that upregulated ANLN was related to shortened PFS and OS of LUADs. However, the exact mechanisms by which ANLN induces LUAD progression and affects patients' outcomes are still unclear. Human CDCA5 (also known as Sororin) is the core regulator of the cohesion of sister chromatins and the removal of cohesion [29]. Up to now, there is no direct evidence that CDCA5 relates to the initiation and development of any subtype of lung cancer. However, the role of CDCA5 has been confirmed in other cancers including hepatocellular cancer [30], breast cancer [31], gastric cancer [32], and colorectal cancer [33]. Accumulating studies showed that increased CDCA5 level was a diagnostic biomarker and risk factor for numerous cancers which could enhance the tumor cells' capability of proliferation and metastasis by oncogenic ERK5-AP-1 pathway [33, 34].
LMNB1 (also termed as lamin B1) is the vital component of nuclear structure which locates between inner nuclear membrane and peripheral heterochromatin [35]. LMNB1 and its binding protein form the nuclear matrix and modulate a number of biology functions such as genome replication, DNA damage repair, transcription, as well as nuclear stability [35]. Moreover, LMNB1 is regarded as a cancer-associated protein. It was reported that the expression of LMNB1 positively correlated with low-grade differentiation and the risk of distant metastasis [36]. In addition, the silencing of LMNB1 impaired tumorigenicity, tumor invasion, and cell proliferation in pancreatic cancer cells [36]. Additionally, the overexpression of LMNB1 was the biomarker indicating the occurrence of retinoblastomas and poor prognosis of colon cancers [35, 37]. The relationship between LMNB1 and LUAD has not been observed previously and LMNB1 might be a promising predictive biomarker and molecular target.
RACGAP1 (also referred to as Rac GTPase activating protein 1) is a cytokinesis-regulatory protein which is often overexpressed in multiple cancers. Knocking out RACGAP1 in hepatocellular carcinoma cells hampered cytokinesis and induced cell apoptosis [38]. Upregulated RACGAP1 predicted the poor outcomes in patients with hepatocellular carcinoma [38], ovarian cancer [39], and bladder cancer [40]. However, there are no preclinical or clinical studies demonstrating the role of RACGAP1 in LUAD. Similar to RACGAP1, RFC4 (also known as human replication factor C4) participates in the regulation of cell cycle as well, which acts as a clamp loader in DNA replication. Previous studies showed that the high expression of RFC4 was the biomarker of tumorigenesis, poor survival [41], as well as chemotherapy resistance of colorectal cancer patients [42]. Given no experimental results supporting the role of RFC4 in LUAD, further investigation is needed.
There are rare studies investigating the role of FLJ21924 (QSER1) and SNRPD1 in cancers. On the contrary, the predictive roles of MAD2L1 and ZWINT for LUADs have been reported [43, 44]. Moreover, TOP2A (DNA topoisomerase II alpha) encodes a DNA topoisomerase which is a well-studied cancer-associated protein [45]. Several anticancer agents targeting DNA topoisomerase have been applied in clinical practice [46]. Apart from TOP2A, agents targeting another oncogenic molecular TTK are under development [47].
WGCNA is a widely adopted method to perform large-scale data mining. It is generally believed that genes in the same module share similar biology function. In our study, we found that the genes in the clinical significant module were significantly enriched in cell cycle and DNA damage repair-related pathways. However, the results might be misinterpreted due to the tissue contaminations or other technical defaults. To make our results more stable and decrease the potential biases, we conducted a comprehensive validation in other databases including TCGA and the Human Protein Atlas.
5. Conclusion
In conclusion, based on the WGCNA data mining technique, our study identified a panel of tumorigenesis and poor prognosis-related biomarkers. Among the screened hub genes, the mRNA levels of ANLN, CDCA5, FLJ21924, LMNB1, MAD2L1, RACGAP1, RFC4, SNRPD1, TOP2A, TTK, and ZWINT significantly related to worse survival data of LUAD patients. Our results indicated that these 11 genes might be potential predictive biomarkers and molecular targets in LUAD treatment.
Acknowledgments
This work was supported by the National Natural Science Foundation of China (Nos. 81874120, 81572608, and 81672984), Wuhan Science and Technology Bureau (No. 2017060201010170).
Contributor Information
Anping Li, Email: li_anping@yahoo.com.
Kongming Wu, Email: kmwu@tjh.tjmu.edu.cn.
Data Availability
Previously reported gene expression data (GSE11969) were used to support this study and are available at the NCBI-GEO database (https://www.ncbi.nlm.nih.gov/geo). Pretreated TCGA data were obtained from https://xena.ucsc.edu/.
Conflicts of Interest
The authors declare that there are no conflicts of interest regarding the publication of this article.
Authors' Contributions
Ming Yi and Tianye Li contributed equally to this work.
Supplementary Materials
Supplementary file 1: the correlation analysis of 9 modules. Supplementary File 2: for the given data of patients' differentiation grade, the correlation analysis was based on the results of gene significance and cor.geneModuleMembership. Supplementary File 3: the web links of images from the Human Protein Atlas database in the paper.
References
- 1.Imielinski M., Berger A. H., Hammerman P. S., et al. Mapping the hallmarks of lung adenocarcinoma with massively parallel sequencing. Cell. 2012;150(6):1107–1120. doi: 10.1016/j.cell.2012.08.029. [DOI] [PMC free article] [PubMed] [Google Scholar]
- 2.Siegel R. L., Miller K. D., Jemal A. Cancer statistics, 2019. CA: A Cancer Journal for Clinicians. 2019;69(1):7–34. doi: 10.3322/caac.21551. [DOI] [PubMed] [Google Scholar]
- 3.Liu D., Vokes N. I., Van Allen E. M. Toward molecularly driven precision medicine in lung adenocarcinoma. Cancer Discovery. 2017;7(6):555–557. doi: 10.1158/2159-8290.cd-17-0355. [DOI] [PMC free article] [PubMed] [Google Scholar]
- 4.Hirsch F. R., Scagliotti G. V., Mulshine J. L., et al. Lung cancer: current therapies and new targeted treatments. The Lancet. 2017;389(10066):299–311. doi: 10.1016/s0140-6736(16)30958-8. [DOI] [PubMed] [Google Scholar]
- 5.Devarakonda S., Morgensztern D., Govindan R. Genomic alterations in lung adenocarcinoma. The Lancet Oncology. 2015;16(7):e342–e351. doi: 10.1016/s1470-2045(15)00077-7. [DOI] [PubMed] [Google Scholar]
- 6.Mok T. S., Wu Y.-L., Thongprasert S., et al. Gefitinib or carboplatin-paclitaxel in pulmonary adenocarcinoma. New England Journal of Medicine. 2009;361(10):947–957. doi: 10.1056/nejmoa0810699. [DOI] [PubMed] [Google Scholar]
- 7.Shaw A. T., Kim D.-W., Nakagawa K., et al. Crizotinib versus chemotherapy in advanced ALK-positive lung cancer. New England Journal of Medicine. 2013;368(25):2385–2394. doi: 10.1056/nejmoa1214886. [DOI] [PubMed] [Google Scholar]
- 8.Liu Q., Yu S., Zhao W., Qin S., Chu Q., Wu K. EGFR-TKIs resistance via EGFR-independent signaling pathways. Molecular Cancer. 2018;17(1):p. 53. doi: 10.1186/s12943-018-0793-1. [DOI] [PMC free article] [PubMed] [Google Scholar]
- 9.The Cancer Genome Atlas Research Network. Comprehensive molecular profiling of lung adenocarcinoma. Nature. 2014;514:p. 262. doi: 10.1038/nature13879. [DOI] [PMC free article] [PubMed] [Google Scholar]
- 10.Mayekar M. K., Bivona T. G. Current landscape of targeted therapy in lung cancer. Clinical Pharmacology & Therapeutics. 2017;102(5):757–764. doi: 10.1002/cpt.810. [DOI] [PubMed] [Google Scholar]
- 11.Fukuoka M., Wu Y.-L., Thongprasert S., et al. Biomarker analyses and final overall survival results from a phase III, randomized, open-label, first-line study of gefitinib versus carboplatin/paclitaxel in clinically selected patients with advanced non-small-cell lung cancer in Asia (IPASS) Journal of Clinical Oncology. 2011;29(21):2866–2874. doi: 10.1200/jco.2010.33.4235. [DOI] [PubMed] [Google Scholar]
- 12.Saito M., Shiraishi K., Kunitoh H., Takenoshita S., Yokota J., Kohno T. Gene aberrations for precision medicine against lung adenocarcinoma. Cancer Science. 2016;107(6):713–720. doi: 10.1111/cas.12941. [DOI] [PMC free article] [PubMed] [Google Scholar]
- 13.Zhang Y., Wang D. C., Shi L., Zhu B., Min Z., Jin J. Genome analyses identify the genetic modification of lung cancer subtypes. Seminars in Cancer Biology. 2017;42:20–30. doi: 10.1016/j.semcancer.2016.11.005. [DOI] [PubMed] [Google Scholar]
- 14.Langfelder P., Horvath S. WGCNA: an R package for weighted correlation network analysis. BMC Bioinformatics. 2008;9(1):p. 559. doi: 10.1186/1471-2105-9-559. [DOI] [PMC free article] [PubMed] [Google Scholar]
- 15.Tang J., Kong D., Cui Q., et al. Prognostic genes of breast cancer identified by gene co-expression network analysis. Frontiers in Oncology. 2018;8:p. 374. doi: 10.3389/fonc.2018.00374. [DOI] [PMC free article] [PubMed] [Google Scholar]
- 16.Takeuchi T., Tomida S., Yatabe Y., et al. Expression profile-defined classification of lung adenocarcinoma shows close relationship with underlying major genetic changes and clinicopathologic behaviors. Journal of Clinical Oncology. 2006;24(11):1679–1688. doi: 10.1200/jco.2005.03.8224. [DOI] [PubMed] [Google Scholar]
- 17.Zhai X., Xue Q., Liu Q., Guo Y., Chen Z. Colon cancer recurrence-associated genes revealed by WGCNA co-expression network analysis. Molecular Medicine Reports. 2017;16(5):6499–6505. doi: 10.3892/mmr.2017.7412. [DOI] [PMC free article] [PubMed] [Google Scholar]
- 18.Gyorffy B., Surowiak P., Budczies J., Lanczky A. Online survival analysis software to assess the prognostic value of biomarkers using transcriptomic data in non-small-cell lung cancer. PLoS One. 2013;8(12) doi: 10.1371/journal.pone.0082241.e82241 [DOI] [PMC free article] [PubMed] [Google Scholar]
- 19.Osmani L., Askin F., Gabrielson E., Li Q. K. Current WHO guidelines and the critical role of immunohistochemical markers in the subclassification of non-small cell lung carcinoma (NSCLC): moving from targeted therapy to immunotherapy. Seminars in Cancer Biology. 2018;52:103–109. doi: 10.1016/j.semcancer.2017.11.019. [DOI] [PMC free article] [PubMed] [Google Scholar]
- 20.Travis W. D., Brambilla E., Nicholson A. G., et al. The 2015 world health organization classification of lung tumors. Journal of Thoracic Oncology. 2015;10(9):1243–1260. doi: 10.1097/jto.0000000000000630. [DOI] [PubMed] [Google Scholar]
- 21.Tian Y., Wu K., Liu Q., et al. Modification of platinum sensitivity by KEAP1/NRF2 signals in non-small cell lung cancer. Journal of Hematology & Oncology. 2016;9:p. 83. doi: 10.1186/s13045-016-0311-0. [DOI] [PMC free article] [PubMed] [Google Scholar]
- 22.Jeong Y., Hellyer J. A., Stehr H., et al. Role of KEAP1/NFE2L2 mutations in the chemotherapeutic response of patients with non-small cell lung cancer. Clinical Cancer Research. 2020;26(1):274–281. doi: 10.1158/1078-0432.ccr-19-1237. [DOI] [PMC free article] [PubMed] [Google Scholar]
- 23.Liu Q., Li A., Yu S., et al. DACH1 antagonizes CXCL8 to repress tumorigenesis of lung adenocarcinoma and improve prognosis. Journal of Hematology & Oncology. 2018;11:p. 53. doi: 10.1186/s13045-018-0597-1. [DOI] [PMC free article] [PubMed] [Google Scholar]
- 24.Suzuki C., Daigo Y., Ishikawa N., et al. ANLN plays a critical role in human lung carcinogenesis through the activation of RHOA and by involvement in the phosphoinositide 3-kinase/AKT pathway. Cancer Research. 2005;65(24):11314–11325. doi: 10.1158/0008-5472.can-05-1507. [DOI] [PubMed] [Google Scholar]
- 25.Ogata T., Teshima T., Inaoka M., et al. Carbon ion irradiation suppresses metastatic potential of human non-small cell lung cancer A549 cells through the phosphatidylinositol-3-kinase/Akt signaling pathway. Journal of Radiation Research. 2011;52(3):374–379. doi: 10.1269/jrr.10102. [DOI] [PubMed] [Google Scholar]
- 26.Leary P. C. O’., Penny S. A., Dolan R. T., et al. Systematic antibody generation and validation via tissue microarray technology leading to identification of a novel protein prognostic panel in breast cancer. BMC Cancer. 2013;13(1):p. 175. doi: 10.1186/1471-2407-13-175. [DOI] [PMC free article] [PubMed] [Google Scholar]
- 27.Skrzypski M., Jassem E., Taron M., et al. Three-gene expression signature predicts survival in early-stage squamous cell carcinoma of the lung. Clinical Cancer Research. 2008;14(15):4794–4799. doi: 10.1158/1078-0432.ccr-08-0576. [DOI] [PubMed] [Google Scholar]
- 28.Takayama K.-I., Suzuki Y., Yamamoto S., Obinata D., Takahashi S., Inoue S. Integrative genomic analysis of OCT1 reveals coordinated regulation of androgen receptor in advanced prostate cancer. Endocrinology. 2019;160(2):463–472. doi: 10.1210/en.2018-00923. [DOI] [PubMed] [Google Scholar]
- 29.Zhang N., Pati D. C-terminus of Sororin interacts with SA2 and regulates sister chromatid cohesion. Cell Cycle. 2015;14(6):820–826. doi: 10.1080/15384101.2014.1000206. [DOI] [PMC free article] [PubMed] [Google Scholar]
- 30.Wang J., Xia C., Pu M., et al. Silencing of CDCA5 inhibits cancer progression and serves as a prognostic biomarker for hepatocellular carcinoma. Oncology Reports. 2018;40:1875–1884. doi: 10.3892/or.2018.6579. [DOI] [PMC free article] [PubMed] [Google Scholar]
- 31.Phan N. N., Wang C. Y., Li K. L., et al. Distinct expression of CDCA3, CDCA5, and CDCA8 leads to shorter relapse free survival in breast cancer patient. Oncotarget. 2018;9(6):6977–6992. doi: 10.18632/oncotarget.24059. [DOI] [PMC free article] [PubMed] [Google Scholar]
- 32.Zhang Z., Shen M., Zhou G. Upregulation of CDCA5 promotes gastric cancer malignant progression via influencing cyclin E1. Biochemical and Biophysical Research Communications. 2018;496(2):482–489. doi: 10.1016/j.bbrc.2018.01.046. [DOI] [PubMed] [Google Scholar]
- 33.Zhuang K., Zhang J., Xiong M., et al. CDK5 functions as a tumor promoter in human colorectal cancer via modulating the ERK5-AP-1 axis. Cell Death & Disease. 2016;7(10) doi: 10.1038/cddis.2016.333.e2415 [DOI] [PMC free article] [PubMed] [Google Scholar]
- 34.Shen A., Liu L., Chen H., et al. Cell division cycle associated 5 promotes colorectal cancer progression by activating the ERK signaling pathway. Oncogenesis. 2019;8(3):p. 19. doi: 10.1038/s41389-019-0123-5. [DOI] [PMC free article] [PubMed] [Google Scholar]
- 35.Izdebska M., Gagat M., Grzanka A. Overexpression of lamin B1 induces mitotic catastrophe in colon cancer LoVo cells and is associated with worse clinical outcomes. International Journal of Oncology. 2018;52(1):89–102. doi: 10.3892/ijo.2017.4182. [DOI] [PMC free article] [PubMed] [Google Scholar]
- 36.Li L., Du Y., Kong X., et al. Lamin B1 is a novel therapeutic target of betulinic acid in pancreatic cancer. Clinical Cancer Research. 2013;19(17):4651–4661. doi: 10.1158/1078-0432.ccr-12-3630. [DOI] [PMC free article] [PubMed] [Google Scholar]
- 37.Danda R., Ganapathy K., Sathe G., et al. Membrane proteome of invasive retinoblastoma: differential proteins and biomarkers. PROTEOMICS-Clinical Applications. 2018;12(5) doi: 10.1002/prca.201700101.1700101 [DOI] [PubMed] [Google Scholar]
- 38.Yang X.-M., Cao X.-Y., He P., et al. Overexpression of rac GTPase activating protein 1 contributes to proliferation of cancer cells by reducing hippo signaling to promote cytokinesis. Gastroenterology. 2018;155(4):1233–1249.e22. doi: 10.1053/j.gastro.2018.07.010. [DOI] [PubMed] [Google Scholar]
- 39.Wang C., Wang W., Liu Y., Yong M., Yang Y., Zhou H. Rac GTPase activating protein 1 promotes oncogenic progression of epithelial ovarian cancer. Cancer Science. 2018;109(1):84–93. doi: 10.1111/cas.13434. [DOI] [PMC free article] [PubMed] [Google Scholar]
- 40.Ge Q., Lu M., Ju L., et al. miR-4324-RACGAP1-STAT3-ESR1 feedback loop inhibits proliferation and metastasis of bladder cancer. International Journal of Cancer. 2019;144(12):3043–3055. doi: 10.1002/ijc.32036. [DOI] [PubMed] [Google Scholar]
- 41.Xiang J., Fang L., Luo Y., et al. Levels of human replication factor C4, a clamp loader, correlate with tumor progression and predict the prognosis for colorectal cancer. Journal of Translational Medicine. 2014;12(1):p. 320. doi: 10.1186/s12967-014-0320-0. [DOI] [PMC free article] [PubMed] [Google Scholar]
- 42.Wang X. C., Yue X., Zhang R. X., et al. Genome-wide RNAi screening identifies RFC4 as a factor that mediates radioresistance in colorectal cancer by facilitating nonhomologous end joining repair. Clinical Cancer Research. 2019;25(14):4567–4579. doi: 10.1158/1078-0432.ccr-18-3735. [DOI] [PubMed] [Google Scholar]
- 43.Shi Y. X., Zhu T., Zou T., et al. Prognostic and predictive values of CDK1 and MAD2L1 in lung adenocarcinoma. Oncotarget. 2016;7(51):85235–85243. doi: 10.18632/oncotarget.13252. [DOI] [PMC free article] [PubMed] [Google Scholar]
- 44.Peng F., Li Q., Niu S.-Q., et al. ZWINT is the next potential target for lung cancer therapy. Journal of Cancer Research and Clinical Oncology. 2019;145(3):661–673. doi: 10.1007/s00432-018-2823-1. [DOI] [PMC free article] [PubMed] [Google Scholar]
- 45.Labbé D. P., Sweeney C. J., Brown M., et al. TOP2A and EZH2 provide early detection of an aggressive prostate cancer subgroup. Clinical Cancer Research. 2017;23(22):7072–7083. doi: 10.1158/1078-0432.ccr-17-0413. [DOI] [PMC free article] [PubMed] [Google Scholar]
- 46.Economides M. P., McCue D., Borthakur G., Pemmaraju N. Topoisomerase II inhibitors in AML: past, present, and future. Expert Opinion on Pharmacotherapy. 2019;20(13):1637–1644. doi: 10.1080/14656566.2019.1621292. [DOI] [PubMed] [Google Scholar]
- 47.Riggs J. R., Elsner J., Cashion D., et al. Design and optimization leading to an orally active TTK protein kinase inhibitor with robust single agent efficacy. Journal of Medicinal Chemistry. 2019;62(9):4401–4410. doi: 10.1021/acs.jmedchem.8b01869. [DOI] [PubMed] [Google Scholar]
Associated Data
This section collects any data citations, data availability statements, or supplementary materials included in this article.
Supplementary Materials
Supplementary file 1: the correlation analysis of 9 modules. Supplementary File 2: for the given data of patients' differentiation grade, the correlation analysis was based on the results of gene significance and cor.geneModuleMembership. Supplementary File 3: the web links of images from the Human Protein Atlas database in the paper.
Data Availability Statement
Previously reported gene expression data (GSE11969) were used to support this study and are available at the NCBI-GEO database (https://www.ncbi.nlm.nih.gov/geo). Pretreated TCGA data were obtained from https://xena.ucsc.edu/.


