Significance
Biofuels are renewables that are blended with conventional fuels because of similarities in the composition and other physical and chemical properties. Over the last 10 y, researchers have examined a variety of biofuels that could replace fossil fuels; however, most have fallen into a few categories of chemical classes. Even though biofuels are a promising renewable alternative to conventional petroleum fuels that could lower greenhouse gas emissions, the products that are most efficiently produced from biomass may not have well-characterized combustion properties as they represent a wide range of chemical structures, which have different emission behavior. The current work provides a comprehensive evaluation of the sooting tendencies of high-performance biofuels selected by the US Department of Energy.
Keywords: biofuel, soot, shock tube, laser absorption
Abstract
Soot emissions in combustion are unwanted consequences of burning hydrocarbon fuels. The presence of soot during and following combustion processes is an indication of incomplete combustion and has several negative consequences including the emission of harmful particulates and increased operational costs. Efforts have been made to reduce soot production in combustion engines through utilizing oxygenated biofuels in lieu of traditional nonoxygenated feedstocks. The ongoing Co-Optimization of Fuels and Engines (Co-Optima) initiative from the US Department of Energy (DOE) is focused on accelerating the introduction of affordable, scalable, and sustainable biofuels and high-efficiency, low-emission vehicle engines. The Co-Optima program has identified a handful of biofuel compounds from a list of thousands of potential candidates. In this study, a shock tube was used to evaluate the performance of soot reduction of five high-performance biofuels downselected by the Co-Optima program. Current experiments were performed at test conditions between 1,700 and 2,100 K and 4 and 4.7 atm using shock tube and ultrafast, time-resolve laser absorption diagnostic techniques. The combination of shock heating and nonintrusive laser detection provides a state-of-the-art test platform for high-temperature soot formation under engine conditions. Soot reduction was found in ethanol, cyclopentanone, and methyl acetate; conversely, an α-diisobutylene and methyl furan produced more soot compared to the baseline over longer test times. For each biofuel, several reaction pathways that lead towards soot production were identified. The data collected in these experiments are valuable information for the future of renewable biofuel development and their applicability in engines.
Soot emissions are undesirable by-products of hydrocarbon combustion, which become more prevalent under fuel-rich conditions. Soot particles not only are an indicator of incomplete combustion but also can negatively affect heat transfer as the soot is an intense emitter. Soot emissions contribute heavily to particulate matter in ambient air, which has been linked to adverse health effects (1, 2). Both acute and chronic exposure to the inhalation of particulate matter may exacerbate existing pulmonary and cardiac issues in humans and are linked to increased rates of lung disease, heart disease, and cancer (1, 2). Since the introduction of the US Clean Air Act of 1970 and several international efforts, there have been noticeable reductions in harmful emissions, such as soot. These efforts have made noticeable health improvements in the general population (3). Additionally, soot emissions have been directly linked to climate change, such that controlling black carbon emissions may be the most effective method to slowing global warming (4) as black carbon in soot is a dominant absorber of solar radiation in the atmosphere (5). There is an important need to understand the chemical kinetics of soot production to mitigate its formation.
Soot formation may be idealized through a sequence of four processes following the initial gas-phase reactions. 1) Homogeneous gas-phase nucleation of soot particles, via formation of polycyclic aromatic hydrocarbons (PAHs) (6), which occurs as a combination of the hydrogen abstraction/acetylene addition (HACA) reaction pathways. 2) After achieving a specific molecular weight, the PAH undergoes surface–particle reactions. 3) These enable particle coagulation and 4) subsequent agglomeration of particles. PAHs are found naturally in organic hydrocarbon fuels and are also formed from incomplete combustion of these fuels. PAHs are known carcinogens, mutagens, and teratogens, and therefore are a serious risk to the health of humans (7). Because of these deleterious effects to humans, their emissions are a concern of the US Environmental Protection Agency. Understanding PAH chemical kinetics is important to ensure they are fully consumed during combustion as PAH molecules are considered important precursors to soot and can have significant amounts produced in flame (6).
The Co-Optimization of Fuels and Engines (Co-Optima) initiative from the Department of Energy is focused on accelerating the introduction of affordable, scalable, and sustainable biofuels and high-efficiency, low-emission vehicle engines (8). The concurrent fuels and vehicles research and development are designed to deliver maximum energy savings, emissions reduction, and improved on-road vehicle performance. Co-Optima initiative has outlined several biofuels for spark ignition engines to evaluate for chemical properties and kinetic behavior. These fuels were selected to address the rigorous screening criteria that include fuel properties, health hazard assessments, biodegradability, feasibility of synthesis, etc., modeled. However, it should also be understood that items learned from this transportation fuel study should also be applicable to other novel combustion applications (9, 10). The candidate biofuels that were investigated have previously been experimented and modeled with using research combustion systems. 2-Methyl-furan (C5H6O), a furan, has been studied in a shock tube with a detailed chemical kinetic mechanism being published (11). Diisobutylene (C8H16), also known as 2,4,4-trimethyl-1-pentene (alpha) and 2,4,4-trimethyl-2-pentene (beta), is a ketone and has been studied, and a kinetic mechanism has been validated in a shock tube under engine-relevant conditions (12). Cyclopentanone (C5H8O), a cyclic ketone, has been previously studied in a shock tube and rapid compression machine (RCM) (13). Ethanol (C2H5OH), an alcohol, has been extensively studied and modeled, including, within shock tubes (14). Methyl acetate (CH3COOCH3), also known as methyl ethanoate, is a ester fuel and has been previously studied in a shock tube (15).
To understand anticipated soot emissions under practical combustion conditions, these fuels must be tested experimentally. Due to the complex mixtures of real fuels, there is a need for a baseline, which is easily reproducible; ethylene (C2H4) meets these requirements as a baseline fuel. Ethylene has been extensively studied in the literature as a soot-forming fuel with a wide variety of combustion systems (16–21). Additionally, there already exist well-established chemical kinetic reaction mechanisms for ethylene (22). There have been previous works on investigating soot formation within a shock tube (16, 23–28). These studies have found some useful trends: a reduction in soot formation for oxygen-containing fuels (oxygenates); lower equivalence ratios (Φ) had a positive effect on soot reduction; and the soot yield (ratio of soot carbon to overall system carbon) is reduced as fuel concentration is reduced. Some studies have already shown that oxygenates reduce soot production due to the carbon–oxygen bond (27, 29). Additionally, these studies have made measurements of the gas temperature, soot number density, and particle size. Furthermore, some of these shock tube studies have also measured additional species time histories such as acetylene, which is an important soot precursor.
In this study, a shock tube was used to experimentally observe biofuel combustion. Specifically, the goal of this work is to determine the sooting tendencies of subject biofuels and identify pathways of soot reduction. The conditions chosen are temperatures, pressures, and equivalence ratios that can be found inside an internal combustion engine. Current study was performed in the pressure range of 4 to 5 atm and temperature range of 1,700 to 2,100 K. Over 75 experimental combinations were found within seven datasets for this study. Two datasets of pure ethylene were measured with the same carbon content and equivalence ratios of 10.0 and 8.6. Then several datasets with an equivalence ratio of 8.6 mixture, carbon content held constant, and 75:25 blended ethylene and biofuel were experimented with. More details of these mixtures can be found in Methods. The resulting soot volume time histories at shock tube experimental conditions were evaluated using the Lawrence Livermore National Laboratory (LLNL) Co-Optima chemical kinetic mechanism (30) coupled with a modified version of the KM2 soot surface growth mechanism (31).
Results
Soot Measurements.
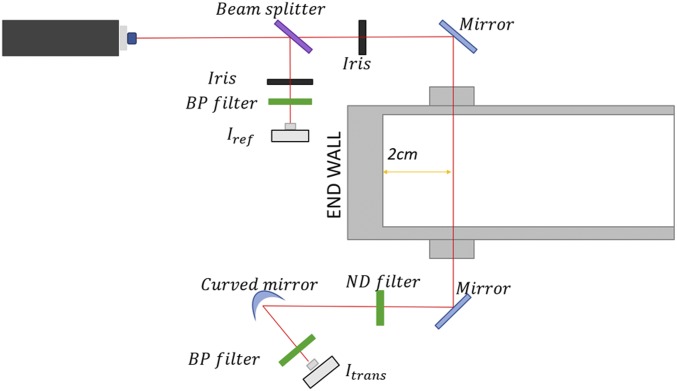
Soot measurements were performed using a laser-induced extinction method to measure soot induction time and volume fraction time histories (SI Appendix, Tables S1–S7). This method has been extensively used previously in shock tubes soot studies (23, 26, 27, 32–34). In Fig. 1, the soot measurement laser setup is shown. Measurements were taken with a Thorlabs HNL225R HeNe laser source at 632.8 nm. The beam, which was split using a beam splitter, enabled a filtered constant power beam to be recorded at a Newport 2032 detector obtaining a nominal power measurement. The other leg of the split beam was directed into the shock tube through a pair of wedged sapphire windows. A second Newport 2032 detector was used in conjunction with a narrow-bandpass filter (Thorlabs FL632.8-1) centered at 632.8 nm (FWHM, 1 nm) to block spurious emissions. Broadband neutral-density filters of density 0.3, 1.0, or 2.0 were used to enhance the signal-to-noise ratio.
Fig. 1.
Schematic of experimental setup for measurement of soot extinction.
The soot volume fraction is determined by the following Eq. 1 utilizing Beer–Lambert law relations:
| [1] |
In this equation, L is the path length (14.17 cm) within the tube, λ is the absorption wavelength (632.8 nm), It is the transmitted signal, while I0 is the incident signal. E(m) is the soot refractive index for absorption, calculated to be 0.228 using the Chang and Charalampopoulos relation for this wavelength (35). E(m) within literature ranges between 0.12 and 0.40 (25, 35); some authors listed over 15% uncertainty by including this value (23); so efforts to mitigate such errors will be discussed in a later section. Interference is not expected to be a concern from polycyclic aromatic hydrocarbons at 632.8 nm (17), and additionally, an experimental study found insignificant interference above 540 nm from PAH molecules (36). Obtaining soot volume fraction requires some approximations that have been established in previous works (16, 27). The first assumption is that soot consists overwhelmingly of carbon, ratios higher than 12:1 (C:H), in which the approximated molar weight is 12 g/mol. The second assumption is that the density of soot remains constant regardless of the experimental conditions and mixtures. This second assumption has been studied extensively, and over a wide range of fuels and combustion conditions, the density of soot can be approximated as 1.86 g/cm3 (37). Soot composition of the mixture (moles per cubic centimeter) can be calculated using Eqs. 2 and 3:
| [2] |
Soot is not directly an output from analytical mechanisms. Therefore, to compare experiments directly with the mechanism, , the soot yield must be calculated. Soot yield (SY) is defined as the soot carbon divided by the total carbon in the system:
| [3] |
| [4] |
[C]total can be calculated from the initial fuel concentration by using the ideal gas law with the temperature and pressure coming from ideal reflected shock relationships. Since driver inserts were utilized to keep the pressure and temperature constant during the test time and the mixture is near stagnant, the carbon content can be expected to remain constant. Soot yield was multiplied by the calculated E(m) for soot using the Chang and Charalampopoulos relation (35). E(m) was calculated to be 0.228 for this wavelength using this relation, a value independent of mixture composition. By doing this, it is possible to normalize the soot yield by emissivity and eliminate it from Eq. 1.
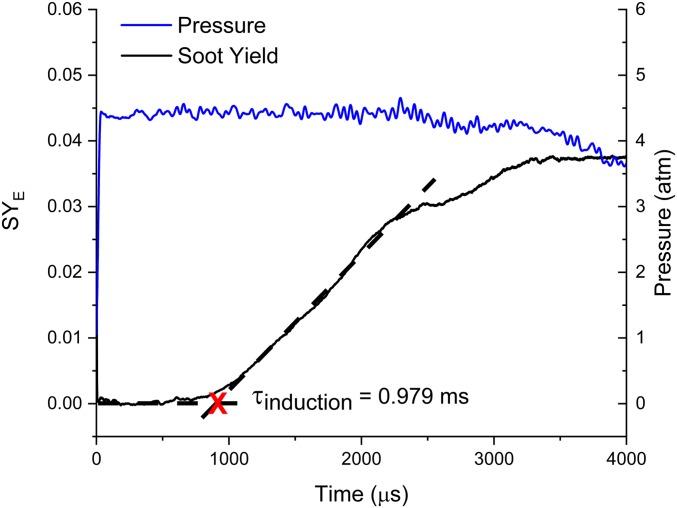
Soot induction times are defined in this study as the time interval between the arrival of the reflected shock wave until the onset of soot formation (27). Time zero is defined as the Schlieren spike due to the reflected shock arrival density change. The onset of soot formation is defined as the time of the steepest slope of soot formation linearly extrapolated to the baseline signal.
For each mixture, multiple experiments were run measuring emissions for the given wavelength. Typically, these experiments are performed above the temperature range of interest; however, soot oxidizes too rapidly at these temperatures. Therefore, additional experiments were run in the middle of the temperature region to ensure a mitigation of the soot emissions.
Uncertainty Analysis.
There are several factors that contribute to uncertainties when calculating the SYE. From Eqs. 1–3, the uncertainty in the SYE can be estimated using the following:
| [5] |
The uncertainties for absorbance can be calculated by observing the raw incident (I0) and transmitted (It) signals as well as the considering the noise from the detectors. The wavelength of the light was measured using a Bristol 771 laser spectrum analyzer during each experiment. The uncertainty in the density of soot was given from literature (37). The uncertainty of the optical path length of the shock tube was determined through direct measurement using measuring tools in our facility. Post shock pressure and temperature uncertainties were calculated from the experimental apparatuses (mixing tank preparation, timer counters, initial temperature, initial driven pressure, etc.). These uncertainties are 3.3% and 1%, respectively. Uncertainty in time zero based on the schlieren from the shock wave arrival was determined by the sampling rate of the data acquisition and was 0.5 μs. When all of these uncertainties are accounted for, is 10%.
A noted term not in the uncertainty estimation is E(m). Emissivity measurements suffer from a large uncertainty (∼50%) in this value; therefore, it was removed using methods presented in the work. Following successful methods by Agafonov et al. (16, 25), the removal of E(m) was repeated.
Obtaining soot measurements involved implementing several considerations from literature adapted to our facility (16, 23, 27, 32). Mixtures (1) and (2) in Table 1 only contained ethylene as fuel. Experiments conducted using these mixtures ensure that our methods were valid and comparable to literature (16). Verified elements included our laser setup, experiment preparation, as well as experimental soot yields, and trends. Second, these mixtures were then used as a comparable baseline to a substitute fuel mixture. In order to obtain meaningful data, the authors explored various combinations of pressure and fuel concentration to enable accurate data to be obtained. Authors selected these conditions (T, P, ϕ, fuel concentration, etc.) to ensure the absorbances from soot were within an acceptable range for the experimental setup. Once experimental investigations into (1) were completed, the authors reduced the equivalence ratio to prevent possible saturation due to the unknown nature of the biofuels. Subsequently, (2) was conducted at a ϕ of 8.6 and all other mixtures followed. Mixtures (1) and (2) (Table 1) performed were two ethylene mixtures with identical fuel concentration, pressure, and temperature range to ensure the only difference would be the oxygen concentration. When this process was validated, it was extended to the five biofuel candidates.
Table 1.
The seven mixtures within this study
| Mixture | Biofuel | XBiofuel | XC2H4 | XO2 | ϕ |
| (1) | Ethylene | N/A | 0.0250 | 0.0075 | 10 |
| (2) | Ethylene (baseline) | N/A | 0.0250 | 0.0087 | 8.6 |
| (3) | Methylfuran | 0.0025 | 0.0188 | 0.0077 | |
| (4) | α-Diisobutylene | 0.0016 | 0.0188 | 0.0088 | |
| (5) | Ethanol | 0.0063 | 0.0188 | 0.0087 | |
| (6) | Methyl acetate | 0.0042 | 0.0188 | 0.0082 | |
| (7) | Cyclopentanone | 0.0025 | 0.0188 | 0.0084 |
The carbon content of these mixtures was held constant. Argon balance as a bath gas was used.
Table 1 details the specific mixture concentrations. Ethylene was 2.5% of the mole fraction in (1) and (2). With the same absolute molar carbon content, (3) through (7) contained a 75:25 fuel carbon ratio. Seventy-five percent of the mixture’s carbon came from ethylene (1.88%) with the remaining carbon coming from the biofuel. Oxygen was varied as necessary to maintain the desired equivalence ratio. Argon was used for the remaining bath gas.
Induction Time.
Soot induction times (τind) are defined as consistent with other works as the time interval between the arrival of the reflected shock wave until the onset of soot formation (27). Time zero is defined as the Schlieren spike due to the reflected shock arrival density change. The onset of soot formation is defined as the time of the steepest slope of soot formation linearly extrapolated to the baseline signal. The soot time histories were recorded for each experiment.
In Fig. 2, the SYE time history and the induction time are shown. The emissivity can range between 0.12 and 0.4 for the wavelength, which would result in a large uncertainty. This procedure has been previously conducted (16, 25) with results matching well with modeling of SYE. When modeled, the emissivity will also be factored into volume fraction output for direct comparison.
Fig. 2.
SYE as a function of time. Test gas (5) with reflected gas conditions: T = 1,847 K; P = 4.36 atm.
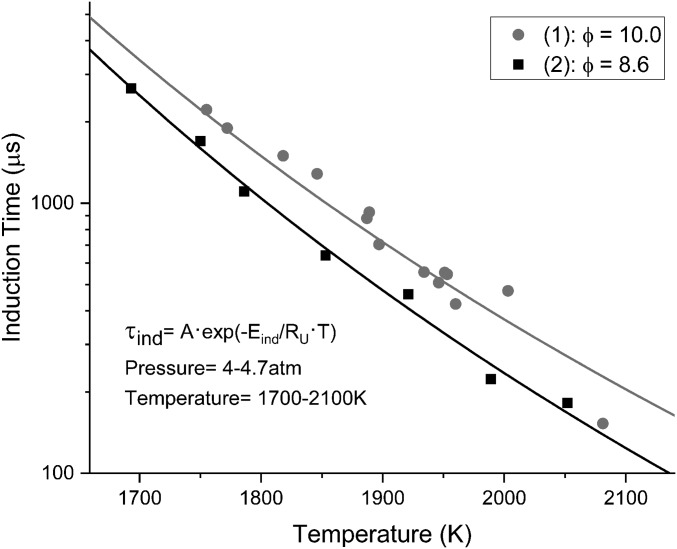
Induction times were recorded for the two ethylene mixtures in Fig. 3. Current data suggest that reducing the equivalence ratio, at constant temperature and pressures, reduces the induction time. A shorter induction time may reduce the soot production of a fuel in systems with long residence times as the soot may oxidize. The data collected were modeled using a simple exponential equation fit in the following form:
| [6] |
In Eq. 6, A is in units of microseconds, Eind is the induction time activation energy and is in units of kilojoules per mole, Ru = 8.314·10−3 kJ/mol·K, T is in kelvin, and τind is in units of microseconds.
Fig. 3.
The experimental induction times for mixtures (1) and (2) are shown. The carbon content of these mixtures is the same with the only difference being the oxygen content (equivalence ratio). The pressure ranges are within the same range (SI Appendix).
Soot formation is primarily a function of temperature as noted in Fig. 3 [the observed soot induction times for mixtures (1) and (2) are shown]. As expected, the mixture with more oxygen (ϕ = 8.6) (2) has a noticeable reduction in the induction time for soot production. For the same temperature, the mixture with excess oxygen will begin producing soot sooner. Previous research has shown this effect of oxygen concentration (16, 23, 32). This expected behavior is well known, i.e., soot is produced in regions with higher equivalence ratios in real combustors, such as droplets of fuel in a diesel engine (29). Table 2 has the calculated parameters for Eq. 5. Current data suggest that, as the equivalence ratio decreases, the induction time activation energy decreases, thus enabling the onset of soot formation earlier within the combustion process. These equations can be used for validation and mechanism development for the SYE output. The induction time alone does not draw a complete picture of all of the sooting tendencies of a fuel, and SYE time histories must also be investigated as well.
Table 2.
Induction time parameters in Eq. 6 for mixtures (1) and (2)
| ϕ | A, μs | Eind, kJ/mol | R2 |
| 10 | 1.35·10−3 | −208.3 | 0.98 |
| 8.6 | 4.23·10−4 | −220.4 | 0.99 |
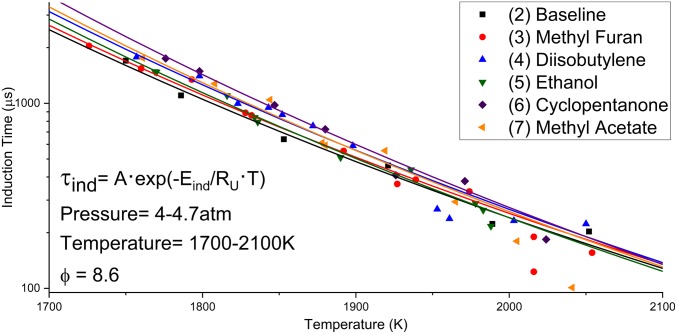
The induction times for mixtures (2) to (6) can be found in Fig. 4. In each mixture, as the temperature increased, the induction time decreased following a logarithmic trend. For each biofuel shown in the figure, below 2,000 K, soot production began later compared to mixture (2). However, for the investigated mixtures, there are crossover points in τind at around 2,000 K for ethanol mixture (5). Later in this section (see Fig. 7), this will be more apparent. By understanding these induction times, combustors can be designed with low residence times to inhibit soot induction during this elementary stage.
Fig. 4.
The soot induction times for the baseline and the five biofuel mixtures [(2) to (7)] experiments. These mixtures were taken with the same pressure range, equivalence ratio, and carbon content.
Fig. 7.
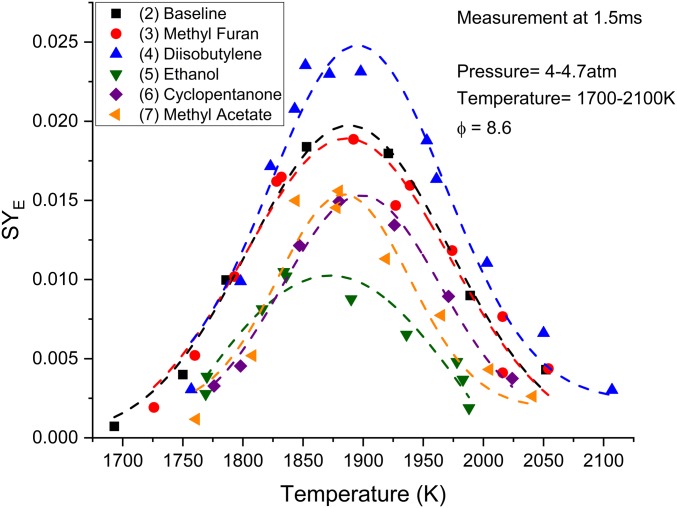
Soot yield taken at 1,500 μs of test time for mixtures (2) to (7). The peak of soot production under these conditions for each fuel is ∼1,875 K. Uncertainty in SYE is 10% for experiments and is 50% for model predictions. We recommend viewing the colored version of this figure. A line fit for each dataset was used to guide the reader and is only for illustration.
Through the fitting of values for Eq. 6, parameters for the soot induction times were identified and are presented within Table 3. As seen in the table, the magnitude of Eind for each tested biofuel mixture is greater than baseline. It may be inferred that at the same temperature for a given biofuel at the same carbon content and equivalence ratio, these biofuels have some level of soot suppression due to higher activation energy. These equations can be used to accurately model the induction time predictions from kinetic mechanisms. From observations of the activation energies of these fuels, when designing an engine which uses one of these constituents, Eind can be used to indicate a maximum combustion duration limit to inhibit soot formation.
Table 3.
The induction time parameters for Eq. 6 for the five biofuel candidates
| Fuel | A, μs | Eind, kJ/mol | R2, a.u. |
| Baseline | 4.23·10−4 | 220.4 | 0.99 |
| Methylfuran | 4.44·10−4 | 220.5 | 0.99 |
| α-Diiosobutylene | 2.36·10−4 | 231.8 | 0.98 |
| Ethanol | 1.99·10−4 | 232.9 | 0.99 |
| Cyclopentanone | 9.40·10−5 | 247.5 | 0.99 |
| Methyl acetate | 1.40·10−4 | 240.0 | 0.96 |
Soot Yield.
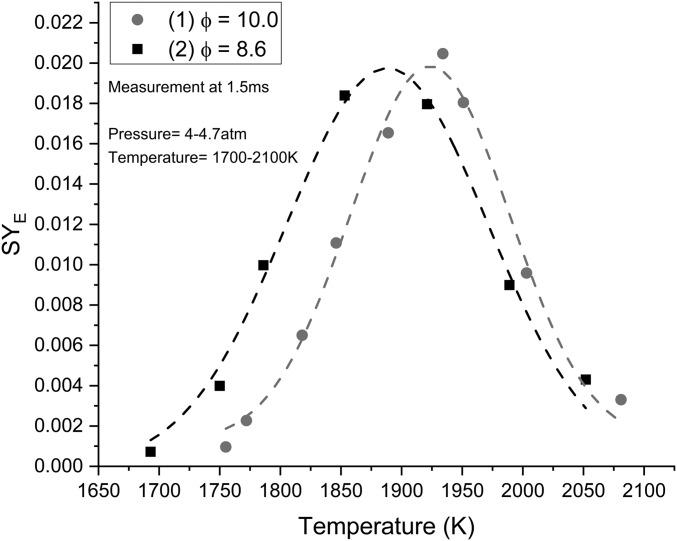
Within Fig. 5, SYE for mixtures (1) and (2) are presented. With an increase in fuel concentration [mixture (1)], there is a translation of soot formation to higher temperatures, where the peak SYE of mixture (1) was located at ∼1,925 K while SYE for (2) was located at 1,875 K. This shift of the peak for mixture (2) is due to the increased oxygen available for oxidation and is prevalent in other studies (16, 32, 38). There is a slight reduction in the overall soot production at the peak temperatures of each mixture. These results are comparable to other studies with similar mixtures and test conditions (16) and validate our experimental setup and analytical methods.
Fig. 5.
SYE for mixtures (1) and (2). A shift of 50 K in the peak is realized between these two mixtures under similar conditions. A slight reduction in SYE at the peak is also observed. Uncertainty in SYE measurements is 10%. Lines are drawn for illustration.
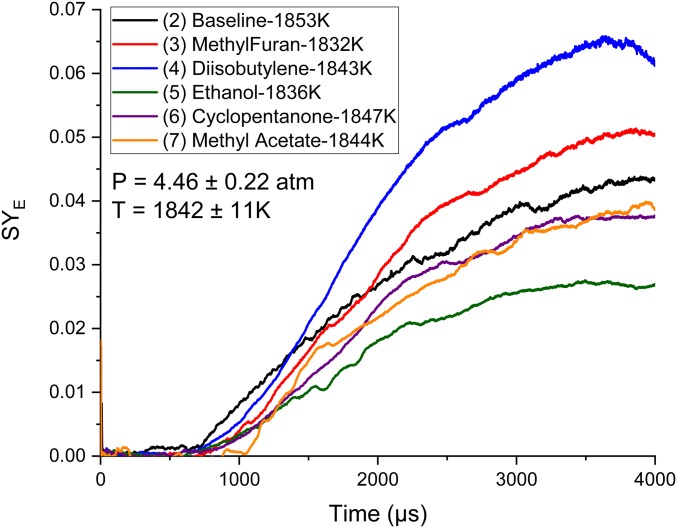
Fig. 6 is a comparison of the time histories of SYE profiles of each biofuel tested. The temperature of each experiment is within 0.5%, while the pressures are within 4.9%. As soot production was shown in Table 3 to be predominantly a function of temperature in this pressure range, these experiments offer insight into a direct comparison of the sooting tendencies of these fuels. It can be seen that methylfuran forms soot prior to 1,000 μs near the mean of the tested fuel mixtures, although slightly above that of ethanol, and has a relatively smooth rate of production until its observed maxima near 3,800 μs. Diisobutylene starts to form soot shortly after ethylene; however, mixture (4) has an accelerating soot production rate from its onset to the 1,300-μs mark at which point it maintains a constant soot formation rate of increase. The time history shows diisobutylene overtaking the baseline in soot production at ∼1,400 μs. Further investigation into its reaction pathways in a later section will explain why this behavior is occurring. Ethanol forms the least amount of soot at the end of the time history of all mixtures and, additionally, does not form soot in appreciable quantities prior to the 800-μs mark. Between 800 and 1,100 μs, the rate of soot production moderately increases until 1,100 μs, at which time the rate of soot production becomes constant until 2,200 μs before a reduction in the rate of production. Methyl acetate has the longest delay in soot production of the tested biofuels, with recognizable concentrations of soot starting slightly after 1 ms. Interestingly, cyclopentanone produces a surprisingly low amount of soot given its ring structure. Pathway analysis in a later section will investigate this. Last, methyl acetate initially suppresses soot formation compared to mixture (2) and also compared to all other tested fuels; however, at ∼1,000 μs, there is a rapid onset of soot formation, enabling the formation of more soot than the ethanol mixture (5), and at the end of the test time more than cyclopentanone. Of these test cases, mixtures (2) and (6) offer the most strikingly different test cases in regard to soot production, while mixtures (3) to (5) and (7) follow a similar shape of time profile with different scaling parameters. To fully understand the reasons behind these trends, modeling these using a chemical kinetic model is necessary.
Fig. 6.
The soot yield of the five fuels were compared to the baseline mixture under similar temperatures and pressures. The authors chose these experiments because the conditions were very similar. Uncertainty in SYE measurements is estimated to be 10%. (Please refer to the color version of this chart.)
Fig. 7 is an assessment of SYE of as a function of temperature for mixtures (2) to (7) at 1,500 μs with pressures within the range of 4 to 4.7 atm. This comparison exemplifies the kinetics for each fuel without the potential of interference from PAHs or rising uncertainties in the shock tube (39). The baseline, shown in black, produces soot from 1,700 to 2,050 K with a peak at about 1,875 K. The five biofuel cases appear to also have a peak SYE between 1,875 and 1,900 K. Methyl furan has a similar SYE compared to the baseline throughout the entire temperature range. Similarities between mixtures (2) and (6) at 1,500 μs indicate that hydrogen abstraction occurs in a consistent manner between the two; however, beyond this time period, it may be assumed that there are subtle differences between steps in the reaction pathways of these fuels. Investigating the time history of methyl furan is therefore important. α-Diisobutylene appears to have similar soot production in the colder region from 1,750 to 1,825 K when measured at 1,500 μs. At temperatures above 1,825 K, mixture (4) produces more soot over mixture (2). Diisobutylene continues producing soot throughout a larger temperature range until 2,100 K. Ethanol has a very noticeable reduction in SYE throughout the entire temperature range. Soot production is measurable in the temperature range of 1,750 to 2,000 K, a 50 K reduction in range in both the colder and hotter regions, with a peak at 1,875 K. Additionally, the SYE is markedly reduced as seen in the time history plot in Fig. 6 throughout the entire test time. Cyclopentanone appears to have a reduced SYE compared with baseline. The SYE is measurable from 1,750 to 2,025 K with a peak at 1,900 K. There is a significant reduction in the SYE at lower temperatures, but only a slightly lower SYE in the hotter region. Methyl acetate has very similar SYE to cyclopentanone. The SYE at colder temperatures are almost the same, but with a peak shifted to 1,875 K. At hotter temperatures, methyl acetate soot production reduces much sooner as temperature increases. Both cyclopentanone and methyl acetate reaction pathways will be investigated.
Comparisons with Simulations.
Modeling of the gas phase reactions was done through implementing the Co-Optima (LLNL) mechanism. The model assumptions are a closed homogenous batch reactor with constant pressure and internal energy (U, P). These assumptions hold well since there is no pressure rise from combustion and driver inserts maintained a constant pressure until the end of the test time. Soot and PAH modeling was done by superimposing the KM2 mechanism (40). This mechanism utilized the Co-Optima mechanism for molecules up to naphthalene (double cyclic ring C10H8), while the KM2 mechanism enabled gas phase reactions until coronene (C24H12). Soot is considered as a solid phase and utilizes reactions from the KM2 surface mechanism, omitting structures larger than pyrene (C16H10) within the solid phase. The model was implemented based on method of moments for soot particle dynamics using the surface kinetics subroutine of the Ansys Chemkin Pro software (41). Soot was considered to be composed of spherical particles and particle aggregations; breakage/fragmentation and radiation effects are not included and must be examined in further studies. Dimerization of pyrene was considered as the “soot” inception as is the practice in other published works (42, 43). Soot growth occurs through an HACA mechanism, and soot oxidation occurs through subsequent reactions with O2 and OH (44). Here, coagulation collision efficiency was set to 1 as in Kholghy et al. (45). SYE within the model was then calculated utilizing methods previously mentioned in this work: E(m) = 0.228 was multiplied by the model SY prediction. This method will result in an estimated uncertainty of 50%. Thermodynamic properties that complement the reaction rates were taken from their respective models, while nomenclature was modified accordingly to ensure continuity of the mechanism. SI Appendix, Figs. S1–S7 provide details of the simulated gas phase reaction pathways to soot from all fuels.
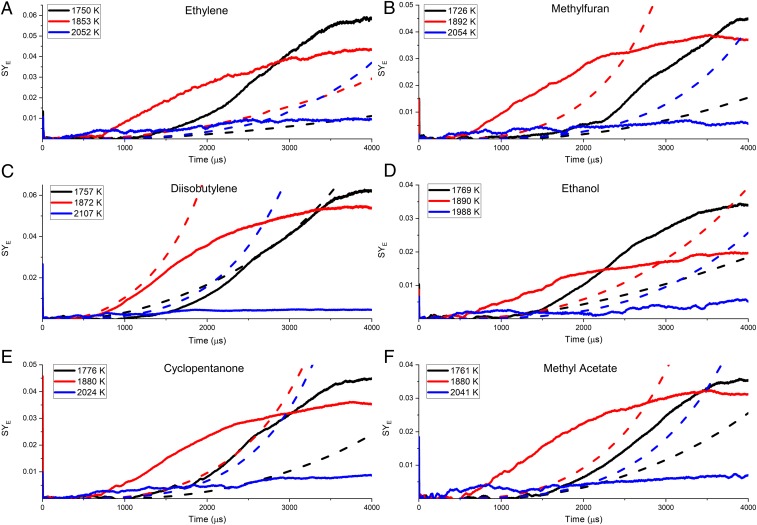
In Fig. 8A, three experimentally obtained profiles of ethylene are compared with the mechanism. At 1,750 K, soot does not begin forming until about 1,250 μs but exhibits an exponential rise in SYE as time increases. At 1,853 K, soot begins to form at ∼750 μs and rises linearly throughout the test time. At 2,052 K, soot formation becomes apparent at 250 μs and has a linear rise, but produces minimal soot through the test time. These three temperatures detail different kinetic behaviors seen throughout current experiments over the explored temperature range; simulated SYE are obtained via matched parameters with experiments. However, when examining the ethylene behaviors of the model, some striking differences exist. As the dissimilarity in the induction time between the model and experiment is pronounced, it can be concluded that the models fail. Additionally, the models predict an exponential rise in soot for the hotter experiments and a linear rise for the colder experiment.
Fig. 8.
Time histories of the five biofuels SYE explored. (A) Baseline; (B) methylfuran; (C) diisobutylene; (D) ethanol; (E) cyclopentanone; and (F) methyl acetate. The solid lines are experimental results, and the dashed lines are simulation results. Pressure range is 4 to 4.7 atm for each mixture, and the equivalence ratio is the same for each, 8.6. Uncertainties are 10% for experiments and 50% for models.
In Fig. 8B, the methylfuran model predictions are compared to experiments. At 1,726 K, the exponential rise in SYE is not captured well by the model. Also, at 1,892 K, experiments show soot formation well before the simulated trace. Additionally, there is a linear rise in the SYE at this temperature, but the model is predicting an exponential rise. At this temperature, soot production appears to maximize shortly before the end of the test time. At the hottest temperature, 2,054 K, soot begins to form very quickly and has a linear rise. The model overpredicts the induction time and predicts an exponential rise.
In Fig. 8C, the α-diisobutylene experiments show a divergence from the models. In the coldest experiment, at 1,757 K, the model overpredicts the induction time; however, there is some agreement with the model at ∼2.5 to 3.5 ms. The middle temperature of 1,872 K seems somewhat in agreement for the induction time and the SYE during the first 1.25 ms; however, the model continues to predict an exponential increase in the SYE and begins to deviate substantially at 1.25 ms. At 2,107 K, the experiment shows a quick induction time and a small linear rise; however, the model predicts an exponential rise in the SYE. This suggests the model is not capturing some high-temperature oxidation that is occurring, which may alter the SYE predictions.
In Fig. 8D, ethanol experimental behavior was distinctive compared to other fuels. The coldest experiment, 1,769 K, was captured well by the mechanism for the induction time. Both experimental data and predictions showed an exponential trend; however, the two deviated at ∼1.5 ms. The experimental data has a larger exponential rise compared to the model at this point. The maximum SYE is approximately captured within the test time. At the middle temperature, 1,890 K, the model predicted a much longer induction time as well as an exponential rise. The experimental data showed an induction time near 0.5 ms and a linear rise with a maximum being reached within the test time. The hottest experiment, 1,988 K, produced very little soot relative to the other temperatures. Above this temperature, negligible soot formed as the fuel oxidized rapidly. The induction time was ∼0.1 ms with a linear rise in the soot production and approximately reaching a maximum. Experiments above this temperature did not yield significant soot and directly oxidizes.
In Fig. 8E, cyclopentanone experimental results disagreed with models. At the coldest temperature of 1,776 K, the model overpredicts the induction time. Both the model and the data suggest an exponential rise in the SYE, suggesting favorable kinetics at this temperature. The SYE approaches an approximate maximum within the test time. At 1,880 K, the induction time is reduced compared with the colder experiment. The experimental SYE has a large linearly increasing profile, whereas the model predicts a significant exponential profile at a later induction time. An approximate maximum in soot production is reached before the end of the test time. At the hottest experiment shown, 2,024 K, the induction time is very small with a small linear rise. This suggests that high-temperature oxidation is occurring, which is limiting soot production significantly but continues to grow throughout the test time. The model predicts a similar profile to the 1,880 K experiment with a reduced induction time. Analysis of the reaction pathway may provide an explanation of what kinetic processes are causing this deviation.
In Fig. 8F, methyl acetate SYE at three temperatures are compared with the mechanism. At 1,761 K has the longest induction time with model agreement until about 1500 μs. After this time, the experimental data produced more soot compared to the model. The data reach an approximate maximum within the test time. At 1,880 K, the induction time is reduced compared with the colder experiment. Soot production grows linearly and reaches a maximum at ∼3,500 μs. The model suggests an exponential soot production with a longer induction time. At 2,041 K, soot production begins almost immediately with a small linear rise throughout the test time without reaching a maximum. The induction time predicted by the model was longer than the colder experiment of 1,880 K. Additionally, the model predicted an exponential rise in soot production. Investigation of the reaction pathways will improve understanding of what is occurring experimentally.
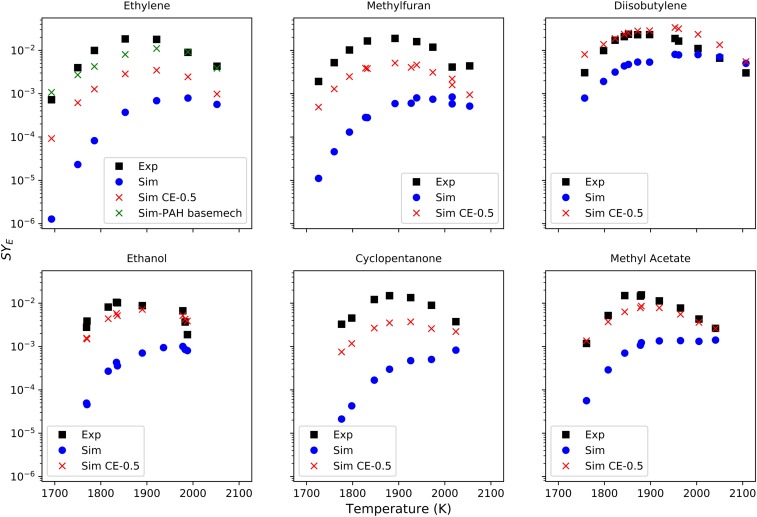
Fig. 9 displays a comparison between SYE at the measurement time of 1,500 μs from both the experiments and models. As evident, the simulation underpredicts SYE considerably, and there is significant need to induce better agreement between the model and simulation. The initial increase in SYE with temperature is captured very well by the model; however, there are also disagreements in the quantity. Once the peak temperature is reached, the model does not capture the reduction in SYE with further temperature increase except for ethylene.
Fig. 9.
SYE at 1,500 μs compared with several models using the combined Co-Optima and modified KM2 surface mechanisms. “Exp” is experimental results, and “Sim” is simulation results. Sim collision efficiency (CE)-0.5 is a modified version of the surface mechanism with pyrene as the largest PAH and collision efficiency of 0.5. The basemech found in the ethylene figure are the original KM2 mechanisms (gas and surface mechanisms). SYE measurement and model uncertainties are 10% and 50%, respectively.
The KM2 soot surface mechanism consists of soot nucleation and condensation reactions from pyrene (A4) until coronene (A7). It includes the soot nucleation from interactions of pyrene with another pyrene and with larger PAHs like benzo(a)pyrene, benzo(ghi)perylene, coronene, etc. Since KM2 mechanism is not validated for species larger than pyrene, using species larger than pyrene could lead to erroneous results. The reason for increase in soot volume fraction after the peak temperature could be attributed to this. Therefore, we modified KM2 soot surface mechanism to include only pyrene, as pyrene is the largest PAH validated using the KM2 mech. A similar approach for soot nucleation and condensation by using pyrene as the largest species was used in He et al. (46) and Peña et al. (44). The collision factor was modified to 0.5 for pyrene–pyrene interaction and led to better agreement. Fig. 9 shows the simulation results using modified KM2 mechanism with CE = 0.5. As observed, it more accurately captures the experimental data and the decrease in SYE beyond peak temperature.
Conclusions
In this study, the sooting tendencies of five high-performance Co-Optima biofuels inside a shock tube were investigated by testing with over 75 experiments in among seven fuel–oxygen mixtures. Experiments were performed in a temperature range of 1,700 to 2,200 K and a pressure range of 4 to 4.5 atm. Using an ethylene oxygen mixture at an equivalence ratio of 8.6, substantial soot reduction was realized with ethanol. Cyclopentanone and methyl acetate had noticeable reductions in the soot yield throughout the temperature range. Methyl acetate at shorter test time had a reduced the soot yield, but over a longer test time typically produced more soot that the baseline. α-Diisobutylene produced a substantially larger amount of soot over the baseline through a wider temperature range.
Experimental data were compared with a combination of the Co-Optima mechanism and the KM2 soot surface mechanism. Reactions up to pyrene were added to the Co-Optima mechanism from the KM2 mechanism, with additional changes to setting the collision factor for pyrene–pyrene interaction to 0.5. The mechanism typically underpredicted the soot yield at the measurement time, but with some minor adjustments obtained fair agreement with α-diisobutylene, ethanol, and methyl acetate. The mechanisms overpredicted the induction times for most fuels. Reaction pathway analysis was performed on the baseline as well as the five candidate biofuels. Reaction pathways that led to a known soot-producing species, such as C2H2, were identified. These pathways should be better understood with continued research to determine methods for reduction. Current experiments and comparisons with the mechanism are necessary to accurately model these biofuels. The sooting tendencies of these fuels are valuable knowledge for the future of biofuel development and chemical kinetic model improvements. Our procedure for comparing the biofuels to a known baseline provides an excellent structure for future work on similar fuels.
Supporting Information
The induction times and soot yield data collected in this study can be found in SI Appendix. To understand the formation of soot from the different biofuels, the gas phase reaction pathways for each was investigated using the Co-Optima mechanism and presented in this section. This study will also give insights into additional pathways to be considered in future efforts.
Methods
Shock Tube Facility and Procedure.
Experiments were performed in the heated high-purity chemical kinetics shock tube at the University of Central Florida (47–49). The shock tube has an internal diameter of 14.2 cm and can be heated to 493 K. A Lexan diaphragm is used to separate the driven and driver sides. Preceding each experiment, the shock tube was vacuumed by rotary vane pumps (Agilent DS102), and the driven side was subsequently vacuumed with a turbomolecular pump (Agilent V301) to maximum pressure of 5 × 10⁻⁵ torr before each experiment. Vacuum pressures were measured by a convection gauge (Lesker kJL275804LL) and an ionization gauge (Lesker kJLC354401YF) operating between 1,000 and 1 × 10⁻⁴ torr and between 5 × 10⁻² and 1 × 10⁻⁹ torr, respectively. Test gas was introduced into the driven side to a desired pressure from a manifold. Helium was then introduced into the driver side until rupture of the diaphragm.
Test mixtures for the experiments were prepared in a 33-L heated Teflon-coated stainless-steel mixing tank. Mixture preparation was initiated through evacuation of the tank to 5 × 10⁻⁵ torr or lower using the turbomolecular pump and verified with the ionization gauge. Following vacuuming, tank content pressure was measured using a 100-torr (MKS Instruments Baratron E27D) and a 10,000-torr (MKS Instruments/Baratron 628D) full-scale range capacitance-type manometers. Subsequently, liquid or gaseous fuel, for their respective mixtures, would be injected and ideal gas behaviors were assumed for the fuel. When liquid biofuels mixtures were prepared, the liquid injection was the first step, followed by ethylene and subsequent gases. Dalton’s law was utilized when making the mixture to determine the mole fraction of each constituent. Argon, oxygen, and ethylene gases were purchased from NexAir with purities of 99.999% or higher. Research-grade liquid fuels were purchased from the following vendors: methyl furan (99%; Acros Organics), methyl acetate (99%; Alpha Aesar), cyclopentanone (99%; Alpha Aesar), 2,4,4-trimethyl-1-pentene (diisobutylene alpha isomer; 99%; Acros Organics), and ethanol (99.5%; Acros Organics). The mixtures were left to mix for at least 3 h before experiments using a magnetically driven stirrer to ensure homogeneity of each mixture.
Temperature (T5) and pressure (P5) behind the reflected shock wave were calculated based on the measured velocity, P1, T1, and one-dimensional normal shock equations. The shock tube configuration and use of driver inserts allowed a constant P5 behind the reflected shock region for test times of ∼4 ms. The calculated uncertainty in P5 and T5 were 1.8% and 2%, respectively.
After every experiment, the shock tube walls near the test section were coated in soot. The end-wall, test section, and ∼1.5 m of the driven section were cleaned after every experiment with acetone. Beyond the 1.5 m, negligible amounts of soot were found inside the shock tube after each experiment. Following the experiments using a mixture, the entire shock tube was cleaned with acetone.
Data Availability.
All data from this study are provided in SI Appendix and this manuscript.
Supplementary Material
Acknowledgments
This material is based upon work supported by the US Department of Energy’s Office of Energy Efficiency and Renewable Energy under Awards DE-EE0007984 and DE-EE0007982 (Co-Optima). We thank Drs. Bill Pitz (LLNL) and Robert McCormick (National Renewable Energy Lab) for valuable feedback and insights. This report was prepared as an account of work sponsored by an agency of the US Government. Neither the US Government nor any agency thereof, nor any of their employees, makes any warranty, express or implied, or assumes any legal liability or responsibility for the accuracy, completeness, or usefulness of any information, apparatus, product, or process disclosed, or represents that its use would not infringe privately owned rights. Reference herein to any specific commercial product, process, or service by trade name, trademark, manufacturer, or otherwise does not necessarily constitute or imply its endorsement, recommendation, or favoring by the US Government or any agency thereof. The views and opinions of authors expressed herein do not necessarily state or reflect those of the US Government or any agency thereof.
Footnotes
The authors declare no competing interest.
This article is a PNAS Direct Submission.
This article contains supporting information online at https://www.pnas.org/lookup/suppl/doi:10.1073/pnas.1920223117/-/DCSupplemental.
References
- 1.Kumfer B., Kennedy I., “The role of soot in the health effects of inhaled airborne particles” in Combustion Generated Fine Carbonaceous Particles (Proceedings of an International Workshop Held in Villa Orlandi, Anacapri, May 13–16, 2007) (KIT Scientific Publishing, 2009), pp. 1–15. [Google Scholar]
- 2.Kim K.-H., Kabir E., Kabir S., A review on the human health impact of airborne particulate matter. Environ. Int. 74, 136–143 (2015). [DOI] [PubMed] [Google Scholar]
- 3.US Environmental Protection Agency, The Benefits and Costs of the Clean Air Act, 1970 to 1990 (Office of Air and Radiation/Office of Policy, US Environmental Protection Agency, 1997). https://www.epa.gov/sites/production/files/2015-06/documents/contsetc.pdf. Accessed 15 October 2019.
- 4.Jacobson M. Z., Control of fossil‐fuel particulate black carbon and organic matter, possibly the most effective method of slowing global warming. J. Geophys. Res. 107, 4410 (2002). [Google Scholar]
- 5.Ramanathan V., Carmichael G., Global and regional climate changes due to black carbon. Nat. Geosci. 1, 221–227 (2008). [Google Scholar]
- 6.Wang H., Formation of nascent soot and other condensed-phase materials in flames. Proc. Combust. Inst. 33, 41–67 (2011). [Google Scholar]
- 7.Kim K.-H., Jahan S. A., Kabir E., Brown R. J., A review of airborne polycyclic aromatic hydrocarbons (PAHs) and their human health effects. Environ. Int. 60, 71–80 (2013). [DOI] [PubMed] [Google Scholar]
- 8.Farrell J., “Co-Optimization of Fuels and Engines” in Presented at the SAE 2016 High Efficiency Internal Combustion Engine Symposium, 10–11 April 2016, Detroit, Michigan (National Renewable Energy Laboratory, Golden, CO, 2016), pp. 1–47. [Google Scholar]
- 9.Bhosale M. V. K., Kulkarni S. G., Kulkarni P. S., Ionic liquid and biofuel blend: A low-cost and high-performance hypergolic fuel for propulsion application. ChemistrySelect 1, 1921–1925 (2016). [Google Scholar]
- 10.Terracciano A. C., Vasu S. S., Orlovskaya N., Design and development of a porous heterogeneous combustor for efficient heat production by combustion of liquid and gaseous fuels. Appl. Energy 179, 228–236 (2016). [Google Scholar]
- 11.Somers K. P., et al. , A high temperature and atmospheric pressure experimental and detailed chemical kinetic modelling study of 2-methyl furan oxidation. Proc. Combust. Inst. 34, 225–232 (2013). [DOI] [PMC free article] [PubMed] [Google Scholar]
- 12.Metcalfe W. K., Pitz W. J., Curran H. J., Simmie J. M., Westbrook C. K., The development of a detailed chemical kinetic mechanism for diisobutylene and comparison to shock tube ignition times. Proc. Combust. Inst. 31, 377–384 (2007). [Google Scholar]
- 13.Zhang K., et al. , An experimental, theoretical, and modeling study of the ignition behavior of cyclopentanone. Proc. Combust. Inst. 37, 657–665 (2019). [Google Scholar]
- 14.Curran H. J., Dunphy M. P., Simmie J. M., Westbrook C. K., Pitz W. J., “Shock tube ignition of ethanol, isobutene and MTBE: Experiments and modeling” in Symposium (International) on Combustion (Elsevier, 1992), pp. 769–776. [Google Scholar]
- 15.Herbinet O., Pitz W. J., Westbrook C. K., Detailed chemical kinetic mechanism for the oxidation of biodiesel fuels blend surrogate. Combust. Flame 157, 893–908 (2010). [Google Scholar]
- 16.Agafonov G. L., et al. , Soot formation during the pyrolysis and oxidation of acetylene and ethylene in shock waves. Kinet. Catal. 56, 12–30 (2015). [Google Scholar]
- 17.Simonsson J., Olofsson N.-E., Török S., Bengtsson P.-E., Bladh H., Wavelength dependence of extinction in sooting flat premixed flames in the visible and near-infrared regimes. Appl. Phys. B 119, 657–667 (2015). [Google Scholar]
- 18.Ren W., Davidson D. F., Hanson R. K., IR laser absorption diagnostic for C2H4 in shock tube kinetics studies. Int. J. Chem. Kinet. 44, 423–432 (2012). [Google Scholar]
- 19.Harris S. J., Weiner A. M., Surface growth of soot particles in premixed ethylene/air flames. Combust. Sci. Technol. 31, 155–167 (1983). [Google Scholar]
- 20.De Iuliis S., Maffi S., Migliorini F., Cignoli F., Zizak G., Effect of hydrogen addition on soot formation in an ethylene/air premixed flame. Appl. Phys. B 106, 707–715 (2012). [Google Scholar]
- 21.Glassman I., “Soot formation in combustion processes” in Symposium (International) on Combustion (Elsevier, 1989), pp. 295–311. [Google Scholar]
- 22.Zhou C.-W., et al. , An experimental and chemical kinetic modeling study of 1,3-butadiene combustion: Ignition delay time and laminar flame speed measurements. Combust. Flame 197, 423–438 (2018). [Google Scholar]
- 23.Kc U., Beshir M., Farooq A., Simultaneous measurements of acetylene and soot during the pyrolysis of ethylene and benzene in a shock tube. Proc. Combust. Inst. 36, 833–840 (2017). [Google Scholar]
- 24.He J., et al. , Experimental study of the soot formation of RP-3 behind reflected shock waves. Fuel 200, 47–53 (2017). [Google Scholar]
- 25.Agafonov G. L., et al. , Soot Formation during Pyrolysis and Oxidation of Aliphatic and Aromatic Hydrocarbons in Shock Waves: Experiments and Detailed Kinetic Modeling (Springer International Publishing, Cham, Switzerland, 2017), pp. 321–325. [Google Scholar]
- 26.Khalizov A. F., Hogan B., Qiu C., Petersen E. L., Zhang R., Characterization of soot aerosol produced from combustion of propane in a shock tube. Aerosol Sci. Technol. 46, 925–936 (2012). [Google Scholar]
- 27.Hong Z., Davidson D. F., Vasu S. S., Hanson R. K., The effect of oxygenates on soot formation in rich heptane mixtures: A shock tube study. Fuel 88, 1901–1906 (2009). [Google Scholar]
- 28.Mathieu O., Djebaïli-Chaumeix N., Paillard C.-E., Douce F., Experimental study of soot formation from a diesel fuel surrogate in a shock tube. Combust. Flame 156, 1576–1586 (2009). [Google Scholar]
- 29.Miyamoto N., Ogawa H., Nurun N. M., Obata K., Arima T., Smokeless, Low NOx, High Thermal Efficiency, and Low Noise Diesel Combustion with Oxygenated Agents as Main Fuel (SAE International, 1998). [Google Scholar]
- 30.Mehl M., et al. , “A comprehensive detailed kinetic mechanism for the simulation of transportation fuels” (Report No. LLNL-CONF-725343, Office of Scientific and Technical Information, US Department of Energy, 2017).
- 31.Wang Y., Raj A., Chung S. H., Soot modeling of counterflow diffusion flames of ethylene-based binary mixture fuels. Combust. Flame 162, 586–596 (2015). [Google Scholar]
- 32.Agafonov G. L., et al. , Soot Formation during pyrolysis of methane and rich methane/oxygen mixtures behind reflected shock waves. Combust. Sci. Technol. 180, 1876–1899 (2008). [Google Scholar]
- 33.Bauer S. H., Zhang L. M., Shock Tube Pyrolysis of Polycyclic Aromatics: Detection of Soot Precursors (Cornell University, Ithaca, NY, 1983). [Google Scholar]
- 34.Kellerer H., Müller A., Bauer H. J., Wittig S., Soot formation in a shock tube under elevated pressure conditions. Combust. Sci. Technol. 113, 67–80 (1996). [Google Scholar]
- 35.Chang H., Charalampopoulos T. T., Determination of the wavelength dependence of refractive indices of flame soot. Proc. R. Soc. Lond. A Math. Phys. Eng. Sci. 430, 577–591 (1990). [Google Scholar]
- 36.Oña-Ruales J. O., Ruiz-Morales Y., Prediction of the ultraviolet-visible absorption spectra of polycyclic aromatic hydrocarbons (dibenzo and naphtho) derivatives of fluoranthene. Appl. Spectrosc. 71, 1134–1147 (2017). [DOI] [PubMed] [Google Scholar]
- 37.Stanmore B. R., Brilhac J.-F., Gilot P., The oxidation of soot: A review of experiments, mechanisms and models. Carbon 39, 2247–2268 (2001). [Google Scholar]
- 38.Agafonov G. L., Smirnov V. N., Vlasov P. A., A shock-tube and modeling study of soot formation during pyrolysis of propane, propane/toluene and rich propane/oxygen mixtures. Combust. Sci. Technol. 182, 1645–1671 (2010). [Google Scholar]
- 39.Campbell M. F., et al. , Strategies for obtaining long constant-pressure test times in shock tubes. Shock Waves 25, 651–665 (2015). [Google Scholar]
- 40.Wang Y., Raj A., Chung S. H. J. C., A PAH growth mechanism and synergistic effect on PAH formation in counterflow diffusion flames. Combust. Flame 160, 1667–1676 (2013). [Google Scholar]
- 41.Kee R., et al. , Chemkin-Pro (Reaction Design, 2008).
- 42.Chernov V., Thomson M. J., Dworkin S. B., Slavinskaya N. A., Riedel U., Soot formation with C1 and C2 fuels using an improved chemical mechanism for PAH growth. Combust. Flame 161, 592–601 (2014). [Google Scholar]
- 43.Zhang Q., Thomson M. J., Guo H., Liu F., Smallwood G. J., A numerical study of soot aggregate formation in a laminar coflow diffusion flame. Combust. Flame 156, 697–705 (2009). [Google Scholar]
- 44.Peña G. D. J. G., et al. , Effect of fuel flow rate on the characteristics of soot generated from unsubstituted and disubstituted aromatic hydrocarbon flames: Experimental and numerical study. Combust. Flame 190, 224–239 (2018). [Google Scholar]
- 45.Kholghy M. R., Eaves N. A., Veshkini A., Thomson M. J., The role of reactive PAH dimerization in reducing soot nucleation reversibility. Proc. Combust. Inst. 37, 1003–1011 (2019). [Google Scholar]
- 46.He J., et al. , Experimental study of the soot formation of RP-3 behind reflected shock waves. 200, 47–53 (2017). [Google Scholar]
- 47.Koroglu B., Pryor O. M., Lopez J., Nash L., Vasu S. S., Shock tube ignition delay times and methane time-histories measurements during excess CO2 diluted oxy-methane combustion. Combust. Flame 164, 152–163 (2016). [Google Scholar]
- 48.Barak S., et al. , High-speed imaging and measurements of ignition delay times in oxy-syngas mixtures with high CO2 dilution in a shock tube. J. Eng. Gas Turbines Power 139, 121503 (2017). [Google Scholar]
- 49.Barak S., et al. , High-pressure oxy-syngas ignition delay times with CO2 dilution: Shock tube measurements and comparison of the performance of kinetic mechanisms. J. Eng. Gas Turbines Power 141, 021011 (2019). [Google Scholar]
Associated Data
This section collects any data citations, data availability statements, or supplementary materials included in this article.
Supplementary Materials
Data Availability Statement
All data from this study are provided in SI Appendix and this manuscript.


