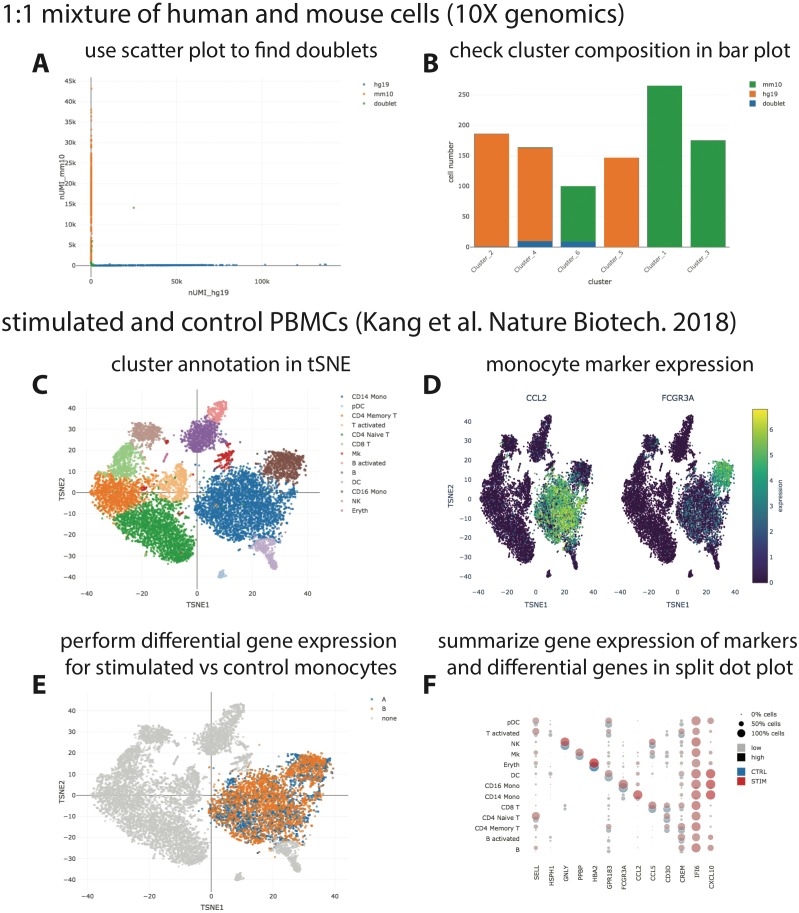
Figure 2. Visualization of publicly available scRNA-seq data.
(A + B) scRNA-seq data for a 1:1 mixture of 1k fresh frozen human (HEK293T) and mouse (NIH3T3) cells (Chromium v3 chemistry) were taken from the 10X website (CellRanger output) and visualized with SCelVis. A scatter plot shows human vs. mouse UMI counts per cell and confirms a low doublet rate (A), while a bar plot visualizes the species composition of the different clusters defined by CellRanger (B). (C–F) scRNA-seq data for stimulated vs. control PBMCs (Kang et al., 2018). The cluster annotation resulting from the Seurat sample alignment workflow (https://satijalab.org/seurat/v2.4/immune_alignment.html) can be interrogated and monocyte markers can be displayed by selecting from a table of marker genes (C + D). Stimulated or control monocytes can then be isolated using “filter cells” and defined as groups “A” or “B”, respectively, for differential expression analysis (E). Summarized gene expression can be displayed for marker genes as well as cell-type specific or globally differential genes in a split dot plot (F).

