

Candida albicans is a leading cause of systemic bloodstream infections, and synthesis of the phospholipid phosphatidylethanolamine (PE) is required for virulence. The psd1Δ/Δ psd2Δ/Δ mutant, which cannot synthesize PE by the cytidine diphosphate diacylglycerol (CDP-DAG) pathway, is avirulent in the mouse model of systemic candidiasis.
KEYWORDS: EPT1, PSD1, PSD2, hypervirulence, Candida albicans, phosphatidylethanolamine, CDP-DAG pathway, Kennedy pathway
ABSTRACT
Candida albicans is a leading cause of systemic bloodstream infections, and synthesis of the phospholipid phosphatidylethanolamine (PE) is required for virulence. The psd1Δ/Δ psd2Δ/Δ mutant, which cannot synthesize PE by the cytidine diphosphate diacylglycerol (CDP-DAG) pathway, is avirulent in the mouse model of systemic candidiasis. Similarly, an ept1Δ/Δ mutant, which cannot produce PE by the Kennedy pathway, exhibits decreased kidney fungal burden in systemically infected mice. Conversely, overexpression of EPT1 results in a hypervirulent phenotype in this model. Thus, mutations that increase PE synthesis increase virulence, and mutations that decrease PE synthesis decrease virulence. However, the mechanism by which virulence is regulated by PE synthesis is only partially understood. RNA sequencing was performed on strains with deficient or excessive PE biosynthesis to elucidate the mechanism. Decreased PE synthesis from loss of EPT1 or PSD1 and PSD2 leads to downregulation of genes that impact mitochondrial function. Losses of PSD1 and PSD2, but not EPT1, cause significant increases in transcription of glycosylation genes, which may reflect the substantial cell wall defects in the psd1Δ/Δ psd2Δ/Δ mutant. These accumulated defects could contribute to the decreased virulence observed for mutants with deficient PE synthesis. In contrast to mutants with decreased PE synthesis, there were no transcriptional differences between the EPT1 overexpression strain and the wild type, indicating that the hypervirulent phenotype is a consequence of posttranscriptional changes. It was found that overexpression of EPT1 causes increased chitin content and increased hyphal length. These phenotypes may help to explain the previously observed hypervirulence in the EPT1 overexpressor.
INTRODUCTION
The opportunistic human fungal pathogen Candida albicans causes oral and vaginal mucosal infections as well as dangerous systemic infections (1, 2). Both mucosal and systemic candidiasis are common in immunocompromised individuals, and it remains problematic that there are only three major classes of drugs that can be used to treat systemic infections (3). Drugs within these classes target some component of the cell membrane or cell wall (3). However, there are currently no antifungal drugs for the treatment of systemic candidiasis that target phospholipid biosynthetic pathways. These pathways are not entirely conserved between mammals and fungi, and they are required for growth and pathogenesis of C. albicans (4, 5). Therefore, these are good areas in which to identify novel drug targets. Since many phospholipid biosynthetic processes in C. albicans have been inferred from the model yeast Saccharomyces cerevisiae, it is imperative to gain a better understanding of phospholipid biosynthetic processes in C. albicans and to evaluate their impact on virulence.
The major phospholipids of C. albicans are phosphatidylglycerol (PG), cardiolipin (CL), phosphatidylinositol (PI), phosphatidylethanolamine (PE), phosphatidylserine (PS), and phosphatidylcholine (PC) (6, 7). The de novo route for the synthesis of PS, PE, and PC is the cytidine diphosphate diacylglycerol (CDP-DAG) pathway (8). In this pathway, PS is synthesized by the Cho1 enzyme from serine and CDP-DAG (9, 10). PS is then decarboxylated by Psd1 or Psd2 to form PE, which can then be methylated by Pem1 and Pem2 to form PC (11–13). We have previously reported that PE synthesis by the CDP-DAG pathway is a requirement for virulence in the mouse systemic model of infection, as a psd1Δ/Δ psd2Δ/Δ mutant has a heavy attenuation of virulence and the cho1Δ/Δ mutant is completely avirulent (4).
In addition to the CDP-DAG pathway, C. albicans can synthesize PE and PC by an alternative route known as the Kennedy pathway (reviewed in reference 14). We have recently reported that the ethanolamine/choline phosphotransferase gene EPT1 is required for the synthesis of both PE and PC by the Kennedy pathway, which is different from the model organism S. cerevisiae, in which there are two phosphotransferase enzymes (14, 15). Furthermore, a modest decrease in fungal burden is observed in the kidneys of mice infected with the ept1Δ/Δ mutant, and this mutant also exhibits decreased cytotoxicity against oral epithelial cells in vitro compared to wild-type (WT) cells (15). Interestingly, we found that when synthesis of PE is increased by overexpressing the EPT1 gene, the fungus becomes hypervirulent in the mouse systemic model of infection and has increased cytotoxicity against oral epithelial cells (15). Another mutant which cannot methylate PE to PC, the pem1Δ/Δ pem2Δ/Δ mutant, has increased PE, and this strain is also hypervirulent in the mouse systemic infection model (15). Thus, the synthesis level of PE in the cell correlates with virulence and may act as a rheostat for virulence. However, the mechanism by which the level of Ept1/PE regulates virulence remains unknown.
To elucidate this mechanism, a transcriptomic analysis of the wild-type, psd1Δ/Δ psd2Δ/Δ, ept1Δ/Δ, and EPT1 overexpression strains was performed. Since we have previously determined that these strains have a gradient of cytotoxicity against epithelial cells and that increased damage correlated to increased PE, we hypothesized that there would be a gradient of gene expression for impacted genes (15). Therefore, strains were cultured under similar conditions in which cytotoxicity defects were observed (i.e., hyphal growth in tissue culture), and transcriptional profiling was used to elucidate how PE levels affect genes that might impact virulence.
In addition to this approach, and because it has been demonstrated that changes in phospholipid biosynthesis can impact cell wall structure (16), our alternative hypothesis was that there were changes in cell wall structure that could regulate virulence. Therefore, we examined two components of the cell wall that have been shown to have immunomodulatory functions. β(1,3)-Glucan is an extensively studied cell wall carbohydrate polymer that affects immune recognition in the host. C. albicans strains with significant exposure or “unmasking” of β(1,3)-glucan are less virulent than those that mask these residues, and mice deficient in the dectin-1 receptor, which is a C-type signaling lectin involved in recognition of β(1,3)-glucan, are more susceptible to some C. albicans infections (4, 16–18). A loss of phosphatidylserine biosynthesis increases exposure of β(1,3)-glucan, and thus it is possible that overexpression of phospholipid biosynthesis may also impact exposure of β(1,3)-glucan (16).
Another cell wall component that can modulate host-pathogen interactions is chitin, which is a β(1,4)-linked N-acetylglucosamine polymer common in fungal cell walls and numerous invertebrate organisms (19). Purified fungal chitin induces a tumor necrosis factor alpha (TNF-α)-mediated response that can modulate the immune system (20). Alternatively, a mixed response of both TNF-α and the anti-inflammatory cytokine interleukin 10 (IL-10) occurs when smaller purified chitin particles are used to elicit an immune response (20). Furthermore, fungal chitin can drive decreased production of reactive nitrogen species in macrophages (21). Since β(1,3)-glucan masking is important for immune evasion and because chitin can modulate the host immune response, the second goal of this study is to identify differences in these components between the wild type and hypervirulent EPT1 overexpressor strain.
RESULTS
Loss of PE synthesis causes changes to energy metabolism and cell wall genes in the C. albicans transcriptome.
The EPT1 overexpression strain has increased cytotoxicity against oral epithelial cells that correlates with increased PE synthesis by the Kennedy pathway (15). Conversely, loss of PE synthesis by either the CDP-DAG pathway or the Kennedy pathway results in decreased cytotoxicity (15, 22). To determine the mechanism by which PE levels impact virulence, a transcriptional profile of these strains was obtained after growth under the same conditions in which differences in cytotoxicity were previously observed. Each strain was cultured in duplicate in tissue culture flasks (37°C, 5% CO2, Earl’s balanced salt solution [EBSS] + 2% human serum, 1% penicillin-streptomycin) for 4 h, and RNA was extracted and sequenced with an Illumina MiSeq. RNA integrity number (RIN) values ranged from 8.6 to 9.8, and nearly 38.5 million 150-bp paired-end reads were obtained for the sample set after sequencing. FastQC was used to remove index or adapter contamination from reads and to remove leading and trailing reads with Phred scores of <30. Sequence quality was determined both before and after trimming. The diploid reference genome and annotations (version A22-s07-m01-r71) were obtained from the Candida Genome Database (CGD) (23) and were converted to haploid versions using in-house scripts that removed the B chromosomes and corresponding annotations. This was performed to circumvent issues with proper mapping, as most reads were thrown out or assigned poor mapping quality scores when a diploid reference was used. STAR was used to map reads, and approximately 90% of reads mapped uniquely to the genome for all samples (24). Mapped reads were counted using HTSeq, and differential expression analysis was performed using DESeq2. To ensure that there was no bias caused by removal of the B alleles, this analysis was also performed by mapping to reference genomes in which the A alleles had been removed, and it was found that the difference between the two mapping scenarios was negligible. Transcripts per kilobase million (TPM) was obtained using CLC genomics workbench.
A principal component plot (PCA) was created using RStudio to determine similarity of samples and replicates (Fig. 1A). Between all replicates, there was tight clustering, indicating little technical and biological variability. The wild-type and EPT1 overexpressor strains also clustered tightly, indicating similar gene expression profiles. More significant differences were observed for the mutants deficient for PE production, with the psd1Δ/Δ psd2Δ/Δ strain displaying the greatest variance from the wild type (Fig. 1A). To verify that gene expression estimates derived from this data set are valid, the proportion of reads mapping to five common housekeeping genes (TEF1, ACT1, TUB1, EFG1, and PMA1) was obtained, and the average TPM of replicates for each sample set was plotted as was performed by Martin et al. (Fig. 1B) (25). Housekeeping gene expression levels were similar among all sample sets, even for PMA1, which had expression as low as ∼102 TPM (Fig. 1B). To further demonstrate that expression levels of housekeeping genes were similar for each sample set compared to the wild type, the average TPM of each sample set was log transformed and plotted against the corresponding wild-type values (Fig. 1C to E). Linear regression analysis was performed, and the R-squared values were >0.97 for each sample set, indicating a strong correlation.
FIG 1.

Gene expression profiles of replicates correlate well within each genotype, and housekeeping genes are represented in equivalent proportions across sample sets. (A) Principal component plot for transcriptomic analysis reveals that replicates have little variation. The EPT1 overexpressor strain is similar to the wild type, and the PE deficient strains have the greatest differences versus the wild type. (B) TPM for housekeeping genes are similar among all strains. Log-transformed TPM for housekeeping genes (TEF1, ACT1, TUB1, EFG1, and PMA1) is plotted versus the wild type for ept1Δ/Δ (C), EPT1 overexpressor (PENO1-EPT1) (D), and psd1Δ/Δ psd2Δ/Δ (E) strains. The color for each gene in panels B through E corresponds to the key in panel B.
For this analysis, genes that had greater than a log2 fold change of 0.6 (approximately 1.5-fold) compared to the value for the wild type were considered differentially expressed, and the cutoff for statistical significance used was a Benjamini-Hochberg adjusted P value of <0.05. There were vast changes to the transcriptome of the psd1Δ/Δ psd2Δ/Δ mutant and to a lesser extent the ept1Δ/Δ mutant (Fig. 2B and C; see also Table S1 in the supplemental material). In total, there were 599 statistically significant downregulated genes and 618 upregulated genes in the psd1Δ/Δ psd2Δ/Δ mutant compared to those in the wild type. For the ept1Δ/Δ knockout, there were 48 significantly downregulated genes and 21 upregulated genes compared to those in the wild type. To determine how loss of PE by either pathway affected gene expression, genes that were co-upregulated or co-downregulated in both mutants were compiled. There were 35 genes that were co-downregulated in both the ept1Δ/Δ and psd1Δ/Δ psd2Δ/Δ mutants and 6 genes co-upregulated in both mutants compared to those in the wild type (Fig. 3A). The set of coregulated genes was used as an input for the Kyoto Encyclopedia of Genes and Genomes (KEGG) pathway analysis to determine which pathways had multiple genes that were differentially expressed when PE was depleted for either the CDP-DAG or Kennedy pathway. A bar chart identifying pathways containing more than one gene with differential expression was compiled (Fig. 3B). Each mutant was individually examined for differential expression of genes involved in these specific pathways using KEGG (Fig. 3B).
FIG 2.

Gene expression profiles of mutants that affect PE synthesis. Log fold change of the EPT1 overexpressor (A), ept1Δ/Δ (B), and psd1Δ/Δ psd2Δ/Δ (C) mutants versus the wild type. Gold points represent genes that have Benjamini-Hochberg-adjusted P values of <0.05, and black points are those with P values of >0.05. Genes above the red line have positive expression compared to that of the wild type, and those that are below the line have negative expression values. The only statistically significant differentially expressed gene in the EPT1 overexpressor strain is EPT1 (log2 fold change = 2.74; P < 0.05). For the ept1Δ/Δ strain, there are 69 statistically significant differentially expressed genes (greater or less than log2-fold change of 0.6), and for the psd1Δ/Δ psd2Δ/Δ mutant there are 1,217 statistically significant differentially expressed genes.
FIG 3.

Gene expression changes in the mutants with diminished PE synthesis represent several overlapping cellular processes. (A) Heat map of genes that have a >0.6 log2-fold change versus the wild type with a Benjamini-Hochberg-adjusted P value of <0.05 in both the psd1Δ/Δ psd2Δ/Δ and ept1Δ/Δ mutants. Genes that are co-downregulated are blue and genes that are co-upregulated are yellow. (B) Pathways that are impacted by the loss of PE were determined using KEGG pathway analysis. Pathways with more than one gene differentially expressed in both the psd1Δ/Δ psd2Δ/Δ and ept1Δ/Δ mutants are displayed for each mutant.
Overall, eleven pathways emerged that had more than two genes with differential expression present for both mutants. When the psd1Δ/Δ psd2Δ/Δ mutant is examined alone, the number of genes differentially expressed within these pathways greatly increases (Fig. 3B). There are multiple commonalities between these pathways related to the tricarboxylic acid (TCA) cycle in yeast. First, 2-oxocarboxylic acid metabolism and pyruvate metabolism are tied to the TCA cycle (26). Second, the branched-chain amino acids valine, leucine, and isoleucine are synthesized from pyruvate, which can enter the TCA cycle (27). Thirdly, the peroxisome is involved in the β-oxidation of fatty acids to form acetyl coenzyme A (acetyl-CoA), which is an input for the TCA cycle (reviewed in reference 28). There are also changes to fatty acid degradation and metabolism, which is expected because of the disruption of major phospholipid biosynthetic routes.
In addition to the eleven identified pathways with genes that are differentially expressed in both mutants, there were several pathways identified in the psd1Δ/Δ psd2Δ/Δ mutant with differentially expressed genes for which the ept1Δ/Δ mutant had fewer than two genes differentially expressed. These included genes directly involved in the TCA cycle, protein processing at the endoplasmic reticulum (ER), glycolysis, oxidative phosphorylation, tRNA biosynthesis, and N and O glycan biosynthesis. Overall, genes involved in amino acid biosynthesis, the TCA cycle, the peroxisome, oxidative respiration, and glycolysis were downregulated (Fig. 4). Several of these functions are part of the core carbon metabolism of the cell, and downregulation of the TCA cycle and oxidative phosphorylation may indicate mitochondrial defects in the psd1Δ/Δ psd2Δ/Δ mutant. In fact, this aligns with previous research that demonstrated mitochondrial defects in the psd1Δ/Δ psd2Δ/Δ mutant via increased growth in the presence of paraquat and hypersensitivity to farnesol (4, 29).
FIG 4.

Several pathways have multiple differentially expressed genes in the psd1Δ/Δ psd2Δ/Δ mutant. Downregulated pathways included those involved in glycolysis, oxidative phosphorylation, the TCA cycle, peroxisomal functions, and amino acid biosynthesis. Several pathways were found to be modestly upregulated in the psd1Δ/Δ psd2Δ/Δ mutant, including N- and O-glycan biosynthesis, tRNA synthesis, and protein processing in the ER. Yellow values are upregulated and blue values are downregulated. All genes shown have greater or less than a log2-fold change of 0.6 and a Benjamini-Hochberg-adjusted P value of <0.05.
Pathways that involve genes that were upregulated in the psd1Δ/Δ psd2Δ/Δ mutant included N- and O-linked glycan biosynthesis, tRNA synthesis, and protein processing at the endoplasmic reticulum (ER) (Fig. 4). Glycosylation of cell wall proteins occurs within the ER and Golgi, and this function is important for proper folding and export of glycoproteins (30). The increased expression of genes involved in these processes may be in response to cell wall stress incurred by a loss of PE. The psd1Δ/Δ psd2Δ/Δ mutant is known to have cell wall stability issues which can be suppressed by the addition of an osmotic stabilizer to the growth medium (4).
Overexpression of EPT1 does not impact the transcriptome.
In contrast to mutants that are deficient in synthesizing PE, the PE overexpressor (PENO1-EPT1) expresses only one gene with statistically significant differential expression compared to the wild type. This gene was EPT1 (log2-fold change = 2.74; P < 0.05), which is constitutively expressed in this strain (Fig. 2A and Table 1; see also Table S1). While we have previously used radiolabeling assays to confirm that the EPT1 overexpressor has increased Ept1 activity, these data further validate that the overexpression construct functions as expected (15). However, since there are no other differentially expressed genes, we hypothesized that the hypervirulent phenotype is due to posttranscriptional changes in the cell that alter either the virulence properties of the fungus or host immune recognition.
TABLE 1.
Candida albicans strains and plasmids employed in this study
| Strain | Parent strain | Genotype | Source |
|---|---|---|---|
| SC5314 | Clinical isolate | Prototrophic wild type | 51 |
| YLC339 | YLC335 | cho1Δ/Δ | 4 |
| YLC375 | YLC373 | psd1Δ/Δ psd2Δ/Δ | 4 |
| BTY88 | SC5314 | PENO1::PENO1-EPT1-NAT1 | 15 |
| BTY104 | BTY101 | ept1Δ/Δ-SAT1 | 15 |
| BTY204 | YLC339 | cho1Δ/Δ PENO1::PENO1-EPT1-NAT1 | This study |
| pBT11 (E. coli) | pBT1 (E. coli) | EPT1 overexpression vector | 15 |
The mechanism by which increased PE might cause hypervirulence is unclear. However, given that the loss of PE can cause cell wall defects, we hypothesized that increased PE might also impact the cell wall in a way that would increase virulence. Virulence could be increased with a decrease of β(1,3)-glucan exposure in the cell wall. Since the loss of phosphatidylserine increases exposure of β(1,3)-glucan (4, 16), the increase in PE might have the opposite effect and decrease exposure of β(1,3)-glucan and the subsequent immune response. Furthermore, cell wall chitin also impacts host recognition of fungi. Therefore, we investigated the cell wall components β(1,3)-glucan and chitin in the EPT1 overexpressor.
Immunofluorescent staining and flow cytometry were performed to determine the amount of β(1,3)-glucan exposure for wild-type, EPT1 overexpressor, and ept1Δ/Δ strains. In addition, the cho1Δ/Δ mutant was used as a positive control for β(1,3)-glucan exposure based on our previous observations (22). Each strain was cultured in yeast extract-peptone-dextrose (YPD) and stained with a mouse anti-β(1,3)-glucan primary antibody and a phycoerythrin-conjugated goat anti-mouse IgG secondary antibody. Samples were then measured by flow cytometry. In neither stationary-phase nor log-phase cells was there a difference observed for β(1,3)-glucan exposure when the EPT1 overexpressor strain was compared to the wild type (see Fig. S1 in the supplemental material and Fig. 5, respectively). This was further confirmed by testing these cells for their ability to elicit TNF-α from macrophages. Cells like the cho1Δ/Δ mutant that exhibit greater β(1,3)-glucan exposure also cause increased TNF-α release from macrophages (see Fig. S2 in the supplemental material); however, overexpression of EPT1 in the wild-type background did not show a difference from the wild-type control strain.
FIG 5.
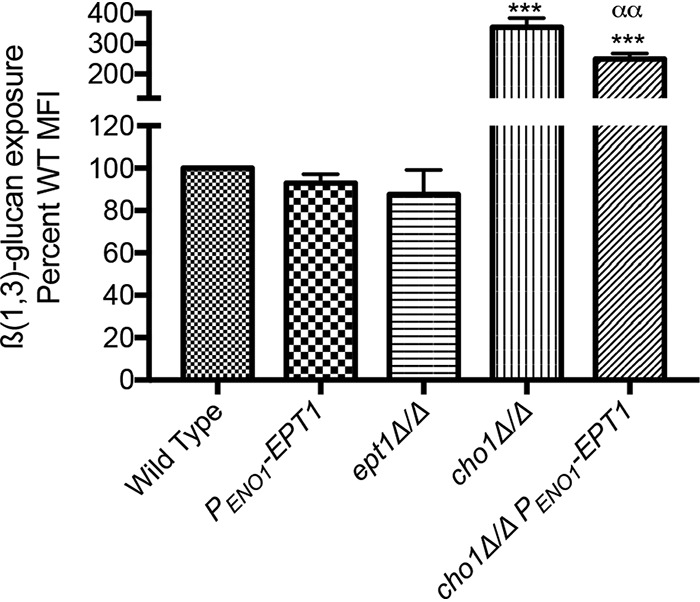
β(1,3)-Glucan exposure is repressed in cho1Δ/Δ cells by overexpression of EPT1. Cells were grown to log phase in YPD, stained with anti-β(1,3)-glucan antibody, and analyzed by flow cytometry. MFI, mean fluorescent intensity. ***, P < 0.0001 versus wild type (WT); αα, P < 0.0001 versus cho1Δ/Δ mutant; n = 3, one-way analysis of variance (ANOVA).
Since wild-type cells do not expose a lot of glucan to begin with, we tested if overexpression of EPT1 can decrease glucan exposure in cells with increased β(1,3)-glucan exposure, like the cho1Δ/Δ strain (Fig. 5). A cho1Δ/Δ PENO1-EPT1 strain was constructed (Table 1) and compared to the cho1Δ/Δ mutant. Overexpression of EPT1 in the cho1Δ/Δ background resulted in a statistically significant decrease in β(1,3)-glucan exposure compared to the parental cho1Δ/Δ strain in log-phase cells (Fig. 5). These data indicate that overexpression of EPT1 can cause decreased β(1,3)-glucan exposure in highly exposed cells. Therefore, we chose to investigate this phenomenon further.
Within the host during infection, Candida cells exhibit β(1,3)-glucan exposure over time (31) or in response to treatment with drugs like caspofungin (32). Because EPT1 overexpression decreased β(1,3)-glucan exposure in cho1Δ/Δ cells, we tested the impact of EPT1 overexpression on β(1,3)-glucan exposure during a stress that induces unmasking. Therefore, we tested the effects of EPT1 during treatment with a sub-MIC of caspofungin. A 30-min treatment of cells with a sublethal concentration of caspofungin (47 ng/ml) induced β(1,3)-glucan exposure for both the wild type and EPT1 overexpressor compared to their respective untreated controls (Fig. 6A; P < 0.0001). However, overexpression of EPT1 diminished caspofungin-induced β(1,3)-glucan exposure at 15.6 ng/ml (one-eighth MIC), 31.3 ng/ml (one-fourth MIC), and 47 ng/ml (three-eighths MIC) caspofungin (Fig. 6B; P < 0.05, P < 0.01, P < 0.0001). These data suggest that overexpression of EPT1 confers some resistance to β(1,3)-glucan exposure in response to cell wall stress. However, given the modest nature of the decreased β(1,3)-glucan exposure (Fig. 6) and the fact that untreated wild-type cells do not exhibit this phenotype, we do not believe that β(1,3)-glucan masking plays an important role in the hypervirulence of EPT1-overexpressing cells.
FIG 6.

EPT1 overexpression diminishes β(1,3)-glucan exposure in response to caspofungin. (A) Cells were treated with caspofungin (47 ng/ml) for 30 min, stained for β(1,3)-glucan exposure, and analyzed by flow cytometry (n = 3; ***, P < 0.0001; unpaired t test). (B) The wild type and EPT1 overexpressor were incubated with the indicated sublethal dose of caspofungin, and immunofluorescent staining of exposed β(1,3)-glucan was analyzed by flow cytometry (n = 6 to 9/strain; ***, P < 0.0001; **, P < 0.01; unpaired t test; MFI, mean fluorescence intensity).
Overexpression of EPT1 increases cell wall chitin.
Although the change in β(1,3)-glucan exposure may not explain the hypervirulence, another cell wall polymer that has been associated with virulence modulation is chitin. In addition to modulation of virulence, chitin levels have been reported to correlate with changes in β(1,3)-glucan exposure. We hypothesized that overexpression of EPT1 could alter chitin levels and contribute to the hypervirulence phenotype (21, 33, 34). Purified fungal chitin less than 40 μM in size can cause increased production of IL-10 in vivo, which drives an anti-inflammatory response (20). Alternatively, purified chitin can cause a proinflammatory TNF-α response in vivo if particle size is between 40 and 70 μM (20). Therefore, cells were stained with calcofluor white (CFW) and measured by flow cytometry to assess the chitin levels in wild-type and EPT1 overexpressor strains (Fig. 7A). The cho1Δ/Δ strain was used as a positive control (34). The EPT1 overexpression strain exhibits a 1.65-fold increase in chitin staining compared to the wild-type strain (Fig. 7A), and therefore overexpression of this gene influences chitin levels. This increase is not as high as that seen in the cho1Δ/Δ mutant, which has a 2.11-fold increase compared to the level in the wild type (Fig. 7A), but does indicate that Ept1 has a significant impact on chitin deposition in the cell wall.
FIG 7.

Overexpression of EPT1 increases total chitin. To measure chitin levels, cells were stained with calcofluor white (CFW) and then measured by flow cytometry. (A and B) Cells were grown overnight in YPD before staining (n = 9/strain; *, P = 0.0259; **, P = 0.0017; ****, P < 0.0001; α, P = 0.0131, all measured by one-way ANOVA). (C) Untreated and 47 ng/ml caspofungin-treated (30 min) cells were stained with CFW and measured by flow cytometry (n = 6/strain; ***, P < 0.0001; NS, not significant; unpaired t test; MFI, mean fluorescent intensity).
Given the small reductions of β(1,3)-glucan exposure in the cho1Δ/Δ EPT1 overexpressor, we wanted to determine if EPT1 would have an effect on chitin levels in this strain. However, we saw an opposite effect for chitin. Overexpression of EPT1 caused the cho1Δ/Δ strain to exhibit a 1.88-fold increase in calcofluor white staining over that of the cho1Δ/Δ strain alone (Fig. 7B) or a 3.96-fold increase over that of the wild type. Thus, in the cho1Δ/Δ mutant, overexpression of EPT1 exacerbates the mutant’s overproduction of chitin. Therefore, we wanted to determine if EPT1 overexpression would impact other conditions that increase chitin levels, such as caspofungin treatment (35). When the wild type and the EPT1 overexpressor were stressed for 30 min with 47 ng/ml caspofungin, there was a 1.8-fold increase in chitin staining for the wild type in the presence of caspofungin, but the EPT1 overexpressor, which already has an increase in chitin (Fig. 7C), showed no significant change. Thus, overexpression of EPT1 increases chitin levels but, in combination with other conditions that increase chitin, has differential responses.
Overexpression of EPT1 increases hyphal length.
Interestingly, some mutations with hypervirulent phenotypes also cause increased chitin levels, such as the pir32Δ/Δ disruptant (36). Moreover, in the pir32Δ/Δ mutant, increased chitin and hypervirulence also correlated with an increase in hyphal formation. In fact, there have been several instances in which hypervirulence in C. albicans was associated with an increased ability to form hyphae (37, 38). Hyphal formation is a major virulence factor in C. albicans that allows for escape from macrophages, damage to mammalian cells, and biofilm formation (37–40). Since we observed hypervirulence and an increase in chitin content in the EPT1 overexpressor, we hypothesized that this strain may also have an increased ability to form filaments. When induced to form hyphae in RPMI with 20% human serum at 37°C, differences were seen in hyphal length after 3 h. A 9.5% average increase in length was observed for the EPT1 overexpressor strain compared to that of the wild type (Fig. 8A). The cho1Δ/Δ mutant had a 32.1% decrease in hyphal length compared to that of the wild type, but overexpression of EPT1 in the cho1Δ/Δ background resulted in a 16% increase compared to that of the cho1Δ/Δ mutant. These data indicate that overexpression of EPT1 increases filamentation. However, in yeast-form cells, there was no difference in growth rates between the EPT1 overexpressor, the ept1Δ/Δ mutant, or the wild-type strains (Fig. 8B). Growth was also tested via spot dilutions on YPD plates, and no differences in growth rate at 30°C were observed (data not shown). Therefore, the increase in growth seems to be hypha specific.
FIG 8.

Overexpression of EPT1 results in increased hyphal length at 3 h, but the growth of yeast-form cells does not differ from that of the wild type. (A) Stationary cultures were diluted to an OD600 of 1.0 × 10⁻⁴ in RPMI + 20% human serum and were incubated for 3 h at 37°C in technical triplicate. Following incubation, six images per well were obtained on an inverted microscope at ×200 total magnification. The length of hyphae was obtained using ImageJ software and was expressed as percent of average wild-type hyphal length. This experiment was performed three times (n = 600 hyphae/strain; ***, P < 0.0001 versus wild type; ααα, P < 0.0001 versus cho1Δ/Δ mutant; one-way ANOVA). (B) Stationary cultures were diluted to an OD600 of 0.1 in YPD and incubated at 225 rpm and 30°C. Growth was measured by obtaining the OD600 at 2-h time points for 12 h. Strains were cultured in triplicate.
DISCUSSION
The results of our RNA sequencing analysis demonstrate that a loss of PE greatly impacts the transcriptional profile of the cell (Fig. 2B and C). This impact is greater for the psd1Δ/Δ psd2Δ/Δ mutant, which is expected given its known growth defects, cell wall issues, and strongly attenuated virulence in the mouse model (4). Interestingly, the psd1Δ/Δ psd2Δ/Δ mutant has decreased expression of genes in several pathways involved in energy production and core carbon metabolism of the cell, specifically, the TCA cycle, glycolysis, and oxidative respiration (Fig. 4). PE is an important component of the mitochondrial membrane as disruption of PE synthesis decreases inner membrane potential (41), which explains our findings of decreased expression of cellular respiration genes. The psd1Δ/Δ psd2Δ/Δ mutant also has increased expression of genes involved in protein processing and glycosylation (Fig. 4). These are important for secretion of properly manufactured glycoproteins on the cell surface, and therefore we believe that increased regulation of these genes is a compensatory mechanism for cell wall stress (30). We previously demonstrated that the psd1Δ/Δ psd2Δ/Δ mutant has a growth defect which can be restored when an osmotic stabilizer such as sorbitol is added to the growth medium (4). However, the actual cause of the cell wall stress when PE levels are compromised is unknown.
The disruption of EPT1 impacts the transcriptome to a lesser degree than does a mutation of both PSD1 and PSD2 (Fig. 2B and C). The loss of the CDP-DAG pathway and subsequent PE production results in ethanolamine auxotrophy, a strong growth defect, and a much more pronounced virulence defect (4). This is likely because production of PE via the CDP-DAG pathway is more important for cellular metabolism than the Kennedy pathway production of PE (4, 15). In addition, there may be changes in the level of intermediate metabolites or other phospholipids that occur in the psd1Δ/Δ psd2Δ/Δ strain but not the ept1Δ/Δ mutant. This may account for the more pronounced virulence defect of the psd1Δ/Δ psd2Δ/Δ strain. One such possibility is a change in the level of PS, which is increased for the psd1Δ/Δ psd2Δ/Δ mutant (7). While this has not been measured for the ept1Δ/Δ strain, there is no reason to believe that there would be differences for this mutant because PS synthesis is neither directly upstream nor downstream of PE synthesis by the Kennedy pathway (reviewed in reference 42).
In contrast to our observations of profound gene expression changes when PE synthesis is compromised, we found no differences in the transcriptional profile for EPT1 overexpression (Fig. 2A). This indicates that there must be posttranscriptional changes in the cell that occur with increased PE which cause virulence to increase.
The primary change observed in the cell wall of the EPT1 overexpressor was an increase in chitin (Fig. 7). β(1,3)-Glucan exposure was only modestly affected and then only in the cho1Δ/Δ mutant or caspofungin-treated cells (Fig. 5 and 6). Thus, β(1,3)-glucan masking effects are not a driver of hypervirulence in the EPT1 overexpressor.
A more likely source of the impact would be changes in chitin levels in the cell wall. There was a 1.65-fold increase in chitin level for the EPT1 overexpressor compared to that of the wild type (Fig. 7A). Most of the chitin synthesis in C. albicans is performed by chitin synthase 3 (CHS3) (43). However, localization of CHS3 is likely the major regulatory mechanism for this enzyme (43). Therefore, it is reasonable that there are no transcriptional changes of chitin synthase genes even though there is an increase in chitin content in the EPT1 overexpression mutant. Of the changes observed in cell wall architecture, the increase in chitin was more profound than the decrease in β(1,3)-glucan exposure when EPT1 is overexpressed. Therefore, of these two differences, we favor increased chitin as a potential driving factor for hypervirulence.
Interestingly, the overexpression of EPT1 causes an even greater increase in chitin levels in the cho1Δ/Δ mutant, which has higher levels already. The Cek1 mitogen-activated protein kinase (MAPK) pathway is hyperactivated in the cho1Δ/Δ mutant (44), and this pathway upregulates chitin synthase genes and causes increased chitin synthesis when overexpressed (45). Thus, the very high chitin levels observed in the cho1Δ/Δ EPT1 overexpressor may be an additive consequence of increased expression of chitin synthesis genes associated with the cho1Δ/Δ mutant and the posttranscriptional increases in chitin synthesis associated with EPT1 overexpression.
Besides changes in cell wall architecture that may contribute to immune manipulation as a defensive mechanism, we have demonstrated that overexpression of EPT1 also causes increased filamentation (Fig. 8A). The ability to form hyphae is a major virulence determinant in C. albicans, as they are used to escape the phagosome, lyse epithelial and endothelial cells, and aid in biofilm formation (40, 46). To our knowledge, there have been at least four other instances in which hypervirulence in C. albicans correlated with increased hyphal length or production, and in one case this correlated with an increased level of chitin (36–39). However, since we do not see increased chitin levels in hyphal cells overexpressing EPT1 (data not shown), there is not a clear connection between chitin levels and hyphal length in the EPT1 overexpressor.
It is currently unclear why EPT1 overexpression causes cells to form longer hyphae, but since yeast-form cells overexpressing EPT1 do not replicate at an increased rate, this may be a hypha-specific difference (Fig. 8B). One possible explanation is that the Spitzenkörper may be impacted. This is a hypha-specific organelle that provides secretory vesicles (SVs) to the polarized site of growth (47, 48). Since there is an increase in PE/PC production for the EPT1 overexpressor (15), this increase might cause increased production of secretory vesicles (SVs) or alterations in the phospholipid species profile of SVs that may increase hyphal growth at an early time point.
It is also possible that both increased chitin in yeast-form cells and faster hyphal growth in combination are what increases virulence. Hyphae are a major virulence factor of C. albicans, and increased hyphal growth rate could promote greater virulence for the EPT1 overexpression strain (40). Driving cells into hyphal formation (by overexpression of the UME6 transcription factor, for example) increases virulence in the mouse model (39). In contrast, it is important for C. albicans to switch between both yeast and hyphal forms, as locking it in either form results in avirulence. This is presumably due to an inability of hypha-locked cells to disseminate or for yeast-locked cells to damage tissue (49). Thus, the increased hyphal development in the EPT1 overexpressor (Fig. 8) could act in conjunction with changes in cell wall architecture related to increased chitin levels in the yeast-form cells (Fig. 7), and together these phenotypes could contribute to the EPT1 overexpressor’s increase in virulence (15).
MATERIALS AND METHODS
Culture conditions and growth media.
Candida albicans strains from the SC5314 background were routinely cultured in YPD (1% yeast extract, 2% dextrose, 2% peptone) in a shaking incubator at 225 rpm and 30°C (Table 1) (50, 51). The RAW 264.7 macrophage cell line was routinely cultured in Dulbecco’s modified eagle medium with l-glutamine (DMEM) (11965118; Gibco) supplemented with 10% fetal bovine serum (FBS) (16000044; Invitrogen) and 1% penicillin-streptomycin at 37°C and 5% CO2 (52). Escherichia coli strains (DH5-α) (C2987I; NEB) were cultured in LB broth (1% tryptone, 1% NaCl, 0.5% yeast extract) in a rotating incubator at 37°C.
Strain construction.
Candida albicans strains (Table 1) were created with the use of the SAT1 flipper method (53). To overexpress EPT1 in the cho1Δ/Δ background, a cho1Δ/Δ PENO1-EPT1 strain was constructed. The EPT1 overexpression construct, pBT11, was linearized (MscI) and transformed into YLC339 (cho1Δ/Δ) via electroporation as described previously (15, 54). Transformants were selected with the use of YPD supplemented with 200 μg/ml nourseothricin (N-500-1; GoldBio), and successful transformants were confirmed using PCR with the primers BTO33 (5′-GACTAACGATTTCTATAAGG-3′) and BTO43 (5′-GTTAGTTGGAATGAAAAGTC-3′).
RNA isolation, purification, and sequencing.
The wild-type, EPT1 overexpressor, ept1Δ/Δ, and psd1Δ/Δ psd2Δ/Δ strains were cultured for approximately 16 h in 5 ml YPD with shaking at 225 rpm and 30°C. Following incubation, each strain was washed twice with 35 ml sterile double-distilled water (ddH2O) and resuspended in 5 ml ddH2O. Each strain was diluted, in duplicate, to an optical density at 600 nm (OD600) of 0.5 in 25 ml of Earl’s balanced salt solution (EBSS) (SH30024.01; GE Life Sciences) supplemented with 1% penicillin-streptomycin (15140122; Gibco) and 2% human serum (92930149; MP Biomedicals) that was prewarmed to 37°C in T125 tissue culture flasks. Flasks were incubated at 37°C and 5% CO2 for 4 h as was performed in prior cytotoxicity assays (15). Following incubation, hyphae were removed with a sterile rubber cell scraper and transferred to 50-ml conical tubes. Samples were washed twice with sterile phosphate-buffered saline (PBS) and were resuspended in 750 μl acid-phenol (pH 4.5), vortexed, and transferred to 2-ml screw cap tubes that contained 750 μl N-tris(hydroxymethyl)methyl-2-aminoethanesulfonic acid (TES) buffer (10 mM Tris, pH 7.5; 10 mM EDTA, pH 8.0; 0.5% SDS) and 0.5-g zirconia beads. Each tube was filled completely with TES so that no air remained and was placed on ice for 2 min. Samples were homogenized in a bead beater for 1 min and allowed to rest on ice for 2 min. Four total cycles of homogenization were performed, and samples were subsequently incubated at 65°C for 30 min with vigorous vortexing at 10-min intervals. After incubation, samples were centrifuged for 5 min at 13,000 rpm at room temperature, and the aqueous layer was transferred to a fresh tube containing 700 μl acid-phenol-chloroform, vortexed, and centrifuged at 13,000 rpm for 5 min. This process was repeated using 600 μl phenol-chloroform (pH 6.7) until the interface was clear. The supernatant was transferred to a fresh tube, and nucleic acids were precipitated with diethyl pyrocarbonate (DEPC)-treated 3 M NaOAc and 100% ethanol. Samples were stored at –80°C for approximately 16 h and thawed, and the RNA pellet was centrifuged, washed with 70% ice-cold ethanol, air dried, resuspended in 50 μl RNase-free H2O, and quantified using a spectrophotometer. Following quantification, DNase treatment was performed with a Turbo DNase-free kit (AM1907; Ambion) according to the manufacturer’s protocol.
To determine final RNA concentration and quality, samples were analyzed with the 2100 series bioanalyzer (Agilent Technologies, CA, USA) at the University of Tennessee Genomics Core. Following quality control analysis, a cDNA library was prepared with the Nextera XT library kit (Illumina Inc., CA, USA) by following the manufacturer’s protocol, and the library was validated via bioanalyzer (Agilent Technologies, CA, USA). The cDNA library was pooled and sequenced in-house using an Illumina MiSeq V2 flow cell (Illumina Inc., CA, USA).
Transcriptomic analysis.
The C. albicans reference genome (version A22-s07-m01-r71) and corresponding annotations were downloaded from the Candida Genome Database (23). Samples were analyzed using the University of Tennessee Advanced Computing Facility (ACF) resources. The quality of each sample was analyzed using FastQC (version 0.11.5), and trimming was performed using Trimmomatic (version 0.36). Read quality was again confirmed following trimming with FastQC (version 0.11.5). The reference genome and corresponding annotations were converted to a haploid reference and annotation set by removing the B allele for each gene using in-house scripts. This was also repeated for the A allele. Read mapping and annotation were performed with STAR (version 2.5.3a) (55). Mapped read counts were obtained with HTSeq (version 0.10.0) (56), and DESeq2 (version 1.18.1) (24) was used within the RStudio environment (R version 3.4.3) to perform differential expression analysis. In-house Python scripts were used to generate a list of genes that were co-upregulated and co-downregulated in both the ept1Δ/Δ and psd1Δ/Δ psd2Δ/Δ strains compared to the wild type. Specifically, this list included genes that had greater or less than a 0.6 log2-fold (∼1.5-fold) change in both mutants compared to that of the wild type. The genes in this list also meet the requirement of having a Benjamini-Hochberg-adjusted P value of <0.05. GraphPad Prism (version 7.04) was used to generate heat maps, and the Candida Genome Database (CGD) GO Slim mapper feature was used to determine functional groupings of differentially expressed genes (23). In addition, the Kyoto Encyclopedia of Genes and Genomes (KEGG) pathway analysis tool was used to determine which pathways had multiple genes that were differentially expressed (57). To validate RNA sequencing data, transcripts per kilobase million (TPM) was calculated using CLC genomics workbench (version 10.1.1) and the proportion of transcripts mapping to housekeeping genes for each sample set was determined. Briefly, Illumina reads were imported into CLC and trimmed with the following: limit = 0.01, maximum number of ambiguities = 2, and automatic read-through adapter trimming = yes. Reads were mapped with the following: mismatch cost = 2, insertion cost = 3, deletion cost = 3, length fraction = 0.8, and similarity fraction = 0.8.
β(1,3)-Glucan and chitin detection assays.
Chitin staining and surface β(1,3)-glucan exposure of cells at either stationary or log phase of growth were quantified using flow cytometry for yeast-form cells or microscopy for hyphae. To stain yeast cells at stationary-phase, 5-ml cultures of C. albicans in YPD were grown with shaking for approximately 16 h at 30°C and 225 rpm and then diluted to an OD600 of 0.5 for β(1,3)-glucan staining or an OD600 of 1.5 for chitin staining. To stain log-phase cells, stationary cultures were diluted to an OD600 of 0.1 in 5 ml YPD and incubated for 3.5 h at 30°C and 225 rpm. Staining of β(1,3)-glucan was performed as described previously with three biological replicates for each strain (44).
Chitin staining was achieved using calcofluor white (4359; Polysciences Inc.). Stationary-phase cultures were diluted to an OD600 of 1.5, washed three times with 500 μl PBS, and resuspended in 500 μl of 0.01 mg/ml calcofluor white. Cells were then rocked in the dark for 5 min at room temperature, washed 3 times with 500 μl water, and resuspended in 500 μl fluorescence-activated cell sorter (FACS) buffer for flow cytometry analysis. All samples were analyzed with an LSR II flow cytometer (Becton, Dickinson Biosciences), and data for each sample were collected for 100,000 gated events. This experiment was performed with three biological replicates. Data were analyzed with FlowJo (version 10.11) and statistical significance was determined by performing one-way ANOVA or unpaired t test with GraphPad Prism (version 7.04).
Surface exposed β(1,3)-glucan was further assessed when cells were put under chemical stress. Chemical stress was induced by the addition of sub-MICs of caspofungin (Merck, NJ, USA). Stationary cultures of C. albicans were diluted to an OD600 of 0.5 in 5 ml of YPD containing 15.6 ng/ml (one-eighth MIC), 31.3 ng/ml (one-fourth MIC), or 46.9 ng/ml (three-eighths MIC) caspofungin. Cultures were incubated at 30°C and 225 rpm for 30 min, and 1 ml of each sample was removed for analysis of either β(1,3)-glucan exposure or chitin as previously described. Chitin analysis after caspofungin treatment was performed in biological and technical triplicate. β(1,3)-Glucan exposure analysis after caspofungin treatment was performed with a minimum of two biological replicates per strain and per condition, each in technical triplicate.
Yeast growth and hyphal length measurements.
For yeast-form cells, each strain was cultured to stationary phase for approximately 16 h in YPD with shaking at 225 rpm and 30°C and then diluted to an OD600 of 0.1 in fresh YPD in triplicate. Cells were again cultured by shaking at 225 rpm and 30°C, and OD600 was measured every 2 h for 12 h.
For hyphal length measurements, stationary-phase cells were washed twice with 30 ml sterile PBS. Following washes, cells were resuspended in 5 ml PBS. Cultures were diluted to an OD600 of 1.0 in 1 ml of RPMI + 20% human serum that was prewarmed to 37°C. Serial dilutions were performed, and 100 μl of each culture was plated in triplicate in a 96-well plate at a final OD600 of 1.0 × 10⁻⁴. Cells were then incubated for 3 h at 37°C to induce the formation of hyphae. Following incubation, six images per well were obtained on an inverted microscope. For each experiment, the length of 200 hyphae, from the base of the cell to the hyphal tip, was measured for each strain using ImageJ software (version 1.52a) and was expressed as percent average wild-type hyphal length. This experiment was performed three times (n = 600/strain total) (58).
Data availability.
Sequence data have been deposited in NCBI under BioProject accession number PRJNA556202. In addition, scripts for analyzing RNA sequencing data have been deposited at GitHub (https://github.com/Reynolds-Lab-UtK/Tams_et_al_2019).
Supplementary Material
ACKNOWLEDGMENTS
We thank Veronica Brown and the UT Genomics Core for assistance in cDNA library preparation and sequencing and Lauren Krausfeldt for her comments and suggestions regarding transcriptomic analysis. We also thank Steven Wilhelm, Robbie Martin, Tian Chen, and Kyle Bonifer for helpful discussions and other contributions.
This work was funded by the National Institutes of Health grants NIH 1R21AI130895 (T.B.R.) and NIH 1R15AI144683-01 (T.E.S.). The funders had no role in the design or execution of the project or the decision to publish.
We declare that the research was conducted in the absence of any commercial or financial relationships that could be construed as a potential conflict of interest.
R.N.T. and T.B.R. designed and created plasmids and C. albicans strains. R.N.T. performed RNA extractions and sequencing. Bioinformatic analysis was performed by R.N.T. and E.R.G. A.S.W. performed chitin and β(1,3)-glucan staining and subsequent flow cytometry. J.W.J. assisted with flow cytometry. R.N.T. performed all other assays and wrote the manuscript. T.B.R. directed the project. T.B.R. and T.E.S. edited the manuscript.
Footnotes
Supplemental material is available online only.
REFERENCES
- 1.Bustamante CI. 2005. Treatment of Candida infection: a view from the trenches! Curr Opin Infect Dis 18:490–495. doi: 10.1097/01.qco.0000191516.43792.61. [DOI] [PubMed] [Google Scholar]
- 2.Eggimann P, Garbino J, Pittet D. 2003. Management of Candida species infections in critically ill patients. Lancet Infect Dis 3:772–785. doi: 10.1016/s1473-3099(03)00831-4. [DOI] [PubMed] [Google Scholar]
- 3.Cowen LE, Sanglard D, Howard SJ, Rogers PD, Perlin DS. 2014. Mechanisms of antifungal drug resistance. Cold Spring Harb Perspect Med 5:a019752. doi: 10.1101/cshperspect.a019752. [DOI] [PMC free article] [PubMed] [Google Scholar]
- 4.Chen YL, Montedonico AE, Kauffman S, Dunlap JR, Menn FM, Reynolds TB. 2010. Phosphatidylserine synthase and phosphatidylserine decarboxylase are essential for cell wall integrity and virulence in Candida albicans. Mol Microbiol 75:1112–1132. doi: 10.1111/j.1365-2958.2009.07018.x. [DOI] [PubMed] [Google Scholar]
- 5.Chen YL, Kauffman S, Reynolds TB. 2008. Candida albicans uses multiple mechanisms to acquire the essential metabolite inositol during infection. Infect Immun 76:2793–2801. doi: 10.1128/IAI.01514-07. [DOI] [PMC free article] [PubMed] [Google Scholar]
- 6.Singh A, Prasad T, Kapoor K, Mandal A, Roth M, Welti R, Prasad R. 2010. Phospholipidome of Candida: each species of Candida has distinctive phospholipid molecular species. OMICS 14:665–677. doi: 10.1089/omi.2010.0041. [DOI] [PubMed] [Google Scholar]
- 7.Cassilly CD, Farmer AT, Montedonico AE, Smith TK, Campagna SR, Reynolds TB. 2017. Role of phosphatidylserine synthase in shaping the phospholipidome of Candida albicans. FEMS Yeast Res 17:fox007. doi: 10.1093/femsyr/fox007. [DOI] [PMC free article] [PubMed] [Google Scholar]
- 8.Carman GM, Han GS. 2011. Regulation of phospholipid synthesis in the yeast Saccharomyces cerevisiae. Annu Rev Biochem 80:859–883. doi: 10.1146/annurev-biochem-060409-092229. [DOI] [PMC free article] [PubMed] [Google Scholar]
- 9.Atkinson KD, Jensen B, Kolat AI, Storm EM, Henry SA, Fogel S. 1980. Yeast mutants auxotrophic for choline or ethanolamine. J Bacteriol 141:558–564. [DOI] [PMC free article] [PubMed] [Google Scholar]
- 10.Letts VA, Klig LS, Bae-Lee M, Carman GM, Henry SA. 1983. Isolation of the yeast structural gene for the membrane-associated enzyme phosphatidylserine synthase. Proc Natl Acad Sci U S A 80:7279–7283. doi: 10.1073/pnas.80.23.7279. [DOI] [PMC free article] [PubMed] [Google Scholar]
- 11.Clancey CJ, Chang SC, Dowhan W. 1993. Cloning of a gene (PSD1) encoding phosphatidylserine decarboxylase from Saccharomyces cerevisiae by complementation of an Escherichia coli mutant. J Biol Chem 268:24580–24590. [PubMed] [Google Scholar]
- 12.Trotter PJ, Voelker DR. 1995. Identification of a non-mitochondrial phosphatidylserine decarboxylase activity (PSD2) in the yeast Saccharomyces cerevisiae. J Biol Chem 270:6062–6070. doi: 10.1074/jbc.270.11.6062. [DOI] [PubMed] [Google Scholar]
- 13.Kodaki T, Yamashita S. 1987. Yeast phosphatidylethanolamine methylation pathway. Cloning and characterization of two distinct methyltransferase genes. J Biol Chem 262:15428–15435. [PubMed] [Google Scholar]
- 14.Gibellini F, Smith TK. 2010. The Kennedy pathway—de novo synthesis of phosphatidylethanolamine and phosphatidylcholine. IUBMB Life 62:414–428. doi: 10.1002/iub.337. [DOI] [PubMed] [Google Scholar]
- 15.Tams RN, Cassilly CD, Anaokar S, Brewer WT, Dinsmore JT, Chen Y-L, Patton-Vogt J, Reynolds TB. 2019. Overproduction of phospholipids by the Kennedy pathway leads to hypervirulence in Candida albicans. Front Microbiol 10:86. doi: 10.3389/fmicb.2019.00086. [DOI] [PMC free article] [PubMed] [Google Scholar]
- 16.Davis SE, Hopke A, Minkin SC Jr, Montedonico AE, Wheeler RT, Reynolds TB. 2014. Masking of beta(1-3)-glucan in the cell wall of Candida albicans from detection by innate immune cells depends on phosphatidylserine. Infect Immun 82:4405–4413. doi: 10.1128/IAI.01612-14. [DOI] [PMC free article] [PubMed] [Google Scholar]
- 17.Herre J, Marshall AS, Caron E, Edwards AD, Williams DL, Schweighoffer E, Tybulewicz V, Reis e Sousa C, Gordon S, Brown GD. 2004. Dectin-1 uses novel mechanisms for yeast phagocytosis in macrophages. Blood 104:4038–4045. doi: 10.1182/blood-2004-03-1140. [DOI] [PubMed] [Google Scholar]
- 18.Taylor PR, Tsoni SV, Willment JA, Dennehy KM, Rosas M, Findon H, Haynes K, Steele C, Botto M, Gordon S, Brown GD. 2007. Dectin-1 is required for beta-glucan recognition and control of fungal infection. Nat Immunol 8:31–38. doi: 10.1038/ni1408. [DOI] [PMC free article] [PubMed] [Google Scholar]
- 19.Lenardon MD, Munro CA, Gow NA. 2010. Chitin synthesis and fungal pathogenesis. Curr Opin Microbiol 13:416–423. doi: 10.1016/j.mib.2010.05.002. [DOI] [PMC free article] [PubMed] [Google Scholar]
- 20.Da Silva CA, Chalouni C, Williams A, Hartl D, Lee CG, Elias JA. 2009. Chitin is a size-dependent regulator of macrophage TNF and IL-10 production. J Immunol 182:3573–3582. doi: 10.4049/jimmunol.0802113. [DOI] [PubMed] [Google Scholar]
- 21.Wagener J, MacCallum DM, Brown GD, Gow NA. 2017. Candida albicans chitin increases arginase-1 activity in human macrophages, with an impact on macrophage antimicrobial functions. mBio 8:e01820-16. doi: 10.1128/mBio.01820-16. [DOI] [PMC free article] [PubMed] [Google Scholar]
- 22.Davis SE, Tams RN, Solis N, Wagner AS, Chen T, Jackson JW, Hasim S, Montedonico AE, Dinsmore J, Sparer TE, Filler SG, Reynolds TB. 2018. Candida albicans cannot acquire sufficient ethanolamine from the host to support virulence in the absence of de novo phosphatidylethanolamine synthesis. Infect Immun 86:e00815-17. doi: 10.1128/IAI.00815-17. [DOI] [PMC free article] [PubMed] [Google Scholar]
- 23.Skrzypek MS, Binkley J, Binkley G, Miyasato SR, Simison M, Sherlock G. 2017. The Candida Genome Database (CGD): incorporation of assembly 22, systematic identifiers and visualization of high throughput sequencing data. Nucleic Acids Res 45:D592–D596. doi: 10.1093/nar/gkw924. [DOI] [PMC free article] [PubMed] [Google Scholar]
- 24.Anders S, Huber W. 2010. Differential expression analysis for sequence count data. Genome Biol 11:R106. doi: 10.1186/gb-2010-11-10-r106. [DOI] [PMC free article] [PubMed] [Google Scholar]
- 25.Martin RM, Dearth SP, LeCleir GR, Campagna SR, Fozo EM, Zinser ER, Wilhelm SW. 2017. Microcystin-LR does not induce alterations to transcriptomic or metabolomic profiles of a model heterotrophic bacterium. PLoS One 12:e0189608. doi: 10.1371/journal.pone.0189608. [DOI] [PMC free article] [PubMed] [Google Scholar]
- 26.Wenzel TJ, van den Berg MA, Visser W, van den Berg JA, Steensma HY. 1992. Characterization of Saccharomyces cerevisiae mutants lacking the E1 alpha subunit of the pyruvate dehydrogenase complex. Eur J Biochem 209:697–705. doi: 10.1111/j.1432-1033.1992.tb17338.x. [DOI] [PubMed] [Google Scholar]
- 27.Ljungdahl PO, Daignan-Fornier B. 2012. Regulation of amino acid, nucleotide, and phosphate metabolism in Saccharomyces cerevisiae. Genetics 190:885–929. doi: 10.1534/genetics.111.133306. [DOI] [PMC free article] [PubMed] [Google Scholar]
- 28.Klug L, Daum G. 2014. Yeast lipid metabolism at a glance. FEMS Yeast Res 14:369–388. doi: 10.1111/1567-1364.12141. [DOI] [PubMed] [Google Scholar]
- 29.Hasim S, Vaughn EN, Donohoe D, Gordon DM, Pfiffner S, Reynolds TB. 2018. Influence of phosphatidylserine and phosphatidylethanolamine on farnesol tolerance in Candida albicans. Yeast 35:343–351. doi: 10.1002/yea.3297. [DOI] [PMC free article] [PubMed] [Google Scholar]
- 30.Orlean P. 2012. Architecture and biosynthesis of the Saccharomyces cerevisiae cell wall. Genetics 192:775–818. doi: 10.1534/genetics.112.144485. [DOI] [PMC free article] [PubMed] [Google Scholar]
- 31.Hopke A, Nicke N, Hidu EE, Degani G, Popolo L, Wheeler RT. 2016. Neutrophil attack triggers extracellular trap-dependent Candida cell wall remodeling and altered immune recognition. PLoS Pathog 12:e1005644. doi: 10.1371/journal.ppat.1005644. [DOI] [PMC free article] [PubMed] [Google Scholar]
- 32.Wheeler RT, Fink GR. 2006. A drug-sensitive genetic network masks fungi from the immune system. PLoS Pathog 2:e35. doi: 10.1371/journal.ppat.0020035. [DOI] [PMC free article] [PubMed] [Google Scholar]
- 33.Marakalala MJ, Vautier S, Potrykus J, Walker LA, Shepardson KM, Hopke A, Mora-Montes HM, Kerrigan A, Netea MG, Murray GI, Maccallum DM, Wheeler R, Munro CA, Gow NA, Cramer RA, Brown AJ, Brown GD. 2013. Differential adaptation of Candida albicans in vivo modulates immune recognition by dectin-1. PLoS Pathog 9:e1003315. doi: 10.1371/journal.ppat.1003315. [DOI] [PMC free article] [PubMed] [Google Scholar]
- 34.Hasim S, Allison DP, Retterer ST, Hopke A, Wheeler RT, Doktycz MJ, Reynolds TB. 2016. Beta-(1,3)-glucan unmasking in some Candida albicans mutants correlates with increases in cell wall surface roughness and decreases in cell wall elasticity. Infect Immun 85:e00601-16. doi: 10.1128/IAI.00601-16. [DOI] [PMC free article] [PubMed] [Google Scholar]
- 35.Walker LA, Munro CA, de Bruijn I, Lenardon MD, McKinnon A, Gow NA. 2008. Stimulation of chitin synthesis rescues Candida albicans from echinocandins. PLoS Pathog 4:e1000040. doi: 10.1371/journal.ppat.1000040. [DOI] [PMC free article] [PubMed] [Google Scholar]
- 36.Bahnan W, Koussa J, Younes S, Abi Rizk M, Khalil B, El Sitt S, Hanna S, El-Sibai M, Khalaf RA. 2012. Deletion of the Candida albicans PIR32 results in increased virulence, stress response, and upregulation of cell wall chitin deposition. Mycopathologia 174:107–119. doi: 10.1007/s11046-012-9533-z. [DOI] [PubMed] [Google Scholar]
- 37.Angiolella L, Stringaro AR, De Bernardis F, Posteraro B, Bonito M, Toccacieli L, Torosantucci A, Colone M, Sanguinetti M, Cassone A, Palamara AT. 2008. Increase of virulence and its phenotypic traits in drug-resistant strains of Candida albicans. Antimicrob Agents Chemother 52:927–936. doi: 10.1128/AAC.01223-07. [DOI] [PMC free article] [PubMed] [Google Scholar]
- 38.Duvenage L, Walker LA, Bojarczuk A, Johnston SA, MacCallum DM, Munro CA, Gourlay CW. 2019. Inhibition of classical and alternative modes of respiration in Candida albicans leads to cell wall remodeling and increased macrophage recognition. mBio 10:e02535-18. doi: 10.1128/mBio.02535-18. [DOI] [PMC free article] [PubMed] [Google Scholar]
- 39.Carlisle PL, Banerjee M, Lazzell A, Monteagudo C, Lopez-Ribot JL, Kadosh D. 2009. Expression levels of a filament-specific transcriptional regulator are sufficient to determine Candida albicans morphology and virulence. Proc Natl Acad Sci U S A 106:599–604. doi: 10.1073/pnas.0804061106. [DOI] [PMC free article] [PubMed] [Google Scholar]
- 40.Mayer FL, Wilson D, Hube B. 2013. Candida albicans pathogenicity mechanisms. Virulence 4:119–128. doi: 10.4161/viru.22913. [DOI] [PMC free article] [PubMed] [Google Scholar]
- 41.Bottinger L, Horvath SE, Kleinschroth T, Hunte C, Daum G, Pfanner N, Becker T. 2012. Phosphatidylethanolamine and cardiolipin differentially affect the stability of mitochondrial respiratory chain supercomplexes. J Mol Biol 423:677–686. doi: 10.1016/j.jmb.2012.09.001. [DOI] [PMC free article] [PubMed] [Google Scholar]
- 42.Henry SA, Kohlwein SD, Carman GM. 2012. Metabolism and regulation of glycerolipids in the yeast Saccharomyces cerevisiae. Genetics 190:317–349. doi: 10.1534/genetics.111.130286. [DOI] [PMC free article] [PubMed] [Google Scholar]
- 43.Roncero C. 2002. The genetic complexity of chitin synthesis in fungi. Curr Genet 41:367–378. doi: 10.1007/s00294-002-0318-7. [DOI] [PubMed] [Google Scholar]
- 44.Chen T, Jackson JW, Tams RN, Davis SE, Sparer TE, Reynolds TB. 2019. Exposure of Candida albicans beta (1,3)-glucan is promoted by activation of the Cek1 pathway. PLoS Genet 15:e1007892. doi: 10.1371/journal.pgen.1007892. [DOI] [PMC free article] [PubMed] [Google Scholar]
- 45.Chen T, Wagner AS, Tams RN, Eyer JE, Kauffman SJ, Gann ER, Fernandez EJ, Reynolds TB. 2019. Lrg1 regulates beta (1,3)-glucan masking in Candida albicans through the Cek1 MAP kinase pathway. mBio 10:e01767-19. doi: 10.1128/mBio.01767-19. [DOI] [PMC free article] [PubMed] [Google Scholar]
- 46.Westman J, Moran G, Mogavero S, Hube B, Grinstein S. 2018. Candida albicans hyphal expansion causes phagosomal membrane damage and luminal alkalinization. mBio 9:e01226-18. doi: 10.1128/mBio.01226-18. [DOI] [PMC free article] [PubMed] [Google Scholar]
- 47.Jones LA, Sudbery PE. 2010. Spitzenkorper, exocyst, and polarisome components in Candida albicans hyphae show different patterns of localization and have distinct dynamic properties. Eukaryot Cell 9:1455–1465. doi: 10.1128/EC.00109-10. [DOI] [PMC free article] [PubMed] [Google Scholar]
- 48.Crampin H, Finley K, Gerami-Nejad M, Court H, Gale C, Berman J, Sudbery P. 2005. Candida albicans hyphae have a Spitzenkorper that is distinct from the polarisome found in yeast and pseudohyphae. J Cell Sci 118:2935–2947. doi: 10.1242/jcs.02414. [DOI] [PubMed] [Google Scholar]
- 49.Saville SP, Lazzell AL, Monteagudo C, Lopez-Ribot JL. 2003. Engineered control of cell morphology in vivo reveals distinct roles for yeast and filamentous forms of Candida albicans during infection. Eukaryot Cell 2:1053–1060. doi: 10.1128/ec.2.5.1053-1060.2003. [DOI] [PMC free article] [PubMed] [Google Scholar]
- 50.Styles C. 2002. How to set up a yeast laboratory. Methods Enzymol 350:42–71. doi: 10.1016/s0076-6879(02)50955-1. [DOI] [PubMed] [Google Scholar]
- 51.Gillum AM, Tsay EY, Kirsch DR. 1984. Isolation of the Candida albicans gene for orotidine-5’-phosphate decarboxylase by complementation of S. cerevisiae ura3 and E. coli pyrF mutations. Mol Gen Genet 198:179–182. doi: 10.1007/bf00328721. [DOI] [PubMed] [Google Scholar]
- 52.Raschke WC, Baird S, Ralph P, Nakoinz I. 1978. Functional macrophage cell lines transformed by Abelson leukemia virus. Cell 15:261–267. doi: 10.1016/0092-8674(78)90101-0. [DOI] [PubMed] [Google Scholar]
- 53.Reuss O, Vik A, Kolter R, Morschhauser J. 2004. The SAT1 flipper, an optimized tool for gene disruption in Candida albicans. Gene 341:119–127. doi: 10.1016/j.gene.2004.06.021. [DOI] [PubMed] [Google Scholar]
- 54.Hasim S, Hussin NA, Alomar F, Bidasee KR, Nickerson KW, Wilson MA. 2014. A glutathione-independent glyoxalase of the DJ-1 superfamily plays an important role in managing metabolically generated methylglyoxal in Candida albicans. J Biol Chem 289:1662–1674. doi: 10.1074/jbc.M113.505784. [DOI] [PMC free article] [PubMed] [Google Scholar]
- 55.Dobin A, Davis CA, Schlesinger F, Drenkow J, Zaleski C, Jha S, Batut P, Chaisson M, Gingeras TR. 2013. STAR: ultrafast universal RNA-seq aligner. Bioinformatics 29:15–21. doi: 10.1093/bioinformatics/bts635. [DOI] [PMC free article] [PubMed] [Google Scholar]
- 56.Anders S, Pyl PT, Huber W. 2015. HTSeq–a Python framework to work with high-throughput sequencing data. Bioinformatics 31:166–169. doi: 10.1093/bioinformatics/btu638. [DOI] [PMC free article] [PubMed] [Google Scholar]
- 57.Kanehisa M, Goto S. 2000. KEGG: kyoto encyclopedia of genes and genomes. Nucleic Acids Res 28:27–30. doi: 10.1093/nar/28.1.27. [DOI] [PMC free article] [PubMed] [Google Scholar]
- 58.Schindelin J, Rueden CT, Hiner MC, Eliceiri KW. 2015. The ImageJ ecosystem: an open platform for biomedical image analysis. Mol Reprod Dev 82:518–529. doi: 10.1002/mrd.22489. [DOI] [PMC free article] [PubMed] [Google Scholar]
Associated Data
This section collects any data citations, data availability statements, or supplementary materials included in this article.
Supplementary Materials
Data Availability Statement
Sequence data have been deposited in NCBI under BioProject accession number PRJNA556202. In addition, scripts for analyzing RNA sequencing data have been deposited at GitHub (https://github.com/Reynolds-Lab-UtK/Tams_et_al_2019).