Abstract
Objectives:
Genetic variants in metabolic signaling pathways may interact with lifestyle factors, such as dietary fatty acids, influencing postmenopausal colorectal cancer (CRC) risk, but these interrelated pathways are not fully understood.
Methods:
In this study, we examined 54 single-nucleotide polymorphisms (SNPs) in genes related to insulin-like growth factor-I/insulin traits and their signaling pathways and lifestyle factors in relation to post-menopausal CRC, using data from 6,539 postmenopausal women in the Women’s Health Initiative Harmonized and Imputed Genome-Wide Association Studies. By employing a 2-stage random survival forest analysis, we evaluated the SNPs and lifestyle factors by ranking them according to their predictive value and accuracy for CRC.
Results:
We identified 4 SNPs (IRS1 rs1801123, IRS1 rs1801278, AKT2 rs3730256, and AKT2 rs7247515) and 2 lifestyle factors (age and % calories from saturated fatty acids [SFA]) as the top 6 most influential predictors for CRC risk. We further examined interactive effects of those factors on cancer risk. In the individual SNP analysis, no significant association was observed, but the combination of the 4 SNPs, age, and % calories from SFA (≥ 11% per day) significantly increased the risk of CRC in a gene and lifestyle dose-dependent manner.
Conclusions:
Our findings provide insight into gene–lifestyle interactions and will enable researchers to focus on individuals with risk genotypes to promote intervention strategies. Our study suggests the careful use of data on potential genetic targets in clinical trials for cancer prevention to reduce the risk for CRC in postmenopausal women.
Keywords: random survival forest, IGF-I/insulin, related genetic variant, obesity, colorectal cancer, postmenopausal women
Introduction
Colorectal cancer (CRC) is the third most commonly occurring cancer and the third leading cause of cancer death in women of the United States1. Incidence and death rates for CRC increase with age. Approximately 90% of new cases and deaths occur in people of age 50 and older1. About 35% of the susceptibility to CRC is attributed to genetic factors, while the remaining 65% is attributed to non-modifiable and modifiable environmental factors such as age (particularly, 40 to 69 years), obesity, high fat diet, smoking, alcohol, and Type II diabetes (T2DM)2–5. The effect of the obesity-related lifestyle factors on CRC risk may be mediated by insulin-like growth factor-I (IGF-I)/insulin pathway. The IGF-I/insulin resistance (IR) axis has been associated with CRC in multiple studies6,7. Higher levels of total and/or free bioactive IGF-I and lower levels of IGF-binding protein 3 (IGFBP3) have been associated with increased risk of CRC in both pre- and post-menopausal women6,7. In postmenopausal women, IR, reflecting compensatory high levels of insulin and glucose, is positively associated with CRC7,8.
High IGF-I levels and IR (characterized by hyperinsulinemia and hyperglycemia) contribute to overexpression of IGF/insulin receptors. The overexpression leads to the enhanced anabolic state necessary for cell proliferation, differentiation, and anti-apoptosis, via deregulating or overactivating multiple downstream cellular signaling cascades, including insulin receptor substrate-1 (IRS1) and the phosphatidylinositol 3-kinase (PI3K)/protein kinase B (Akt) pathway9,10. The IRS1 and PI3K/Akt pathway are overexpressed in CRC patients11. Thus, high IGF-I levels and IR, through overexpression of relevant receptors and abnormal multiple cell-signaling pathways, may exert their effects on carcinogenesis.
Considering the associations of the IGF-I/IR traits and their signaling pathways with CRC risk, the genetic variants that may influence levels of IGF-I and insulin and aberrant signaling cascades are possibly associated with CRC risk. However, population-based epidemiologic studies of these genetic variants (e.g., single-nucleotide polymorphisms [SNPs]) and CRC risk have yielded inconsistent findings9,12–17. These conflicts are possibly due to different sets of covariates (e.g., in women, whether to account for menopausal status or different combinations of hormone therapy administered), lack of interactions with lifestyle factors, and different races/ethnicities. Further, few studies have examined those IGF-I/IR-related genetic variants and the risk of CRC in postmenopausal women, a population highly susceptible to CRC.
Behavioral factors may interact with genetic factors and jointly influence CRC susceptibility. In postmenopausal women, besides obesity18, an unhealthy, unbalanced diet could be a potential risk factor for CRC. In particular, high intake of calories from saturated fatty acids (SFA) could increase CRC risk5,19, which could be mediated via the IGF-I/IR axis. Few studies have examined the association between obesity-related factors and CRC risk, which is affected by IGF-I/IR genetic variants17,20; although the genetic variants have a minimal or modest effect on the obesity–CRC relationship, it suggests that the genetic variants related to IGF-I/insulin traits and signaling pathways interact with obesity-related lifestyle factors and jointly influence CRC susceptibility.
Gene-behavior interaction is a critical area in molecular genetic cancer epidemiology and has been studied with various statistical methods. In this prospective study among postmenopausal women of non-Hispanic white origin, we examined 54 SNPs in genes related to the IGF-I/insulin traits and signaling pathways and selected 22 demographic and lifestyle factors. We evaluated the genetic variants and lifestyle factors by ranking them according to their predictive value and accuracy for CRC. We then assessed the effect of interaction between the most influential genetic variants and lifestyle factors on predicting CRC risk. We used a machine learning method, 2-stage random survival forest (RSF) analysis. The recently developed RSF tool is a non-parametric tree-based ensemble learning method and accounts for the non-linear effects of variables that may not be handled in a regression model21,22. This also allows for high-order interactions among variables and has produced accurate predictions21. This method, thus may provide a way to resolve the conflicting findings in previous studies of genes and behaviors. By applying the 2-stage RSF approach, we tested the hypothesis that the most dominant genetic and behavioral factors identified through the RSF analysis interact reciprocally to predict CRC risk. We further evaluated a gene and behavior dose-response relationship and estimated the combined effect of those variables on CRC risk.
Methods
Study population
The study included data from 6,539 participants enrolled in the Women’s Health Initiative (WHI) Harmonized and Imputed Genome-Wide Association Studies (GWAS) data, which contributes a joint imputation and harmonization effort for GWAS within the WHI Clinical Trials and Observational Studies. Details of the studies’ rationale and design have been described elsewhere23,24. Briefly, WHI study participants were recruited from more than 40 clinical centers nationwide from October 1, 1993 through December 31, 1998. Eligible women were 50–79 years old, postmenopausal, expected to live near the clinical centers for at least 3 years after enrollment, and able to provide written consent. For the study purpose, we initially included 10,703 of those women who reported their race or ethnicity as non-Hispanic white (Fig. S1). Of those, we excluded 488 women who had been followed up for less than 1 year or had been diagnosed with any cancer at enrollment. We also excluded women (n = 1,794) who had diabetes mellitus at enrollment or later. To minimize possible confounding due to shared environment, we excluded another 1,093 women whose SNP data indicated they were duplicated or related to others in the dataset. Of the 7,328 women remaining, we finally excluded 789 women for whom the information on covariates was unavailable, resulting in a total of 6,539 women (90% of the eligible 7,328). The participants had been followed up through August 29, 2014 (a median follow-up period of 16 years). Of these, 472 (7% of 6,539) developed CRC after enrollment. This study was approved by the institutional review boards of each participating clinical center of the WHI and the University of California, Los Angeles.
Data collection and cancer outcome variables
Data had been collected using standardized written protocols with periodic quality assurance performed by the WHI coordinating center. At baseline, participants completed self-administered questionnaires regarding the following characteristics: demographic factors (age, education, marital status, and family income); lifestyle factors (depressive symptoms, smoking, physical activity, and diet [dietary alcohol and fiber in g/day and % calories from protein, saturated fatty acids (SFA), monounsaturated fatty acids (MFA), and polyunsaturated fatty acids (PFA) per day]); comorbid conditions (hypertension ever and cardiovascular disease ever); and reproductive histories (exogenous estrogen [E] use [never vs. duration of E only; never vs. duration of E plus progestin (P)], age at menopause, and number of pregnancies). Anthropometric measurements such as height, weight, and waist and hip circumferences were measured at baseline by trained staff. Other demographic and lifestyle variables in addition to the above listed variables were initially selected for this study on the basis of a literature review for their associations with CRC. The final set to be analyzed was determined by multicollinearity testing and univariate and stepwise regression analyses.
Cancer outcomes were determined using a centralized review of medical charts, and cancer cases were coded according to the National Cancer Institute’s Surveillance, Epidemiology, and End-Results guidelines25. The outcome variables were CRC and the time to development of CRC. The time from enrollment to CRC development, censoring, or study end point was estimated as the number of days and then converted into years.
Genotyping
The WHI Harmonized and Imputed GWAS is a combination of 6 sub-studies (Hip Fracture GWAS, GARNET, WHIMS, GECCO-CYTO, GECCO-INIT, and MOPMAP) within the WHI study. Genotyping included alignment (“flipping”) to the same reference panel and imputation via the 1,000 Genomes reference panels. SNPs for harmonization were checked for pairwise concordance and for identity by descent in Plink to identify relatedness among all samples in the sub-studies. Initial quality assurance was implemented according to a standardized protocol, with 90% R-squared imputation quality scores, a missing call rate of < 2%, and a Hardy-Weinberg Equilibrium of p ≥ 10−4. Fifty-four SNPs in 9 genes (Table S1) were chosen according to the biological significance of their gene products, or whether epidemiologic and/or experimental data support an association between the gene and the levels of IGF and insulin, or between the gene and risk of cancer9,26–32. The allele frequencies of these SNPs in our population were consistent with the frequencies in a European population33.
Statistical analysis
Differences in baseline characteristics and in allele frequencies by CRC status were evaluated by using unpaired 2-sample t tests for continuous variables and chi-squared tests for categorical variables. If continuous variables were skewed or had outliers, Wilcoxon’s rank-sum test was used. The Cox proportional hazards regression model with an assumption test via a Schoenfeld residual plot and rho was conducted to obtain hazard ratios (HRs) and 95% confidence intervals (CIs) for IGFs/insulin–related SNPs (as a categorical variable of an additive model and a major-allele dominant/recessive model) and for the combined effect of the SNPs and lifestyle factors in predicting CRC.
The RSF analysis involves obtaining bootstrap samples from the original cohort and growing a tree for each bootstrapped sample on the basis of a splitting rule applied to a tree node to maximize survival differences across daughter nodes. The process is repeated numerous times (number of trees = 5,000 in this study) so that a forest of trees is created34,35. An ensemble cumulative hazard estimate for each individual was calculated from each tree and averaged over all trees, yielding a predicted cumulative incidence rate of CRC. The prediction algorithm was applied to the out-of-bag (OOB) data (37% of the original data not used for bootstrapping) to calculate the OOB concordant index (c-index), a measure of prediction performance, which is conceptually similar to the area under the receiver operating characteristic curve (AUC)34,36. The importance of each variable was determined by 2 predicted values: (1) minimal depth, where variables with a small minimal depth split the tree close to the root and are considered highly predictive and (2) variable importance (VIMP), calculated as the difference between the OOB c-indexes from the original OOB data and from the permuted OOB data, where variables with larger VIMP are the more predictive21,37.
We used a 2-stage RSF approach. In the first stage, we performed a RSF on each SNP and each lifestyle factor individually (Tables S2 and S3; Figs. S2 and S3); only those SNPs and lifestyle factors with significantly low minimal depth and high VIMP scores were selected for the second stage. During stage 2, we performed another RSF using only the SNPs and lifestyle factors identified during stage 1. This method allows us to eliminate the SNPs and lifestyle factors that may not have effects on predicting CRC, which will result in more statistical power with the correct type I error than the original RF-based analysis35. A P-value < 0.05 was considered statistically significant. R version 3.3.2 with survival, randomForestSRC, ggRandomForests, and gamlss statistical packages were used.
Results
Baseline characteristics of participants by CRC status are presented in Table 1. Women with CRC were more likely to be younger and never married, and have more than a high-school education and a greater family income. In addition, those women with CRC tended to have more depressive symptoms, consume fewer calories from protein but more calories from PFA, and to be inactive and nonsmokers. Finally, women with CRC were taller and had a higher rate of E-only use (particularly associated with longer duration of ≥ 5 years) and also a higher rate of E+P use with shorter (< 5 years) and longer (> 5–10 or 10 years) durations.
Table 1.
Characteristics of participants, stratified by colorectal cancer
| Characteristic | Controls (n = 6,067) |
Colorectal cancer cases (n = 472) |
|||
|---|---|---|---|---|---|
| n | (%) | n | (%) | ||
| Age in years, median (range) | 68 | (50 – 81) | 66 | (50 – 79)a | |
| Education | |||||
| ≤ High school | 2,261 | (37.3) | 139 | (29.4)a | |
| > High school | 3,806 | (62.7) | 333 | (70.6) | |
| Marital status | |||||
| Never married | 203 | (3.3) | 26 | (5.5)a | |
| Divorced or separated | 761 | (12.5) | 70 | (14.8) | |
| Widowed | 1,444 | (23.8) | 93 | (19.7) | |
| Presently married | 3,576 | (58.9) | 277 | (58.7) | |
| Marriage-like relationship | 83 | (1.4) | 6 | (1.3) | |
| Family income | |||||
| < $35,000 | 2,885 | (48.6) | 199 | (43.0)a | |
| ≥ $35,000 | 3,056 | (51.4) | 264 | (57.0) | |
| Depressive symptomb | |||||
| < 0.06 | 5,612 | (92.5) | 423 | (89.6)a | |
| ≥ 0.06 | 455 | (7.5) | 49 | (10.4) | |
| Dietary alcohol per day in g, median (range) | 1.03 | (0.00 – 153.60) | 1.01 | (0.00 – 148.90) | |
| Dietary fiber per day in g, median (range) | 15.06 | (0.42 – 60.58) | 14.90 | (2.81 – 43.92) | |
| % calories from protein, median (range) | 16.54 | (5.88 – 35.97) | 16.30 | (7.29 – 26.92)a | |
| % calories from SFA, median (range) | 11.20 | (2.22 – 30.80) | 11.46 | (2.81 – 26.77) | |
| % calories from MFA, median (range) | 12.67 | (2.16 – 27.64) | 12.89 | (3.25 – 23.04) | |
| % calories from PFA, median (range) | 6.49 | (1.73 – 21.77) | 6.74 | (2.36 – 19.30)a | |
| Hypertension ever | |||||
| No | 4,237 | (69.8) | 320 | (67.8) | |
| Yes | 1,830 | (30.2) | 152 | (32.2) | |
| Cardiovascular disease ever | |||||
| No | 5,186 | (85.5) | 395 | (83.7) | |
| Yes | 881 | (14.5) | 77 | (16.3) | |
| METs·hour·week−1c, median (range) | 2.75 | (0.00 – 142.30) | 0.00 | (0.00 – 92.17)a | |
| How many cigarettes per day | |||||
| Non smoker | 5,788 | (95.4) | 464 | (98.3)a | |
| Less than 1 pack | 127 | (2.1) | 4 | (0.8) | |
| 1 or more pack | 152 | (2.5) | 4 | (0.8) | |
| Height in cm, median (range) | 161.5 | (146.2 – 177.0) | 162.0 | (146.2 – 177.0)a | |
| BMI in kg/m2, median (range) | 27.11 | (15.42 – 58.49) | 26.77 | (18.59 – 49.50) | |
| Waist-to-hip ratio, median (range) | 0.81 | (0.44 – 1.26) | 0.81 | (0.65 – 1.18) | |
| Age at menopause in years, median (range) | 50 | (21 – 71) | 50 | (25 – 60) | |
| Number of pregnancies, median (range) | 3 | (0 – 8) | 3 | (0 – 8) | |
| Exogenous estrogen use (E only use) | |||||
| Never use | 4,370 | (72.0) | 307 | (65.0)a | |
| < 5 Years | 913 | (15.0) | 69 | (14.6) | |
| 5 to < 10 Years | 275 | (4.5) | 38 | (8.1) | |
| 10 + Years | 509 | (8.4) | 58 | (12.3) | |
| Total duration of E only use, in years, median (range) | 4.00 | (0.25 – 42.00) | 6.00 | (0.25 – 39.00) | |
| Exogenous estrogen use (E + P use) | |||||
| Never use | 5,184 | (85.4) | 349 | (73.9)a | |
| < 5 Years | 547 | (9.0) | 70 | (14.8) | |
| 5 to < 10 Years | 178 | (2.9) | 26 | (5.5) | |
| 10 + Years | 158 | (2.6) | 27 | (5.7) | |
| Total duration of E + P use, in years, median (range) | 3.00 | (0.25 – 30.08) | 4.00 | (0.25 – 40.50)a | |
BMI, body mass index; E, estrogen; E+P, estrogen + progestin; MET, metabolic equivalent; MFA, monounsaturated fatty acids; PFA, polyunsaturated fatty acids; SFA, saturated fatty acids.
P < 0.05, chi-squared or Wilcoxon’s rank-sum test.
Depression scales were estimated using a short form of the Center for Epidemiologic Studies Depression Scale and categorized with 0.06 as the cutoff to detect depressive disorders.
Physical activity was estimated from recreational physical activity combining walking and mild, moderate, and strenuous physical activity; each activity was assigned a MET value corresponding to intensity, and the total MET·hours·week−1 was calculated by multiplying the MET level for the activity by the hours exercised per week and summing the values for all activities50.
The most influential variables for CRC risk identified via minimal depth and VIMP
In the 2-stage RSF analysis, we used 2 predictive measures to identify the most influential variables (i.e., having the highest predictive value and lowest prediction error). After selecting the most influential SNPs and lifestyle factors at the first stage (Tables S2 and S3; Figs. S2 and S3), we then performed the second RSF on the 4 SNPs and 7 lifestyle factors selected to predict CRC risk. The minimal depth and VIMP measures use different criteria, so we expected the variable ranking to be somewhat different. We thus estimated those values in Table 2 and compared the 2 measures by using Fig. 1A. In the plot, variables were sorted via the minimal depth’s rank on the y axis, and points are colored and shaped by the sign of VIMP. The red dashed line indicates where the 2 measures were in agreement: the farther the points were from the line, the more the discrepancy between measures. In the Fig. 1A, both minimal depth and VIMP indicate that the following 4 genetic variants and 2 lifestyle factors are strong predictive markers of CRC risk: IRS1 rs1801123, IRS1 rs1801278, AKT2 rs3730256, and AKT2 rs7247515, age, and % calories from SFA per day.
Table 2.
Prediction of variables by using random survival forest model
| Variablea | Predictive valueb | VIMP |
|---|---|---|
| IRS1 rs1801278 | 1.2406 | 0.3030 |
| AKT2 rs7247515 | 1.3628 | 0.2335 |
| IRS1 rs1801123 | 2.0276 | 0.1741 |
| AKT2 rs3730256 | 2.1780 | 0.0804 |
| Age | 2.8748 | 0.0009 |
| Height | 3.0972 | –0.0002 |
| % calories from SFA/day | 3.2312 | 0.0004 |
| % calories from MFA/day | 3.6040 | 0.0015 |
| % calories from PFA/day | 3.7308 | 0.0004 |
| Exogenous estrogen use (E + P use) | 4.4596 | 0.0003 |
| Physical activity | 7.0142 | 0.0009 |
E+P, estrogen + progestin; MFA, monounsaturated fatty acids; PFA, polyunsaturated fatty acids; SFA, saturated fatty acids; VIMP, variable of importance.
Variables are ordered by predictive value.
The predictive value of variables was assessed via minimal depth method in the nested random survival forest models. A lower value is likely to have a greater influence on prediction.
Figure 1.
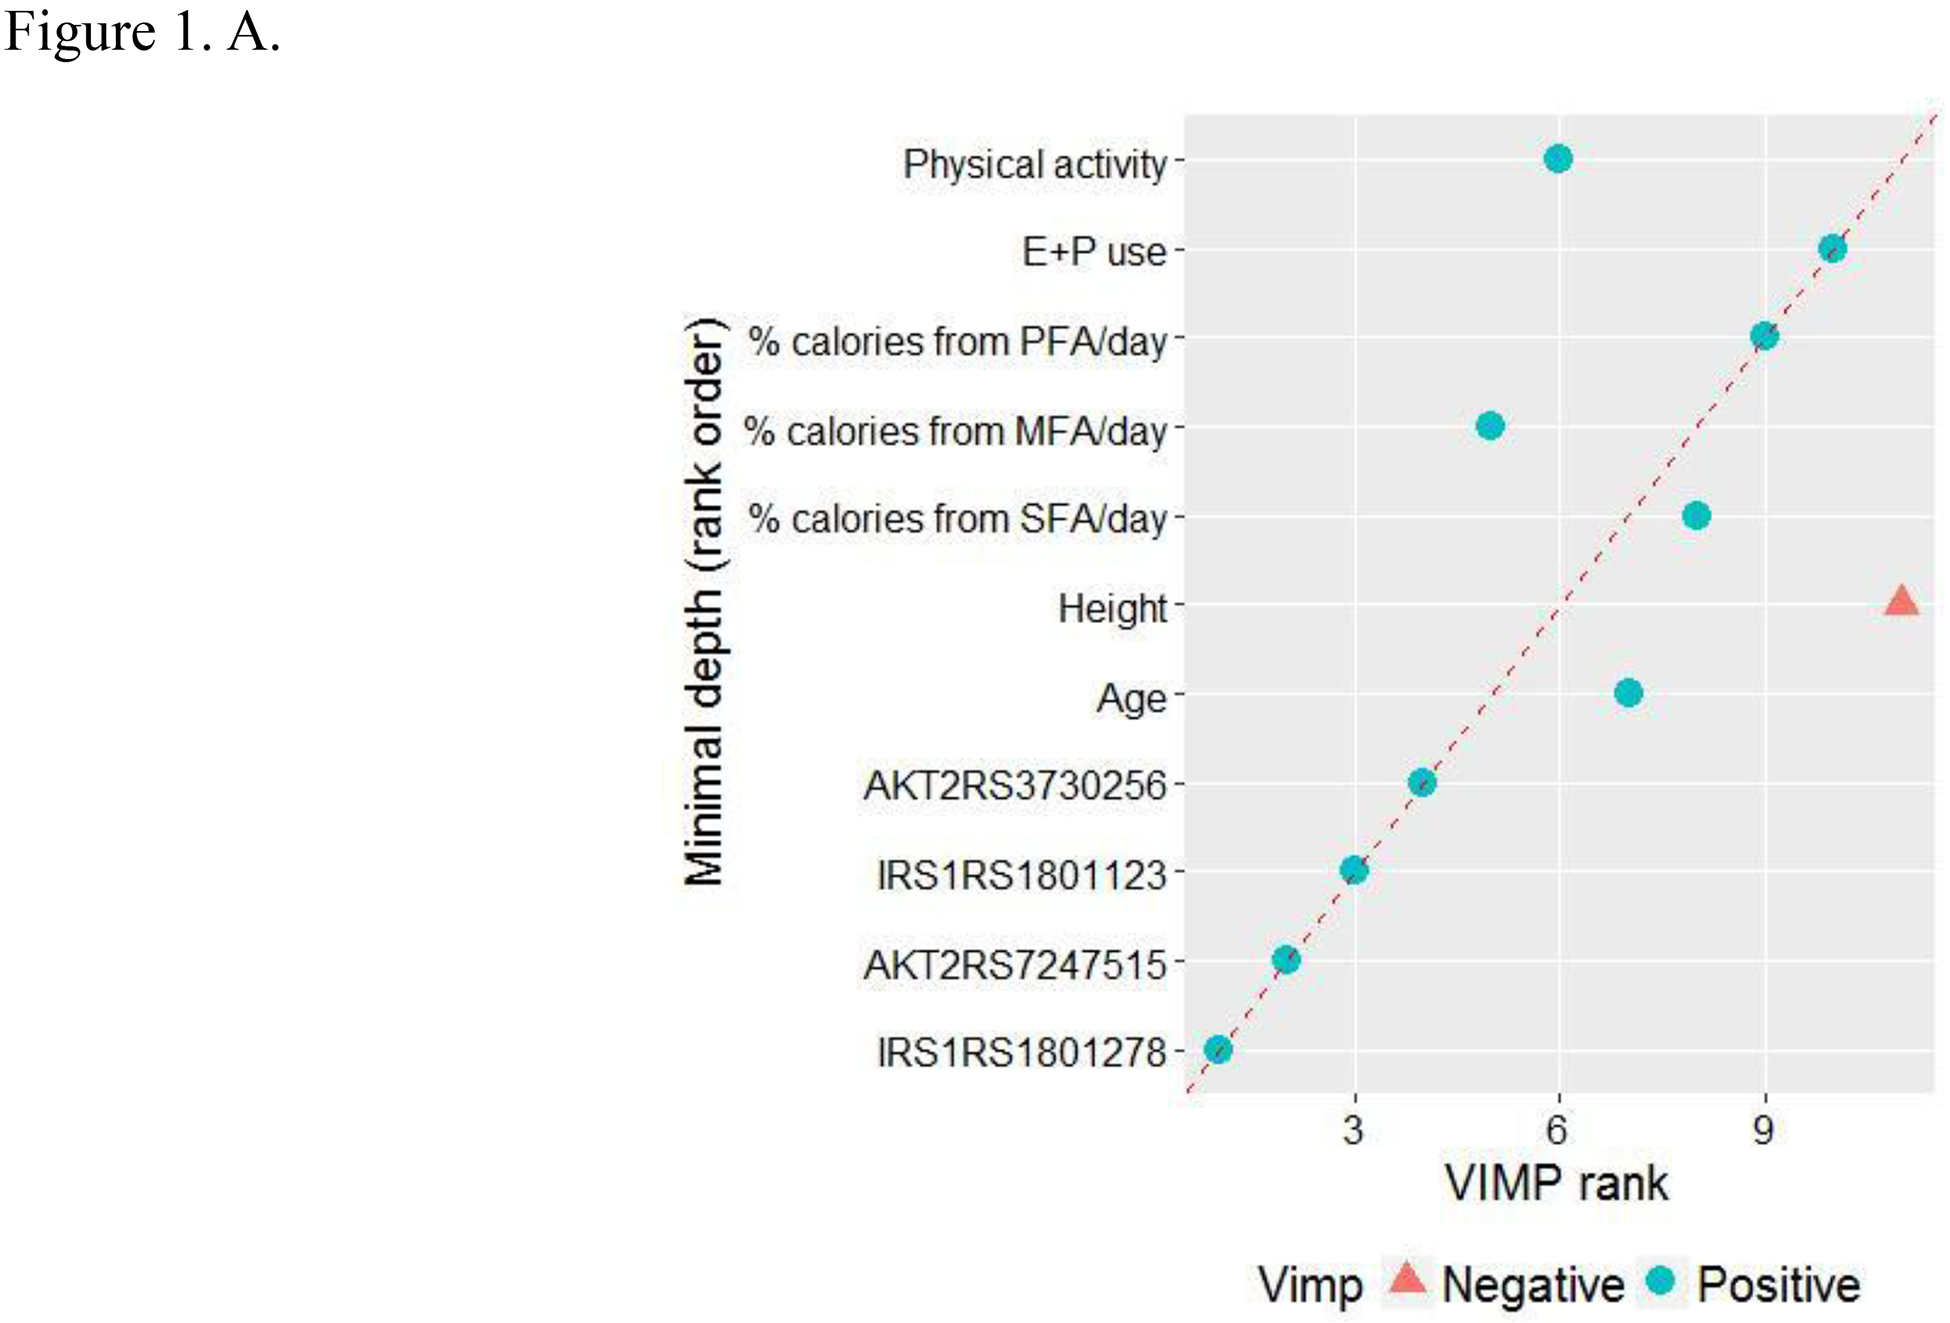
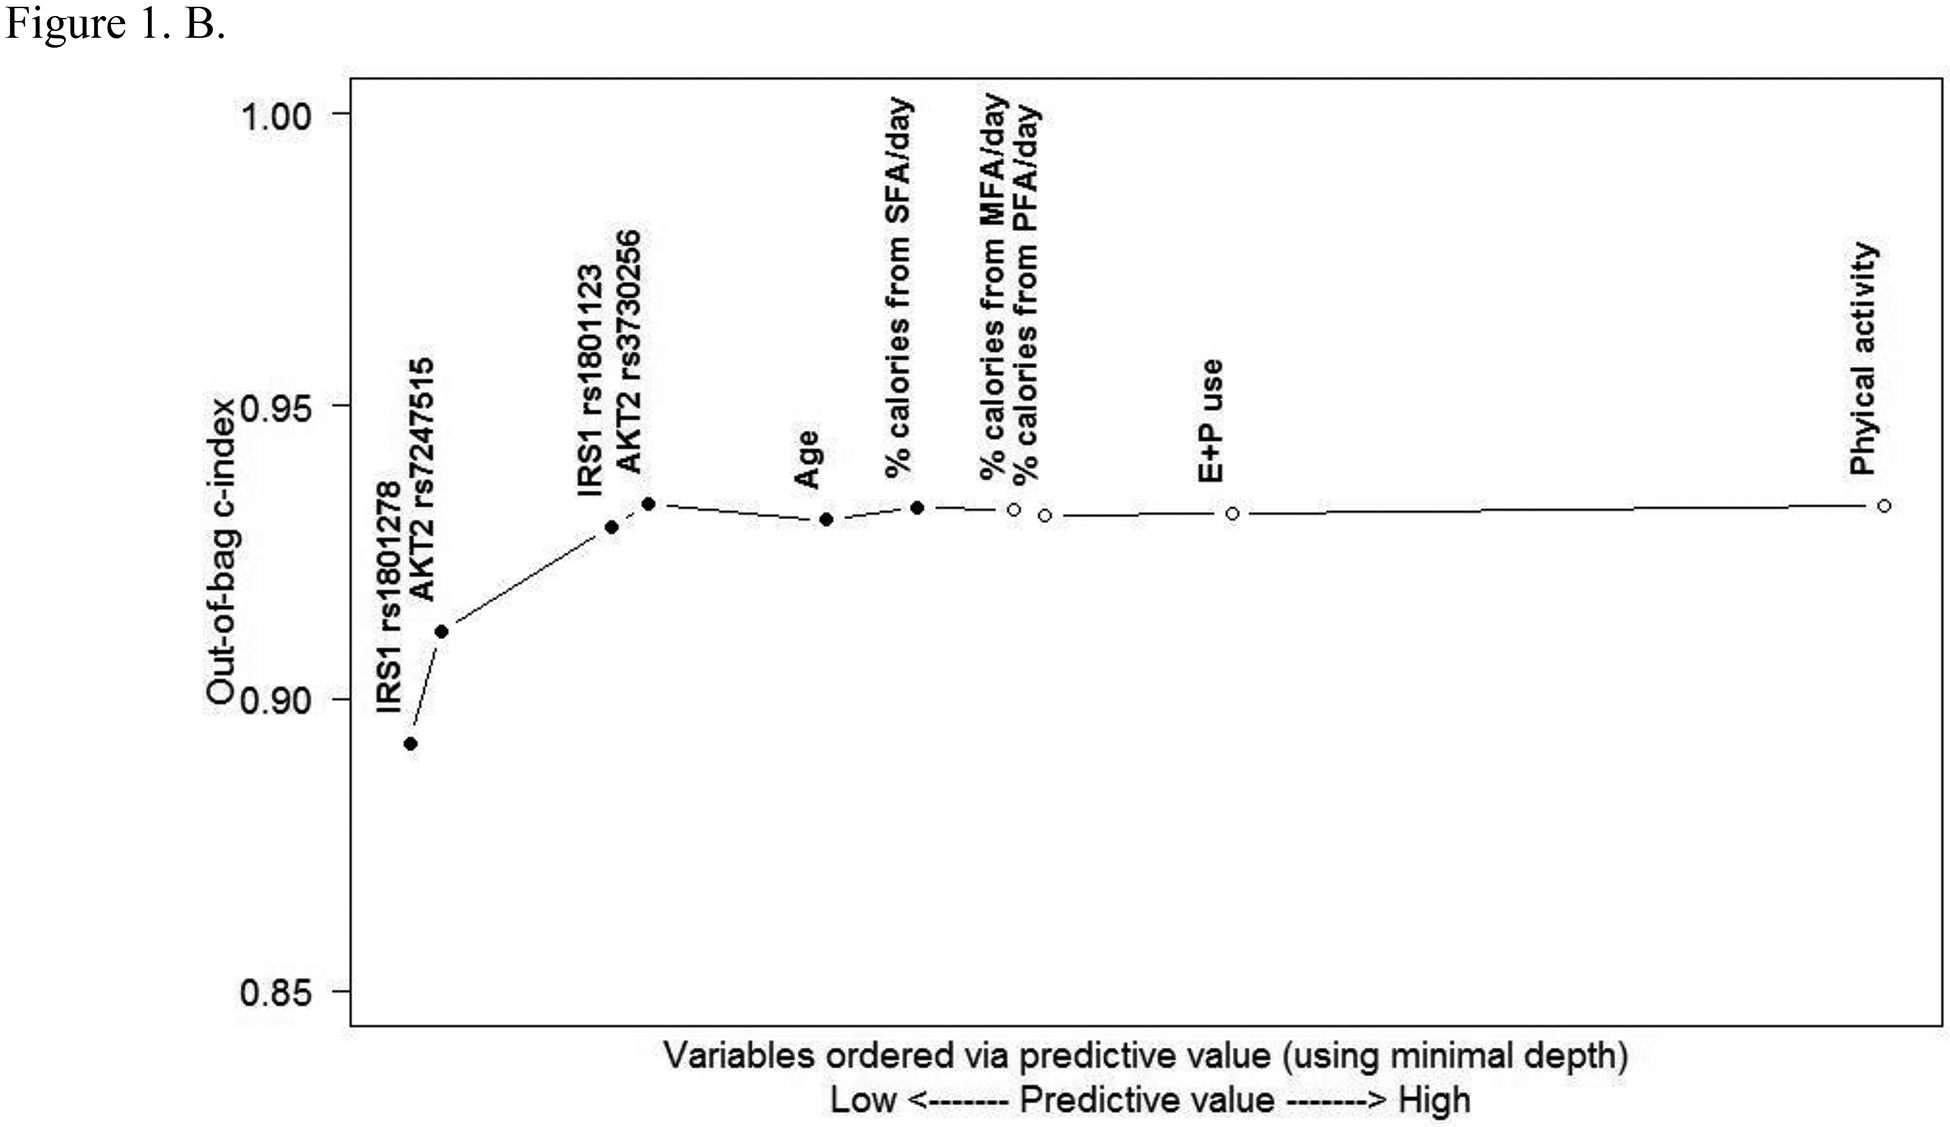
Predictive value of variables. A. Comparing minimal depth and VIMP rankings. (E+P, estrogen + progestin; MFA, monounsaturated fatty acids; PFA, polyunsaturated fatty acids; SFA, saturated fatty acids; VIMP, variable of importance) B. Out-of-bag concordance index (c-index). (Improvement in out-of-bag c-index was observed when the top 6 variables [●] were added to the model, whereas other variables [○] did not further improve the accuracy of prediction.)
The OOB c-index (Fig. 1B) for the nested RSF model orders variables according to their predictive value assessed via the minimal depth method. Results indicated that the above top 6 variables (4 SNPs and 2 lifestyle factors) improved the overall OOB c-index (i.e., AUC) and thus had complementary predictive value, while others did not add to a significant improvement of the prediction accuracy.
Cumulative incidence rate of CRC for the most influential variables and their cumulative effects on CRC risk
To account for the non-linear effects of variables on cancer risk, the predicted cumulative incidence rate of CRC for the top 6 variables were estimated based on the RSF model (Figs. 2A–F). The genotype of each SNP was analyzed as a continuous variable.
Figure 2.
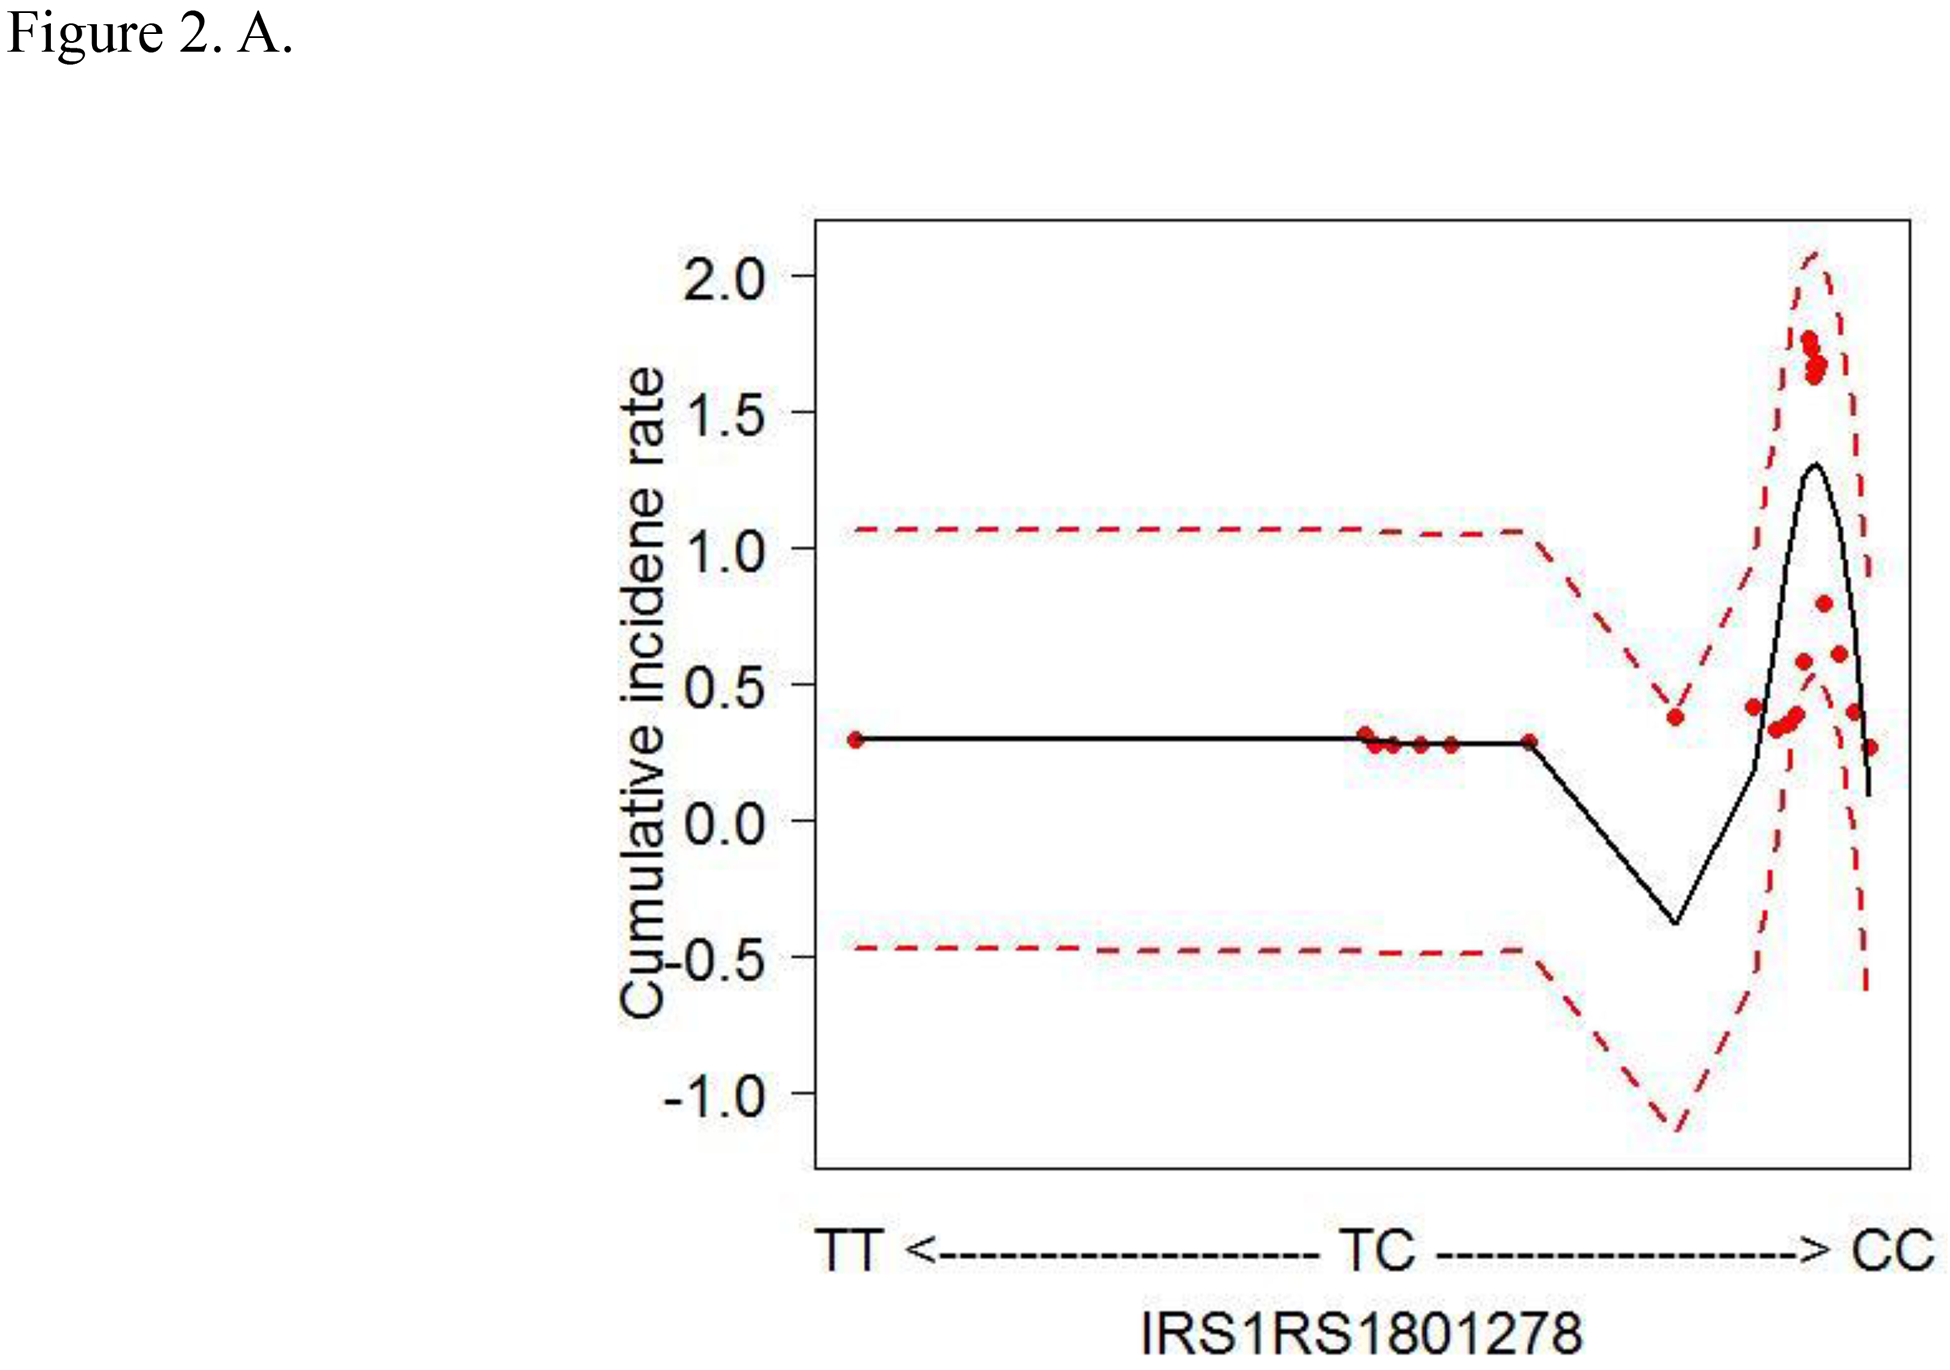
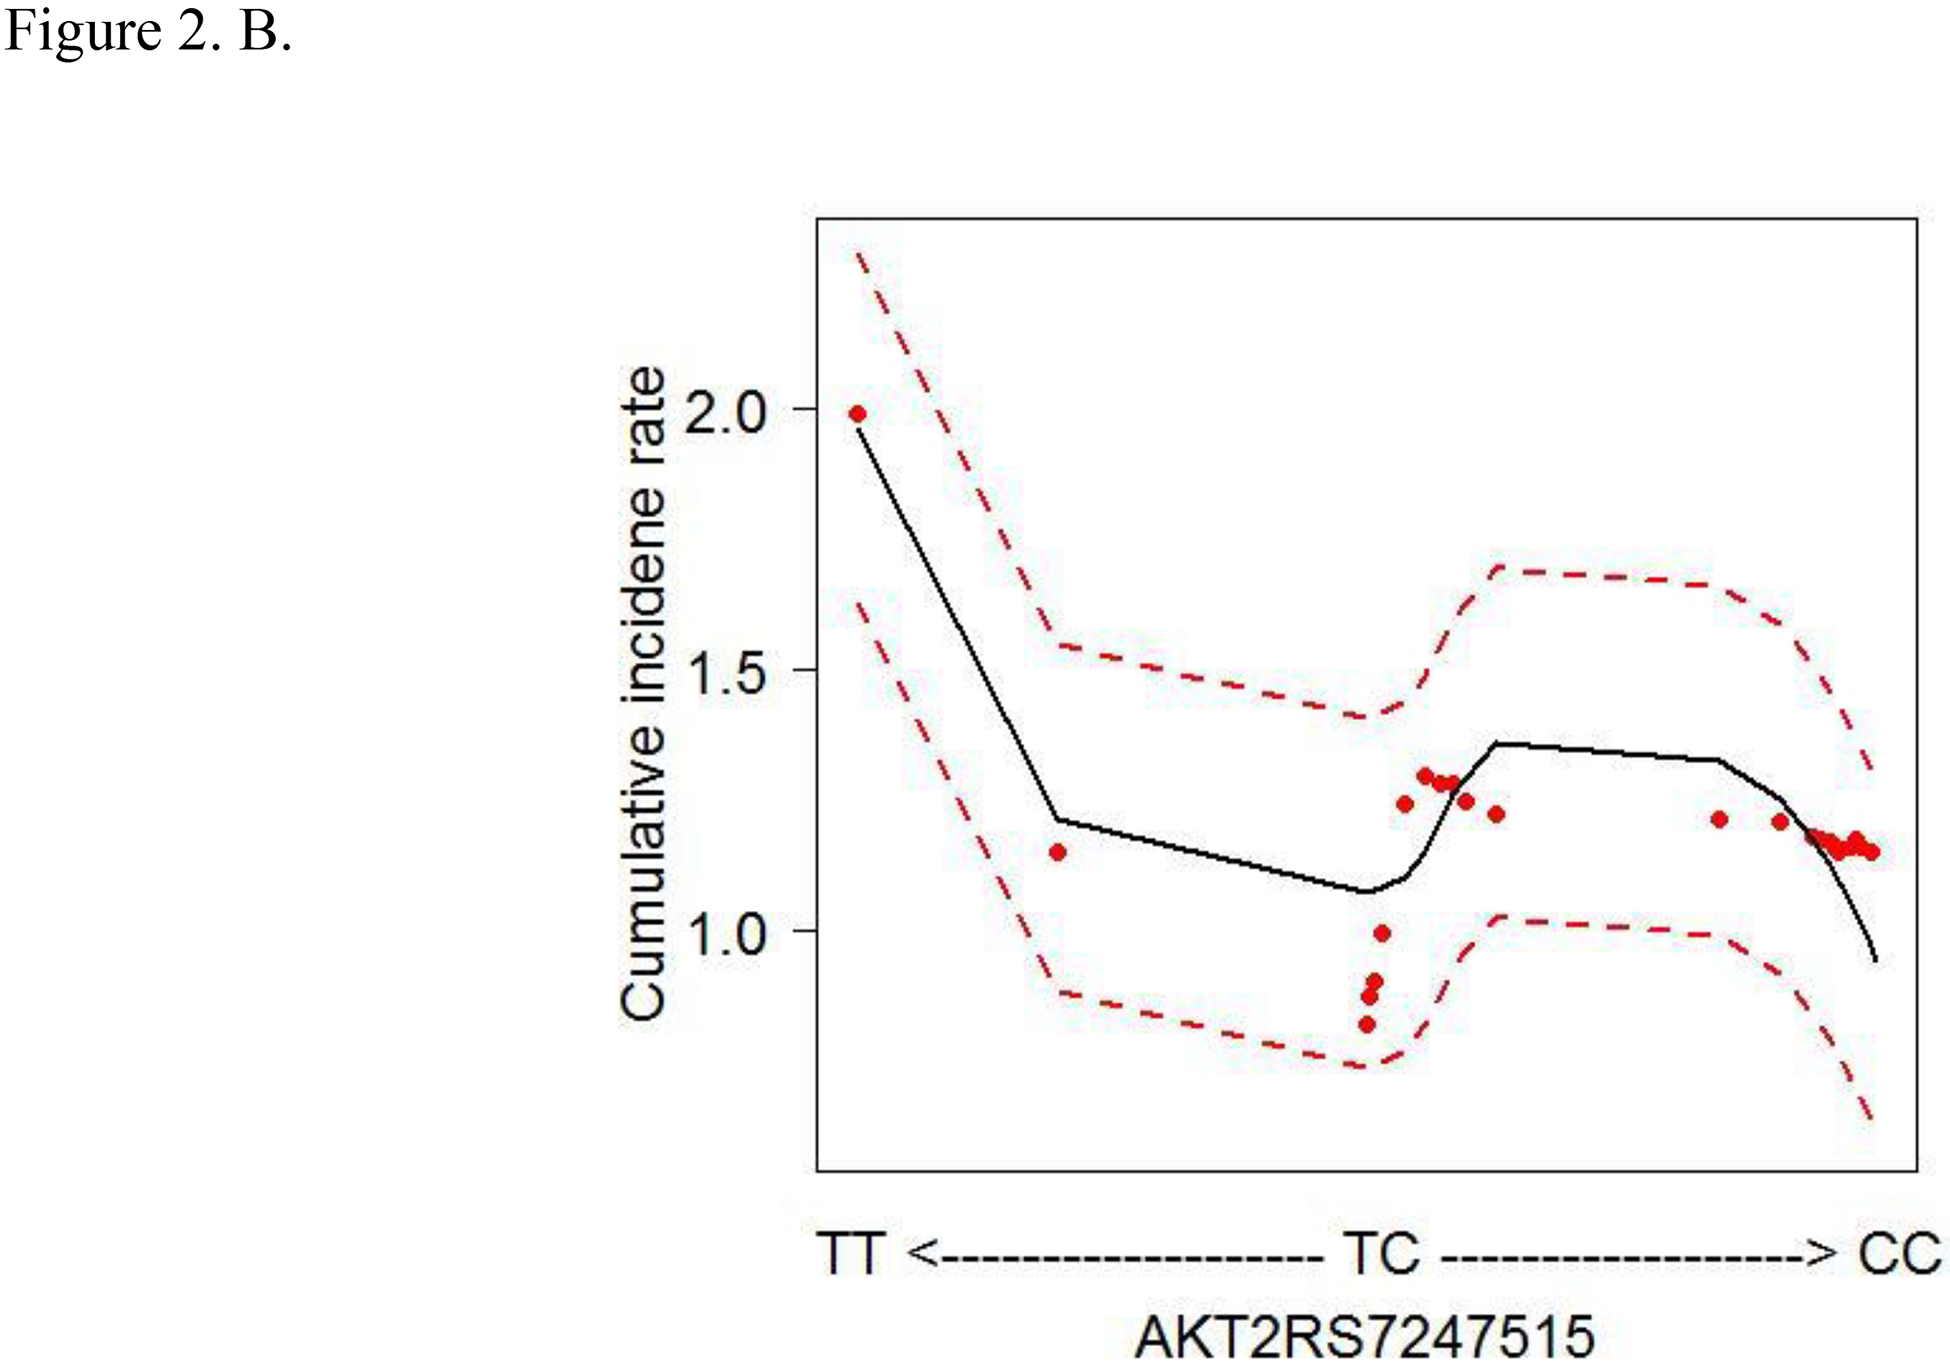
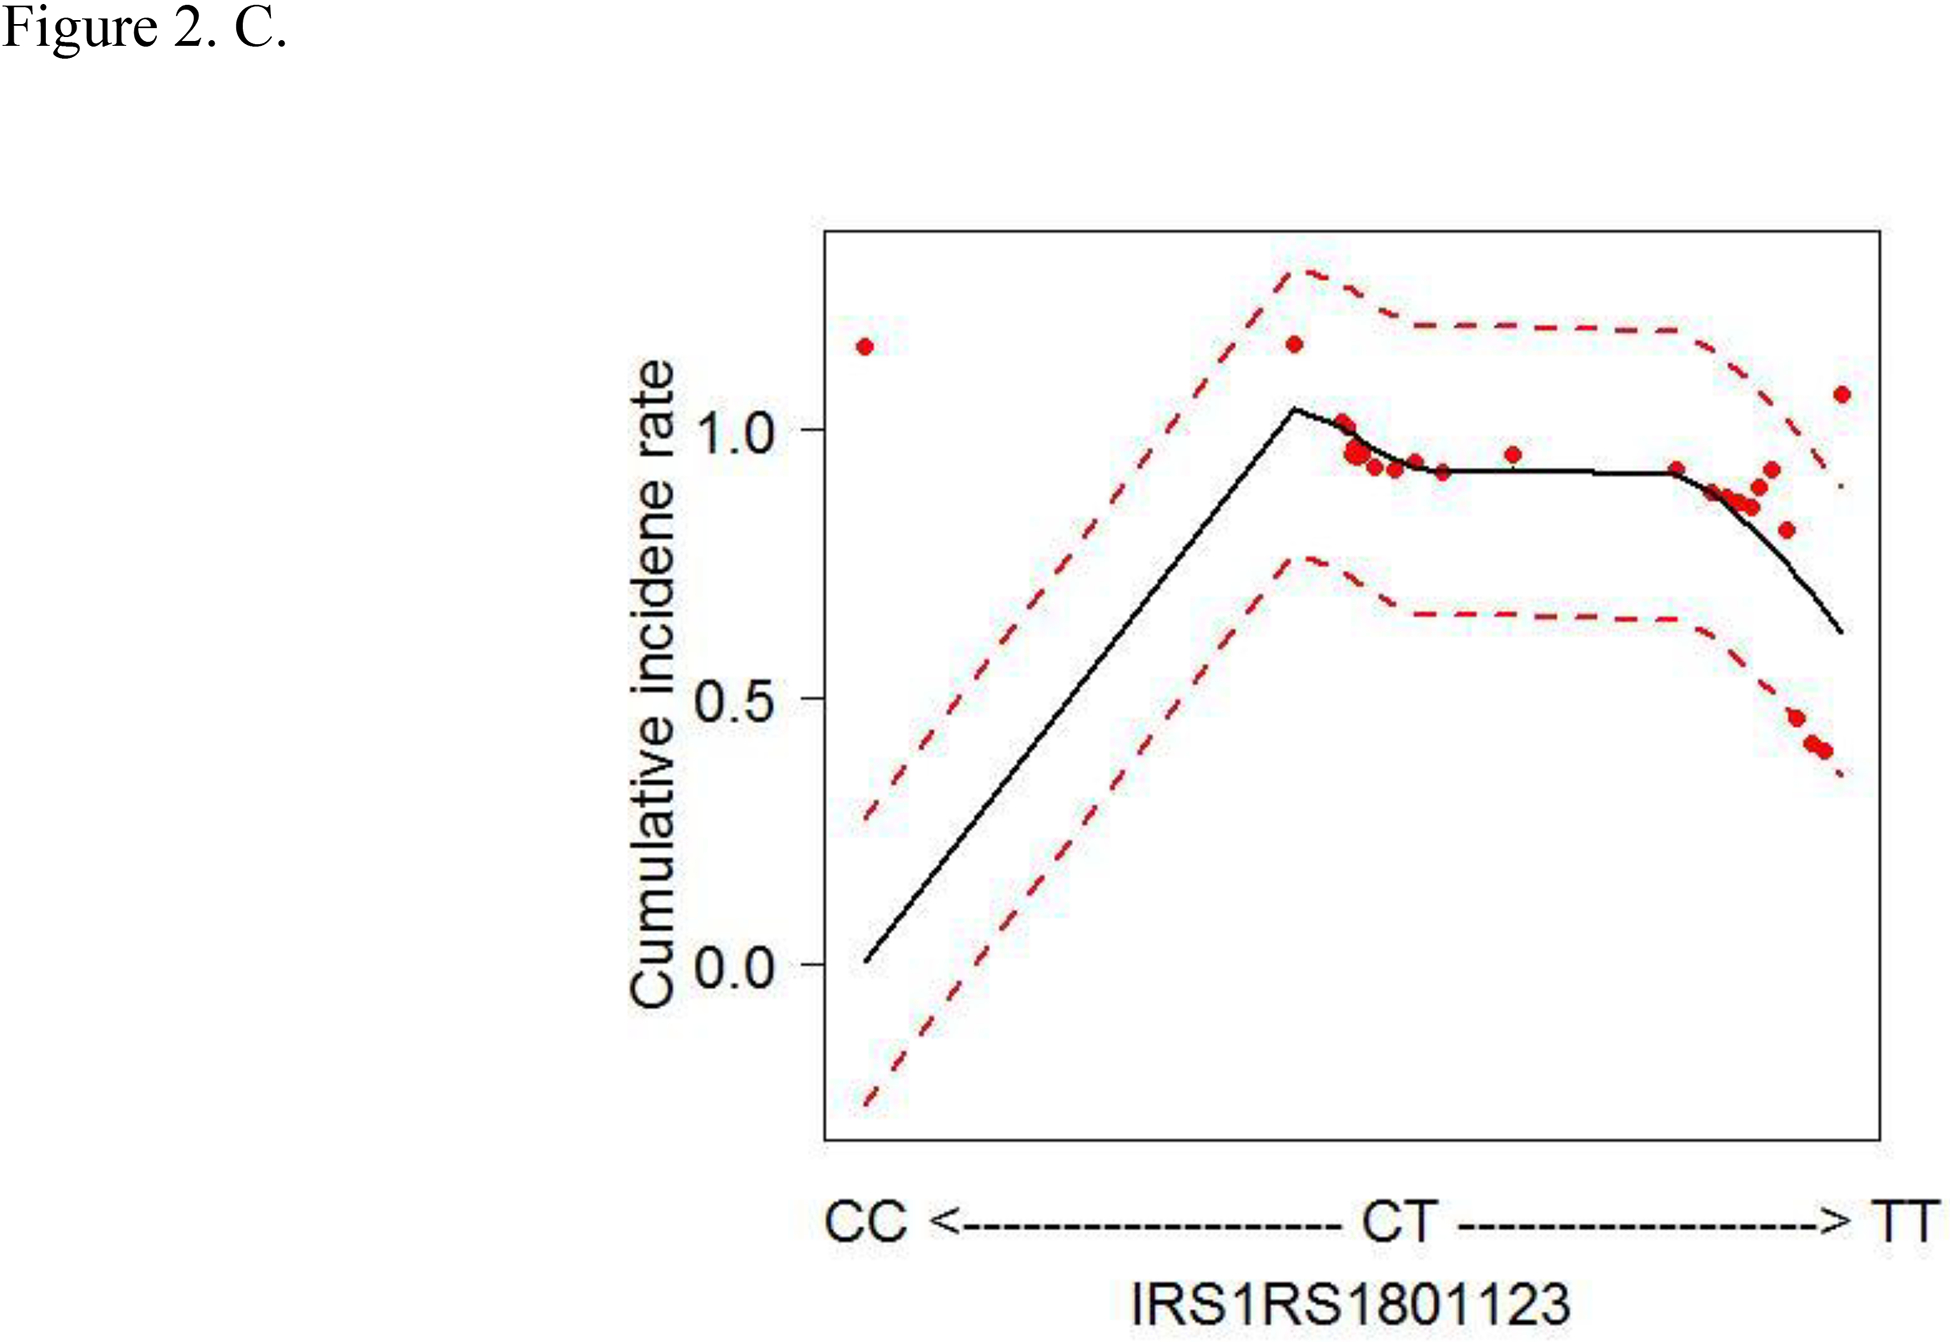
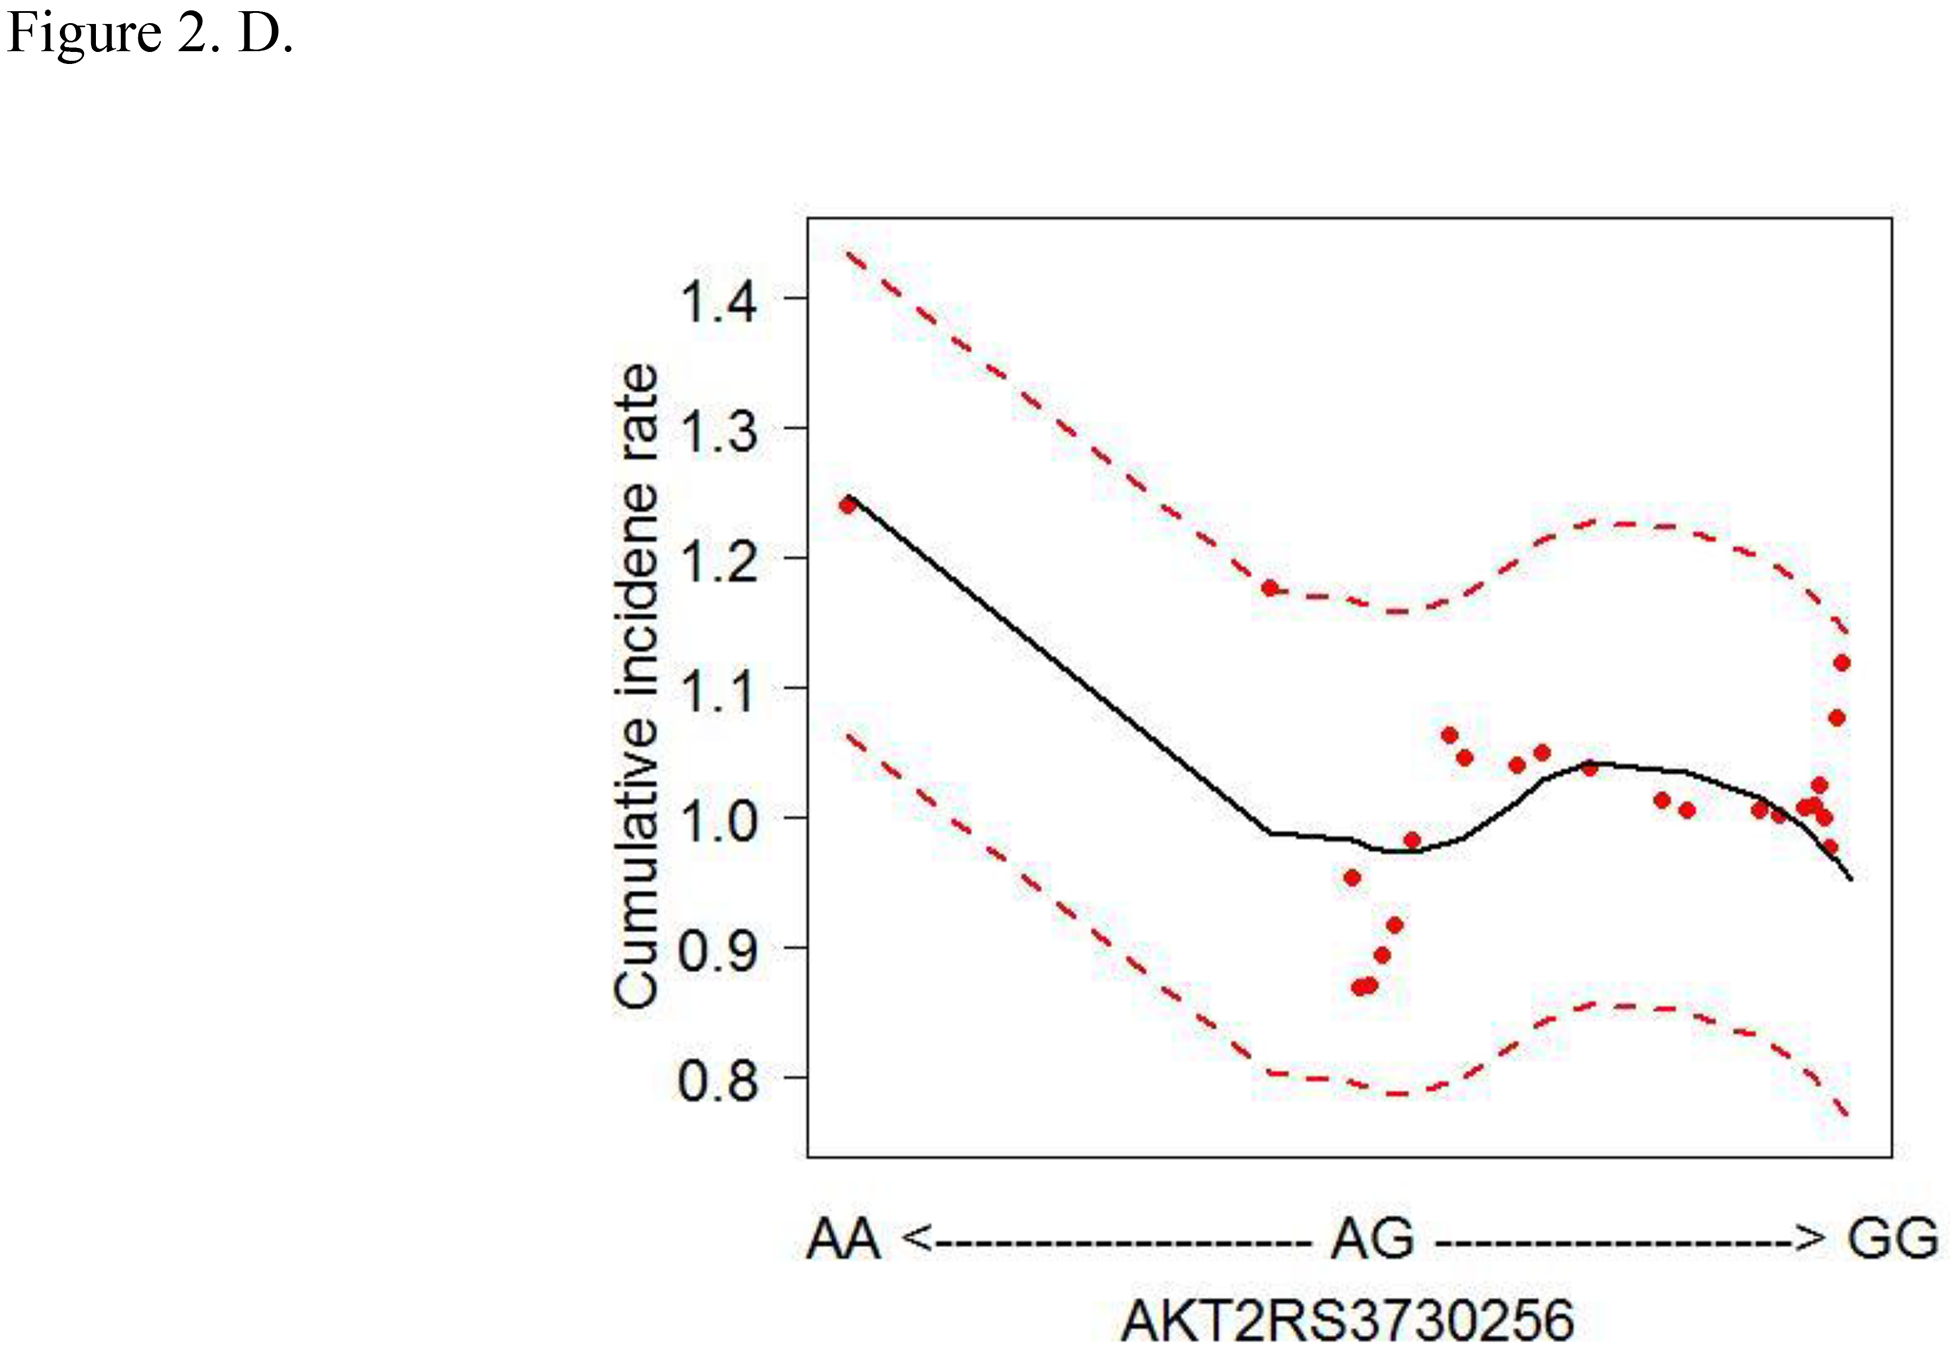
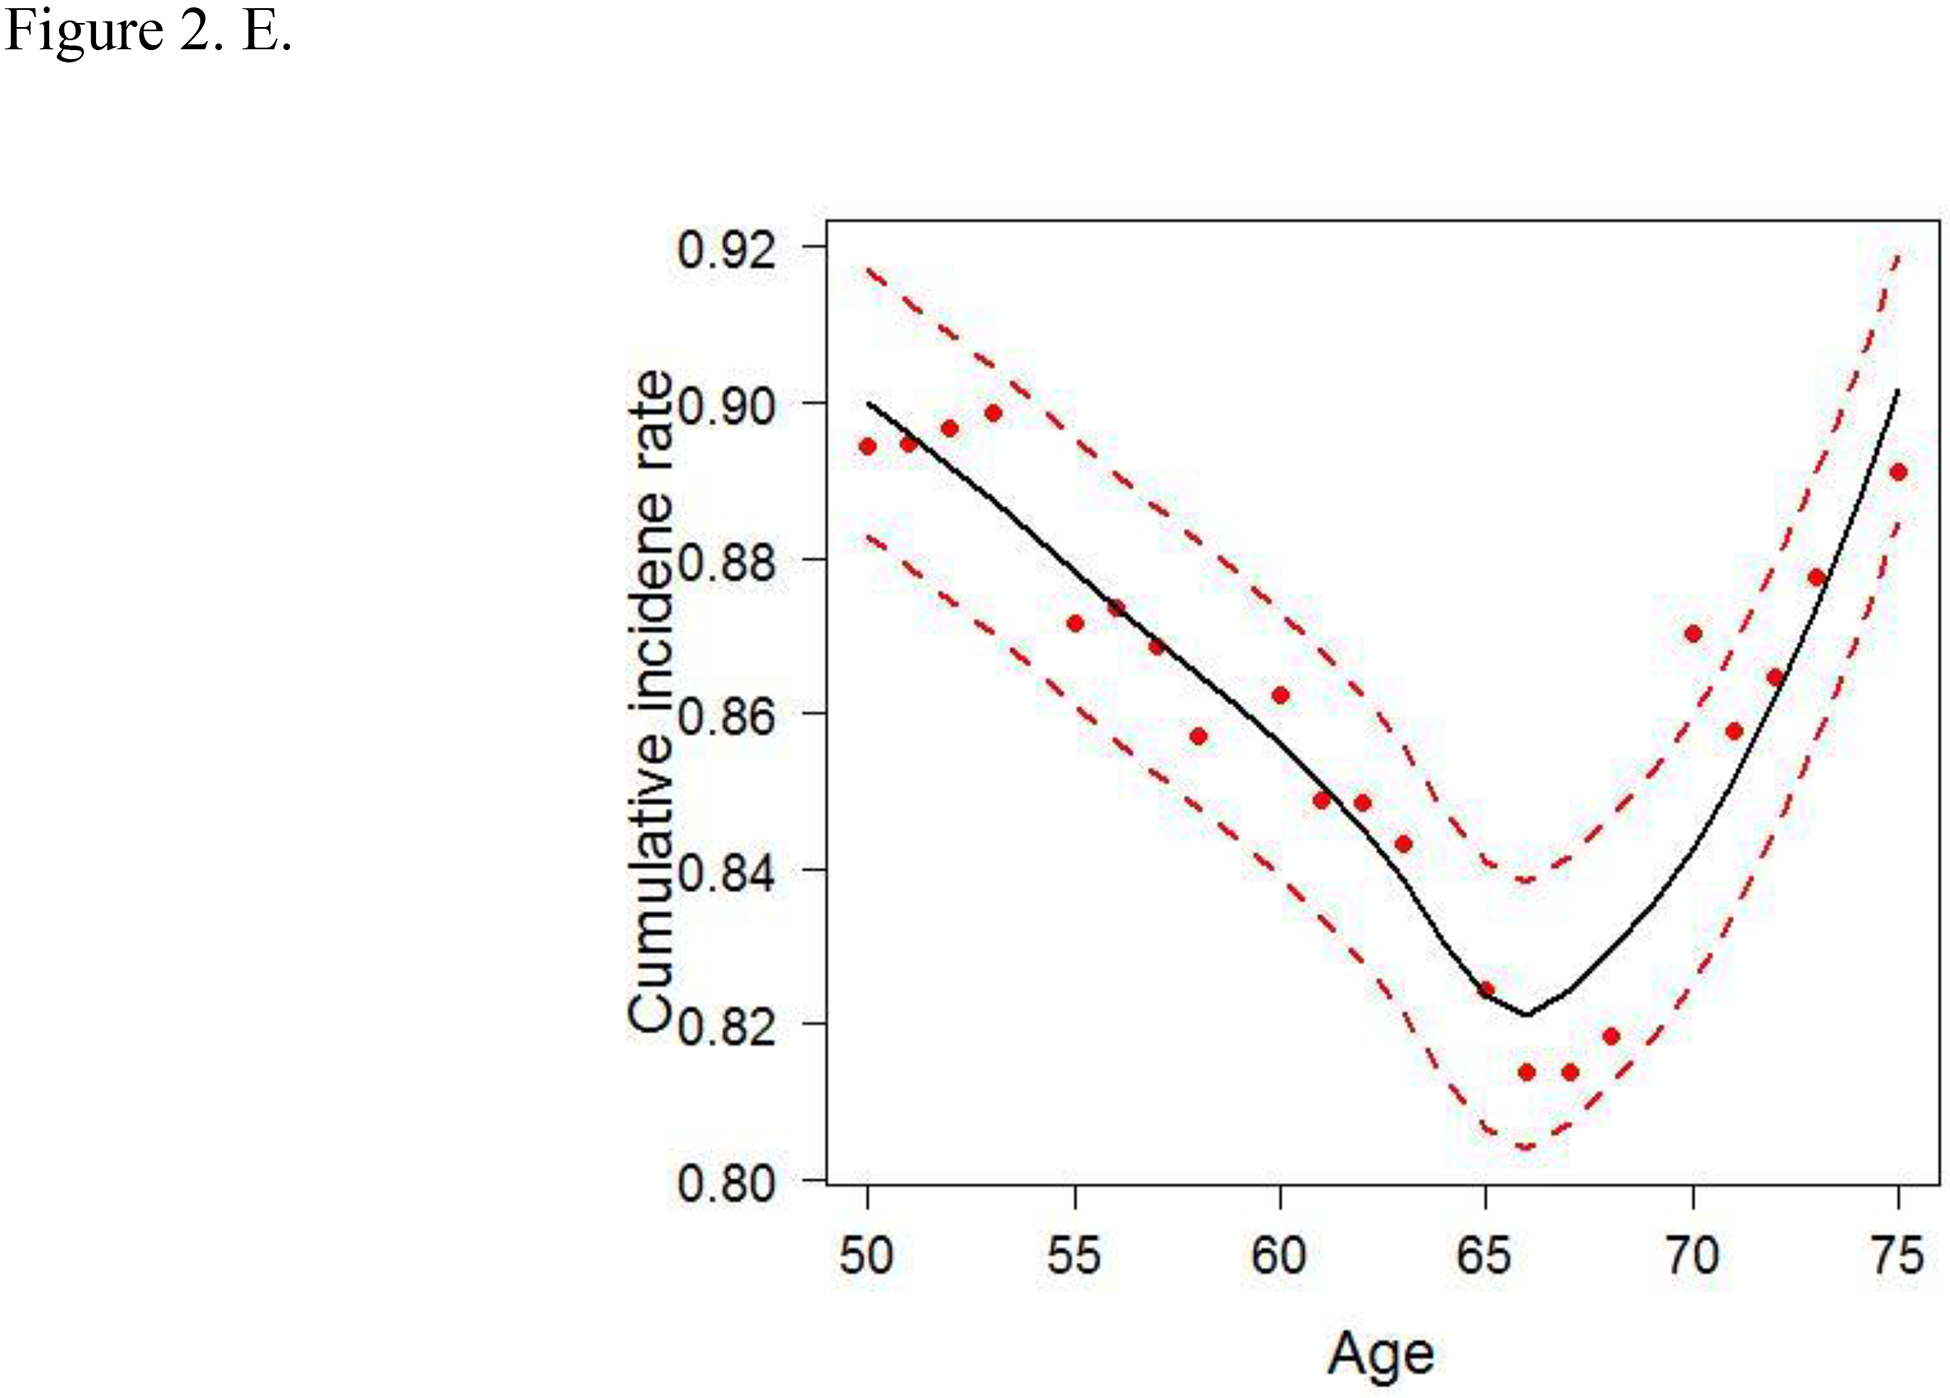
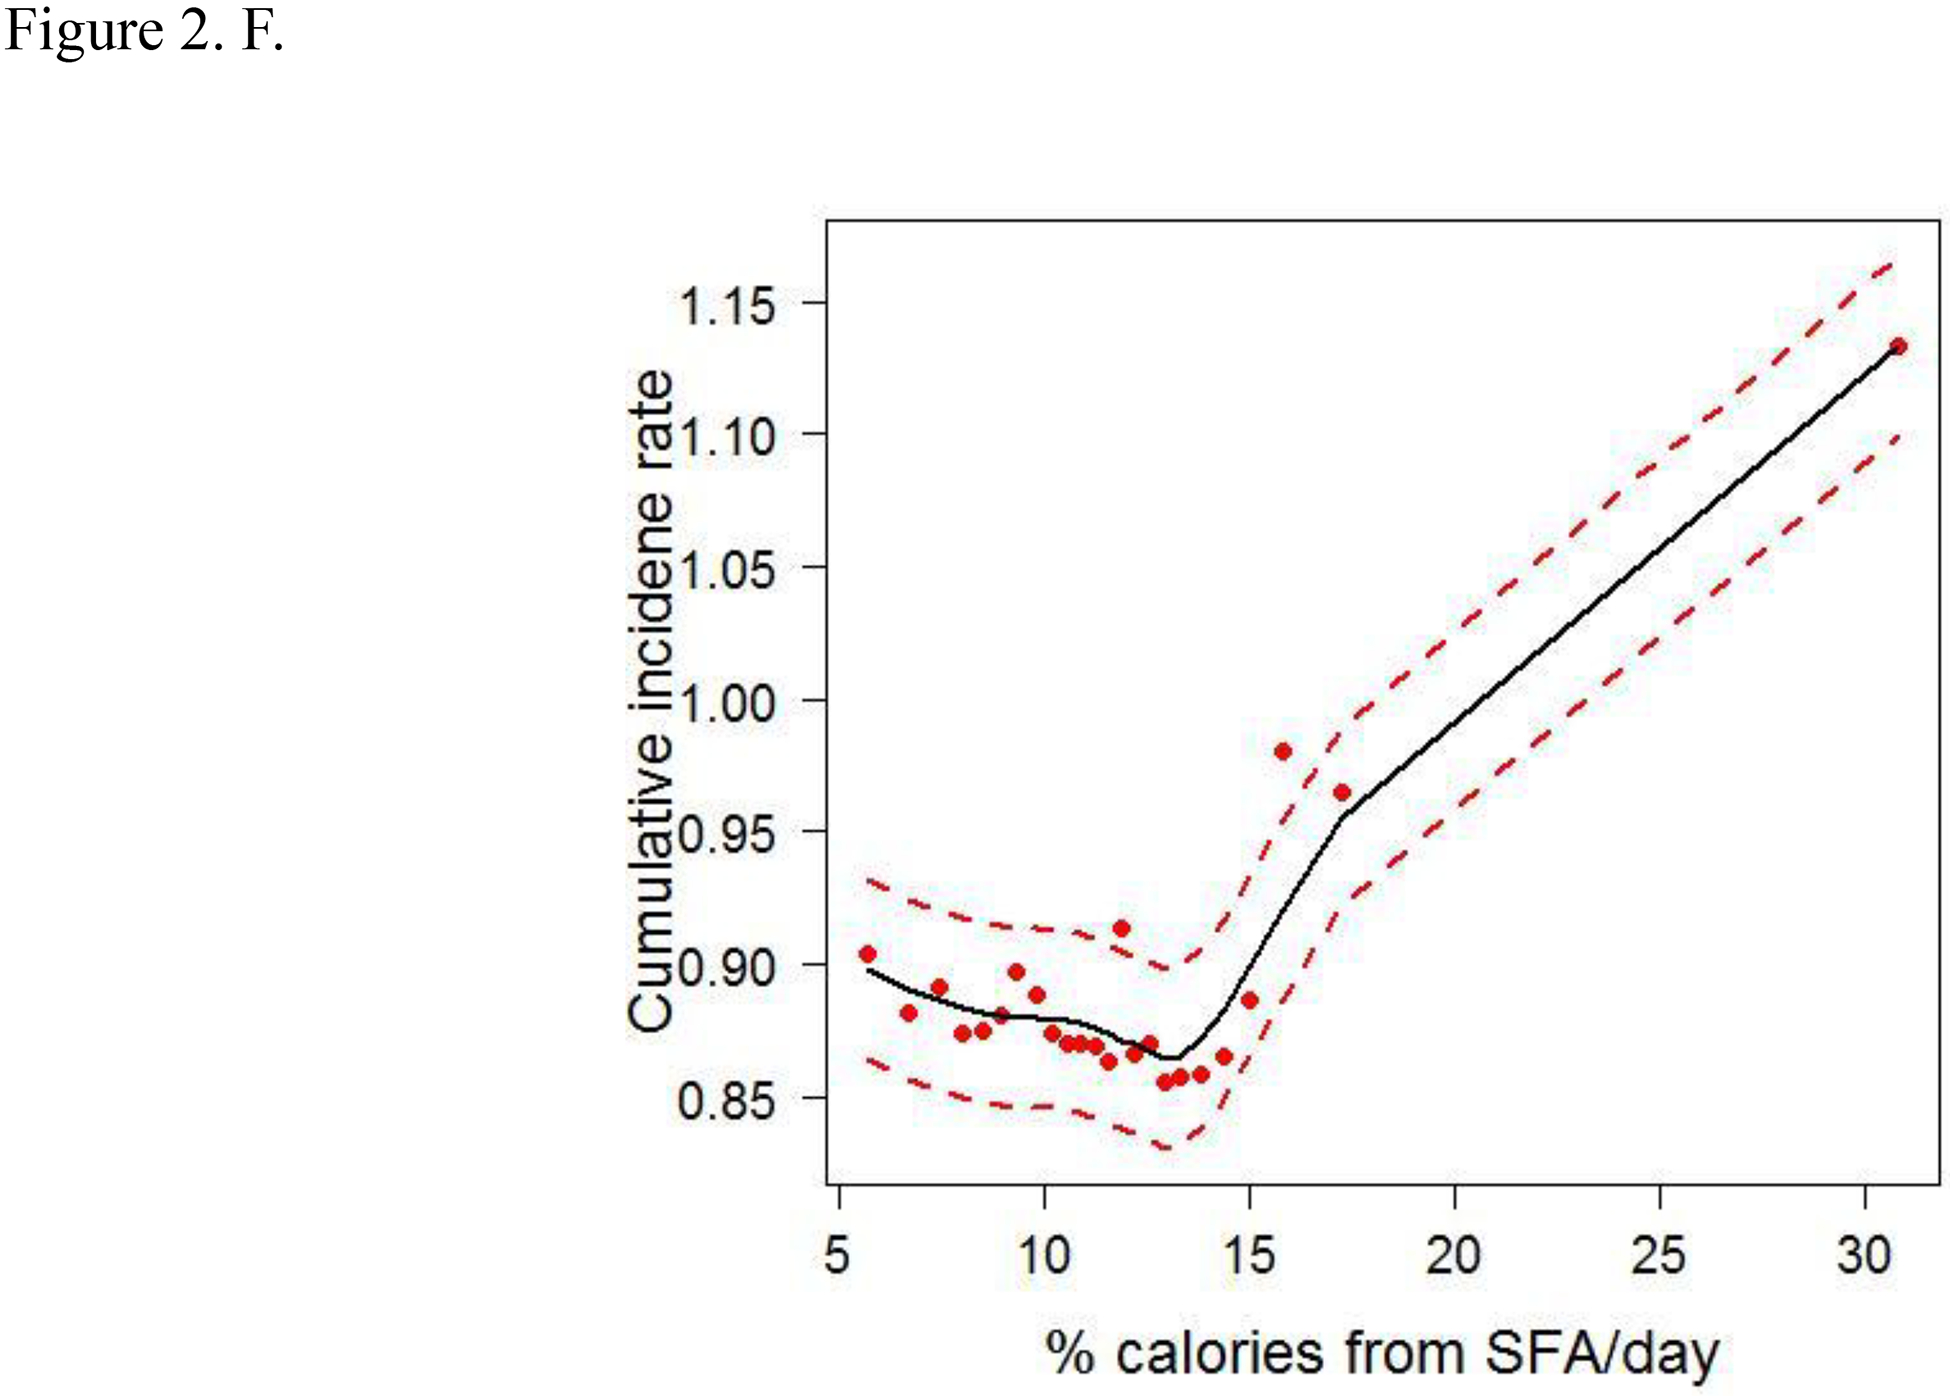
Cumulative colorectal cancer incidence rate for the 6 most influential variables based on a random survival forest analysis. (SFA, saturated fatty acids. Dashed red lines indicate 95% confidence intervals.) A. IRS1 rs1801278 B. AKT2 rs7247515 C. IRS1 rs1801123 D. AKT2 rs3730256 E. Age F. % calories from SFA/day
The cumulative effects of the 4 SNPs and 2 lifestyle factors were further calculated (Table 3). On the basis of the non-linear associations with CRC in Figs. 2A–D, the genotypes of IRS1 rs1801123 TC+TT, IRS1 rs1801278 CC, AKT2 rs3730256 AA, and AKT2 rs7247515 TT were determined as risk genotypes and analyzed as categorized variables in Table 3. Additionally, in Figs. 2E and 2F, the age and % calories from SFA had an L- or U-shaped risk for CRC, diverging from around 68 years’ age and 11% calories from SFA. We thus evaluated % calories from SFA as a categorical variable (divided via 11%) and obtained the combined effect with the 4 SNPs on cancer risk. We further stratified women by age using 68 years as a cut-off value and obtained the joint effect of age with the 4 SNPs and % calories from SFA on cancer risk.
Table 3.
Combined effect of risk genotypes of IRS1 rs1801123, IRS1 rs1801278, AKT2 rs3730256, and AKT2 rs7247515, and % calories from SFA/day on colorectal cancer risk
| Total | Age ≥ 68 years | Age < 68 years | ||||||||
|---|---|---|---|---|---|---|---|---|---|---|
| na | HRb (95% CI) | p | n | HRb (95% CI) | p | n | HRb (95% CI) | p | ||
| Risk genotypes | ||||||||||
| 1 | referent | 336 | referent | 323 | 0.83 (0.17 – 4.15) | 0.825 | ||||
| 2+ | 8.35 (3.73 – 18.69) | < 0.001 | 2,937 | 6.62 (2.11 – 20.72) | 0.001 | 2,943 | 8.47 (2.70 – 26.53) | < 0.001 | ||
| Percent calories from SFA | ||||||||||
| 0 | referent | 1,760 | referent | 1,484 | 1.24 (0.93 – 1.64) | 0.145 | ||||
| 1 | 1.33 (1.04 – 1.70) | 0.021 | 1,513 | 1.30 (0.94 – 1.79) | 0.115 | 1,782 | 1.67 (1.22 – 2.29) | 0.001 | ||
| Risk genotypes combined with percent calories from SFA | ||||||||||
| 1 | referent | 185 | referent | 157 | 1.51 (0.25 – 9.09) | 0.651 | ||||
| 2 | 4.20 (1.73 – 10.20) | 0.002 | 1,726 | 4.84 (1.19 – 19.65) | 0.027 | 1,493 | 5.76 (1.42 – 23.41) | 0.014 | ||
| 3 | 6.85 (2.79 – 16.84) | < 0.001 | 1,362 | 7.42 (1.81 – 30.43) | 0.005 | 1,616 | 9.77 (2.39 – 39.99) | 0.002 | ||
CI, confidence interval; HR, hazard ratio; SFA, saturated fatty acids. Numbers in bold face are statistically significant.
The number of risk genotypes (IRS1 rs1801123 TC + TT, IRS1 rs1801278 CC, AKT2 rs3730256 AA, and AKT2 rs7247515 TT) defined as 1 (any individual risk genotype) and 2 (2 or more risk genotypes); the number of % calories from SFA/day defined as 0 (< 11%) and 1 (≥ 11%); the number of combined risk genotypes and % calories from SFA/day defined as 1 (any individual risk genotype with low consumption of SFA/day [< 11%]), 2 (either 2 or more risk genotypes or high consumption of SFA/day [≥ 11%]), and 3 (both 2 or more risk genotypes and high consumption of SFA/day [≥ 11%]).
Multivariate regression was adjusted by age (in total analysis), education, marital status, family income, depressive symptom, dietary alcohol/day, dietary fiber/day, % calories from protein/day, % calories from saturated fatty acids/day (in risk genotype analysis), % calories from monounsaturated fatty acids/day, % calories from polyunsaturated fatty acids/day, hypertension ever, cardiovascular disease ever, physical activity, number of cigarettes/day, height, body mass index, waist-to-hip ratio, age at menopause, number of pregnancies, and exogenous (unopposed and opposed) estrogen use.
In an individual SNP analysis (Table S4) with additive and major-allele dominant and recessive models, no significant associations were found in 2 of the SNPs (IRS1 rs1801123 and AKT2 rs3730256), while the 2 other SNPs (IRS1 rs1801278 and AKT2 rs7247515) had an association with CRC. However, the combination of the 4 SNPs yielded different results, seen in Table 3, indicating a synergistic effect on CRC risk. Compared with women with any individual risk genotype, women carrying 2 or more risk genotypes had a higher risk of CRC (HR 8.35; 95% CI = 3.73 – 18.69). When stratified by age, compared with older women (≥ 68 years) with 1 risk genotype, younger women (< 68 years) with 2 or more risk genotypes had a higher risk of CRC (HR 8.47; 95% CI = 2.70 – 26.53). Consistently, younger women who consumed ≥ 11% calories from SFA had a higher CRC risk than older women who consumed < 11% calories from SFA.
Furthermore, we evaluated the combined effect of SNPs and % calories from SFA on cancer risk. Compared with women having none and only 1 of 2 factors (either 2 or more risk genotypes or ≥ 11% caloric intake from SFA), those having both factors had about 7 times and 2 times higher risk of CRC, respectively, suggesting a cumulative effect of genetic and lifestyle factors. When stratified by age, younger women with 1 and those with both factors of risk genotypes (2 or more risk genotypes) and % calories intake from SFA (≥ 11%) had a 6-fold and 10-fold increased CRC risk, respectively, compared with older women with null risk factors (i.e., 1 risk genotype and < 11% calories intake from SFA). These results indicate a gene and lifestyle dose–response relationship and a significant joint effect of age with the SNPs and % calories intake from SFA on cancer risk.
Discussion
Using the 2-stage RSF approach on data from postmenopausal women, we identified 4 genetic variants and two lifestyle factors as being the top 6 most influential predictors of CRC risk. We further examined the interaction effects of those factors on cancer risk. In the individual SNP analysis, no significant or lesser degree of association was observed, but the combination of the 4 SNPs plus age and % calories from SFA significantly and synergistically increased the risk of CRC.
IRS1 is a scaffolding protein that activates and regulates downstream cell-signaling pathways such as PI3K/Akt, leading to metabolic activity, including glucose uptake and protein synthesis, and decreased apoptosis. This pathway is a main signaling cascade in controlling the cellular process promoting carcinogenesis11,38. IRS1 and a single member of the Akt family, Akt2, are important signaling molecules related to a diabetic phenotype such as IR; at the genomic level, each is amplified in various cancers, including CRC11,39,40. The IRS1 and AKT2 genes are thus key components of this pathway, but studies of the association of their genetic variants with CRC have been limited and conflicted11,14,40–44. For example, the IRS1 rs1801278 G (C in our study) allele has higher43,44, inverse41, or no11,14 association with CRC risk. The IRS1 rs1801278 C allele in our study was identified as a risk genotype and strongly (8 times greater) associated with CRC risk. This SNP may cause a change in the tertiary structure of the IRS1 protein and change its function, with the C allele decreasing apoptosis and increasing proliferation43, but a biologic mechanism remains speculative. In addition to this SNP, 3 other of the 12 SNPs in the IRS1 and AKT2 genes in our study were identified as the top 4 most influential genetic factors. However, studies of the functional biology of these SNPs have been limited, warranting further study.
High calories intake from SFA is causally associated with CRC5,45, and the American Heart Association recommends consuming 5% to 6% of one’s daily calories from SFA46. We found that overall, women who consumed ≥ 11% calories from SFA/day had a higher risk of CRC; furthermore, in younger women, consumption of ≥ 11% calories from SFA/day caused a 1.7-times increased risk, compared with consumption of < 11% calories from SFA/day in older women.
When combined with the higher % (≥ 11%) of calories intake from SFA/day, the effects of the 4 SNPs strengthened significantly, thus suggesting a cumulative interacting effect of those genetic and lifestyle factors on CRC risk. In addition, in younger women, those factors were associated with CRC risk in a gene and lifestyle dose–dependent manner and indicate a joint effect of age and those factors on CRC risk. Interestingly, the genetic effects of those SNPs appear dominantly, whereas the lifestyle factors had a minimal to modest effect on CRC risk. We further separated the effect of SFA consumption from the genetic effect and evaluated the influence of SFA consumption on the association between risk genotypes and CRC risk (Table S5); the greater consumption of SFA/day contributes to increased CRC risk of the SNPs in overall and age-subgroup analyses. We also observed the consistent joint effect of age and those genetic and lifestyle factors on CRC risk.
The self-reported nature of the dietary intake of alcohol and fatty acids, smoking, and physical activity data limits out study’s conclusions about these variables owing to the likely prevalence of underreporting of alcohol and fatty acid intake and smoking and overreporting of physical activity, especially in obese women. Our study should be interpreted with caution because those factors were not analyzed as time dependent variables, which could bias our results. We studied on data from only non–Hispanic white postmenopausal women, so the generalizability of our findings to other populations is limited. We acknowledge that the initial statistical power for detecting gene–environment interaction was relatively low; we conducted the 2-stage RSF analysis to gain greater statistical power with the correct type I error than the original RF-based analysis. Despite these limitations, the potential impact of our findings clearly warrants further study. We used a 2-stage RSF method to identify the most predictive variables for CRC risk because the RSF provides a robust way to handle high-level interactions in variables and allows for accurate prediction. In several research areas, including molecular genetic epidemiology, this method has outperformed the traditional models by accounting for the non-linear effects of variables35,47–49. Our findings should be replicated in other studies and interpreted with caution concerning the potential for overfitting the methods employed in this study.
Conclusions
In conclusion, our study findings indicate that together, 4 SNPs in the IRS1 and AKT2 genes, ≥ 11% calories intake from SFA/day, and age were the most influential variables in predicting CRC risk. While single genetic variants may not be enough to influence that risk, they may work together and interact with lifestyle factors to synergistically increase CRC risk. Thus, our results provide insight into gene–lifestyle interactions and will allow researchers to target efforts to promote intervention strategies to women with those risk genotypes. They also suggest the need for careful use of data on potential genetic targets in pharmacotherapeutic intervention and clinical trials to reduce the risk for CRC in postmenopausal women.
Supplementary Material
Acknowledgments
Part of the data for this project was provided by The WHI program which is funded by the National Heart, Lung, and Blood Institute, National Institutes of Health, and U.S. Department of Health and Human Services through contracts HHSN268201100046C, HHSN268201100001C, HHSN268201100002C, HHSN268201100003C, HHSN268201100004C, and HHSN271201100004C. The datasets used for the analyses described in this manuscript were obtained from dbGaP at http://www.ncbi.nlm.nih.gov/sites/entrez?db=gap through dbGaP accession (phs000200.v11.p3).
Footnotes
Program Office: National Heart, Lung, and Blood Institute, Bethesda, MD: Jacques Rossouw, Shari Ludlam, Dale Burwen, Joan McGowan, Leslie Ford, and Nancy Geller.
Clinical Coordinating Center: Fred Hutchinson Cancer Research Center, Seattle, WA: Garnet Anderson, Ross Prentice, Andrea LaCroix, and Charles Kooperberg.
Investigators and Academic Centers: Brigham and Women’s Hospital, Harvard Medical School, Boston, MA: JoAnn E. Manson; MedStar Health Research Institute/Howard University, Washington, DC: Barbara V. Howard; Stanford Prevention Research Center, Stanford, CA: Marcia L. Stefanick; The Ohio State University, Columbus, OH: Rebecca Jackson; University of Arizona, Tucson/Phoenix, AZ: Cynthia A. Thomson; University at Buffalo, Buffalo, NY: Jean Wactawski-Wende; University of Florida, Gainesville/Jacksonville, FL: Marian Limacher; University of Iowa, Iowa City/Davenport, IA: Robert Wallace; University of Pittsburgh, Pittsburgh, PA: Lewis Kuller; Wake Forest University School of Medicine, Winston-Salem, NC: Sally Shumaker.
Women’s Health Initiative Memory Study: Wake Forest University School of Medicine, Winston-Salem, NC: Sally Shumaker.
The authors report no conflicts of interest.
References
- 1.American Cancer Society. Colorectal Cancer Facts & Figures 2017–2019: American Cancer Society, Inc. 2017: https://www.cancer.org/content/dam/cancer-org/research/cancer-facts-and-statistics/colorectal-cancer-facts-and-figures/colorectal-cancer-facts-and-figures-2017-2019.pdf.
- 2.Lichtenstein P, Holm NV, Verkasalo PK, et al. Environmental and heritable factors in the causation of cancer--analyses of cohorts of twins from Sweden, Denmark, and Finland. The New England journal of medicine. July 13 2000;343(2):78–85. [DOI] [PubMed] [Google Scholar]
- 3.Iwasaki M, Tanaka-Mizuno S, Kuchiba A, et al. Inclusion of a Genetic Risk Score into a Validated Risk Prediction Model for Colorectal Cancer in Japanese Men Improves Performance. Cancer Prev Res (Phila). September 2017;10(9):535–541. [DOI] [PMC free article] [PubMed] [Google Scholar]
- 4.Dashti SG, Buchanan DD, Jayasekara H, et al. Alcohol Consumption and the Risk of Colorectal Cancer for Mismatch Repair Gene Mutation Carriers. Cancer Epidemiol Biomarkers Prev. March 2017;26(3):366–375. [DOI] [PMC free article] [PubMed] [Google Scholar]
- 5.Theodoratou E, Campbell H, Tenesa A, et al. Modification of the associations between lifestyle, dietary factors and colorectal cancer risk by APC variants. Carcinogenesis. September 2008;29(9):1774–1780. [DOI] [PubMed] [Google Scholar]
- 6.Giovannucci E, Pollak MN, Platz EA, et al. A prospective study of plasma insulin-like growth factor-1 and binding protein-3 and risk of colorectal neoplasia in women. Cancer Epidemiol Biomarkers Prev. April 2000;9(4):345–349. [PubMed] [Google Scholar]
- 7.Gunter MJ, Hoover DR, Yu H, et al. Insulin, insulin-like growth factor-I, endogenous estradiol, and risk of colorectal cancer in postmenopausal women. Cancer Res. January 01 2008;68(1):329–337. [DOI] [PMC free article] [PubMed] [Google Scholar]
- 8.Kabat GC, Kim MY, Peters U, et al. A longitudinal study of the metabolic syndrome and risk of colorectal cancer in postmenopausal women. Eur J Cancer Prev. July 2012;21(4):326–332. [DOI] [PMC free article] [PubMed] [Google Scholar]
- 9.Parekh N, Guffanti G, Lin Y, Ochs-Balcom HM, Makarem N, Hayes R. Insulin receptor variants and obesity-related cancers in the Framingham Heart Study. Cancer causes & control : CCC. August 2015;26(8):1189–1195. [DOI] [PMC free article] [PubMed] [Google Scholar]
- 10.Arcidiacono B, Iiritano S, Nocera A, et al. Insulin resistance and cancer risk: an overview of the pathogenetic mechanisms. Experimental diabetes research. 2012;2012:789174. [DOI] [PMC free article] [PubMed] [Google Scholar]
- 11.Schirripa M, Zhang W, Heinemann V, et al. Single nucleotide polymorphisms in the IGF-IRS pathway are associated with outcome in mCRC patients enrolled in the FIRE-3 trial. International journal of cancer. July 15 2017;141(2):383–392. [DOI] [PMC free article] [PubMed] [Google Scholar]
- 12.Pechlivanis S, Pardini B, Bermejo JL, et al. Insulin pathway related genes and risk of colorectal cancer: INSR promoter polymorphism shows a protective effect. Endocr Relat Cancer. September 2007;14(3):733–740. [DOI] [PubMed] [Google Scholar]
- 13.Slattery ML, Samowitz W, Hoffman M, Ma KN, Levin TR, Neuhausen S. Aspirin, NSAIDs, and colorectal cancer: possible involvement in an insulin-related pathway. Cancer Epidemiol Biomarkers Prev. April 2004;13(4):538–545. [PubMed] [Google Scholar]
- 14.Mahmoudi T, Majidzadeh AK, Karimi K, et al. An exon variant in insulin receptor gene is associated with susceptibility to colorectal cancer in women. Tumour biology : the journal of the International Society for Oncodevelopmental Biology and Medicine. May 2015;36(5):3709–3715. [DOI] [PubMed] [Google Scholar]
- 15.Karimi K, Mahmoudi T, Karimi N, et al. Is there an association between variants in candidate insulin pathway genes IGF-I, IGFBP-3, INSR, and IRS2 and risk of colorectal cancer in the Iranian population? Asian Pac J Cancer Prev. 2013;14(9):5011–5016. [DOI] [PubMed] [Google Scholar]
- 16.Feik E, Baierl A, Hieger B, et al. Association of IGF1 and IGFBP3 polymorphisms with colorectal polyps and colorectal cancer risk. Cancer Causes Control. January 2010;21(1):91–97. [DOI] [PubMed] [Google Scholar]
- 17.Slattery ML, Murtaugh M, Caan B, Ma KN, Neuhausen S, Samowitz W. Energy balance, insulin-related genes and risk of colon and rectal cancer. Int J Cancer. May 20 2005;115(1):148–154. [DOI] [PubMed] [Google Scholar]
- 18.Ho GY, Wang T, Gunter MJ, et al. Adipokines linking obesity with colorectal cancer risk in postmenopausal women. Cancer Res. June 15 2012;72(12):3029–3037. [DOI] [PMC free article] [PubMed] [Google Scholar]
- 19.Gunter MJ, Leitzmann MF. Obesity and colorectal cancer: epidemiology, mechanisms and candidate genes. J Nutr Biochem. March 2006;17(3):145–156. [DOI] [PubMed] [Google Scholar]
- 20.Simons CC, van den Brandt PA, Stehouwer CD, van Engeland M, Weijenberg MP. Body size, physical activity, early-life energy restriction, and associations with methylated insulin-like growth factor-binding protein genes in colorectal cancer. Cancer Epidemiol Biomarkers Prev. September 2014;23(9):1852–1862. [DOI] [PubMed] [Google Scholar]
- 21.Mogensen UB, Ishwaran H, Gerds TA. Evaluating Random Forests for Survival Analysis using Prediction Error Curves. Journal of statistical software. September 2012;50(11):1–23. [DOI] [PMC free article] [PubMed] [Google Scholar]
- 22.Hamidi O, Poorolajal J, Farhadian M, Tapak L. Identifying Important Risk Factors for Survival in Kidney Graft Failure Patients Using Random Survival Forests. Iranian journal of public health. January 2016;45(1):27–33. [PMC free article] [PubMed] [Google Scholar]
- 23.The Women’s Health Initiative Study Group. Design of the Women’s Health Initiative clinical trial and observational study. The Women’s Health Initiative Study Group Controlled clinical trials. February 1998;19(1):61–109. [DOI] [PubMed] [Google Scholar]
- 24.WHI Harmonized and Imputed GWAS Data. dbGaP Study Accession: phs000746.v1.p3 http://www.ncbi.nlm.nih.gov/projects/gap/cgi-bin/study.cgi?study_id=phs000746.v1.p3. [Google Scholar]
- 25.National Cancer Institute. SEER Program: Comparative Staging Guide For Cancer June 1993. [Google Scholar]
- 26.Al-Ajmi K, Ganguly SS, Al-Ajmi A, Mandhari ZA, Al-Moundhri MS. Insulin-like growth factor 1 gene polymorphism and breast cancer risk among arab omani women: a case-control study. Breast cancer : basic and clinical research. 2012;6:103–112. [DOI] [PMC free article] [PubMed] [Google Scholar]
- 27.Slattery ML, Sweeney C, Wolff R, et al. Genetic variation in IGF1, IGFBP3, IRS1, IRS2 and risk of breast cancer in women living in Southwestern United States. Breast cancer research and treatment. August 2007;104(2):197–209. [DOI] [PubMed] [Google Scholar]
- 28.Cleveland RJ, Gammon MD, Edmiston SN, et al. IGF1 CA repeat polymorphisms, lifestyle factors and breast cancer risk in the Long Island Breast Cancer Study Project. Carcinogenesis. April 2006;27(4):758–765. [DOI] [PubMed] [Google Scholar]
- 29.Quan H, Tang H, Fang L, Bi J, Liu Y, Li H. IGF1(CA)19 and IGFBP-3–202A/C gene polymorphism and cancer risk: a meta-analysis. Cell biochemistry and biophysics. May 2014;69(1):169–178. [DOI] [PubMed] [Google Scholar]
- 30.Haiman CA, Han Y, Feng Y, et al. Genome-wide testing of putative functional exonic variants in relationship with breast and prostate cancer risk in a multiethnic population. PLoS genetics. March 2013;9(3):e1003419. [DOI] [PMC free article] [PubMed] [Google Scholar]
- 31.Zhang H, Wang A, Ma H, Xu Y. Association between insulin receptor substrate 1 Gly972Arg polymorphism and cancer risk. Tumour biology : the journal of the International Society for Oncodevelopmental Biology and Medicine. October 2013;34(5):2929–2936. [DOI] [PubMed] [Google Scholar]
- 32.Slattery ML, Lundgreen A, John EM, et al. MAPK genes interact with diet and lifestyle factors to alter risk of breast cancer: the Breast Cancer Health Disparities Study. Nutrition and cancer. 2015;67(2):292–304. [DOI] [PMC free article] [PubMed] [Google Scholar]
- 33.1000 Genomes Browser Orientation. 2011. http://browser.1000genomes.org. [Google Scholar]
- 34.Ishwaran H, Kogalur UB. Random Survival Forests for R. 2007. https://pdfs.semanticscholar.org/951a/84f0176076fb6786fdf43320e8b27094dcfa.pdf. [DOI] [PMC free article] [PubMed] [Google Scholar]
- 35.Chung RH, Chen YE. A two-stage random forest-based pathway analysis method. PloS one. 2012;7(5):e36662. [DOI] [PMC free article] [PubMed] [Google Scholar]
- 36.Ishwaran H, Kogalur UB, Blackstone EH, Lauer MS. RANDOM SURVIVAL FORESTS. 2008;2(3):841–860. https://projecteuclid.org/download/pdfview_1/euclid.aoas/1223908043. [Google Scholar]
- 37.Inuzuka R, Diller GP, Borgia F, et al. Comprehensive use of cardiopulmonary exercise testing identifies adults with congenital heart disease at increased mortality risk in the medium term. Circulation. January 17 2012;125(2):250–259. [DOI] [PubMed] [Google Scholar]
- 38.Bergman D, Halje M, Nordin M, Engstrom W. Insulin-like growth factor 2 in development and disease: a mini-review. Gerontology. 2013;59(3):240–249. [DOI] [PubMed] [Google Scholar]
- 39.Reuveni H, Flashner-Abramson E, Steiner L, et al. Therapeutic destruction of insulin receptor substrates for cancer treatment. Cancer Res. July 15 2013;73(14):4383–4394. [DOI] [PMC free article] [PubMed] [Google Scholar]
- 40.Agarwal E, Brattain MG, Chowdhury S. Cell survival and metastasis regulation by Akt signaling in colorectal cancer. Cell Signal. August 2013;25(8):1711–1719. [DOI] [PMC free article] [PubMed] [Google Scholar]
- 41.Slattery ML, Samowitz W, Curtin K, et al. Associations among IRS1, IRS2, IGF1, and IGFBP3 genetic polymorphisms and colorectal cancer. Cancer Epidemiol Biomarkers Prev. July 2004;13(7):1206–1214. [PubMed] [Google Scholar]
- 42.Esposito DL, Verginelli F, Toracchio S, et al. Novel insulin receptor substrate 1 and 2 variants in breast and colorectal cancer. Oncol Rep. October 2013;30(4):1553–1560. [DOI] [PMC free article] [PubMed] [Google Scholar]
- 43.Mahmoudi T, Majidzadeh AK, Karimi K, et al. Gly972Arg variant of insulin receptor substrate 1 gene and colorectal cancer risk in overweight/obese subjects. Int J Biol Markers. February 28 2016;31(1):e68–72. [DOI] [PubMed] [Google Scholar]
- 44.Li P, Wang L, Liu L, Jiang H, Ma C, Hao T. Association between IRS-1 Gly972Arg polymorphism and colorectal cancer risk. Tumour biology : the journal of the International Society for Oncodevelopmental Biology and Medicine. July 2014;35(7):6581–6585. [DOI] [PubMed] [Google Scholar]
- 45.Butler LM, Wang R, Koh WP, Stern MC, Yuan JM, Yu MC. Marine n-3 and saturated fatty acids in relation to risk of colorectal cancer in Singapore Chinese: a prospective study. International journal of cancer. February 01 2009;124(3):678–686. [DOI] [PMC free article] [PubMed] [Google Scholar]
- 46.Saturated Fat. 2017; https://healthyforgood.heart.org/Eat-smart/Articles/Saturated-Fats, 2017. [Google Scholar]
- 47.Montazeri M, Beigzadeh A. Machine learning models in breast cancer survival prediction. Technology and health care : official journal of the European Society for Engineering and Medicine. 2016;24(1):31–42. [DOI] [PubMed] [Google Scholar]
- 48.Pang H, Lin A, Holford M, et al. Pathway analysis using random forests classification and regression. Bioinformatics. August 15 2006;22(16):2028–2036. [DOI] [PubMed] [Google Scholar]
- 49.Chang JS, Yeh RF, Wiencke JK, et al. Pathway analysis of single-nucleotide polymorphisms potentially associated with glioblastoma multiforme susceptibility using random forests. Cancer Epidemiol Biomarkers Prev. June 2008;17(6):1368–1373. [DOI] [PMC free article] [PubMed] [Google Scholar]
- 50.Haskell WL, Lee IM, Pate RR, et al. Physical activity and public health: updated recommendation for adults from the American College of Sports Medicine and the American Heart Association. Med Sci Sports Exerc. 2007;39(8):1423–1434. [DOI] [PubMed] [Google Scholar]
Associated Data
This section collects any data citations, data availability statements, or supplementary materials included in this article.


