

SUMMARY
Dysregulation of cellular protein synthesis is linked to a variety of diseases. Mutations in EIF2S3, encoding the γ subunit of the heterotrimeric eukaryotic translation initiation factor eIF2, cause MEHMO syndrome, an X-linked intellectual disability disorder. Here, using patient-derived induced pluripotent stem cells, we show that a mutation at the C-terminus of eIF2γ impairs CDC123 promotion of eIF2 complex formation and decreases the level of eIF2–GTP–Met-tRNAiMet ternary complexes. This reduction in eIF2 activity results in dysregulation of global and gene-specific protein synthesis and enhances cell death upon stress induction. Addition of the drug ISRIB, an activator of the eIF2 guanine nucleotide exchange factor, rescues the cell growth, translation, and neuronal differentiation defects associated with the EIF2S3 mutation, offering the possibility of therapeutic intervention for MEHMO syndrome.
eTOC BLURB
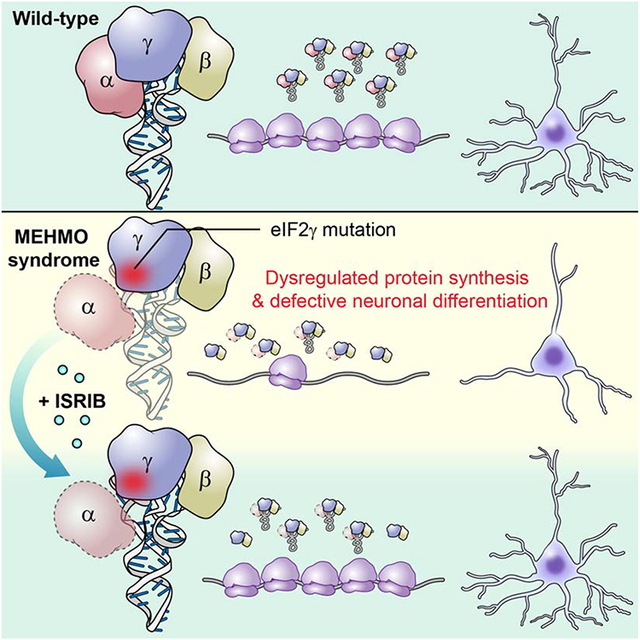
Young-Baird et al. report that a translation initiation factor eIF2γ mutation linked to the intellectual disability MEHMO syndrome disrupts eIF2 complex formation, triggers chronic activation of the integrated stress response, and impairs neuronal differentiation. These cellular defects are rescued by the small molecule ISRIB.
Graphical Abstract
INTRODUCTION
As the culminating step in the central dogma of gene expression, protein synthesis is a critical determinant for the identity and quantity of proteins expressed in a cell. Defects in protein synthesis are associated with a wide range of inherited diseases. Mutations affecting cytoplasmic tRNA processing, post-transcriptional modification, and aminoacylation have been associated with neurodegenerative disorders, neuropathies and other multi-system diseases (Tahmasebi et al., 2018). Moreover, ribosomopathies caused by mutations affecting ribosomal proteins or ribosome biogenesis oftentimes cause anemia and skeletal or craniofacial abnormalities (Yelick and Trainor, 2015). Fewer diseases have been linked to mutations in translation initiation or elongation factors, proteins that assist the ribosome in synthesizing proteins; however, defects in protein synthesis have been linked to activation of cellular stress pathways including the integrated stress response (ISR) and the unfolded protein response (UPR) pathways.
Mutations in EIF2S3, encoding the γ subunit of the heterotrimeric translation initiation factor eIF2, have recently been linked to MEHMO syndrome, a rare X-linked intellectual disability in which patients exhibit mental (intellectual) deficiency, epilepsy, hypogenitalism, microcephaly, and obesity. eIF2 plays roles in two key steps of the translation initiation pathway: delivery of initiator methionyl-tRNA (Met-tRNAiMet) to the ribosome and selection of the translation start site on an mRNA (Hinnebusch, 2011). To facilitate these roles, eIF2 binds GTP and Met-tRNAiMet to form the eIF2 ternary complex (TC). The TC then binds to the small 40S ribosomal subunit, and the resulting 43S preinitiation complex (PIC) associates with an mRNA near the 5’ cap and subsequently scans in a 3’ direction to select the translation start codon. Following start codon selection and completion of GTP hydrolysis by eIF2, an inactive eIF2–GDP binary complex is released from the ribosome. The guanine nucleotide exchange factor eIF2B catalyzes recycling of eIF2–GDP to eIF2–GTP for use in additional rounds of translation initiation (Pavitt, 2018).
In mammals, phosphorylation of the α subunit of eIF2 on Ser51 (eIF2α–P) by one of four specific stress-responsive eIF2α–P) by one of four specific Wek, 2012; Wek, 2018) triggers the ISR. Phosphorylated eIF2 inhibits eIF2B, thereby lowering the levels of eIF2 TCs and resulting in inhibition of global protein synthesis. Moreover, the ISR results in the translational upregulation of mRNAs encoding specific stress-responsive proteins including the transcription factors ATF4 (CREB2) and CHOP (DDIT3/GADD153), as well as the protein phosphatase 1 (PP1c) regulatory subunit GADD34 (PPP1R15A) that targets PP1c to dephosphorylate eIF2α–P and restore protein synthesis after stress amelioration (Novoa et al., 2001; Palam et al., 2011; Vattem and Wek, 2004; Walter and Ron, 2011). While CHOP is a transcriptional target of ATF4, the translational regulation of ATF4, CHOP, and GADD34 is mediated, in part, by upstream open reading frames (uORFs) in the 5’-leaders of the transcripts (Wek, 2018; Young and Wek, 2016) that tightly couple expression to the level of eIF2α–P and eIF2 TCs.
To date, five mutations in EIF2S3 have been linked to MEHMO syndrome. The eIF2γ-I222T mutation impairs eIF2β binding to eIF2γ and the eIF2γ-I258M mutation impairs Met-tRNAiMet binding to eIF2 (Borck et al., 2012; Young-Baird et al., 2019). The eIF2γ-P432S mutation additionally causes hypopituitarism and glucose dysregulation (Gregory et al., 2019). Yeast models of these three mutations result in derepression of GCN4 mRNA translation, the yeast ortholog of ATF4, suggesting that the MEHMO syndrome mutations activate the ISR (Borck et al., 2012; Young-Baird et al., 2019). While the eIF2γ-S108R mutation was genetically linked to MEHMO syndrome, no biochemical defect has been associated with this mutation (Skopkova et al., 2017). The fifth MEHMO syndrome mutation, eIF2γ-I465Sfs*4 (hereafter abbreviated eIF2γ-fs), contains a 4-nucleotide deletion near the 3’-end of the EIF2S3 coding region that changes the C-terminal amino acid sequence of eIF2γ from G462VTIKPTVDDD* to G462VTSQQ*. Knockdown of EIF2S3 in zebrafish was found to phenocopy the microcephaly symptom of MEHMO syndrome, while in a yeast model the eIF2γ-fs mutation derepressed GCN4 expression (Moortgat et al., 2016; Skopkova et al., 2017); however, how the eIF2γ-fs mutation impacts eIF2 function and causes MEHMO syndrome phenotypes has not been determined.
In this report we use patient-derived induced pluripotent stem cells (iPSCs) to define the consequences of the eIF2γ-fs mutation on eIF2 function. We show that the mutation results in constitutive induction of the ISR via altered uORF-dependent translational control of the key ISR targets, and we show that the mutation impairs assembly of the eIF2 complex by altering the activity of the assembly chaperone CDC123. Finally, we show that the drug ISRIB, an activator of eIF2B, effectively rescues the cell growth, ISR induction, and neuronal differentiation phenotypes associated with the eIF2γ-fs mutation. Our work thus reveals a molecular signature of MEHMO syndrome and identifies ISRIB as a potential therapeutic for this disease affecting cellular protein synthesis.
RESULTS
Constitutive activation of the ISR in eIF2γ-fs iPSCs
To explore the molecular mechanism underlying MEHMO syndrome, iPSCs were generated from keratinocytes obtained from a MEHMO patient expressing the eIF2γ-fs C-terminal frameshift mutation (lines fs1 and fs2) or from an individual expressing wild-type (WT) eIF2γ (lines WT1 and WT2). Polysome profile analyses obtained by centrifugation of whole cell lysates in sucrose density gradients revealed a defect in translation initiation in the eIF2γ-fs iPSCs with a decrease in large polysomes and concomitant increase in the 80S monosome fraction as compared to WT iPSCs (Figure 1A, polysome-to-monosome (P/M) ratio decreased from 2.50±0.10 in WT to 1.19±0.01 in the mutant). Puromycin labeling revealed a ~38% decrease in total protein synthesis in the eIF2γ-fs iPSCs (Figure 1B), and the mutant iPSCs grew much slower (doubling time 40.3±0.5 h) compared to the WT iPSCs (doubling time 26.2±0.6 h; Figure S1B). Thus, the eIF2γ-fs mutation impaired general translation and cell growth.
Figure 1. eIF2γ-fs mutation decreases global translation and increases expression of key ISR factors.

(A) Polysome analysis of lysates from two clones of eIF2γ (WT1 and WT2) and eIF2γ-fs (fs1 and fs2) iPSCs; positions of 40S, 60S, and 80S ribosomes, and average (n = 3) polysome/monosome (P/M) ratios with standard deviations (SD) are indicated. An overlay of the profiles is presented in Figure S1A.
(B) Average puromycin incorporation in actively growing cells was measured as a reporter of protein synthesis and is shown with SD relative to WT1 (n = 3). *Values statistically different from WT1, p<0.05.
(C) Protein lysates from eIF2γ and eIF2γ-fs iPSCs were subjected to immunoblot analysis for the indicated translation factors and stress response proteins.
(D) Total RNA was isolated from fractionated sucrose gradients and the percentage of total ATF4 mRNA in each fraction was determined by qRT-PCR. Error bars represent SD (n = 3). See also Figure S1.
Consistent with the notion that the eIF2γ-fs mutation impairs eIF2 function, western blot analyses revealed that the levels of the key ISR members ATF4, CHOP, and GADD34 were elevated in the patient-derived cell lines (Figure 1C, compare lanes 3&4 to lanes 1&2) and a previous report showed increased CHOP mRNA and protein levels in fibroblasts from a patient with the same eIF2γ-fs mutation (Skopkova et al., 2017). Importantly, no significant changes in eIF2α–P levels were observed between the WT (eIF2α–P/eIF2α = 1.1±0.2) and mutant (eIF2α–P/eIF2α = 1.0±0.3) iPSCs (Figure 1C), suggesting that the eIF2γ-fs mutation is inducing the ISR independent of eIF2α phosphorylation. Interestingly, while the levels of eIF2α, eIF2β, and CReP, a constitutively expressed PP1 regulatory subunit that shares sequence similarity with GADD34, were relatively unchanged between the eIF2γ-fs and WT iPSCs, eIF2γ levels were significantly increased in the mutant cells (Figure 1C). As overexpression of eIF2γ in WT iPSCs did not increase ATF4, CHOP, or GADD34 levels (Figure S1C), the induction of the ISR is not due to altered eIF2γ levels and instead likely results from decreased eIF2 activity in the eIF2γ-fs mutant cells.
Polysome analyses and reporter assays confirmed induction of the ISR translational program in the mutant iPSCs. Whereas the majority of ATF4 mRNA was associated with monosomes and small polysomes in WT iPSCs (only 32.6±1.2% of ATF4 mRNA was associated with polysomes), 59.0±1.1% of ATF4 mRNA was associated with polysomes, indicating enhanced translation, in the eIF2γ-fs iPSCs (Figure 1D), and similar redistributions of the CHOP and GADD34 mRNAs were also observed (Figures S1D & E). Previous studies showed that translation of the ATF4, CHOP, and GADD34 mRNAs is upregulated when eIF2 TC levels are low in a manner controlled by the 5’ leaders of the mRNAs (Harding et al., 2000; Lee et al., 2009; Palam et al., 2011; Vattem and Wek, 2004; Young et al., 2016; Young et al., 2015). To determine if the 5’-leaders of ATF4, CHOP, and GADD34 were responsible for the translational upregulation of these mRNAs in the eIF2γ-fs iPSCs, we conducted reporter assays in which the 5’-leader of each respective mRNA was inserted between a minimal TK promoter and the firefly luciferase coding region (CDS). Transfected PTK-ATF4-Luc, PTK-CHOP-Luc, and PTK-GADD34-Luc reporters were then assayed for both mRNA levels and firefly luciferase activity, as a proxy for luciferase expression. Luciferase activities for PTK-ATF4-Luc, PTK-CHOP-Luc, and PTK-GADD34-Luc reporters were increased 2-fold or more in the eIF2γ-fs iPSCs as compared to the WT cells (Figure 2A). Notably, there was not a significant change in firefly luciferase mRNA levels. These results indicate that the 5’-leaders of the ATF4, CHOP, and GADD34 mRNAs direct the translational upregulation of these mRNAs in the eIF2γ-fs iPSCs.
Figure 2. uORF-mediated translation of ATF4, CHOP, and GADD34 mRNAs is enhanced in eIF2γ-fs iPSCs.

(A-D) WT and mutant versions of PTK-ATF4-Luc (A,B), PTK-CHOP-Luc (A,C), and PTK-GADD34-Luc (A,D) constructs were transfected into eIF2γ and eIF2γ-fs iPSCs. Translation was measured via firefly luciferase assay and corresponding mRNA measurements were conducted by qRT-PCR. Reporter constructs contain the 5’-leader of the respective mRNAs inserted between a minimal TK promoter and the firefly luciferase CDS. uORFs are represented as purple (uORF1) and blue (uORF2) colored boxes, and the firefly luciferase CDS is represented as a green box. uORF start codons were mutated from AUG to AGG or AUA, as indicated, and the absence of the uORF is denoted by the gray box. Average values (n = 3) are represented relative to WT1 containing the respective WT 5’-leader construct; error bars represent standard deviation; *values statistically different from WT1, p<0.05.
Translational upregulation of ATF4, CHOP, and GADD34 is dependent on the presence of specific uORFs in their respective 5’-leaders that play precise regulatory roles. Translational control of ATF4 relies on the presence of two uORFs (Harding et al., 2000; Lu et al., 2004; Vattem and Wek, 2004). The 5’-proximal short uORF1 acts as a positive element by promoting downstream translational reinitiation (Lu et al., 2004; Vattem and Wek, 2004). When eIF2 TC levels are high, ribosomes that resume scanning after translation of uORF1 quickly reacquire a new eIF2 TC and reinitiate translation at uORF2. uORF2 overlaps out-of-frame with the ATF4 CDS, and translation termination at the uORF2 stop codon occurs 3’ of the ATF4 CDS start codon. In this manner, translation of uORF2 effectively precludes the ribosome from initiating translation at the ATF4 CDS, resulting in low ATF4 expression when eIF2 TC levels are high. Under conditions that lower eIF2 TC levels, such as when eIF2α is phosphorylated, ribosomes that resume scanning after translation of uORF1 take a longer time to reacquire a new eIF2 TC. This delay allows for scanning ribosomes to bypass the inhibitory uORF2 start codon before reacquiring an eIF2 TC and promotes initiation at the ATF4 CDS leading to increased ATF4 production when eIF2 TC levels are lowered.
To explore the mechanism underlying translational regulation of ATF4 in the eIF2γ-fs iPSCs, the ATF4 uORF start codons were mutated from ATG to AGG as indicated in Figure 2B. Mutation of the uORF1 start codon led to comparable reductions in luciferase activities in the WT and eIF2γ-fs iPSCs, consistent with the positive role of this uORF in regulation of ATF4 synthesis. In contrast, elimination of the inhibitory uORF2, or both the uORF1 and uORF2, start codon derepressed ATF4 expression (Figure 2B). The uORF requirement for regulation of ATF4 expression by the eIF2γ-fs mutation mimics what was previously shown for derepression of ATF4 expression under conditions of elevated eIF2α phosphorylation. As mentioned previously, eIF2α–P levels were not different between the patient and WT cells (Figure 1C), indicating that the increase in ATF4 expression is likely due reduced eIF2 function caused by the eIF2γ-fs mutation.
Translational control of the CHOP and GADD34 mRNAs is mediated by a single uORF (the sole uORF in the CHOP mRNA and uORF2 in the GADD34 mRNA, see Figure 2). Under basal conditions in WT cells with high eIF2 activity, ribosomes translating the uORF experience a prolonged elongation or termination pause that dampens downstream CDS translation (Young et al., 2016; Young et al., 2015). Phosphorylation of eIF2α under conditions of cellular stress causes ribosomes to bypass the inhibitory uORF, due in part to the sub-optimal context nucleotide sequence flanking the uORF start codon, and leading to enhanced translation of the CDS (Lee et al., 2009; Palam et al., 2011; Young et al., 2016; Young et al., 2015). Mutation of the regulatory uORF start codon in the CHOP and GADD34 5’-leaders resulted in constitutive, and similar, derepression of reporter expression in both the patient and WT cells, indicating that the eIF2γ-fs mutation derepresses CHOP and GADD34 mRNA translation via the canonical uORF-mediated mechanism (Figure 2C–D). Overall, these data suggest that expression of ATF4, CHOP, and GADD34 are regulated by similar uORF-mediated mechanisms in the WT and eIF2γ-fs iPSCs, and that mutation of eIF2γ facilitates increased expression of these ISR members. Moreover, the ability of the eIF2γ mutation to phenocopy eIF2α phosphorylation and induce ATF4, CHOP, and GADD34 expression indicates that reduction of eIF2 activity is a sufficient switch to promote translation of these mRNAs.
Hyperinduction of the ISR in MEHMO syndrome iPSCs causes apoptosis
The global and gene-specific translational effects of the eIF2γ-fs mutation indicate constitutive activation of the ISR. To assess the impact of stress, the iPSCs were treated with thapsigargin (TG), a potent inducer of endoplasmic reticulum stress and eIF2α–P. As expected, induction of the ISR in the WT iPSCs impaired global translation with the P/M ratio falling from 2.51±0.09 in cells receiving no treatment (NT) to 0.66±0.02 in cells treated with TG (Figure 3A), and puromycin incorporation dropped ~64% in the stressed cells (Figure 3B). TG treatment exacerbated the translation defect in the eIF2γ-fs cells. The P/M ratio dropped from 1.46±0.26 to 0.29±0.16 in the presence of TG (Figure 3A), and puromycin incorporation, which was already reduced ~40% in the untreated mutant iPSCs compared to the WT controls (Figure 3B), decreased an additional ~42% upon treatment with TG. Taken together, these results demonstrate that TG, which induces eIF2α phosphorylation in both the WT (NT eIF2α-P/eIF2α = 1.0±0.2; TG eIF2α-P/eIF2α = 2.2 ±0.6) and mutant (NT eIF2α-P/eIF2α 1.0±0.4; TG eIF2α-P/eIF2α 2.0±0.5) iPSCs (Figure 3C), exacerbates the basal translation initiation defect in the eIF2γ-fs iPSCs, culminating in chronically low levels of protein synthesis. Along with these effects on global translation, phosphorylation of eIF2α impacted ATF4 mRNA translation. Under basal conditions higher levels of ATF4 mRNA were bound to polysomes in the mutant iPSCs (53.8±4.5%) versus the WT iPSCs (34.0±2.6%) (Figures 3D & S2C). Moreover, ATF4 mRNA reached maximal polysome association within 30 minutes of TG treatment in the eIF2γ-fs iPSCs (62.0±0.1%), whereas 3 hours of TG treatment was required for ATF4 to reach a similar level of polysome association in the WT cells (60.3±1.4%) (Figures S2B–C). Thus, the eIF2γ mutation enhances the expression of ATF4 basally and promotes maximal translation of ATF4 mRNA early in the cellular stress response. Consistent with this enhanced translation of the ATF4 mRNA, western blot analysis revealed increased levels of ATF4 in the mutant versus WT iPSCs under both basal and stress conditions (Figure 3C). Similar basal induction and stress-activated hyperinduction of the ISR proteins CHOP and GADD34 in the mutant iPSCs (Figure 3C) supports the conclusion that the eIF2γ-fs mutation is causing chronic ISR activation that is hyperinduced under cellular stress conditions.
Figure 3. Constitutive ISR in eIF2γ-fs iPSCs is exacerbated by stress, causing impaired translation, heightened expression of ATF4, CHOP, and GADD34, and reduced cell viability.

(A) Polysome analysis of lysates from untreated (NT) or thapsigargin treated (TG) eIF2γ and eIF2γ-fs iPSCs. The X-axis was broken between the monosome and disome peaks with the 40S, 60S, and 80S peaks graphed on a 1X scale and the polysomes graphed on a 10X scale.
(B) Puromycin incorporation in cells left untreated or treated with TG as described for Figure 1B.
(C) Protein lysates from eIF2γ and eIF2γ-fs iPSCs either left untreated or treated with TG were subjected to immunoblot analysis for the indicated translation factors and stress response proteins.
(D) Total RNA was isolated from fractionated sucrose gradients and the percentage of total ATF4 mRNA in each fraction was determined as in Figure 1D.
(E-F) Cells were either left untreated or treated with TG followed by measurement of Caspase 3/7 activity (E) or TUNEL levels (F).
(B,E, & F) Average values are shown with SD relative to WT1 (n = 3). *values statistically different from WT1 NT; #fs1 and fs2 TG values statistically different from fs1 and fs2 NT, p<0.05. See also Figure S2.
During prolonged activation of the ISR, the bZIP transcription factor CHOP promotes a shift in the transcriptional program resulting in enhanced expression of pro-apoptotic factors including BIM, BAX, and CASPASE 3 (Rutkowski et al., 2006; Tabas and Ron, 2011; Teske et al., 2013; Zinszner et al., 1998). As shown in Figure S2D, qRT-PCR analysis revealed elevated levels of BAX and CASPASE 3 in the eIF2γ-fs iPSCs under basal conditions that was further increased, along with BIM mRNA expression, upon TG treatment. Consistent with the induced expression of these pro-apoptotic factors, two markers of apoptosis, Caspase 3/7 activity and DNA fragmentation as measured by TUNEL levels, were substantially elevated in the mutant iPSCs upon TG treatment (Figures 3E–F). Taken together, these data suggest that the MEHMO syndrome mutation causes misregulated protein synthesis and chronic induction of the ISR leading to maladaptive gene expression and cellular apoptosis.
eIF2γ-fs mutation alters interaction with the chaperone CDC123 and impairs eIF2 heterotrimer formation
Having observed the consequences of the eIF2γ-fs mutation on cellular protein synthesis, we next sought to determine how the mutation impacts eIF2 function. The I465Sfs*4 mutation alters the extreme C-terminus of eIF2γ replacing the last eight amino acids (-IKPTVDDD) with three different residues (-SQQ) (Moortgat et al., 2016; Skopkova et al., 2017). While the function of the eIF2γ C-terminus is not well defined, the chaperone CDC123 interacts with domain III and the extreme C-terminus of eIF2γ (Panvert et al., 2015; Perzlmaier et al., 2013), including the residues altered by the MEHMO patient eIF2γ-fs frameshift mutation. Importantly, CDC123 interacts with free eIF2γ, but not the full eIF2 heterotrimer (Perzlmaier et al., 2013), and the CDC123–eIF2γ interaction facilitates assembly of the eIF2γ–IF2α heterodimer, whereas eIF2β binds to eIF2γ independent of CDC123 activity (Figure 4A). Co-immunoprecipitation assays were used to assess the impact of the eIF2γ mutation on eIF2 complex assembly. As shown in Figure 4B, reduced amounts of eIF2α, but not eIF2γ, were co-precipitated with eIF2β in extracts from eIF2γ-fs iPSCs as compared to iPSCs expressing WT eIF2γ (compare lanes 11–12 to 9–10; quantification in Figure S3B). In complementary experiments, the co-immunoprecipitation of eIF2β and eIF2γ with eIF2α was significantly decreased in extracts from the mutant versus the WT iPSCs (Figures S3A & S3B). Interestingly, increased levels of CDC123 were co-immunoprecipitated with eIF2β and eIF2α in the mutant extracts (Figures 4B, S3A, & S3B), suggesting enrichment for assembly intermediates in which the chaperone is bound to eIF2α and eIF2γ prior to formation of the eIF2αβγ complex (Figure 4A, top row). Taken together, these data indicate that the eIF2γ-fs mutation impairs CDC123-mediated eIF2 complex assembly through a mechanism involving defective binding of eIF2α to eIF2γ.
Figure 4. Impaired eIF2 heterotrimer and ternary complex formation in eIF2γ-fs iPSCs is rescued by eIF2α overexpression.

(A) eIF2 heterotrimer formation is facilitated by chaperone CDC123 (CDC); eIF2B catalyzes GDP-GTP exchange on eIF2 to enable ternary complex (TC) formation.
(B-C) Lysates from eIF2γ and eIF2γ-fs iPSCs with (panel C) or without eIF2α overexpression, as indicated, were subjected to co-immunoprecipitation with eIF2β or control IgG antibodies. Immunoblot analyses were used to detect eIF2 subunits and chaperone CDC123 in input and immunoprecipitated (IP) samples.
(C) Bottom panel, Met-tRNAiMet in input and co-immunoprecipitation samples was analyzed by RT-PCR and gel electrophoresis; western blot (WB) and RT-PCR panels are indicated. See also Figure S3.
If induction of the ISR in the eIF2γ-fs iPSCs is due to decreased eIF2α association with the eIF2 complex, then overexpression of eIF2a might, through mass action, restore eIF2 complex integrity and suppress expression of the ISR markers. Consistent with this idea, overexpression of eIF2α restored ATF4 to near WT levels in the eIF2γ-fs iPSCs (Figure S3D). Likewise, overexpression of eIF2α in the mutant iPSCs restored eIF2 complex formation with more eIF2α co-immunoprecipitated with eIF2β (Figure 4C, compare lane 12 to 11; quantification in Figure S3C). Analysis of Met-tRNAiMet co-precipitation with eIF2 revealed an ~80% decrease in TC levels in the extracts from the mutant versus WT iPSCs, which was partially rescued by overexpression of eIF2α (Figures 4C & S3C). The co-suppression of the ISR and eIF2 complex and TC defects in the mutant iPSCs by overexpression of eIF2a suggests that the defect in eIF2 complex formation underlies the cellular phenotypes of MEHMO syndrome caused by the eIF2g-fs mutation.
ISRIB rescues eIF2γ-fs cell growth and translation defects
Recently, the small molecule ISRIB was identified as an inhibitor of the ISR (Sidrauski et al., 2013; Sidrauski et al., 2015a) and activator of the eIF2 guanine nucleotide exchange factor eIF2B (Sekine et al., 2015; Sidrauski et al., 2015b; Tsai et al., 2018; Zyryanova et al., 2018). To test whether stimulation of eIF2B activity could suppress a mutation in eIF2, we asked if ISRIB could rescue the cellular phenotypes associated with the MEHMO syndrome mutation. As shown in Figure 5A, addition of ISRIB nearly fully rescued protein synthesis in the mutant iPSCs. Likewise, ISRIB rescued the cell growth defect of the mutant iPSCs. The doubling time of the eIF2γ-fs iPSCs (40.6±0.6 h) was significantly slower than the WT iPSCs (25.8±0.5 h), and addition of ISRIB resulted in similar growth rates for the mutant (27.6±0.8 h) and WT (24±0.2 h) cells (Figure 5B). Along with restoring global translation, ISRIB treatment blocked the basal derepression of ATF4, CHOP, and GADD34 levels in the mutant iPSCs (Figures 5C & S4) with no change in eIF2αphosphorylation. In addition, ISRIB suppressed ATF4 induction in the mutant iPSCs treated with TG (Figure S4D), indicating that ISRIB effectively inhibits ISR activation in eIF2γ-fs iPSCs even in the presence of eIF2α-P. Notably, this profound rescue of the eIF2γ-fs iPSC mutant phenotypes was also apparent when compared to isogenic WT iPSCs generated by CRISPR correction of the frameshift mutation in the mutant iPSCs (Figure S5).
Figure 5. ISRIB rescues TC, protein synthesis, and cell proliferation defects caused by the eIF2γ-fs mutation.

(A) Puromycin incorporation in cells left untreated or treated with ISRIB. *values statistically different from WT1 NT; fs1 and fs2 TG values statistically different from fs1 and fs2 NT#, p<0.05 (n = 3).
(B) Untreated (NT) or ISRIB-treated cells grown for the indicated time periods were stained with Hoechst dye; average fluorescence with standard deviation are presented relative to the time 0 measurement for each cell line and treatment group (n = 3).
(C) Immunoblot analysis of the indicated proteins in lysates from eIF2γ and eIF2γ-fs iPSCs left untreated or treated with ISRIB; *non-specific band detected with GADD34 antibody. See also Figure S4.
(D) Top panel: Immunoblot analysis of input and co-immunoprecipitation samples from eIF2γ and eIF2γ-fs iPSCs, left untreated or treated with ISRIB. Bottom panel: Met-tRNAiMet in input and co-immunoprecipitation samples was analyzed as described in Figure 4C.
To gain insight into the mechanism by which ISRIB suppresses the effects of the eIF2γ-fs mutation, we used co-immunoprecipitation experiments to monitor eIF2 complex and TC levels in extracts from WT and eIF2γ-fs iPSCs that were cultured in the presence or absence of ISRIB. Whereas ISRIB did not restore eIF2α association or reduce CDC123 association with the partial eIF2 complex (Figure 5D, lane 12 vs 11), the drug restored TC levels with a 3-fold increase in Met-tRNAiMet associated with complex isolated from mutant cells grown in the presence of ISRIB (lane 12). To explain how ISRIB might restore TC levels without restoring eIF2α incorporation into eIF2 complexes, we propose that the eIF2γ mutation not only impairs eIF2α binding to the eIF2 complex but also indirectly impairs guanine nucleotide exchange on the complexes containing eIF2α. Perhaps an altered orientation of eIF2α on the mutant eIF2 complexes impairs productive interaction with eIF2B. This hypothesis is consistent with previous studies showing that eIF2α contributes to eIF2B-catalyzed guanine nucleotide exchange on eIF2 (Nika et al., 2001). Accordingly, activation of eIF2B by ISRIB overcomes this defect by enhancing nucleotide exchange on the limiting heterotrimeric eIF2 complexes in the mutant cells, leading to increased TC formation and rescue of the cell growth and protein synthesis defects associated with the eIF2γ-fs mutation.
Neuronal differentiation defect of the eIF2γ-fs iPSCs is rescued by ISRIB
As intellectual disability is a prominent phenotype associated with the eIF2γ-fs MEHMO mutation, we used regulated neurogenin-2 (NGN2) expression to trigger differentiation of the isogenic WT and mutant iPSCs to cortical neurons. A doxycycline-inducible NGN2 expression vector was stably introduced at the AAVS1 safe harbor locus of the isogenic iWT1 and ifs1 cell lines shown in Figure S5. As shown in Figure 6A, the WT iPSCs readily differentiated into neurons as noted by the immunofluorescent detection of dendritic MAP2. Whereas the number of dendrites per cell was marginally reduced in the eIF2γ-fs neurons (Figure 6B), more substantial differences were noted in dendritic branching. The number of branches per dendrite was significantly reduced in the mutant neurons (Figure 6C), and Sholl analysis, measuring dendritic branches intersecting concentric circles centered around the soma, revealed that the mutation significantly altered the complexity of the dendritic arbor in neurons derived from mutant iPSCs compared to controls (Figures 6D). Importantly, the dendritic branching phenotypes were rescued by differentiating the mutant iPSC-derived neurons in the presence of ISRIB (Figures 6A,C & D), supporting the notion that eIF2 function is critical for robust neuronal differentiation.
Figure 6. ISRIB rescues neuronal differentiation defects caused by the eIF2γ-fs mutation.

(A) Immunofluorescent images of day 23–25 differentiated isogenic eIF2γ (iWT1*) and eIF2γ-fs (ifs1*) neurons derived from isogenic iWT1 and ifs1 iPSCs (Figure S5) and engineered to express NGN2. Fixed cells were probed with anti-MAP2 antibody (dendrites; red) and stained with DAPI (soma, blue). Scale bar (white) = 50 μm. Representative neurite tracings are presented to the right.
(B-D) Dendritic quantification and Sholl analysis of differentiated neurons from panel A. *ifs1* values statistically different from iWT1* NT; #ifs1* ISRIB values statistically different from ifs1* NT, p<0.05 (n = 63).
DISCUSSION
As noted by its name, MEHMO syndrome is characterized by a diverse array of symptoms including intellectual disability (ID), epilepsy, hypogonadism, microcephaly, and obesity. Xlinked ID is a hallmark of the disease; however, as more patients with mutations in EIF2S3 are being identified, it is becoming clear that the severity of ID is variable. Moreover, recent reports have noted additional symptoms associated with EIF2S3 mutations in some patients including hypopituitarism and glucose dysregulation (Gregory et al., 2019). How mutations in an essential housekeeping protein required for general protein synthesis can lead to specific, yet distinct, tissue-specific phenotypes is an intriguing question. Here, we show that in addition to impairing general translation, the eIF2γ-fs mutation derepresses translation of the ATF4, CHOP, and GADD34 mRNAs via altered uORF-dependent translational control. While translational derepression of these three mRNAs is typically associated with down-regulation of eIF2 activity following phosphorylation of eIF2α as part of the ISR (Figure 7) (Young and Wek, 2016), we propose that the eIF2γ-fs mutation impairs eIF2 function and thereby mimics constitutive eIF2α phosphorylation and leads to a chronic activation of the ISR. Moreover, the mutation leads to hyperactivation of the ISR and apoptosis under stress conditions (Figure 7), perhaps contributing to the debilitating symptoms in MEHMO syndrome. Intriguingly, ATF4 induction via phosphorylation of eIF2α has previously been linked to regulation of learning and memory in mice (Costa-Mattioli et al., 2005; Costa-Mattioli et al., 2007), raising the possibility that altered ATF4 expression underlies the ID symptoms in MEHMO syndrome.
Figure 7. Model for molecular mechanisms underlying the eIF2γ-fs translational and cellular phenotypes.

Top panel, NT: The eIF2γ-fs mutation impairs eIF2 heterotrimer formation through decreased eIF2α binding to eIF2γ. Impaired eIF2 complex integrity reduces the level of eIF2 TC in the cell, causing a decrease in global protein synthesis and translational upregulation of ISR members, such as ATF4. Lowered levels of protein synthesis and chronic expression of ISR members in the mutant primes the cell for an elevated cellular stress response.
Middle panel, TG: eIF2α-P in eIF2γ cells results in decreased eIF2 TC levels, reduced global protein synthesis, and upregulation of the ISR. TG treatment of eIF2γ-fs iPSCs results in a further decrease in eIF2 TC levels through the combined action of impaired eIF2 complex integrity and eIF2α–P. Sustained low levels of eIF2 TC exacerbates the eIF2γ-fs-mediated translation initiation defect, while concomitantly further upregulating expression of ATF4 and other ISR members. Chronically low levels of protein synthesis and elevated ISR signaling enhances expression and signaling of pro-apoptotic factors, culminating in cell death.
Bottom panel, ISRIB: ISRIB rescues the effects of defective eIF2 complex integrity by promoting enhanced eIF2-GDP to eIF2-GTP exchange on the available eIF2 heterotrimers. ISRIB treatment restores eIF2 TC formation and rescues the cell proliferation, global and gene-specific translational phenotypes caused by the eIF2γ-fs mutation.
MEHMO syndrome, reduced eIF2 TC levels, and rescue by ISRIB
While four families have been reported with the eIF2γ-fs mutation, four additional disease causing missense mutations in eIF2γ (I222T, S108R, I259M, and P432S) have been described (Borck et al., 2012; Gregory et al., 2019; Moortgat et al., 2016; Skopkova et al., 2017). Intriguingly, the eIF2γ-I222T mutation impaired eIF2 heterotrimer formation through a decrease in eIF2β binding to eIF2γ (Borck et al., 2012), while the eIF2γ-I259M mutation impaired Met-tRNAiMet binding to eIF2 (Young-Baird et al., 2019). Biochemical defects have yet to be associated with the S108R and P432S mutations in eIF2γ. In addition, an eIF2γ-V151L mutation was identified in a large-scale X-chromosome sequencing project for families with X-linked intellectual disability (Tarpey et al., 2009); however, given the nature of the study it is not clear whether the patient exhibits additional symptoms of MEHMO syndrome. Genetic studies of the comparable yeast mutations for the I222T, I259M, P432S, V151L, and I465Sfs*4 mutations revealed induced expression of GCN4, the yeast equivalent of ATF4 (Borck et al., 2012; Gregory et al., 2019; Skopkova et al., 2017; Young-Baird et al., 2019). As translational induction of GCN4 expression relies on a similar uORF-mediated mechanism as described for ATF4 (Hinnebusch, 2005), these genetic results indicate that all of these eIF2γ mutations either reduce eIF2 TC levels or impair TC binding to the ribosome. Consequently, bolstering eIF2 TC levels by enhancing eIF2B activity with ISRIB treatment might be an effective therapy for MEHMO patients independent of their specific eIF2γ mutation.
The translation defects associated with the eIF2γ-fs mutation can be attributed to defective eIF2 complex assembly. Co-immunoprecipitation assays (Figure 4B & S3A) revealed that the eIF2γ-fs mutation impaired binding of eIF2α to eIF2γ that could be rescued, in part, by overexpression of eIF2α (Figure 4C). This defect in eIF2 complex integrity is not due to alteration of the eIF2α interaction site on eIF2γ, as previous structural, genetic and biochemical experiments demonstrated that the C-terminal domain of eIF2α binds to a loop that projects out of domain II of eIF2γ and that is remote from the C-terminal location of the eIF2γ-fs mutation (Hashem et al., 2013; Hussain et al., 2014; Roll-Mecak et al., 2004; Yatime et al., 2006, 2007). Instead, we propose that the eIF2γ-fs mutation alters the interaction of the chaperone CDC123 with eIF2γ. Previous studies in yeast established that CDC123 interacts with eIF2γ (GCD11) and the interaction site was mapped to the C-terminus of eIF2γ (Bieganowski et al., 2004; Perzlmaier et al., 2013). Moreover, CDC123 was shown to facilitate eIF2α binding to eIF2γ (Perzlmaier et al., 2013). Here, we show that along with decreased levels of eIF2 heterotrimers, the eIF2γ-fs mutation results in increased binding of CDC123 to both eIF2γ and eIF2α. These data extend the function of CDC123 in eIF2 complex assembly to mammalian cells and reveal CDC123 binding to eIF2α. As previous studies in yeast indicated that eIF2γ and eIF2β assemble co-translationally (Shiber et al., 2018), we propose that CDC123 interacts with both eIF2α and the eIF2βγ complex and, perhaps via dimerization, promotes formation of the eIF2αβγ heterotrimer. Accordingly, the eIF2γ-fs mutation impairs eIF2 complex assembly by altering the binding site for CDC123 such that the chaperone can no longer efficiently promote eIF2 complex assembly.
Addition of the small molecule ISRIB provided near complete rescue of the cell growth, translational, and neuronal differentiation defects associated with the eIF2γ-fs mutation (Figures 5–7). As expected for a drug that increases the activity of eIF2B, the guanine nucleotide exchange factor for eIF2, ISRIB did not rescue eIF2 complex assembly, but did partially rescue TC formation in the eIF2γ-fs iPSCs (Figure 5D). A simple hypothesis to explain the rescue by ISRIB is that enhancing eIF2B activity increases the fraction of GTP-bound eIF2 complexes and thereby restores translational activity. A more complex model takes into account the critical role of eIF2α for interaction with eIF2B. Previous studies demonstrated that in yeast the eIF2α subunit can be deleted upon overexpression of the remaining TC components (eIF2β, eIF2γ, Met-tRNAiMet) and introduction of a point mutation in eIF2γ that decreases guanine nucleotide binding (Erickson et al., 2001). This point mutation mimics the function of eIF2B, thus leading to the interpretation that eIF2α is required for interaction with eIF2B. Consistent with this interpretation, eIF2βγ complexes had a higher Km for interaction with eIF2B than intact eIF2 complexes (Nika et al., 2001). In light of this role for eIF2α facilitating the interaction of eIF2 with eIF2B, the altered eIF2 complex assembly in the eIF2γ-fs mutant might impair guanine nucleotide exchange in a manner that can be rescued by ISRIB enhancement of functional eIF2B decamer formation. Further insights into the mechanism of ISRIB rescue of the eIF2γ-fs mutation will require purification of mutant forms of mammalian eIF2, a difficult task because mammalian eIF2 cannot be produced recombinantly in bacteria
MEHMO Syndrome and VWM disease
In addition to MEHMO syndrome, a second neurological disease has a clear link to translation initiation. Vanishing White Matter (VWM) disease is caused by mutations in any of the five subunits of eIF2B, the guanine nucleotide exchange factor for eIF2 (Leegwater et al., 2001). As the name describes, VWM is a leukoencephalopathy characterized by abnormalities of cerebral white matter. Patients also exhibit ataxia and spasticity and there is oftentimes an exacerbation of symptoms following stress such as fever or head trauma (Bugiani et al., 2018). Mutations in eIF2B, as found in VWM disease, limit guanine nucleotide exchange on eIF2 and therefore are expected to result in reduced eIF2 activity, the same general impact as the MEHMO mutations in eIF2. Thus, it is unclear why patients with VWM disease and MEHMO syndrome have such distinct symptoms. However, VWM mutations are expected to have greatest impact in tissues where eIF2B is limiting, while MEHMO mutations by directly targeting eIF2 can alter not only the levels but also the function of eIF2 TCs. Accordingly, it is noteworthy that yeast models of MEHMO syndrome mutations show heightened levels of translation initiation at non-AUG codons, presumably due to a defect in start codon recognition caused by the eIF2γ mutation (Borck et al., 2012; Gregory et al., 2019; Skopkova et al., 2017; Young-Baird et al., 2019). Thus, VWM disease may be principally caused by reduced TC levels, whereas MEHMO syndrome may be caused by the combination of reduced TC levels and heightened initiation at nearcognate start codons with attendant alterations to the cellular proteome.
While MEHMO patient symptoms are described prenatally and in the first few months of life, a clinical study of 83 individuals with VWM disease-causing eIF2B mutations found that the average age of VWM disease onset was 3.9 years, with oldest reported age of diagnosis as 30 years old (Borck et al., 2012; Fogli et al., 2004; Gregory et al., 2019; Moortgat et al., 2016; Skopkova et al., 2017). Additionally, as mentioned above, many VWM patients are diagnosed following a stressful event such as a fever or head trauma that results in rapid patient deterioration (Fogli and Boespflug-Tanguy, 2006; Leegwater et al., 2001; van der Knaap et al., 1997). Consistent with the presentation of patient symptoms, studies using VWM patient cells have found that while the eIF2B mutations reduce basal GEF activity, the impact of the eIF2B mutations on protein synthesis is not apparent until cells are treated with a stress agent (Kantor et al., 2005; Li et al., 2004; Pavitt, 2018; Richardson et al., 2004). Phosphorylation of eIF2α in combination with a VWM mutation in eIF2B triggers a heightened ISR, exemplified by low levels of global translation and elevated expression of the ISR members. We show here that the MEHMO patient iPSCs exhibit a basally elevated ISR that is further enhanced during cellular stress. The differences in activation of the ISR between MEHMO and VWM patient cells suggests that while both eIF2γ and eIF2B mutations decrease eIF2 TC levels, the extent of the eIF2 TC reduction is likely different between the two types of mutations. As the magnitude and duration of ISR signaling has been shown to play a critical role in the determination of cell fate (Guan et al., 2017), the overall level of eIF2 TCs and the timing of ISR induction in VWM and MEHMO syndrome could play a critical role in the presentation of patient symptoms.
Finally, the neuronal differentiation defect in the eIF2γ-fs iPSCs supports the notion that the ID symptoms of MEHMO syndrome can likely be attributed directly to the eIF2γ mutation rather than to glycemic and other systemic effects of the mutations. The rescue of the neuronal differentiation defect by ISRIB (Figure 6) is noteworthy given the known property of ISRIB to enhance cognitive memory in mice (Sidrauski et al., 2013). In addition, ISRIB and functionally related compounds (Wong et al., 2019; Wong et al., 2018) have recently been shown to suppress phenotypes caused by VWM disease mutations in eIF2B in mice. Our results suggest that ISRIB and related compounds that increase TC levels could also be of benefit to patients with MEHMO syndrome or other disorders affecting eIF2 function.
STAR METHODS
CONTACT FOR REAGENT AND RESOURCE SHARING
Please direct requests for further information or reagents to the lead contact, Thomas E. Dever (thomas.dever@nih.gov).
EXPERIMENTAL MODEL AND SUBJECT DETAILS
iPSC Reprogramming and Culture Conditions
The use of human material in this study has been approved by the ethical committee of the University of Tuebingen (Nr. 638/2013BO1) and in compliance with the guidelines of the Federal Government of Germany and the Declaration of Helsinki concerning Ethical Principles for Medical Research Involving Human Subjects. Human induced pluripotent stem cells (iPSCs) were derived from keratinocytes isolated from two male individuals: a MEHMO patient expressing mutant eIF2γ, and an individual expressing WT eIF2γ. Patient and WT control keratinocytes were isolated from plucked hair that presented with a healthy outer root sheath and reprogrammed to iPSCs as previously described (Raab et al., 2014; Raab et al., 2017). On day 1 of iPSC reprogramming, keratinocytes plated on Matrigel coated 6-well plates were infected with 2.5×10⁸ viral copies of STEM CCA OKSM-dTomato lentivirus in FTDA culture medium supplemented with 10μM ROCK Inhibitor and 8μg/mL polybrene. Cells were incubated overnight, and the media change and infection procedure from day 1 was repeated on day 2. On day 3, infected keratinocytes were distributed equally into 6-well plates on mitotically inactivated rat embryonic fibroblast (REF) feeder cells. REF feeder cells were mitotically inactivated after incubation of 1.5×10⁴ REFs with 7.5μg/mL mitomycin for 2.5 h. During reprogramming, cells were cultured in Knockout-DMEM, 20% knockout serum replacement, 1% antibiotic-antimycotic, 100μM NEAA, 1% GlutaMax, 50mM β-mercaptoethanol, 50μg/mL L-Ascorbic acid, 10ng/mL FGF2, and 10μM ROCK Inhibitor in a 5% CO2 and 5% O2 incubator at 37°C. Culture medium was changed every other day. After three weeks, iPSC colonies that had arisen were mechanically transferred with a pipette tip to one well of a 6-well dish in FTDA medium. After the establishment of clonal iPSC cultures, cells were grown in Matrigel coated 60 × 15mm tissue culture plates with 3mL of mTeSR1 medium in a 5% CO2 and 5% O2 incubator at 37°C. iPSC cell culture medium was replaced daily with fresh mTeSR1 medium.
Routine Passaging of iPSC Colonies
iPSCs were washed with 3mL of DMEM/F-12, followed by the addition of 2mL Dispase dissociation reagent, and incubation of plates at 37°C for 7 min. Following incubation, Dispase was aspirated off the iPSCs, and cells were washed twice with 3mL of DMEM/F-12 each wash. 3mL of mTeSR1 medium was added to the plates, and iPSC colonies were gently detached by scrapping with a cell scrapper. Additional mTeSR1 was added to dilute the iPSCs as necessary, and cells were plated in Matrigel coated plates as described above.
iPSC Colony Dissociation into Single Cell Suspension
For experiments requiring a cell monolayer, iPSCs were washed with 3mL of DMEM/F-12, followed by the addition of 0.5mL Accutase dissociation reagent, and incubation of plates at 37°C for 5–10 min until cells were dissociated into a single cell suspension. Dissociated cells were diluted in 10mL DMEM/F-12 and transferred to a 15mL conical tube. Cells were pelleted by centrifugation at 300×g for 5 min at room temperature and resuspend in mTeSR1 as required for subsequent plating on Matrigel coated plates.
Cell Freezing
Cells were dissociated as described above with Dispase dissociation reagent. Following two washes of 3mL DMEM/F-12, 5mL of DMEM/F-12 was added to the plate, and cells were gently detached with a cell scrapper. Cells were then transferred to a 15mL conical tube and pelleted at 300×g for 5 min at room temperature. Cells were resuspended in 1mL Cryostem Freezing Media, transferred to, and subsequently frozen in CryoTube Vials that were placed in a Cryo 1°C Freezing Container (Nalgene) at −80°C. Cells were left at −80°C for at least two days before being transferred to a liquid nitrogen dewar for long-term storage.
Cell Thawing
A CryoTube Vial was placed on dry ice for short-term transfer to a 37°C water bath, in which cells were rapidly thawed. The thawed cells were transferred to a 15mL conical tube containing 10mL of DMEM/F-12 and pelleted at 300×g for 5 min at room temperature. iPSCs were resuspended in 3mL of mTeSR1 with 10μM ROCK inhibitor and plated in 60 × 15mm tissue culture plates coated with Matrigel. The media was exchanged for fresh mTeSR1 medium without ROCK inhibitor 24 h after plating
Microbe Strains
Generation of all DNA constructs was conducted using DH5α Escherichia coli grown at 37°C either on LB plates or in LB liquid culture. Liquid cultures were shaken at 250RPM.
METHOD DETAILS
Polysome Profiling by Sucrose Gradient Ultracentrifugation
Polysome profiling was conducted as previously described (Teske et al., 2011). In brief, iPSCs grown in a 60 × 15mm dish were left untreated or treated with 1μM thapsigargin for 0.5, 1.5, or 3 h followed by incubation in fresh mTeSR1 medium containing 50μg/mL of cycloheximide for 10 min just prior to lysate collection. Cells were subsequently transferred to ice and washed twice with 3mL 1X PBS containing 50μg/mL cycloheximide. Cells were lysed with 0.5mL passive lysis buffer (20mM Tris-HCl, pH 7.5; 100mM NaCl; 10mM MgCl2; 0.4% NP-40; 50μg/mL cycloheximide; and 1 cOmplete, EDTA-free protease inhibitor cocktail tablet), detached with a cell scrapper, and collected in microcentrifuge tubes placed on ice. The cell lysate was passed through a 1mL syringe 10 times using a 25-gauge needle, and cell debris was pelleted by centrifugation for 10 min at 13,000RMP and 4° The concentration of each cell lysate was determined, and lysates were diluted to equal A260 units. 300μL was removed from the top of a 10–50% sucrose gradient (20mM Tris-HCl, pH 7.5; 100mM NaCl; 10mM MgCl2; 0.4% NP-40; and 50μg/mL cycloheximide), made using a BioComp Gradient Master, and 400μL of the cell lysate supernatant was gently layered on the top of the gradient. Ultracentrifugation of the sucrose gradients was conducted using a SW41 Ti rotor at 40,000RPM and 4°C for 2 h. Sucrose gradients were fractionated and whole cell lysate polysome profiles were collected using a BioComp Gradient Fractionator and a 254-nm UV monitor. Sucrose gradient fractions were immediately stored at −80°C until RNA processing as described below.
Translational Profiling by Puromycin Incorporation
iPSCs were seeded in a monolayer at 5×10⁴ cells/well in Matrigel coated 24-well plates and incubated overnight. Cells were then left untreated or treated with either 1μM thapsigargin in mTeSR1 for 3 h or 200nM ISRIB in mTeSR1 medium for 12 h. The Click-iT Plus OPP Alexa Fluor 594 Protein Synthesis Assay Kit was used to measure translation levels by incubating cells in 500μL 20μM Click-iT OPP Reagent (Component A) diluted in mTeSR1, either with or without the drug treatments listed above, for 30 min. Cells were then fixed with 500μL per well of 3.7% formaldehyde in 1X PBS, permeabilized with 500μL per well of 0.5% Triton X-100 in 1X PBS, and incubated with the Click reaction reagents per the manufacturer’s instructions. Measurements of newly synthesized peptides, in which puromycin had been incorporated, were conducted using a Tecan Spark with the fluorescent excitation/emission maxima set to 590/615nm.
Growth Assays
iPSCs were seeded in a monolayer at 5000 cells/well in Matrigel coated 96-well plates and cultured for 6 h to allow cells to adhere to the culture dish. Cells were then left untreated or treated with 200nM ISRIB in mTeSR1 for an additional 24, 48, or 72 h. The cell culture media was subsequently replaced with 100μL fresh mTeSR1 containing 200nM ISRIB and 2.5μg/mL Hoechst 33332, and cells were incubated for 30 min. Measurements of Hoechst fluorescence, as an indicator of cell density, were conducted using a Tecan Spark with the fluorescent excitation/emission maxima set to 350/461nm.
Cell Viability Assays
For Caspase 3/7 Assays, iPSCs were seeded in a monolayer at 5×10⁴ cells/well in Matrigel coated 24-well plates and incubated overnight. Cells were then left untreated or treated with 1μM thapsigargin, 200nM ISRIB, or a combined thapsigargin and ISRIB treatment for 6 h. For ISRIB pretreatment experiments, cells were incubated with 200nM ISRIB for 12 h, followed by combined 1μM thapsigargin and 200nM ISRIB treatment for 6 h. The cell culture media was subsequently replaced with 500μL of 5μM CellEvent Caspase-3/7 Green Detection Reagent diluted in 1X PBS with 5% FBS, and cells were incubated for 30 min. Cleavage of the Caspase-3/7 Green Detection Reagent was measured using a Tecan Spark with the fluorescent excitation/emission maxima set to 502/530nm.
For TUNEL Assays, iPSCs were seeded in a monolayer at 2.5×10⁴ cells/well in Matrigel coated 24-well plates and incubated overnight. Cells were then left untreated or treated with 1μM thapsigargin for 24 h. Fixation and labeling of cells was conducted using the HT TiterTACS Assay Kit per the manufacturer’s protocol. Measurement of TUNEL levels, as an indicator of DNA fragmentations, were conducted using a Tecan Spark with the absorbance measurement set to 450nm.
Immunoblot Analyses
iPSCs grown in a 60 × 15mm dish were left untreated or treated with either 1μM thapsigargin in mTeSR1 for 3 h or 200nM ISRIB in mTeSR1 medium for 12 h. Cells were then dissociated from the tissue culture plate using Dispase dissociation reagent as described above, pelleted in a 15mL conical tube at 300×g for 5 min at 4°C, washed with 1X cold PBS, pelleted again at 300×g for 5 min at 4°C, and lysed by resuspension in 50μL RIPA (150mM NaCl; 5mM EDTA, pH 8.0; 50mM Tris-HCl, pH 8.0; 1% Triton X-100; 0.5% sodium deoxycholate; 0.1% SDS; and 1 cOmplete, EDTA-free protease inhibitor cocktail tablet). The lysate was then transferred to a microcentrifuge tube, incubated on ice for 5 min, and sonicated 10 times for 1 s each. Cell debris was pelleted by centrifugation at 13,000RPM for 10 min at 4°C, and the supernatant was collected into a new microcentrifuge tube on ice. The protein concentration of each lysate was determined using diluted Bio-Rad Protein Assay Dye Reagent Concentrate per the manufacturer’s protocol. Protein samples were normalized, mixed with SDS-sample buffer, and incubated at 70°C for 10 min. SDS-Page was conducted using the NuPAGE Electrophoresis System and NuPAGE 10% Bis-Tris minigels, with 10μg protein loaded per well. Gel transfer was conducted using the XCell II Blot Module, with a nitrocellulose membrane, according to the manufacturer’s instructions. Membranes were blocked in 5% milk in TBST, followed by incubation with primary antibodies overnight. The following day, membranes were washed 3 times in TBST for 10 min per wash, incubated in the appropriate secondary antibody (diluted 1:5,000), washed twice in TBST for 10 min each, and washed twice in TBS for 5 min each. Immunoblots were developed using Amersham ECL Prime Western Blotting Detection Reagent per the manufacturer’s instructions.
Plasmid Constructions
WT PTK-ATF4-Luc, PTK-CHOP-Luc, and PTK-GADD34-Luc were kindly provided by Ronald C. Wek (Indiana University School of Medicine, Indianapolis, Indiana, USA) and have been previously described (Palam et al., 2011; Vattem and Wek, 2004; Young et al., 2015). In brief, the cDNA segments encoding the Mus musculus 5’-leaders of ATF4, CHOP, and GADD34 were inserted between a TK-promoter and Firefly luciferase CDS in a derivative of plasmid pGL3. The resulting reporters contain the ATF4, CHOP, and GADD34 CDS start codons fused in-frame to a luciferase reporter. Site-directed mutagenesis was used to generate uORF start codon mutants of the PTK-ATF4-Luc, PTK-CHOP-Luc, and PTK-GADD34-Luc constructs that were sequenced to verify all nucleotide substitutions. Primer sequences used to generate the ATF4, CHOP, and GADD34 uORF start codon mutations are as follows: ATF4 uORF1 ATG to AGG forward, 5’-phospho-CTTGCGGCCACCAGGGCGTATTAGAGGCA-3’; ATF4 uORF1 ATG to AGG reverse, 5’-phospho-CCCTGCGGGAGGGGAAGAGGAAAGGGACAC-3’; ATF4 uORF2 ATG to AGG forward, 5’-CTAGGCCAGGGCGCTCTTCACGAAATCCAGCAGC-3’; ATF4 uORF2 ATG to AGG reverse, 5’-AAGAGCGCCCTGGCCTAGGCCGGTGG-3’; CHOP uORF ATG to AGG forward, 5’-phospho-CGATTATATCAGGTTGAAGAGGAGCGGGTGGCAG-3’; CHOP uORF ATG to AGG reverse, 5’-phospho-ACGTGTTAGAAGCTTATGCAGGGTCGC-3’; GADD34 uORF1 ATG to AGG forward, 5’-phospho-TTTGTGGAAGATTACAGGCGATATCCCG-3’; GADD34 uORF1 ATG to AGG reverse, 5’-phospho-CTCAGAGCAAGCTTATGCAGGGTCG-3’; GADD34 uORF2 ATG to ATA forward, 5’-GGCGACATAAACCCGCTGGCTTCGCG-3’; and GADD34 uORF2 ATG to ATA reverse, 5’-CAGCGGGTTTATGTCGCCCTCAGGCG-3’.
Plasmid Transfections
iPSCs were seeded in a monolayer at 2.5×10⁴ cells/well in Matrigel coated 24-well plates and incubated overnight. WT and uORF mutant PTK-ATF4-Luc, PTK-CHOP-Luc, and PTK-GADD34-Luc constructs were transiently transfected into cells at a concentration of 1μg, following the Lipofectamine 3000 manufacturer’s instructions. Culture media was exchanged for fresh mTeSR1 medium 8 h after transfection. In experiments in which cells were treated with ISRIB alone, culture media was exchanged 24 h following transfections for mTeSR1 either without drug treatment or containing 200nM ISRIB. The ISRIB alone treatment lasted for a total of 12 h before cell lysis. In experiments with combined ISRIB and thapsigargin treatments, culture media was exchanged 24 h following transfections for mTeSR1 without drug treatment or containing 200nM ISRIB, 0.1μM thapsigargin, or a combined ISRIB and thapsigargin treatment. The ISRIB, thapsigargin, and combined treatments lasted for a total of 6 h before cell lysis. Cell lysis procedures for both luciferase assays and mRNA measurements by qRT-PCR are described below.
Luciferase Assays
Cell lysis and luciferase assays were conducted following the Promega Dual-Luciferase Reporter Assay System protocol. In brief, tissue culture plates were transferred to ice, and cells were washed 2 times with 500μL cold 1X PBS. 100μL of the provided Passive Lysis Buffer was then added to cells, and culture plates were transferred to an orbital shaker with gentle shaking for 15 min. Lysates were transferred to microcentrifuge tubes placed on ice, and cell debris was pelleted by centrifugation at 13,000RPM for 2 min at 4°C. 20μL from each sample was added to one well of a white polystyrene 96-well plate, and luciferase measurements were conducted in a preprogrammed Centro XS LB 960 High Sensitivity Microplate Luminometer. For the luciferase activity measurements, 100μL of Luciferase Assay Reagent II was added to each well, followed by a 2 s delay, and a 10 s measurement period.
mRNA measurement by qRT-PCR
For mRNA measurements of transfected luciferase reporters, cells were plated as described above under Plasmid Transfections. Cell lysis was conducted by transferring tissue culture plates to ice, washing cells 2 times with 500μL 1X PBS, and incubating cells with 250uL TRIzol Reagent on ice for 5 min. Cells were gently detached with a cell scrapper, and transferred to microcentrifuge tubes on ice, followed by RNA isolation as described in the TRIzol Reagent protocol.
For measurements of endogenous mRNA levels, iPSCs were grown in a 60 × 15mm dish and either left untreated or treated with 1μM thapsigargin in mTeSR1 for 3 h. Tissue culture plates were then transferred to ice, and cells were washed 2 times with 2mL cold 1X PBS. 750μL TRIzol Reagent was added to each plate and incubated on ice for 5 min. Cells were gently detached with a cell scrapper, and transferred to microcentrifuge tubes on ice, followed by RNA isolation as described in the TRIzol Reagent protocol.
For measurements of endogenous mRNA levels from sucrose gradient fractions, gradients were first thawed on ice. 10ng/mL of Firefly luciferase control RNA was then spiked into 250μL from each fraction to generate polysome shifts for specific transcripts normalized to an exogenous RNA control. Samples were mixed with 750μL TRIzol LS Reagent on ice, and RNA isolation was conducted as described in the TRIzol LS Reagent protocol.
Single-strand cDNA synthesis from all types of mRNA samples (apart from mRNA isolated in the co-immunoprecipitation experiments described below) were conducted using 2μg of isolated total RNA and the SuperScript III First-Strand Synthesis SuperMix per the manufacturer’s instructions. Transcript levels were measured by qPCR with the manufacturer’s protocol for Brilliant III Ultra-Fast SYBR Green qPCR Master Mix on a Roche LightCycler 480 Instrument. Primers used for measuring transcripts are as follows: ATF4 forward, 5’-GGAGATAGGAAGCCAGACTACA-3’; ATF4 reverse, 5’-GGCTCATACAGATGCCACTATC-3’; CHOP forward, 5’-CAAGAGGTCCTGTCTTCAGATG-3’; CHOP reverse, 5’-GGGTCAAGAGTGGTGAAGATT-3’; GADD34 forward, 5’-GAACCTCTACTTCTGCCTTGTC-3’; GADD34 reverse, 5’-GTCTTCCTGGCTCCTTTACTTC-3’; ACTB forward, 5’-GGACCTGACTGACTACCTCAT-3’; ACTB reverse, 5’-CGTAGCACAGCTTCTCCTTAAT-3’; BIM forward, 5’-TCTGACTCTCGGACTGAGAAA-3’; BIM reverse, 5’-CTCGGTCACACTCAGAACTTAC-3’; BAX forward, 5’-TTGCTTCAGGGTTTCATCCA-3’; BAX reverse, 5’-ACACTCGCTCAGCTTCTTG-3’; CASP3 forward, 5’-GGTTCATCCAGTCGCTTTGT-3’; CASP3 reverse, 5’-CTCAAATTCTGTTGCCACCTTTC-3’; Firefly forward, 5’-GTGTTGGGCGCGTTATTTATC-3’; and Firefly reverse, 5’-TAGGCTGCGAAATGTTCATACT-3’. Relative mRNA levels were calculated using the ΔΔCT method in which either β-actin (ACTB) or Firefly luciferase mRNA levels were used for normalization.
Co-immunoprecipitation Experiments
In preparation for all co-immunoprecipitation experiments, antibodies were conjugated to magnetic Dynabeads M270 Epoxy (Cristea and Chait, 2011) the day prior to cell lysis. Antibodies were dialyzed in 1X PBS at 4°C for 2 h immediately prior to conjugation and were used at a concentration of 10μg antibody per 1mg of magnetic beads. During antibody dialysis, the needed amount of magnetic beads (0.75mg beads per co-immunoprecipitation) were transferred to a microcentrifuge tube, washed with 1mL of 0.1M sodium phosphate buffer (pH 7.4), vortexed for 30 s, and mixed for 15 min on a tube shaker at room temperature. The microcentrifuge tube was then placed on a magnet rack, and the supernatant was removed. The magnetic beads were washed a second time with 1mL of 0.1M sodium phosphate buffer (pH 7.4), vortexed for 30 s, and the supernatant was removed. The magnetic beads were subsequently resuspended in a reaction mix containing the dialyzed antibodies, 1M ammonium sulfate, and 0.1M sodium phosphate buffer (pH 7.4) added to reach equal volume between samples. Antibodies were conjugated to the magnetic beads overnight at 30°C with end-over-end rotation. The following day, the microcentrifuge tubes were placed on a magnetic rack and the supernatant was removed. The beads were then washed sequentially with 1mL of 0.1M sodium phosphate buffer (pH 7.4), 1mL of 100mM glycine-HCl, 1mL of 10mM Tris-HCl (pH 8.8), 1mL of 100mM trimethylamine, four 1mL washes of 1X PBS, 1mL of PBS with 0.5% Triton X-100 for 15 minutes, and 1mL of 1X PBS. The beads were then resuspended in 1mL of 1X PBS and stored at 4°C for a maximum of 45 min before incubation with cell lysates.
iPSCs used in co-immunoprecipitation experiments were grown in a 60 × 15mm dish and either left untreated or treated with 200nM ISRIB in mTeSR1 medium for 12 h. Cells were then dissociated from the tissue culture plate using Dispase dissociation reagent as described above, pelleted in a 15mL conical tube at 300g for 5 min at 4°C, washed with 1X cold PBS, pelleted again at 300×g for 5 min at 4°C, and lysed by resuspension in 100μL IP Lysis Buffer (150mM NaCl; 50mM Tris-HCl, pH 8.0; 1% Triton X-100; 100mM sodium fluoride; 50mM β-glycerophosphate; and 10mM sodium pyrophosphate). The lysate was then transferred to a microcentrifuge tube, incubated on ice for 5 min, and cell debris was pelleted by centrifugation at 13,000RPM for 10 min at 4°C. The supernatant was collected into a new microcentrifuge tube on ice, and the protein concentration of each lysate was determined using diluted Bio-Rad Protein Assay Dye Reagent Concentrate per the manufacturer’s protocol. For protein input samples, one quarter of the lysate was normalized, mixed with SDS-sample buffer, and incubated at 70°C for 10 min. For analysis of Met-tRNAiMet in input samples, one quarter of the lysate was normalized for protein levels and subjected to RNA isolation using TRIzol LS Reagent. For co-immunoprecipitation analysis, extracts were normalized for protein concentration by diluting the more concentrated extracts to match the protein level of the least concentrated extract in a total volume of at least 100uL. 100uL of each normalized extract was then mixed with 0.75mg of previously prepared magnetic beads and incubated for 2 h at 4°C with end-over-end rotation. At a constant temperature of 4°C, beads were placed on a magnetic rack, and the supernatant was removed, followed by three washes with 500μL IP Lysis Buffer. Protein and RNA were eluted by incubating the magnetic beads with either 40μL 1X SDS-Page sample buffer (without DTT) at room temperature for 10 min or 25μL TRIzol LS Reagent at room temperature for 5 min. Samples incubated with SDS-Page sample buffer were then placed on a magnetic rack, and the supernatant was removed to a new tube. DTT was added, and the samples were incubated at 70°C for 10 min. Input and co-immunoprecipitation protein samples were subjected to SDS-Page and immunoblotting as described above. RNA was isolated from the samples incubated with TRIzol LS Reagent following the manufacturer’s protocol.
As mentioned previously, RNA was extracted from both input and co-immunoprecipitation samples using the manufacturer’s protocol for TRIzol LS Reagent. Single-strand cDNA synthesis was conducted using the manufacturer’s protocol for SuperScript III First-Strand Synthesis SuperMix and the following Met-tRNAiMet specific reverse primer: 5’-TGCCCCCTCTGAGGTT-3’. 2μL of isolated total RNA was utilized in reverse transcription reactions for input samples, and all of the isolated RNA was utilized in the reverse transcription reactions for co-immunoprecipitation samples. PCR reactions of input and co-immunoprecipitation samples were conducted using REDTaq ReadyMix PCR Reaction Mix with 1μL 5μM forward primer, 1μL 5μM reverse primer, and 1μL reverse transcription products in a total volume of 25μL. Primers used in PCR reactions are as follows: Met-tRNAiMet forward, 5’-GCCTCGTTAGCGCAGT-3’; and Met-tRNAiMet reverse, 5’-TGCCCCCTCTGAGGTT-3’. PCR was performed under the following conditions: (1) 94°C for 2 min; (2) 25 cycles of 94°C for 30 s; 56°C for 30 s; and 72°C for 30 s; and (3) 72°C for 5 min. Reactions products were resolved by gel electrophoresis on a 2.5% agarose gel and stained with GelRed Nucleic Acid Stain.
Generation of Isogenic iPSCs
CRISPR/Cas9 genomic editing was used to generate isogenic eIF2γ and eIF2γ-I465Sfs*4 iPSCs. For targeting of Cas9 to the EIF2S3 locus, a gRNA sequence (5’-GGTTGGGGTCAGATAAGAAG-3’) close to MEHMO patient TCAA mutation was selected using the online program: crispr.mit.edu. The gRNA was cloned into all-in-one CRISPR/Cas9 vector expressing high-fidelity eCas9 (pCAG-eCas9-GFP=U6-gRNA, Addgene # 79145). A TCAA-correcting ssODN (5’-AACCCCTTGGTTGTTAAGAGGAATTCCAACTTCCAAATCCATCCGAATGTATTATTT AACTGGTATTCTTCAGTCATCATCTACTGTTGGCTTGATTGTCACTCCGCGGCGTATCTGACCCCAACCAATTAAActgcaaaatgaaaa) was designed to repair deletion of 4bp TCAA sequence (shown in bold; reverse complementary sequence) in patient iPSCs. A silent mutation (underlined) was also introduced to prevent re-cutting by CRISPR/Cas9 after gene editing that generated a unique SacII site for restriction fragment length polymorphism screening of gene-edited clones. Another control ssODN that is identical to the TCAA-correcting ssODN except that it lacks the 4bp TCAA sequence (5’-AACCCCTTGGTTGTTAAGAGGAATTCCAACTTCCAAATCCATCCGAATGTATTATTT AACTGGTATTCTTCAGTCATCATCTACTGTTGGCTTGTCACTCCGCGGCGTATCTGACCCCAACCAATTAAActgcaaaatgaaaa) was used to create a control patient iPSC line. 1 million mutant iPSCs were transfected with 3ug CRISPR/Cas9 vector and 3ug ssODN following the standard lipofectamine 3000 protocol. 48 hours after transfection, GFP+ transfected iPSCs were sorted, recovered, and subcloned by limiting dilution to 1 cell/96-well on Matrigel coated plates with E8 medium plus 10uM ROCK Inhibitor. Gene-edited clones were screened by PCR using primers 5’-TGGTAATGAGAGTGAAGTGGATGT-3’ and 5’-ACTTCCAAATCCATCCGAATGTA-3’ and digestion by SacII. ssODN-mediated gene-editing generated two smaller bands (86bp and 77bp) rather than a single 163bp band, as observed by gel electrophoresis. The PCR product sequence was also confirmed by Sanger sequencing.
Generation of Cortical Neurons
TALEN-mediated genomic integration of NGN2 and mCherry transgenes into the AAVS1 safe harbor locus was conducted as previously described (Fernandopulle et al., 2018). In brief, 1.5 million iPSCs were transfected following the standard lipofectamine 3000 protocol with 1.5ug NGN2 + mCherry donor vector and 0.75ug each of two TALEN vectors with sequences specific to AAVS1. Cells were cultured and expanded for one week after transfection and monitored for mCherry expression as an indicator of NGN2 and mCherry genomic integration. mCherry expressing iPSCs were subcloned by limiting dilution to 1 cell/96-well on Matrigel coated plates with mTeSR1 plus 10μM ROCK inhibitor. Cells were subsequently expanded and gene-edited clones were screened by PCR using primers 5’-GGAATCTGCCTAACAGGAGGT-3’, 5’-CGGTTAATGTGGCTCTGGTT-3’ and 5’-CCCCCAGAATAGAATGACACC-3’ as described in (Fernandopulle et al., 2018). The sequences of the PCR products were confirmed by sequencing.
To induce neuronal differentiation, 20 million cells in single-cell suspension were plated on Matrigel coated plates in 18mL induction media (DMEM/F12, 1X N2 supplement, 1X non-essential amino acids, and 1X glutamine) plus 10μM ROCK inhibitor and 2μg/mL doxycycline. The spent media was replaced with 20mL induction media plus 2μg/mL doxycycline daily for three days. Three-day differentiated neurons were then either cryopreserved or split and plated on poly-L-ornithine and laminin coated plates or coverslips in cortical neuron culture medium (BrainPhys neuron medium, 1X B27 supplement, 10ng/mL BDNF, 10ng/mL GDNF, 10ng/mL NT-3, and 10μg/mL laminin) as described in (Fernandopulle et al., 2018). The neurons were cultured in cortical neuron culture medium for an additional 22 days before imaging and analyses.
Immunocytochemistry
Neurons grown on coverslips were washed with 1X PBS, followed by fixation in 4% paraformaldehyde in PBS for 20 min. Cells were washed three times with PBS at room temperature, permeabilized with 0.1% Triton X-100 in PBS for 15 min, washed again with PBS, and incubated in 4% normal goat serum in PBS for 1 h. Coverslips then were incubated with an antibody directed against MAP2 antibody (1:50) diluted in 4% normal goat serum in PBS overnight at 4 °C. The following day, the cells were washed in PBS with gentle agitation, and incubated with a rabbit Alexa Fluor 488 antibody (1:1000) for 1 h. Excess antibody was washed from the coverslips with PBS, which then were incubated with 300 nM DAPI for 3 min, before being mounted on microscope slides with ProLong Diamond Antifade Mountant. A representative sample of neurons was imaged on a coverslip using a Zeiss LSM 710 or Leica SP8 confocal microscope using a 40X/1.4-NA oil-immersion objective and a pinhole setting of 1. All images were acquired in 512 × 512 8-bit z stacks. The gain was set to avoid saturation and, once determined, imaging settings were maintained across the experiment. Quantification of dendritic number and length was conducted using Fiji, and branching complexity was analyzed via the plugins ‘Simple Neurite Tracer’ and ‘Sholl Analysis’. Sholl analyses were conducted on z stacks using the number of intersections in incremental 10 μm concentric circles from the start point of the first trace.
QUANTIFICATION AND STATISTICAL ANALYSIS
Quantitative data represent the mean ± standard deviation derived from at least three biological replicates. Statistical significance was calculated using the two-tailed Student’s t test with a p-value threshold of p=0.05. Statistical significance following Sholl analysis was determined using a repeated measures two-way ANOVA. Statistically significant differences from the untreated eIF2γ control are indicated by an asterisk, and TG- or ISRIB-treated mutant values with statistically significant differences from the untreated eIF2γ-fs mutant are indicated by a pound sign. Unless noted, all experiments not requiring quantitative analysis were performed three or more times to confirm reproducibility.
Supplementary Material
KEY RESOURCES TABLE
| REAGENT or RESOURCE | SOURCE | IDENTIFIER |
|---|---|---|
| Antibodies | ||
| Rabbit Polyclonal anti-eIF2β/EIF2S2 | Bethyl | Cat#: A301–742A; RRID: AB_1210967 |
| Rabbit Polyclonal anti-eIF2α/EIF2S1 | Bethyl | Cat#: A300–721A; RRID: AB_2096512 |
| Rabbit Polyclonal anti-CDC123/C10orf7 | Bethyl | Cat#: A304–943A; RRID: AB_2621137 |
| Rabbit Polyclonal anti-eIF2γ | Thermo Fisher Scientific | Cat#: PA5–31177; RRID: AB_2548651 |
| Mouse Monoclonal anti-CHOP | Thermo Fisher Scientific | Cat#: MA1–250; RRID: AB_2292611 |
| Rabbit Monoclonal anti-ATF4 | Cell Signaling Technology | Cat#: 11815S; RRID: AB_2616025 |
| Rabbit Polyclonal anti-IgG | Cell Signaling Technology | Cat#: 2729S; RRID: AB_1031062 |
| Rabbit Polyclonal anti-GADD34/PPP1R15A | Proteintech | Cat#: 10449–1-AP; RRID: AB_2168724 |
| Rabbit Polyclonal anti-PPP1R15B | Proteintech | Cat#: 14634–1-AP; RRID: AB_2300036 |
| Rabbit Monoclonal anti-EIF2S1 (phospho S51) | Abcam | Cat#: ab32157; RRID: AB_732117 |
| Mouse Monoclonal anti-β-actin | Sigma-Aldrich | Cat#: A5441; RRID: AB_476744 |
| Rabbit Polyclonal anti-MAP2 | Thermo Fisher Scientific | Cat#: PA5–17646; RRID: AB_11006358 |
| Bacterial and Virus Strains | ||
| DH5α Escherichia coli | New England BioLabs | Cat#: C2987H |
| Chemicals, Peptides, and Recombinant Proteins | ||
| Trans-ISRIB | Tocris | Cat#: 5285; CAS: 1597403-47-8 |
| Thapsigargin | Sigma-Aldrich | Cat#: T9033; CAS: 67526-95-8 |
| Y-27632 RHO/ROCK Pathway Inhibitor | Stemcell Technologies | Cat#: 72302; CAS: 129830-38-2 |
| L(+)-Ascorbic Acid | Carl Roth | Cat#: 3525; CAS: 50-81-7 |
| FGF-2 | Cell Guidance Systems | Cat#: GFH28 |
| Hoechst 33342, Trihydrochloride, Trihydrate | Thermo Fisher Scientific | Cat#: H1399; CAS: 23491-52-3 |
| Cycloheximide | Sigma-Aldrich | Cat#: C7698; CAS: 66-81-9 |
| Laminin | Thermo Fisher Scientific | Cat#: 23017015 |
| Recombinant BDNF | PeproTech | Cat#: 450–02 |
| Recombinant NT-3 | PeproTech | Cat#: 450–03 |
| Recombinant GDNF | PeproTech | Cat#: 450–10 |
| Critical Commercial Assays | ||
| Click-iT Plus OPP Alexa Fluor™ 594 Protein Synthesis Assay Kit | Thermo Fisher Scientific | Cat#: C10457 |
| CellEvent Caspase-3/7 Green Detection Reagent | Thermo Fisher Scientific | Cat#: C10423 |
| SuperScript III First-Strand SuperMix | Thermo Fisher Scientific | Cat#: 18080400 |
| Brilliant III Ultra-Fast SYBR Green qPCR Master Mix | Agilent | Cat#: 600882 |
| TiterTACS Colorimetric Apoptosis Detection Kit | Trevigen | Cat#: 4822–96-K |
| Dual-Luciferase Reporter Assay System | Promega | Cat#: E1960 |
| Deposited Data | ||
| Mendeley Database | This paper | http://dx.doi.org/10.17632/kv2sv5h6sx.1 |
| Experimental Models: Cell Lines | ||
| eIF2γ-WT WT1 iPSCs | This paper | N/A |
| eIF2γ-WT WT2 iPSCs | This paper | N/A |
| eIF2γ-I465Sfs*4 fs1 iPSCs | This paper | N/A |
| eIF2γ-I465Sfs*4 fs2 iPSCs | This paper | N/A |
| eIF2γ-WT iWT1 iPSCs | This paper | N/A |
| eIF2γ-WT iWT2 iPSCs | This paper | N/A |
| eIF2γ-I465Sfs*4 ifs1 iPSCs | This paper | N/A |
| eIF2γ-I465Sfs*4 ifs2 iPSCs | This paper | N/A |
| eIF2γ-WT iWT1* iPSCs/neurons | This paper | N/A |
| eIF2γ-I465Sfs*4 ifs1* iPSCs/neurons | This paper | N/A |
| Rat embryonic fibroblast | Linta et al., 2012 | N/A |
| Recombinant DNA | ||
| STEM CCA OKSM-dTomato Lentiviral Vector | Sommer et al., 2012 | N/A |
| PTK-ATF4-Luc | Vattem and Wek., 2004 | N/A |
| PTK-CHOP-Luc | Palam et al., 2011 | N/A |
| PTK-GADD34-Luc | Young et al., 2016 | N/A |
| pCAG-eCas9-GFP=U6-gRNA | Addgene | Addgene Plasmid #: 79145 |
| Other | ||
| Matrigel® hESC-Qualified Matrix, *LDEV-Free | Corning | Cat#: 354277 |
| Cryostem Freezing Media | ReproCell | Cat#: 01-0013-50 |
| mTeSR™1 | StemCell Technologies | Cat#: 85850 |
| Dispase (1U/mL) | StemCell Technologies | Cat#: 07923 |
| Accutase™ | StemCell Technologies | Cat#: 07920 |
| Lipofectamine 3000 | Thermo Fisher Scientific | Cat#: L3000008 |
| Trizol | Thermo Fisher Scientific | Cat#: 15596018 |
| Trizol LS | Thermo Fisher Scientific | Cat#: 10296028 |
| Dynabeads M270 Epoxy | Thermo Fisher Scientific | Cat#: 14301 |
| Luciferase Control RNA | Promega | Cat#: L4561 |
| cOmplete EDTA-free protease inhibitor cocktail | Sigma-Aldrich | Cat#: 11873580001 |
| Polybrene Infection/Transfection Reagent | Sigma-Aldrich | Cat#: TR-1003-G |
| B-27 Supplement (50X) | Thermo Fisher Scientific | Cat#: 17504044 |
| N-2 Supplement (100X) | Thermo Fisher Scientific | Cat#: 17502048 |
| BrainPhys Neuronal Medium | StemCell Technologies | Cat#: 05790 |
| MEM Non-essential amino acids (100X) | Thermo Fisher Scientific | Cat#: 11140050 |
| L-Glutamine | Thermo Fisher Scientific | Cat#: 25030081 |
| Poly-L-Ornithine | Sigma-Aldrich | Cat#: P4957–50ML |
HIGHLIGHTS.
MEHMO syndrome mutation eIF2γ-I465Sfs*4 in translation factor eIF2 activates the ISR
eIF2γ mutation disrupts chaperone CDC123 assembly of α subunit into eIF2 complex
MEHMO syndrome mutation impairs differentiation of iPSCs to neurons
ISRIB rescues growth, translation and neuronal differentiation defects of MEHMO iPSCs
ACKNOWLEDGMENTS
We thank Ronald Wek and Bobby Hogg for plasmids and use of instrumentation, Jizhong Zou and Kaari Linask of the NHLBI iPSC Core as well as the NHBLI Flow Cytometry Core for assistance in generating isogenic iPSCs, Vincent Schram and Lynne Holtzclaw of the NICHD Microscopy and Imaging Core for assistance with imaging and immunocytochemistry analysis, and Guntram Borck, Alan Hinnebusch, Jon Lorsch, Nick Guydosh, and members of the Dever, Hinnebusch, Lorsch, and Guydosh labs for helpful discussions. This work was supported by the Intramural Research Program of the National Institutes of Health, NICHD (T.E.D) and by grants from the DFG (DFG LI 2044/4–1 and DFG LI 2044/5–1 to S.L) and the NIH (NS034007, NS047384, and HD08201 to E.K.). S.K.Y.-B. was supported by a Postdoctoral Research Associate Training (PRAT) fellowship from the National Institute of General Medical Sciences, award number 1Fi2GM123961.
Footnotes
DECLARATION OF INTERESTS
Authors declare no competing interests.
Publisher's Disclaimer: This is a PDF file of an unedited manuscript that has been accepted for publication. As a service to our customers we are providing this early version of the manuscript. The manuscript will undergo copyediting, typesetting, and review of the resulting proof before it is published in its final form. Please note that during the production process errors may be discovered which could affect the content, and all legal disclaimers that apply to the journal pertain.
REFERENCES
- Baird TD, and Wek RC (2012). Eukaryotic initiation factor 2 phosphorylation and translational control in metabolism. Adv Nutr 3, 307–321. [DOI] [PMC free article] [PubMed] [Google Scholar]
- Bieganowski P, Shilinski K, Tsichlis PN, and Brenner C (2004). Cdc123 and checkpoint forkhead associated with RING proteins control the cell cycle by controlling eIF2γ abundance. J Biol Chem 279, 44656–44666. [DOI] [PubMed] [Google Scholar]
- Borck G, Shin BS, Stiller B, Mimouni-Bloch A, Thiele H, Kim JR, Thakur M, Skinner C, Aschenbach L, Smirin-Yosef P, et al. (2012). eIF2γ mutation that disrupts eIF2 complex integrity links intellectual disability to impaired translation initiation. Mol Cell 48, 641–646. [DOI] [PMC free article] [PubMed] [Google Scholar]
- Bugiani M, Vuong C, Breur M, and van der Knaap MS (2018). Vanishing white matter: a leukodystrophy due to astrocytic dysfunction. Brain Pathol 28, 408–421. [DOI] [PMC free article] [PubMed] [Google Scholar]
- Costa-Mattioli M, Gobert D, Harding H, Herdy B, Azzi M, Bruno M, Bidinosti M, Ben Mamou C, Marcinkiewicz E, Yoshida M, et al. (2005). Translational control of hippocampal synaptic plasticity and memory by the eIF2α kinase GCN2. Nature 436, 1166–1173. [DOI] [PMC free article] [PubMed] [Google Scholar]
- Costa-Mattioli M, Gobert D, Stern E, Gamache K, Colina R, Cuello C, Sossin W, Kaufman R, Pelletier J, Rosenblum K, et al. (2007). eIF2α phosphorylation bidirectionally regulates the switch from short- to long-term synaptic plasticity and memory. Cell 129, 195–206. [DOI] [PMC free article] [PubMed] [Google Scholar]
- Cristea IM, and Chait BT (2011). Conjugation of magnetic beads for immunopurification of protein complexes. Cold Spring Harb Protoc 2011, 534–537. [DOI] [PMC free article] [PubMed] [Google Scholar]
- Erickson FL, Nika J, Rippel S, and Hannig EM (2001). Minimum requirements for the function of eukaryotic translation initiation factor 2. Genetics 158, 123–132. [DOI] [PMC free article] [PubMed] [Google Scholar]
- Fernandopulle MS, Prestil R, Grunseich C, Wang C, Gan L, and Ward ME (2018). Transcription Factor-Mediated Differentiation of Human iPSCs into Neurons. Curr Protoc Cell Biol 79, e51. [DOI] [PMC free article] [PubMed] [Google Scholar]
- Fogli A, and Boespflug-Tanguy O (2006). The large spectrum of eIF2B-related diseases. Biochem Soc Trans 34, 22–29. [DOI] [PubMed] [Google Scholar]
- Fogli A, Schiffmann R, Bertini E, Ughetto S, Combes P, Eymard-Pierre E, Kaneski CR, Pineda M, Troncoso M, Uziel G, et al. (2004). The effect of genotype on the natural history of eIF2B-related leukodystrophies. Neurology 62, 1509–1517. [DOI] [PubMed] [Google Scholar]
- Gregory LC, Ferreira CB, Young-Baird SK, Williams HJ, Harakalova M, van Haaften G, Rahman SA, Gaston-Massuet C, Kelberman D, Gosgene, et al. (2019). Impaired EIF2S3 function associated with a novel phenotype of X-linked hypopituitarism with glucose dysregulation. EBioMedicine 42, 470–480. [DOI] [PMC free article] [PubMed] [Google Scholar]
- Guan BJ, van Hoef V, Jobava R, Elroy-Stein O, Valasek LS, Cargnello M, Gao XH, Krokowski D, Merrick WC, Kimball SR, et al. (2017). A Unique ISR Program Determines Cellular Responses to Chronic Stress. Mol Cell 68, 885–900. [DOI] [PMC free article] [PubMed] [Google Scholar]
- Harding HP, Novoa I, Zhang Y, Zeng H, Wek R, Schapira M, and Ron D (2000). Regulated translation initiation controls stress-induced gene expression in mammalian cells. Mol Cell 6, 1099–1108. [DOI] [PubMed] [Google Scholar]
- Hashem Y, des Georges A, Dhote V, Langlois R, Liao HY, Grassucci RA, Hellen CU, Pestova TV, and Frank J (2013). Structure of the mammalian ribosomal 43S preinitiation complex bound to the scanning factor DHX29. Cell 153, 1108–1119. [DOI] [PMC free article] [PubMed] [Google Scholar]
- Hinnebusch AG (2005). Translational regulation of GCN4 and the general amino acid control of yeast. Annu Rev Microbiol 59, 407–450. [DOI] [PubMed] [Google Scholar]
- Hinnebusch AG (2011). Molecular mechanism of scanning and start codon selection in eukaryotes. Microbiol Mol Biol Rev 75, 434–467. [DOI] [PMC free article] [PubMed] [Google Scholar]
- Hussain T, Llacer JL, Fernandez IS, Munoz A, Martin-Marcos P, Savva CG, Lorsch JR, Hinnebusch AG, and Ramakrishnan V (2014). Structural changes enable start codon recognition by the eukaryotic translation initiation complex. Cell 159, 597–607. [DOI] [PMC free article] [PubMed] [Google Scholar]
- Kantor L, Harding HP, Ron D, Schiffmann R, Kaneski CR, Kimball SR, and Elroy-Stein O (2005). Heightened stress response in primary fibroblasts expressing mutant eIF2B genes from CACH/VWM leukodystrophy patients. Hum Genet 118, 99–106. [DOI] [PubMed] [Google Scholar]
- Lee YY, Cevallos RC, and Jan E (2009). An upstream open reading frame regulates translation of GADD34 during cellular stresses that induce eIF2α phosphorylation. J Biol Chem 284, 6661–6673. [DOI] [PMC free article] [PubMed] [Google Scholar]
- Leegwater PAJ, Vermeulen G, Konst AAM, Naidu S, Mulders J, Visser A, Kersbergen P, Mobach D, Fonds D, van Berkel CGM, et al. (2001). Subunits of the translation initiation factor eIF2B are mutant in leukoencephalopathy with vanishing white matter. Nature Genet 29, 383–388. [DOI] [PubMed] [Google Scholar]
- Li W, Wang X, Van Der Knaap MS, and Proud CG (2004). Mutations linked to leukoencephalopathy with vanishing white matter impair the function of the eukaryotic initiation factor 2B complex in diverse ways. Mol Cell Biol 24, 3295–3306. [DOI] [PMC free article] [PubMed] [Google Scholar]
- Lu PD, Harding HP, and Ron D (2004). Translation reinitiation at alternative open reading frames regulates gene expression in an integrated stress response. J Cell Biol 167, 27–33. [DOI] [PMC free article] [PubMed] [Google Scholar]
- Moortgat S, Desir J, Benoit V, Boulanger S, Pendeville H, Nassogne MC, Lederer D, and Maystadt I (2016). Two novel EIF2S3 mutations associated with syndromic intellectual disability with severe microcephaly, growth retardation, and epilepsy. Am J Med Genet A 170, 2927–2933. [DOI] [PubMed] [Google Scholar]
- Nika J, Rippel S, and Hannig EM (2001). Biochemical analysis of the eIF2βγ complex reveals a structural function for eIF2α in catalyzed nucleotide exchange. J Biol Chem 276, 1051–1056. [DOI] [PubMed] [Google Scholar]
- Novoa I, Zeng H, Harding HP, and Ron D (2001). Feedback inhibition of the unfolded protein response by GADD34-mediated dephosphorylation of eIF2α. J Cell Biol 153, 1011–1021. [DOI] [PMC free article] [PubMed] [Google Scholar]
- Palam LR, Baird TD, and Wek RC (2011). Phosphorylation of eIF2 Facilitates Ribosomal Bypass of an Inhibitory Upstream ORF to Enhance CHOP Translation. J Biol Chem 286, 10939–10949. [DOI] [PMC free article] [PubMed] [Google Scholar]
- Panvert M, Dubiez E, Arnold L, Perez J, Mechulam Y, Seufert W, and Schmitt E (2015). Cdc123, a Cell Cycle Regulator Needed for eIF2 Assembly, Is an ATP-Grasp Protein with Unique Features. Structure 23, 1596–1608. [DOI] [PubMed] [Google Scholar]
- Pavitt GD (2018). Regulation of translation initiation factor eIF2B at the hub of the integrated stress response. Wiley Interdiscip Rev RNA 9, e1491. [DOI] [PubMed] [Google Scholar]
- Perzlmaier AF, Richter F, and Seufert W (2013). Translation initiation requires cell division cycle 123 (Cdc123) to facilitate biogenesis of the eukaryotic initiation factor 2 (eIF2). J Biol Chem 288, 21537–21546. [DOI] [PMC free article] [PubMed] [Google Scholar]
- Raab S, Klingenstein M, Liebau S, and Linta L (2014). A Comparative View on Human Somatic Cell Sources for iPSC Generation. Stem Cells Int 2014, 768391. [DOI] [PMC free article] [PubMed] [Google Scholar]
- Raab S, Klingenstein M, Moller A, Illing A, Tosic J, Breunig M, Kuales G, Linta L, Seufferlein T, Arnold SJ, et al. (2017). Reprogramming to pluripotency does not require transition through a primitive streak-like state. Sci Rep 7, 16543. [DOI] [PMC free article] [PubMed] [Google Scholar]
- Richardson JP, Mohammad SS, and Pavitt GD (2004). Mutations causing childhood ataxia with central nervous system hypomyelination reduce eukaryotic initiation factor 2B complex formation and activity. Mol Cell Biol 24, 2352–2363. [DOI] [PMC free article] [PubMed] [Google Scholar]
- Roll-Mecak A, Alone P, Cao C, Dever TE, and Burley SK (2004). X-ray structure of translation initiation factor eIF2γ: implications for tRNA and eIF2α binding. J Biol Chem 279, 10634–10642. [DOI] [PubMed] [Google Scholar]
- Rutkowski DT, Arnold SM, Miller CN, Wu J, Li J, Gunnison KM, Mori K, Sadighi Akha AA, Raden D, and Kaufman RJ (2006). Adaptation to ER stress is mediated by differential stabilities of pro-survival and pro-apoptotic mRNAs and proteins. PLoS Biol 4, e374. [DOI] [PMC free article] [PubMed] [Google Scholar]
- Sekine Y, Zyryanova A, Crespillo-Casado A, Fischer PM, Harding HP, and Ron D (2015). Stress responses. Mutations in a translation initiation factor identify the target of a memory-enhancing compound. Science 348, 1027–1030. [DOI] [PMC free article] [PubMed] [Google Scholar]
- Shiber A, Doring K, Friedrich U, Klann K, Merker D, Zedan M, Tippmann F, Kramer G, and Bukau B (2018). Cotranslational assembly of protein complexes in eukaryotes revealed by ribosome profiling. Nature 561, 268–272. [DOI] [PMC free article] [PubMed] [Google Scholar]
- Sidrauski C, Acosta-Alvear D, Khoutorsky A, Vedantham P, Hearn BR, Li H, Gamache K, Gallagher CM, Ang KK, Wilson C, et al. (2013). Pharmacological brake-release of mRNA translation enhances cognitive memory. Elife 2, e00498. [DOI] [PMC free article] [PubMed] [Google Scholar]
- Sidrauski C, McGeachy AM, Ingolia NT, and Walter P (2015a). The small molecule ISRIB reverses the effects of eIF2α phosphorylation on translation and stress granule assembly. Elife 4, e05033. [DOI] [PMC free article] [PubMed] [Google Scholar]
- Sidrauski C, Tsai JC, Kampmann M, Hearn BR, Vedantham P, Jaishankar P, Sokabe M, Mendez AS, Newton BW, Tang EL, et al. (2015b). Pharmacological dimerization and activation of the exchange factor eIF2B antagonizes the integrated stress response. Elife 4, e07314. [DOI] [PMC free article] [PubMed] [Google Scholar]
- Skopkova M, Hennig F, Shin BS, Turner CE, Stanikova D, Brennerova K, Stanik J, Fischer U, Henden L, Muller U, et al. (2017). EIF2S3 Mutations Associated with Severe X-Linked Intellectual Disability Syndrome MEHMO. Hum Mutat 38, 409–425. [DOI] [PMC free article] [PubMed] [Google Scholar]
- Tabas I, and Ron D (2011). Integrating the mechanisms of apoptosis induced by endoplasmic reticulum stress. Nat Cell Biol 13, 184–190. [DOI] [PMC free article] [PubMed] [Google Scholar]
- Tahmasebi S, Khoutorsky A, Mathews MB, and Sonenberg N (2018). Translation deregulation in human disease. Nat Rev Mol Cell Biol 19, 791–807. [DOI] [PubMed] [Google Scholar]
- Tarpey PS, Smith R, Pleasance E, Whibley A, Edkins S, Hardy C, O’Meara S, Latimer C, Dicks E, Menzies A, et al. (2009). A systematic, large-scale resequencing screen of X-chromosome coding exons in mental retardation. Nat Genet 41, 535–543. [DOI] [PMC free article] [PubMed] [Google Scholar]
- Teske BF, Baird TD, and Wek RC (2011). Methods for analyzing eIF2 kinases and translational control in the unfolded protein response. Methods Enzymol 490, 333–356. [DOI] [PubMed] [Google Scholar]
- Teske BF, Fusakio ME, Zhou D, Shan J, McClintick JN, Kilberg MS, and Wek RC (2013). CHOP induces activating transcription factor 5 (ATF5) to trigger apoptosis in response to perturbations in protein homeostasis. Mol Biol Cell 24, 2477–2490. [DOI] [PMC free article] [PubMed] [Google Scholar]
- Tsai JC, Miller-Vedam LE, Anand AA, Jaishankar P, Nguyen HC, Renslo AR, Frost A, and Walter P (2018). Structure of the nucleotide exchange factor eIF2B reveals mechanism of memory-enhancing molecule. Science 359, eaaq0939. [DOI] [PMC free article] [PubMed] [Google Scholar]
- van der Knaap MS, Barth PG, Gabreels FJ, Franzoni E, Begeer JH, Stroink H, Rotteveel JJ, and Valk J (1997). A new leukoencephalopathy with vanishing white matter. Neurology 48, 845–855. [DOI] [PubMed] [Google Scholar]
- Vattem KM, and Wek RC (2004). Reinitiation involving upstream ORFs regulates ATF4 mRNA translation in mammalian cells. Proc Natl Acad Sci U S A 101, 11269–11274. [DOI] [PMC free article] [PubMed] [Google Scholar]
- Walter P, and Ron D (2011). The unfolded protein response: from stress pathway to homeostatic regulation. Science 334, 1081–1086. [DOI] [PubMed] [Google Scholar]
- Wek RC (2018). Role of eIF2a Kinases in Translational Control and Adaptation to Cellular Stress. Cold Spring Harb Perspect Biol 10, a032870. [DOI] [PMC free article] [PubMed] [Google Scholar]
- Wong YL, LeBon L, Basso AM, Kohlhaas KL, Nikkel AL, Robb HM, Donnelly-Roberts DL, Prakash J, Swensen AM, Rubinstein ND, et al. (2019). eIF2B activator prevents neurological defects caused by a chronic integrated stress response. Elife 8, e42940. [DOI] [PMC free article] [PubMed] [Google Scholar]
- Wong YL, LeBon L, Edalji R, Lim HB, Sun C, and Sidrauski C (2018). The small molecule ISRIB rescues the stability and activity of Vanishing White Matter Disease eIF2B mutant complexes. Elife 7, e32733. [DOI] [PMC free article] [PubMed] [Google Scholar]
- Yatime L, Mechulam Y, Blanquet S, and Schmitt E (2006). Structural switch of the γ subunit in an archaeal aIF2αγ heterodimer. Structure 14, 119–128. [DOI] [PubMed] [Google Scholar]
- Yatime L, Mechulam Y, Blanquet S, and Schmitt E (2007). Structure of an archaeal heterotrimeric initiation factor 2 reveals a nucleotide state between the GTP and the GDP states. Proc Natl Acad Sci U S A 104, 18445–18450. [DOI] [PMC free article] [PubMed] [Google Scholar]
- Yelick PC, and Trainor PA (2015). Ribosomopathies: Global process, tissue specific defects. Rare Dis 3, e1025185. [DOI] [PMC free article] [PubMed] [Google Scholar]
- Young SK, Palam LR, Wu C, Sachs MS, and Wek RC (2016). Ribosome Elongation Stall Directs Gene-specific Translation in the Integrated Stress Response. J Biol Chem 291, 6546–6558. [DOI] [PMC free article] [PubMed] [Google Scholar]
- Young SK, and Wek RC (2016). Upstream Open Reading Frames Differentially Regulate Gene-specific Translation in the Integrated Stress Response. J Biol Chem 291, 16927–16935. [DOI] [PMC free article] [PubMed] [Google Scholar]
- Young SK, Willy JA, Wu C, Sachs MS, and Wek RC (2015). Ribosome Reinitiation Directs Gene-specific Translation and Regulates the Integrated Stress Response. J Biol Chem 290, 28257–28271. [DOI] [PMC free article] [PubMed] [Google Scholar]
- Young-Baird SK, Shin BS, and Dever TE (2019). MEHMO syndrome mutation EIF2S3-I259M impairs initiator Met-tRNAiMet binding to eukaryotic translation initiation factor eIF2. Nucleic Acids Res 47, 855–867. [DOI] [PMC free article] [PubMed] [Google Scholar]
- Zinszner H, Kuroda M, Wang X, Batchvarova N, Lightfoot RT, Remotti H, Stevens JL, and Ron D (1998). CHOP is implicated in programmed cell death in response to impaired function of the endoplasmic reticulum. Genes Dev 12, 982–995. [DOI] [PMC free article] [PubMed] [Google Scholar]
- Zyryanova AF, Weis F, Faille A, Alard AA, Crespillo-Casado A, Sekine Y, Harding HP, Allen F, Parts L, Fromont C, et al. (2018). Binding of ISRIB reveals a regulatory site in the nucleotide exchange factor eIF2B. Science 359, 1533–1536. [DOI] [PMC free article] [PubMed] [Google Scholar]
Associated Data
This section collects any data citations, data availability statements, or supplementary materials included in this article.