Abstract
Purpose
We propose a deep learning-based image interpretation system for skeleton segmentation and extraction of hot spots of bone metastatic lesion from a whole-body bone scintigram followed by automated measurement of a bone scan index (BSI), which will be clinically useful.
Methods
The proposed system employs butterfly-type networks (BtrflyNets) for skeleton segmentation and extraction of hot spots of bone metastatic lesions, in which a pair of anterior and posterior images are processed simultaneously. BSI is then measured using the segmented bones and extracted hot spots. To further improve the networks, deep supervision (DSV) and residual learning technologies were introduced.
Results
We evaluated the performance of the proposed system using 246 bone scintigrams of prostate cancer in terms of accuracy of skeleton segmentation, hot spot extraction, and BSI measurement, as well as computational cost. In a threefold cross-validation experiment, the best performance was achieved by BtrflyNet with DSV for skeleton segmentation and BtrflyNet with residual blocks. The cross-correlation between the measured and true BSI was 0.9337, and the computational time for a case was 112.0 s.
Conclusion
We proposed a deep learning-based BSI measurement system for a whole-body bone scintigram and proved its effectiveness by threefold cross-validation study using 246 whole-body bone scintigrams. The automatically measured BSI and computational time for a case are deemed clinically acceptable and reliable.
Keywords: Computer-aided interpretation, Deep learning, Bone scintigram, Bone metastatic lesion, Bone scan index
Introduction
Radionuclide imaging is a useful means of examining patients who may have metastasis of the prostate, breast or lung cancers, which are common cancers globally [1, 2]. A typical screening method is bone scintigraphy, which uses Tc-99 m-methylene diphosphonate (MDP) [3] or Tc-99 m-hydroxymethylene diphosphonate (HMDP) [4] agents. Because visual interpretation of the bone scintigram lacks quantitative and reproducible diagnosis, quantitative indices have been proposed. Soloway et al. [5] proposed the extent of disease (EOD), which categorises bone scan examinations into five grades based on the number of bone metastases. It is simple but not suitable for detailed diagnosis. Erdi et al. [6] proposed the bone scan index (BSI), which standardises the assessment of bone scans [7], and they presented a region growing-based semiautomated bone metastatic lesion extraction method to measure the BSI. However, the method is time-consuming and less reproducible because seed regions must be manually inputted.
Yin et al. [8] proposed a lesion extraction algorithm using the characteristic point-based fuzzy inference system. Huang et al. [9] presented a bone scintigram segmentation algorithm followed by lesion extraction using adaptive thresholding with different cut-offs in different segmented regions. An alternative approach for lesion extraction was proposed by Shiraishi et al. [10], who presented a temporal subtraction-based interval change detection algorithm. Sajn et al. [11] proposed a classification method to classify a bone scan examination into no pathology or pathology using support vector machine with features derived from segmented bones. Sadik et al. [12–14] presented several algorithms which addressed skeleton segmentation, hot spot detection and classification of bone scan examinations. The algorithms in [12] were improved, where an active shape model (ASM) was employed for skeleton segmentation and an ensemble of three-layer perceptrons was introduced for hot spot detection [13], whose performance was evaluated with 35 physicians in [14].
It should be noted that the aforementioned studies [8–14] conducted hot spot detection and bone scan classification but did not assess BSI. One of the possible reasons for this might be low accuracy in the automated skeleton segmentation. For example, previous studies [8, 9] outputted polygonal regions, which roughly approximated bone regions. Although the skeleton segmentation performance in the previous study [12] was improved [13] by the use of ASM, it was found to be sensitive to the initial position of the model and image noise. In addition, the whole skeleton could be divided into only four parts, each of which included several different bones. This type of approximation will degrade the accuracy of the measured BSI because coefficients as given in the ICRP publication [15] used in the measurement differ in bones.
Some of the aforementioned problems have been solved using the atlas-based approach [16], in which a manually segmented atlas consisting of more than ten bones was nonlinearly registered to an input image, and labels in the deformed atlas were transferred to the image. The atlas-based approach was also employed in other studies [17–23], as were the commercialised computer-aided interpretation systems EXINIbone (EXINI Diagnostics AB, Lund, Sweden) and BONENAVI (FUJIFILM Toyama Chemical Co., Ltd., Tokyo, Japan). Accurate skeleton segmentation allows precise measurement of BSI [18] and accurate classification of bone scintigrams [17, 19–21]. Ulmet et al. [18] reported that the correlation between manual and automated BSI was 0.80 using EXINIbone. Horikoshi et al. [17] and Koizumi et al. [21] evaluated the performance of BONENAVI and Pertersen et al. [20] explored the performance of EXINIbone to demonstrate their effectiveness. Nakajima et al. [19] compared EXINIbone and BONENAVI using a Japanese multi-centre database. Brown et al. [22, 23] employed an atlas-based anatomical segmentation and proposed a new biomarker used in the commercially available system (MedQIA, Los Angeles, USA). The atlas-based segmentation is a promising approach but suffers from the problems of initial positioning of the atlas and differences in shape, direction and size between the atlas and skeleton of an input image. These problems might be solved by a multi-atlas-based approach [24]. However, it is a time-consuming process, which is not acceptable for clinical use.
Deep learning-based approaches have recently emerged in the field of medical image analysis [25]. This was initiated by the great success of an image recognition competition [26]. Numerous novel technologies [27–32] have been reported. For example, U-Net-type fully convolutional networks [28, 29] are some of the most successful networks for medical image segmentation, which might be useful for skeleton segmentation and extraction of hot spots of bone metastatic lesion.
This study presents a system consisting of skeleton segmentation and extraction of hot spots of bone metastatic lesion followed by BSI measurement. We employed a deep learning-based approach to achieve high accuracy in skeleton segmentation and hot spot extraction. One of the reasons for the low accuracy of skeleton segmentation and hot spot extraction in existing studies [6, 8, 14, 16–21] may be that anterior and posterior images have been independently processed, thus resulting in the inconsistent results. We used a butterfly-type network (BtrflyNet) [30] which fuses two U-Nets into a single network which can process anterior and posterior images simultaneously. Because a deep and complicated network might be problematic for the training process, we introduced deep supervision (DSV) [31] and residual learning [32], both of which are effective at avoiding gradients vanishing or exploding during the training of a deep network. We conducted the experiment using 246 cases of prostate cancer and demonstrated the effectiveness of the proposed system by comparing it with conventional approaches, namely multi-atlas-based skeleton segmentation and U-Net-based hot spot extraction.
Methods
Bone scintigraphy
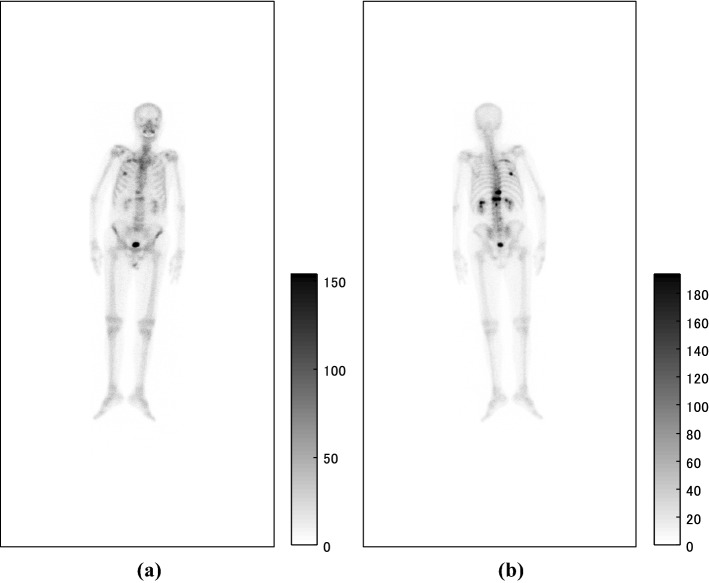
Inputs of the proposed system were anterior and posterior bone scintigrams as shown in Fig. 1, the sizes of which were 512 × 1024 pixels. The imaging systems were ‘VERTEX PLUS, ADAC’, ‘FORTE, ADAC’ and ‘BRIGHTVIEW X, Philips’ equipped with collimators named ‘VXGP’, ‘LEHR’ and ‘LEHR’, respectively. The energy peak was centred at 140 keV with a 10% window. The whole body was scanned for approximately ten minutes about 3 h after the intravenous injection of Tc-99 m-HMDP (555–740 MBq, Nihon Medi-Physics Co., Ltd, Tokyo, Japan), and the scan speed was 20 cm/min.
Fig. 1.
Pair of input a anterior and b posterior images
Outline of skeleton segmentation
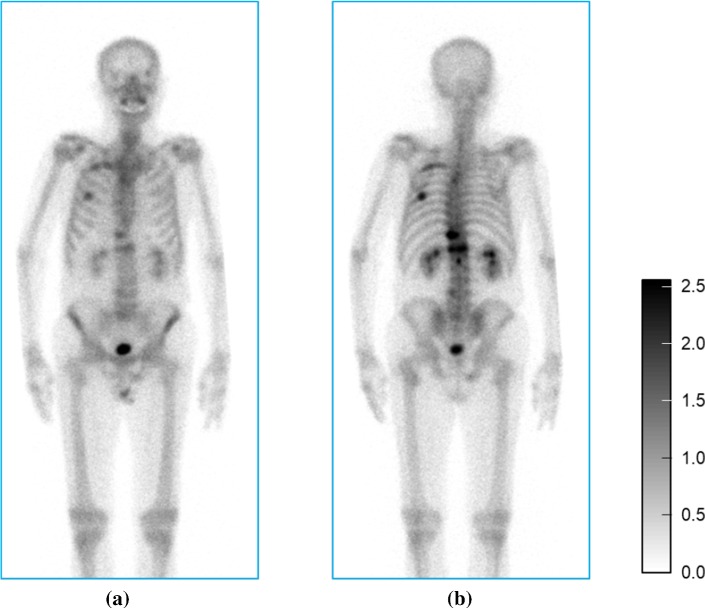
First, the posterior image was flipped horizontally and aligned to the anterior image for simultaneous segmentation. Second, spatial standardisation consisting of rotation, scaling and translation was applied to both the anterior and posterior images to ensure the body axis was parallel to a vertical axis of the image. The length from the top of head to the tip of the toe was 2000 mm. Third, grey-scale normalisation was performed for both images independently using the following equation.
| 1 |
where is an input grey value, is the upper th percentile and is the golden ratio. Central regions of the images (Fig. 2) were then forwarded to the trained BtrflyNet. Inverse transformation of the spatial standardisation and the alignment of the posterior image were performed to transfer the segmentation labels to the input images.
Fig. 2.
Spatially standardised a anterior and b posterior images with normalised grey values from Fig. 1 for skeleton segmentation
Outline of hot spot extraction
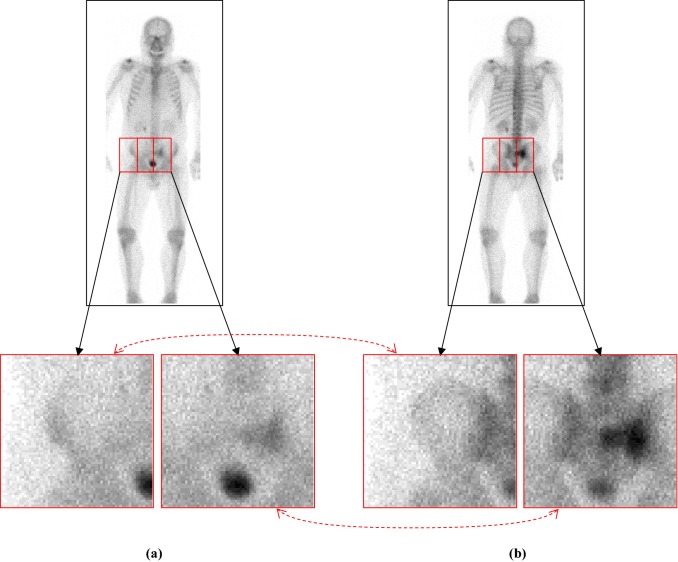
First, a mask of a human was generated by applying a 3 3 pixel median filter and thresholding (1: I 4, 0: else) followed by opening and closing operations. (The structural element was a circle with radius of 2 pixel.) Second, grey-scale normalisation and registration between posterior and anterior images were conducted, both of which were the same as those in the skeleton segmentation. The image was then evenly divided into patch images of 64 64 pixel at every 32-pixel interval (Fig. 3).
Fig. 3.
Pair of a anterior and b posterior patches with normalised grey values. Dotted red arrows indicate the correspondence between the two patches
Patch images that contained one or more pixels in the human mask were forwarded to the trained BtrflyNet for hot spot extraction. Finally, patch images with the extracted hot spots were integrated into an output image whose size was equal to that of the input image.
BtrflyNets
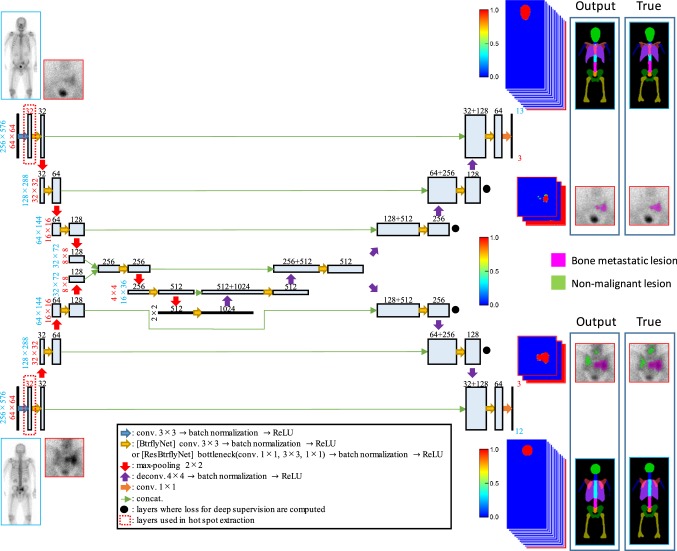
BtrflyNets for skeleton segmentation and hot spot extraction are different networks but are nonetheless similar. Major differences exist in terms of the sizes of input and output images as well as the number of output layers. Skeleton segmentation input was a pair of anterior and posterior images of a whole body, and hot spot extraction input was a pair of anterior and posterior patch images. Output of anterior skeleton consisted of 13 layers corresponding to 12 bones (skull, cervical vertebrae, thoracic vertebrae, lumbar vertebrae, sacrum, pelvis, ribs, scapula, humerus, femur, sternum and clavicle) and background. Outputs of posterior skeleton were 12 layers for ten bones (skull, cervical vertebrae, thoracic vertebrae, lumbar vertebrae, sacrum, pelvis, rib, scapula, humerus and femur) and background. Note that one output layer in the posterior was for overlapped regions of the rib and scapula. Output for hot spot extraction was consisted of three layers each of which corresponded to a hot spot of bone metastatic lesion, hot spot of non-malignant lesion (e.g., fracture, infection) and others (e.g., physiological renal uptake, radioactive isotope distribution of bladder and background). In addition, sizes of feature maps of the BtrflyNets were different because of the size differences of input images. In Fig. 4, numbers of output layers and the sizes of feature maps are shown in blue for skeleton segmentation and in red for hot spot extraction. Furthermore, the BtrflyNet for hot spot extraction had an additional layer following the input layer enclosed by dotted red squares. This additional layer derives from improvement by residual blocks [32] which is described later.
Fig. 4.
BtrflyNet for skeleton segmentation and hot spot extraction. Parameters of the network are listed, where blue numbers denote skeleton segmentation, red numbers indicate hot spot extraction and black numbers are common parameters for both networks. Note that the sizes of feature maps for the decoder part of the BtrflyNet are the same as those of the encoder part
Loss functions
The loss functions to be minimised in the training of skeleton segmentation and hot spot extraction are given as follows.
Skeleton segmentation
| 2 |
where n and c are indices of pixel and class (= bone metastatic lesion, non-malignant lesion and others) and N and C are total numbers of pixels and classes, respectively. In addition, is the softmax of output of the network and denotes the true label in which the pixel value of the organ of interest is 1 and other is 0. Finally, is a tiny value to prevent zero division.
| 3 |
Hot spot extraction
| 4 |
where is a weight of class c to reduce the influence by the difference in the number of pixels.
| 5 |
Improvements of networks
DSV [31] is introduced for skeleton segmentation, in which loss functions are computed at not only output layers but also at four layers neighbouring to output layers and as indicated by black dots in Fig. 4. Loss is a summation of the generalised Dice losses at the six layers.
Residual blocks [32] are used instead of convolutions and deconvolutions in the BtrflyNet for hot spot extraction. The improved BtrflyNet is called ResBtrflyNet in this study.
Outputs of the system
The proposed system outputs segmented bones and detected hot spots, all of which are determined by using probability in output layers of the trained BtrflyNets. The skeleton segmentation selects labels with a maximum at each pixel. The hot spot extraction employs the threshold value of the following equation so that the sensitivity per hot spot of bone metastatic lesion is 0.9.
| 6 |
where at the overlapped area of neighbouring patch images is computed by averaging of the two patches.
The BSI is measured using segmented bones and extracted hot spots of bone metastatic lesions [18]. First, the correspondence between the bones and hot spots is determined. Second, a ratio between the area of the extracted hot spots and that of the corresponding bone is measured, and the weight fraction constant as given in the ICRP publication [15] is multiplied with the ratio. Finally, a summation of all values is outputted as BSI.
Experimental set-up
The experiment was approved by the Ethics Committee at Osaka City University (Approval No. 3831) and Tokyo University of Agriculture and Technology (Approval No.30-30, 30-43). The total number of bone scintigrams was 246, derived from Japanese males with prostate cancer whose ages were from 52 to 95 (average: 72.8, standard deviation: 6.96). The dataset was divided into three groups to conduct threefold cross-validation. We also prepared a validation dataset to determine an optimal training iteration to avoid overtraining. In summary, 164 scans were for training, 41 for validation and 41 for testing. Because the validation and testing datasets were switched in onefold, we obtained test results from 246 total scans. The number of anterior and posterior patch pairs for onefold in training the hot spot extraction network was approximately 0.7 million.
Initialisation and optimisation of the networks
In the training process, He’s initialisation [33] was used to initialise all weights of the networks. The loss functions were minimised using adaptive moment estimation (Adam) [34]. The detailed parameters are given as follows.
Skeleton segmentation
The parameters of Adam were set to α = 0.001, β = 0.9, γ = 0.999 and ε = 10−8. Note that α was decreased by one-tenth at the 1350th iteration in which the batch size was 6. The maximum number of iterations was set to 1620, and the optimal number of iterations was determined when the average Dice score from (7) of the validation dataset reached the maximum. The tiny value of ε from (2) was set to 0.001.
Hot spot extraction
The parameters of Adam were set to α = 0.001, β = 0.9, γ = 0.999 and ε = 10−8, where the batch size was 256. Augmentation was conducted by flipping an input image horizontally with a probability of 0.5. The maximum number of iterations was set to 50,000, and the optimal number of iterations was determined when the total number of misclassified pixels of the validation dataset was at the minimum.
Performance evaluation
The Dice score between the segmented bone region and true region was computed to evaluate the performance of skeleton segmentation.
| 7 |
where denotes the number of pixels in the region. The sensitivity of hot spot detection, the numbers of false positive pixels and regions (8-connectivity) were used to evaluate hot spot extraction. Note that true regions of bones and hot spots were manually delineated by medical engineers and approved by medical doctors at the Department of Nuclear Medicine at the university hospital.
Results
Skeleton segmentation
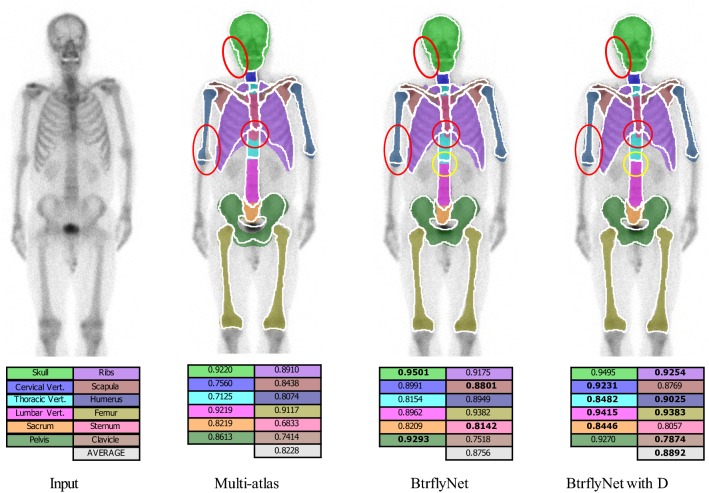
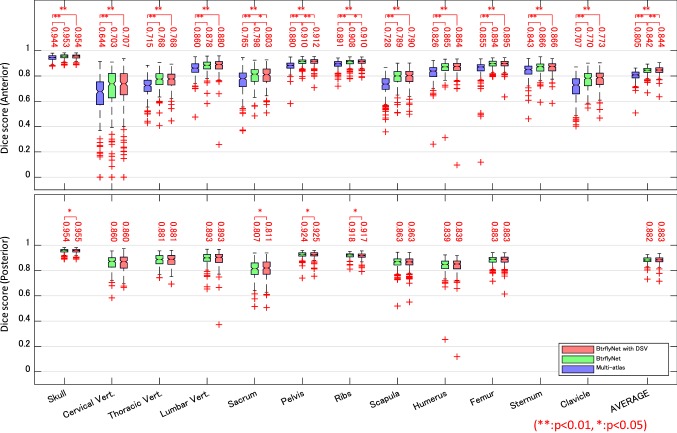
Figure 5 presents the typical results of skeleton segmentation, and Fig. 6 shows Dice scores for all test cases. Note that the multi-atlas-based approach [24] employed B-spline-based non-rigid registration of 164 atlases from the training dataset and only anterior images were segmented because of high computational cost.
Fig. 5.
Typical results of skeleton segmentation. White lines and coloured regions are boundaries of true and segmented bone regions, respectively. Numbers denote Dice scores of bones in which the highest Dice scores among the three methods are bolded
Fig. 6.
Dice scores of skeleton segmentation. Numbers indicate the median of scores. Statistical test was conducted by a Wilcoxon signed-rank test with the null hypothesis of ‘there is no difference in performance between the two methods’
Hot spot extraction
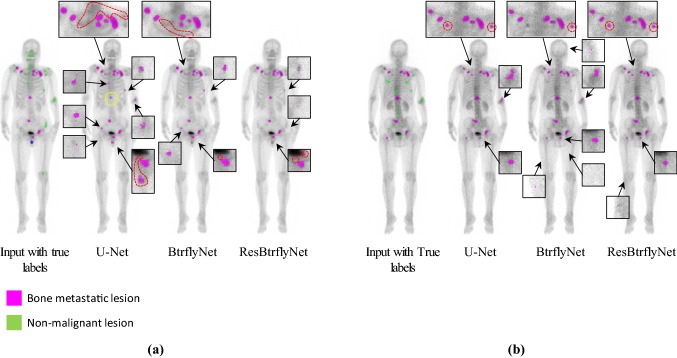
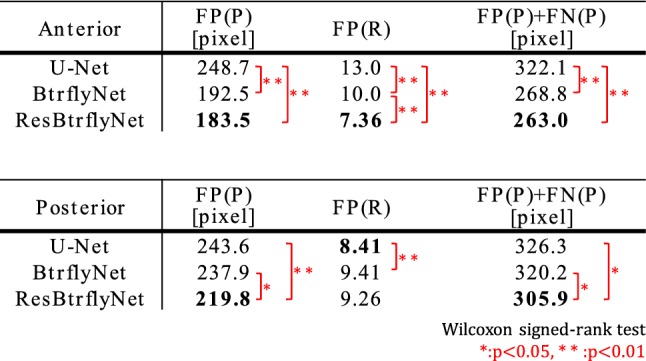
Figure 7 shows the typical extraction results of hot spots of bone metastatic lesions when the sensitivity per hot spot of bone metastatic lesion was 0.9. Table 1 presents the number of false positive pixels, false positive regions and misclassified pixels by U-Net, BtrflyNet and ResBtrflyNet.
Fig. 7.
Typical extraction results of hot spots of bone metastatic lesions in a anterior and b flipped posterior images. False positives close to true bone metastatic lesions are circled by red dots, and a false negative is circled by yellow dots
Table 1.
Average number of false positive pixels, false positive regions (8-connectivity) and misclassified pixels ({“false positives”} ∪ {“false negatives”}) when sensitivity per hot spot of bone metastatic lesion was 0.9
Measurement of BSI
Figure 8 compares automatically measured BSI with true BSI, which was computed using true regions of bones and hot spots of bone metastatic lesions.
Fig. 8.
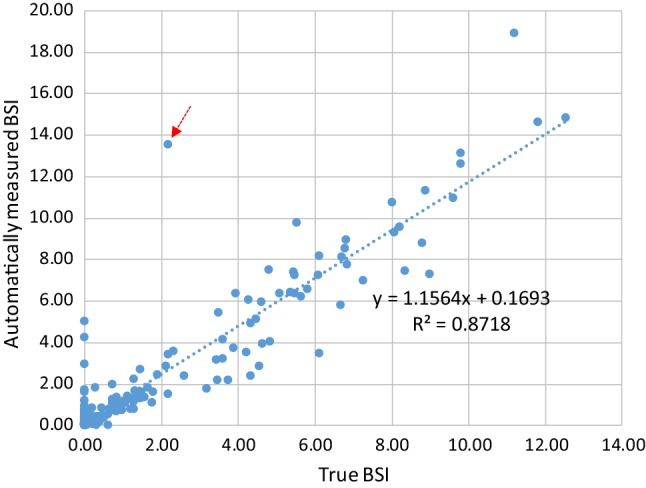
Relationship between automatically measured BSI and true BSI
Computational cost
Average computation time for each test case was measured using a computer with 24 threads based on 41 cases for skeleton segmentation and five cases for hot spot extraction. The computer specifications were: OS: Ubuntu 16.04, CPU: Xeon Silver 4116. 12 Cores, 24 Threads, 2.10 GHz 2, Memory: 196 GB.
Skeleton segmentation (without pre- and post-processes)
Multi-atlas (anterior image only) = 5287 s.
BtrflyNet (or BtrflyNet with DSV) = 16 s.
Hot spot extraction
U-Nets = 70 s.
BtrflyNet = 63 s.
ResBtrflyNet = 94 s.
Discussion
Skeleton segmentation
The red circles in Fig. 5 show typical errors in segmentation by the multi-atlas-based method because of atypical shapes or directions of the skull, right humerus and sternum. Figure 6 suggests that the multi-atlas-based method was inferior to BtrflyNet-based approaches for all organs, and the differences were statistically significant.
An example of the improvement gained by DSV is indicated by the yellow circle in Fig. 5. Figure 6 indicates that BtrflyNet with DSV was superior to the naïve BtrflyNet for nine out of 12 bones in an anterior image and three out of ten bones in a posterior image. Statistical differences were observed for three bones each in anterior and posterior images. By contrast, the rib in a posterior image was the only bone for which the naïve BtrflyNet was statistically superior. Therefore, we concluded that BtrflyNet with DSV was the best in our experiment. The main reason may have been lower loss during training. Figure 9 shows transitions of training losses at the output layers, where the red line of the BtrflyNet with DSV was lower than the blue line of the naïve BtrflyNet, which suggests that the DSV was effective at reducing loss in the training data.
Fig. 9.
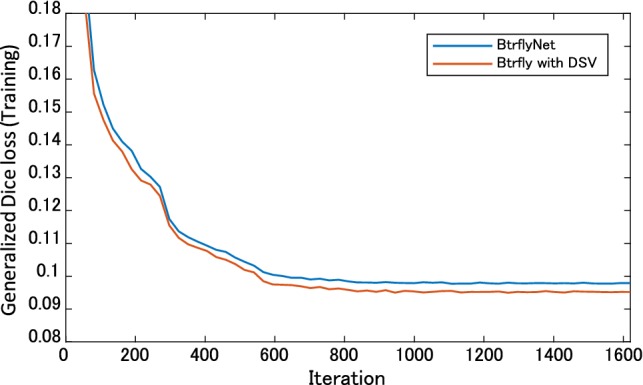
Transitions of generalised Dice loss in the training
Hot spot extraction
In the anterior image of Fig. 7, U-Net failed to detect one hot spot by a bone metastatic lesion, and 17 false positive regions existed, whereas BtrflyNet and ResBtrflyNet detected all hot spots of bone metastatic lesions, where the numbers of false positive regions were seven and five, respectively. In addition, BtrflyNet and ResBtrflyNet showed high consistency between the results of anterior and posterior images. The difference in the number of false positive regions by BtrflyNets and ResBtrflyNet was one, whereas that by U-Nets was 13. This fact suggests that simultaneous process of both images by BtrflyNet and ResBtrflyNet realised a high consistency, thus leading to high performance.
Table 1 suggests that ResBtrflyNet was the best in terms of the numbers of false positive and misclassified pixels as well as number of false positive regions in an anterior image. The differences among the networks could be because of the difference in losses of the training dataset (Fig. 10), in which the loss of ResBtrflyNet was the minimum. In fact, the loss of ResBtrflyNet at the optimal number of iterations was 29.9% lower than that of BtrflyNet.
Fig. 10.
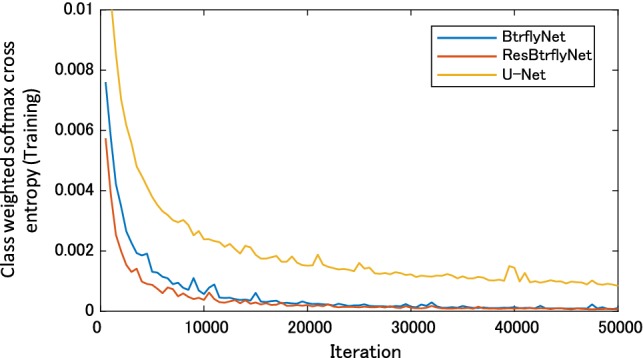
Transitions of class weighted softmax cross-entropy during the training
BSI measurement
Figure 8 shows good correlation between the automatically measured BSI and true BSI when using the best combination of networks with the highest performance, namely the BtrflyNet with DSV for skeleton segmentation and ResBtrflyNet for hot spot extraction. The cross-correlation was 0.9337, which was higher than 0.80 as reported by Ulmert et al. [18] and seems reliable for clinical use. Note that comparing the two values directly is difficult because the dataset used was different. However, the higher cross-correlation suggests a promising performance with the proposed system.
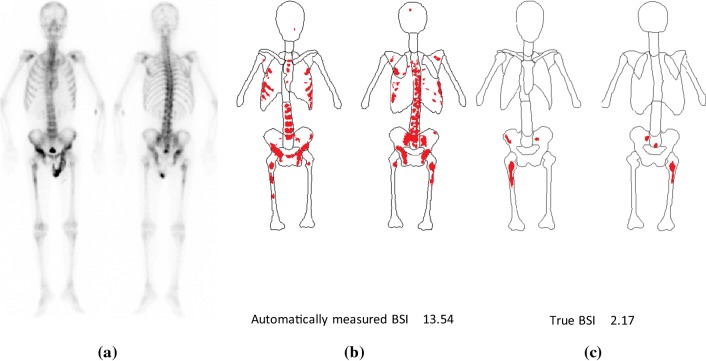
The limitations of the proposed system must be mentioned. Figure 11 shows the case with the maximum error with the BSI measurement (red arrow in Fig. 8). Although the skeleton was recognised correctly, hot spots by osteoarthritis in thoracic and lumbar vertebrae were misclassified as hot spots of bone metastatic lesions. One possible reason for this failure is the limited amount of training data for osteoarthritis. Training using a large dataset with osteoarthritis cases remains an important future study.
Fig. 11.
Case with the maximum error with the BSI measurement: a pair of anterior and posterior images. b Automatically recognised results and c true region of skeleton and hot spots of bone metastatic lesions
Computational cost
The proposed BtrflyNet-based skeleton segmentation took 16 s. for the case using 24 threads. By contrast, the cost of the multi-atlas-based method for an anterior image was over 300 times greater than that of BtrflyNet. The most time-consuming step was non-rigid registration, which took 3420 s. on average, even when ten registration processes ran in parallel.
In the hot spot extraction experiments with multiple threads, the naïve BtrflyNet was the fastest because it shared the deepest layers for anterior and posterior images as compared with U-Net. ResBtrflyNet was 1.5 times longer than the naïve BtrflyNet because of the high computational cost of residual blocks. However, the difference was not considerable.
The cost of the best combination of networks including pre- and post-processes (e.g., spatial standardisation) was 112.0 s. per case, which seems acceptable for clinical use.
Conclusion
This study proposed a deep learning-based image interpretation system for automated BSI measurements from a whole-body bone scintigram, in which BtrflyNets were used to segment the skeleton and extract hot spots of bone metastatic lesions. We conducted threefold cross-validation using 246 bone scintigrams of prostate cancer to evaluate the performance of the system. The experimental results revealed that the best performance was achieved by a combination of BtrflyNet with DSV for skeleton segmentation and BtrflyNet with residual blocks, and the number of misclassified pixels for which was minimum. The computational time of both processes for a case was 112.0 s., and automatically measured BSI showed high correlation (0.9337) with the true BSI, both of which is deemed clinically acceptable and reliable.
An important future work will involve increasing the size of the training dataset to improve the misclassification of the osteoarthritis case. The effect of dataset size on performance would be an interesting topic. Optimising the hyper-parameters of deep networks, e.g., number of layers, number of channels (feature maps) and weights in loss functions, is also essential to boost the performance in terms of segmentation and extraction accuracy as well as computational cost. It would be interesting to perform a leave-one-out examination for further performance analysis. Developing an anatomically constrained network is also necessary to avoid anatomically the wrong results and to enhance the reliability of the system.
Acknowledgements
We are grateful to Ms. Yuri Hoshino for assistance with the experiment.
Compliance with ethical standard
Conflict of interest
This manuscript has not been published elsewhere and is not under consideration for publication in another journal. All authors have approved the manuscript and agree with its submission to IJCARS. Authors Shimizu A, Saito A, Higashiyama S, and Kawabe J have received research grants from Nihon Medi-Physics Co., Ltd. Authors Wakabayashi H and Kanamori T have no conflict of interest. Author Nishikawa K works for Nihon Medi-Physics Co., Ltd. Author Daisaki H worked for Nihon Medi-Physics Co., Ltd. from April 2012 to March 2017, and also received honorarium from Nihon Medi-Physics Co., Ltd. in his current position. All procedures in this study involving human participants were performed in accordance with the ethical standards of the institutional research committees and the 1975 Helsinki declaration (as revised in 2008(5)).
Footnotes
The original version of this article was revised due to a retrospective Open Access order.
Publisher's Note
Springer Nature remains neutral with regard to jurisdictional claims in published maps and institutional affiliations.
Change history
2/1/2020
The article Automated measurement of bone scan index from a whole-body bone scintigram
References
- 1.Bray F, Ferlay J, Soerjomataram I, Siegel RL, Torre LA, Jemal A. Global cancer statistics 2018: GLOBOCAN estimates of incidence and mortality worldwide for 36 cancers in 185 countries. Cancer J Clin. 2018;68(6):394–424. doi: 10.3322/caac.21492. [DOI] [PubMed] [Google Scholar]
- 2.The editorial board of the cancer statistics in Japan (2018) Caner statistics in Japan 2017, Fundation for promotion of cancer research, ISSN 2433-3212
- 3.Fogelman I, Citrin DL, McKillop JH, Turner JG, Bessent RG, Greig WR. A clinical comparison of Tc-99 m HEDP and Tc-99 m MDP in the detection of bone metastases: concise communication. J Nucl Med. 1979;20(2):98–101. [PubMed] [Google Scholar]
- 4.Bevan JA, Tofe AJ, Benedict JJ, Francis MD, Barnett BL. Tc-99 m HMDP(hydroxymethlene diphosphonate): a radiopharmaceutical for skeletal and acute myocardial infarct imaging. I. Synthesis and distribution in animals. J Nuclear Med. 1980;21(10):961–966. [PubMed] [Google Scholar]
- 5.Solowy MS, Hardeman SW, Hickey D, Raymond J, Todd B, Soloway S, Moinuddin M. Stratification of patients with metastatic prostate cancer based on extent of disease on initial bone scan. Cancer. 1988;61(1):195–202. doi: 10.1002/1097-0142(19880101)61:1<195::AID-CNCR2820610133>3.0.CO;2-Y. [DOI] [PubMed] [Google Scholar]
- 6.Erdi YE, Humm JL, Imbriaco M, Yeung H, Larson SM. Quantitative bone metastases analysis based on image segmentation. J Nuclear Med. 1997;38(9):1401–1406. [PubMed] [Google Scholar]
- 7.Wyngaert TV, Strobel K, Kampen WU, Kuwert T, van der Bruggen W, Mohan HK, Gnanasegaran G, Delgado-Bolton R, Weber WA, Beheshti M, Langsteger W, Giammarile F, Mottaghy FM, Paycha F. The EANM practice guideline for bone scintigraphy. Eur J Nucl Med Mol Imaging. 2016;43(9):1723–1738. doi: 10.1007/s00259-016-3415-4. [DOI] [PMC free article] [PubMed] [Google Scholar]
- 8.Yin TK, Chiu NT. A computer-aided diagnosis for locating abnormalities in bone scintigraphy by a fuzzy system with a three-step minimization approach. IEEE Trans Med Imaging. 2004;23(5):639–654. doi: 10.1109/TMI.2004.826355. [DOI] [PubMed] [Google Scholar]
- 9.Huang JY, Kao PF, Chen YS. A set of image processing algorithms for computer-aided diagnosis in nuclear medicine whole body bone scan images. IEEE Trans Nuclear Sci. 2007;54(3):514–522. doi: 10.1109/TNS.2007.897830. [DOI] [Google Scholar]
- 10.Shiraishi J, Li Q, Appelbaum D, Pu Y, Doi K. Development of a computer-aided diagnostic scheme for detection of interval changes in successive whole-body bone scans. Med Phys. 2007;34(1):25–36. doi: 10.1118/1.2401044. [DOI] [PubMed] [Google Scholar]
- 11.Sajn L, Kononenko I, Milčinski M. Computerized segmentation and diagnostics of whole-body bone scintigrams. Comput Med Imaging Graph. 2007;31:531–541. doi: 10.1016/j.compmedimag.2007.06.004. [DOI] [PubMed] [Google Scholar]
- 12.Sadik M, Jakobsson D, Olofsson F, Ohlsson M, Suurkula M, Edenbrandt L. A new computer-based decision-support system for the interpretation of bone scans. Nucl Med Commun. 2006;27(6):417–423. doi: 10.1097/00006231-200605000-00002. [DOI] [PubMed] [Google Scholar]
- 13.Sadik M, Hamadeh I, Nordblom P, Suurkula M, Höglund P, Ohlsson M, Edenbrandt L. Computer-assisted interpretation of planar whole-body bone scans. J Nuclear Med. 2008;49(12):1958–1965. doi: 10.2967/jnumed.108.055061. [DOI] [PubMed] [Google Scholar]
- 14.Sadik M, Suurkula M, Höglund P, Järund A, Edenbrandt L. Improved classifications of planar whole-body bone scans using a computer-assisted diagnosis system: a multicenter, multiple-reader, multiple-case study. J Nuclear Med. 2009;50(3):368–375. doi: 10.2967/jnumed.108.058883. [DOI] [PubMed] [Google Scholar]
- 15.Snyder WS, Cook MJ, Nasset ES, Karhausen LR, Howells GP, Tipton IH (1975) International commission on radiological protection. Report of the task group on reference man, ICRP publication 23, New York
- 16.Kikuchi A, Onoguchi M, Horikoshi H, Sjöstrand K, Edenbrandt L. Automated segmentation of the skeleton whole-body bone scans: influence of difference in atlas. Nucl Med Commun. 2012;33(9):947–953. doi: 10.1097/MNM.0b013e3283567407. [DOI] [PubMed] [Google Scholar]
- 17.Horikoshi H, Kikuchi A, Onoguchi M, Sjöstrand K, Edenbrandt L. Computer-aided diagnosis system for bone scintigrams from Japanese patients: importance of training database. Ann Nucl Med. 2012;26:622–626. doi: 10.1007/s12149-012-0620-5. [DOI] [PMC free article] [PubMed] [Google Scholar]
- 18.Ulmert D, Kaboteh R, Fox JJ, Savage C, Evans MJ, Lilja H, Abrahamsson PA, Björk T, Gerdtsson A, Bjartell A, Gjertsson P, Höglund P, Lomsky M, Ohlsson M, Richter J, Sadik M, Morris MJ, Scher HI, Larsone SM. A novel automated platform for quantifying the extent of skeletal tumour involvement in prostate cancer patients using the bone scan index. Eur Urol. 2012;62(1):78–84. doi: 10.1016/j.eururo.2012.01.037. [DOI] [PMC free article] [PubMed] [Google Scholar]
- 19.Nakajima K, Nakajima Y, Horikoshi H, Ueno M, Wakabayashi H, Shiga T, Yoshimura M, Ohtak E, Sugawara Y, Matsuyama H, Edenbrandt L. Enhanced diagnostic accuracy for quantitative bone scan using an artificial neural network system: a Japanese multi-center database project. EJNMMI Res. 2013;3:83. doi: 10.1186/2191-219X-3-83. [DOI] [PMC free article] [PubMed] [Google Scholar]
- 20.Petersen LJ, Mortensen JC, Bertelsen H, Zacho H. Computer-assisted interpretation of planar whole-body bone scintigraphy in patients with newly diagnosed prostate cancer. Nucl Med Commun. 2015;36(7):679–685. doi: 10.1097/MNM.0000000000000307. [DOI] [PubMed] [Google Scholar]
- 21.Koizumi M, Miyaji N, Murata T, Motegi K, Miwa K, Koyama M, Terauchi T, Wagatsuma K, Kawakami K, Richter J. Evaluation of a revised version of computer-assisted diagnosis system, BONENAVI Version 2.1.7, for bone scintigraphy in cancer patients. Ann Nucl Med. 2015;29:659–665. doi: 10.1007/s12149-015-0988-0. [DOI] [PubMed] [Google Scholar]
- 22.Brown MS, Chu GH, Kim GHJ, Auerbach MA, Poon C, Bridge J, Vidovic A, Ramakrishn B, Ho J, Morris MJ, Larson SM, Scher HI, Goldin JG. Computer-aided quantitative bone scan assessment of prostate cancer treatment response. Nucl Med Commun. 2012;33(4):384–394. doi: 10.1097/MNM.0b013e3283503ebf. [DOI] [PMC free article] [PubMed] [Google Scholar]
- 23.Brown MS, Kim GHJ, Chu GH, Ramakrishn B, Auerbach MA, Fischer CP, Levine B, Gupta PK, Schiepers CW, Goldin JG. Quantitative bone scan lesion area as an early surrogate outcome measure indicative of overall survival in etastatic prostate cancer. J Med Imaging. 2018;5(1):011017-1-6. doi: 10.1117/1.JMI.5.1.011017. [DOI] [PMC free article] [PubMed] [Google Scholar]
- 24.Iglesias JE, Sabuncu MR. Multi-atlas segmentation of biomedical images: a survey. Med Image Anal. 2015;24(1):205–219. doi: 10.1016/j.media.2015.06.012. [DOI] [PMC free article] [PubMed] [Google Scholar]
- 25.Litjens G, Kooi T, Bejnordi BE, Setio AAA, Ciompi F, Ghafoorian M, van der Laak JAWM, Ginneken B, Sánchez CI. A survey on deep learning in medical image analysis. Med Image Anal. 2017;42:60–88. doi: 10.1016/j.media.2017.07.005. [DOI] [PubMed] [Google Scholar]
- 26.Russakovsky O, Deng J, Su H, Krause J, Satheesh S, Ma S, Huang Z, Karpathy A, Khosla A, Bernstein M, Berg AC, Fei-Fei L. ImageNet large scale visual recognition challenge. Int J Comput Vision. 2015;115(3):211–252. doi: 10.1007/s11263-015-0816-y. [DOI] [Google Scholar]
- 27.Yi X, Walia E, Babyn P (2018) Generative adversarial network in medical imaging, a review, arXiv:1809.07294 [DOI] [PubMed]
- 28.Ronneberger O, Fischer P, Brox T. U-net: convolutional networks for biomedical image segmentation. Med Image Comput Comput Assist Interv. 2015;9351:234–241. [Google Scholar]
- 29.Milletari F, Navab N, Ahmadi S-A (2016), V-Net: fully convolutional neural networks for volumetric medical image segmentation. In: 4th international conference on 3D vision, pp 565–571
- 30.Sekuboyina A, Rempfler M, Kukačka J, Tetteh G, Valentinitsch A, Kirschke JS, Menze BH (2018) Btrfly net: vertebrae labelling with energy based adversarial learning of local spine prior, vol 4, pp 649–657, MICCAI2018
- 31.Dou Q, Yu L, Chen H, Jin Y, Yang X, Qin J, Heng P-A. 3D deeply supervised network for automated segmentation of volumetric medical images. Med Image Anal. 2017;41(10):40–54. doi: 10.1016/j.media.2017.05.001. [DOI] [PubMed] [Google Scholar]
- 32.He K, Zhang X, Ren S, Sun J (2017) Deep residual learning for image recognition, CVPR2016, pp 770–778
- 33.He K, Zhang X, Ren S, Sun J (2015) Delving deep into rectifiers: surpassing human-level performance on ImageNet classification, ICCV2015, pp 1026–1034
- 34.Kingma DP, Ba JL (2015) ADAM: A method for stochastic optimization, ICLR2015, arXiv:1412.6980v9


