Abstract
Many genome-processing reactions, such as transcription, replication and repair, generate DNA rotation. Methods that directly measure DNA rotation, including rotor bead tracking1–3, angular optical trap4, and magnetic tweezers5 have helped unravel the action mechanisms of a range of genome-processing enzymes, such as RNA polymerase (RNAP)6, gyrase2, viral DNA packaging motor7, and DNA recombination enzymes8. However, despite the potential of rotation measurements to transform our understanding of genome-processing reactions, measuring DNA rotation remains a difficult task. The time resolution of existing methods is insufficient to track rotation induced by many enzymes under physiological conditions, and the measurement throughput is typically low. Here we introduce Origami-Rotor-Based Imaging and Tracking (ORBIT), a method that uses fluorescently labeled DNA origami rotors to track DNA rotation at the single-molecule level with millisecond time resolution. We used ORBIT to track DNA rotation resulted from unwinding by RecBCD, a helicase involved in DNA repair9, and transcription by RNAP. We characterized a series of events during RecBCD-induced DNA unwinding, including initiation, processive translocation, pausing and backtracking, and revealed an initiation mechanism that involves reversible, ATP-independent DNA unwinding and engagement of the RecB motor. During transcription by RNAP, we directly observed rotational steps corresponding to single-base-pair unwinding. We envision ORBIT will enable studies of a wide range of protein-DNA interactions.
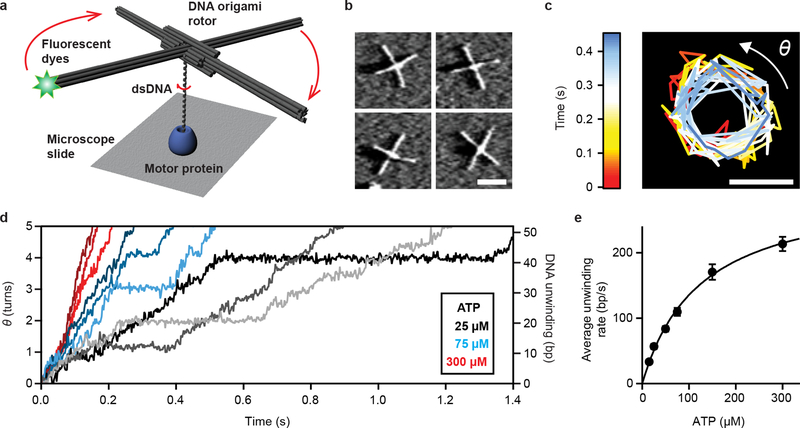
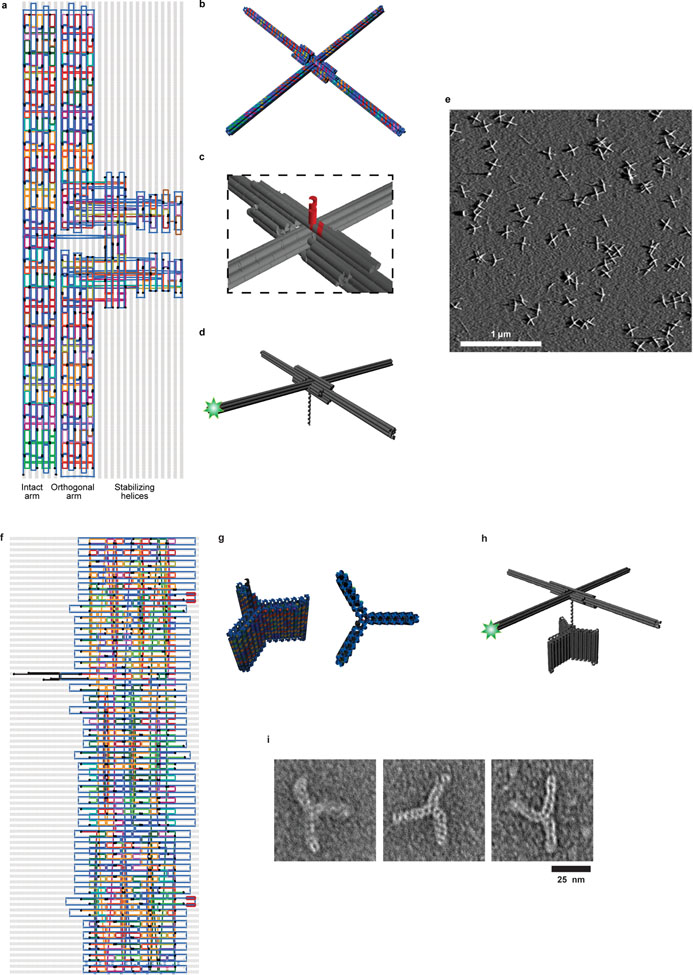
To enable high-resolution tracking of enzyme-induced DNA rotation at the single-molecule level, we designed a fast-responding, amplifying rotor using DNA origami (Fig 1a, Extended Data Fig. 1a–d, Supplementary Table 1), a technology that allows custom 3D nanostructure design and assembly with high precision, yield and reproducibility10,11. Our rotor comprised four blades, each extending 80 nm perpendicular to the axis of rotation, and a double-stranded DNA (dsDNA) segment emerging from the center of the rotor along the axis of rotation, which serves as the substrate of DNA-interacting enzymes (Fig. 1a). We designed the rotor blades to be sufficiently long to amplify the motion of the DNA substantially, yet have low hydrodynamic drag and high torsional stiffness to minimize the obscuring effect of Brownian fluctuations, thereby allowing measurements with high spatiotemporal resolution (Supplementary Discussion). To enable image-based tracking, we labeled the tip of one of the rotor blades with fluorescent dyes. Atomic force microscopy (AFM) showed successful rotor assembly with high yield (Fig. 1b, Extended Data Fig. 1e).
Figure 1 |. Single-molecule DNA rotation measurement using ORBIT.
a, Schematic depiction of the ORBIT method. Rotation of dsDNA relative to a surface-bound enzyme was amplified and detected using a fluorescent dye-labeled DNA origami rotor. b, AFM images of DNA origami rotors, representative images of more than ten independent biological replicates. Scale bar, 100 nm. c, Dye position trajectory from a rotor connected to dsDNA being unwound by RecBCD in the presence of 50 μM ATP. Color indicates time. Rotation angle θ was measured from dye position. Scale bar, 100 nm. d, Representative raw single-molecule DNA rotation trajectories showing processive unwinding by RecBCD at different ATP concentrations (25 μM, grayscale; 75 μM, blue hues; 300 μM, red hues). For display purposes, the initiation phase, discussed in Fig. 3, is not shown here and traces are offset in angle and time such that processive unwinding starts at (0, 0). Data in (c) and (d) are representative examples from at least three independent biological replicates. e, ATP dependence of DNA unwinding rate by RecBCD. Data are mean ± s.e.m. (n = 29, 44, 76, 88, 52, 86 trajectories, from at least three independent biological replicates at each condition). Solid line shows Michaelis-Menten fit (vmax = 304 ± 13 bp/s; KM = 124 ± 12 μM). Data recorded at 500 Hz (25–75 μM ATP) or 1 kHz (150–300 μM ATP), solution pH 8, 10% glycerol.
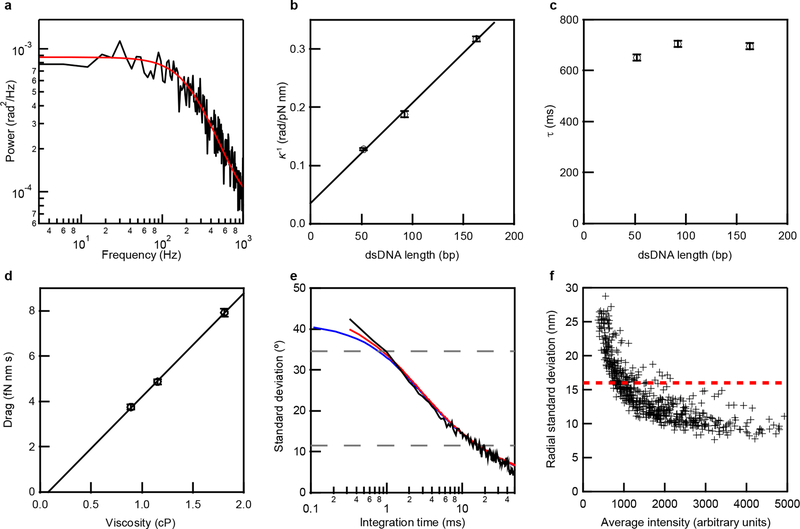
We characterized the mechanical properties of the origami rotor-dsDNA constructs by anchoring them to a coverglass surface via an origami tripod (Extended Data Fig. 1f–i, Supplementary Tables 2–3) and measuring the rotor’s rotational Brownian motion. The power spectrum of the rotor movements revealed a Lorentzian frequency response typical of Brownian dynamics in a harmonic potential well (Extended Data Fig. 2a). From such spectra we obtained the rotor complexes’ torsional stiffness κ and relaxation time constant τ as a function of dsDNA linker length, as well as their hydrodynamic drag γ as a function of solution viscosity (Extended Data Fig. 2b–d; Supplementary Discussion). The dependence of κ on the dsDNA linker length yielded an apparent DNA torsional rigidity constant, C = 200 ± 10 pN·nm2·rad−1 (Supplementary Discussion), consistent with previously measured values under no applied stretching force12. Using the κ and γ parameters, we estimated the angular fluctuation due to Brownian motion as a function of integration time for a DNA rotor connected to a 52-bp dsDNA, and found quantitative agreement with the experimentally measured angular uncertainty (Extended Data Fig. 2e; Supplementary Discussion). Our results showed that only 20 ms were required for single base-pair (bp) rotation (34.6°) resolution with a signal-to-noise ratio of 3 (Extended Data Fig. 2e). For comparison, other torque-free DNA rotation tracking methods would require integration times of 80 ms to over an hour to achieve the same angular precision and require application of a stretching force3,8.
To demonstrate the capabilities of ORBIT, we first used this method to study RecBCD, a helicase that detects double-stranded breaks and initiates homologous recombination9. As RecBCD unwinds dsDNA, its two motors, RecB and RecD, each track along one DNA strand9, which is expected to generate a rotation of the DNA with respect to the enzyme of ~34.6° per unwound base pair. However, the fast unwinding rate of the enzyme13–17 has so far precluded observation of RecBCD-induced DNA rotation. To directly measure this rotation, we adsorbed RecBCD onto the surface of a microscope coverglass, and used a flow system to introduce dsDNA substrates, each 80 bp in length and attached to an origami rotor (Fig. 1a). In the presence of ATP, DNA rotation generated by RecBCD-induced unwinding should be amplified by the rotor and cause processive motion of the fluorescent dyes along a circular path. Using a total internal reflection fluorescence (TIRF) microscope, we tracked the dyes with ~10–15 nm precision at sampling rates up to 1 kHz (Extended Data Fig. 2f).
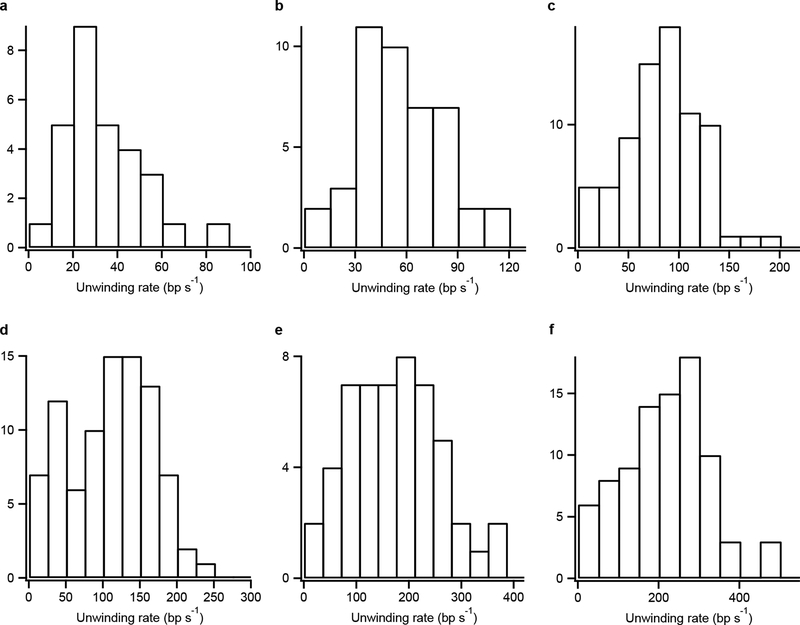
We imaged hundreds of single-molecule trajectories in parallel per experiment, and many single-molecule ORBIT trajectories showed unidirectional movements of the fluorescent dyes along a circle with a diameter that was approximately equal to the diameter of the rotor (Fig. 1c, Supplementary Video 1, Supplementary Methods). We converted the angular measurement into the position of RecBCD along the dsDNA by using the average DNA twist of 34.6° per bp and determined the unwinding rate under a range of ATP concentrations (Fig. 1d–e). While the unwinding rates of individual RecBCD molecules at each ATP concentration exhibited a broad distribution (Extended Data Fig. 3), consistent with previous studies14,16,17, the ensemble-averaged unwinding rate showed a clear Michaelis-Menten ATP dependence with vmax = 304 ± 13 bp/s and KM = 124 ± 12 μM, which did not vary with the solution pH (Fig. 1e, Extended Data Fig. 4a) and is consistent with previous values13–16. Furthermore, we conducted stopped-flow experiments to measure the DNA unwinding rate in solution and obtained results comparable to the ORBIT measurements (Extended Data Fig. 5; Supplementary Table 4), suggesting that surface attachment did not significantly perturb RecBCD unwinding activity.
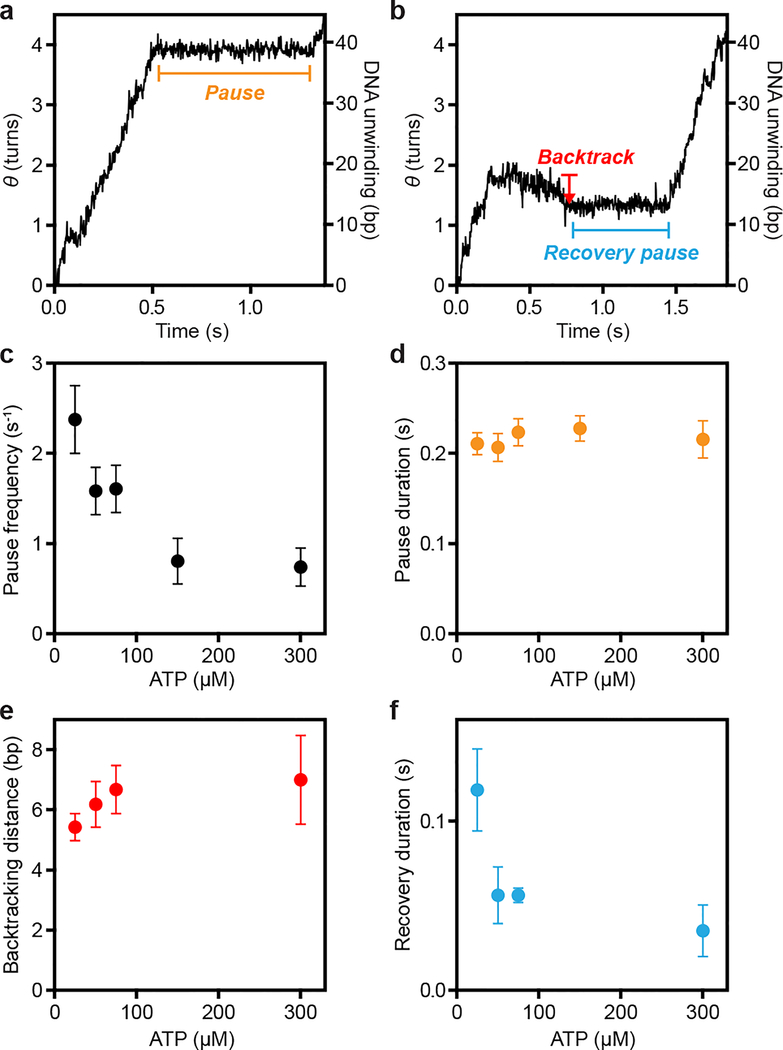
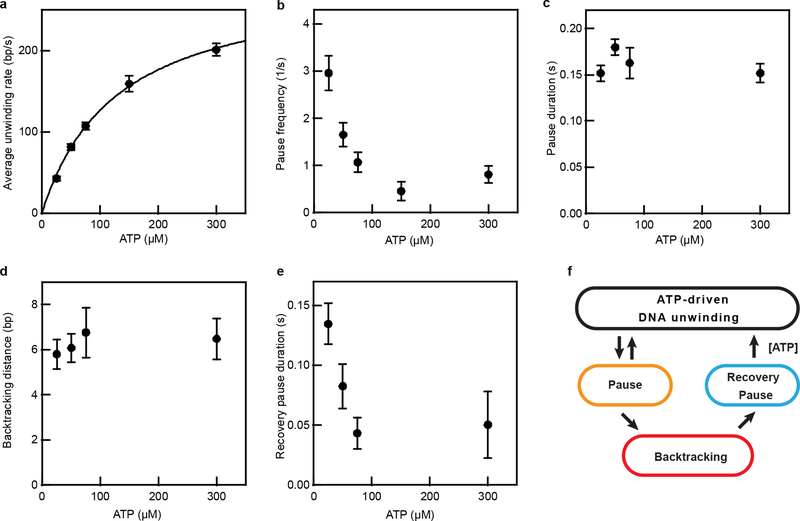
We observed three distinct features during processive DNA unwinding in our single-molecule trajectories: unwinding, pausing, and backtracking (Fig. 2a–b). RecBCD was previously observed to pause and backtrack under an opposing force16. Our results showed that pausing and backtracking of RecBCD also occurred in the absence of a force, but the pause durations and backtracking distances that we observed were substantially smaller than those observed under opposing forces16. The pause frequency decreased with increasing ATP concentration (Fig. 2c, Extended Data Fig. 4b), suggesting that pause entry preferentially occurs in the apo state. The average pause duration remained largely constant across all tested ATP concentrations (Fig. 2d, Extended Data Fig. 4c), suggesting that pause exit occurs through an ATP-independent process. Pauses were followed either by resumed unwinding or backtracking. Backtracking distances were exponentially distributed with an average around 6 bp largely independent of ATP concentration (Fig. 2e, Extended Data Fig. 4d), and these events were typically followed by a ‘recovery pause’ before resumed DNA unwinding. In contrast to the pauses during forward unwinding, the ‘recovery pause’ duration depended on the ATP concentration (Fig. 2f, Extended Data Fig. 4e), suggesting that these different pauses represent distinct enzymatic states (Extended Data Fig. 4f).
Figure 2 |. Pausing and backtracking during RecBCD-induced DNA unwinding.
a-b, Single molecule ORBIT trajectories of processive DNA unwinding by RecBCD at 25 μM ATP showing examples of pausing and backtracking, representative of three independent biological replicates. c, ATP dependence of the pause frequency per molecule. n = 44, 76, 88, 52 and 86 trajectories, from left to right. d, ATP dependence of the duration of pauses during forward unwinding. n = 59, 57, 84, 23 and 23 pauses, from left to right. e, ATP dependence of the backtracking distance. f, ATP dependence of the duration of recovery pauses that occur immediately after a backtracking event. In e, f, n = 31, 15, 25 and 13 events, from left to right. Data are shown as mean ± s.e.m. in c, e, or median ± s.d. of median from resampling in d, f. In (f), 25 μM ATP data were statistically significantly different from 50, 75, and 300 μM ATP data (p-values: 0.03, 0.003, and 0.008; two-sided K-S test). Data recorded at 500 Hz (25–75 μM ATP) or 1 kHz (150–300 μM ATP), solution pH 8, 10% glycerol.
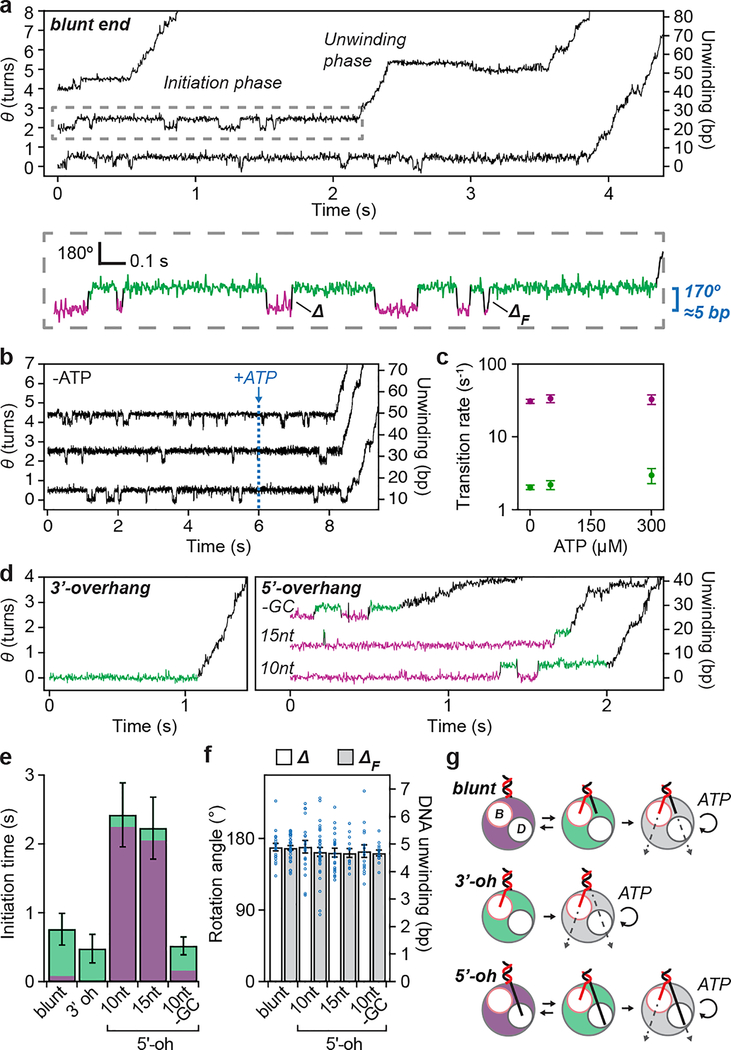
RecBCD processively unwinds dsDNA by pulling the two DNA strands across a pin-like structure in the enzyme, using the two motor subunits RecB and RecD9. However the active sites of these motors are situated several nanometers from the pin position18, suggesting that an additional mechanism may be required for initial unwinding of dsDNA in order to bring the two strands to the respective motors’ active sites. Structural and biochemical studies have shown that RecBCD can unwind a few base pairs without ATP18,19, potentially providing such a mechanism, but direct evidence for the role of this activity during initiation is still lacking. Notably, our ORBIT trajectories exhibited a distinct initiation phase between RecBCD binding and processive DNA unwinding (Fig. 3a, Supplementary Video 2). The initiation phase showed repetitive rotational transitions of the DNA between two well-defined states with a step size of 169° ± 5° (n = 34 events; Fig. 3a; Supplementary Video 2), corresponding to ~5 bp of DNA unwinding. Processive unwinding consistently started from the higher angle, unwound state (green state, Fig. 3a). Quantitatively similar transitions were observed at two ATP concentrations (50 and 300 μM) and without ATP (Fig. 3b–c), indicating that these transitions were ATP independent. Upon addition of ATP to complexes undergoing these transitions in the absence of ATP, the complexes initiated processive unwinding, again starting from the unwound state (Fig. 3b). Our results suggest that the ATP-independent, transient unwound state is an obligatory intermediate during RecBCD initiation on blunt-end DNA. Since the terminal base pair of dsDNA in solution is frequently open20, the wound state could be fully base-paired or contain ~1–2 unpaired bases. In either case, the single-stranded DNA (ssDNA) length in the unwound state (~5–7 nt) is comparable to that required to engage the RecB motor (~6 nt) inferred from the crystal structure18.
Figure 3 |. Initiation of RecBCD helicase activity at dsDNA breaks.
a, Single-molecule trajectories showing initiation of DNA unwinding by RecBCD on blunt-end dsDNA. Initiation phase in the dashed box is magnified below, showing reversible transitions between wound (magenta) and unwound (green) states. Δ and ΔF indicate step sizes of the reversible transitions and the final step before processive unwinding, respectively. b, RecBCD-induced unwinding transitions in the absence of ATP followed by addition of 50 μM ATP. Here, data recording started after RecBCD binding. c, Unwinding (magenta) and rewinding (green) transition rates show no ATP dependence. Unwinding rates are calculated from mean dwell times; error bars show propagated s.e.m. (n = 409, 293 and 97 (from left to right) events). Rewinding rates are calculated from mean dwell times considering kinetic competition; error bars show propagated s.e.m. (details and sample sizes are described in Supplementary Methods). d, Single-molecule trajectories showing initiation of unwinding on dsDNA with a 6-nt 3’ overhang (3’-oh; left) or various 5’overhangs (5’-oh; right): 10-nt, 15-nt, or 10-nt 5’-oh without G-C in the initial 5 base pairs (“-GC”). e, Initiation-phase durations on the different substrates. Green and magenta portions indicate cumulative dwell times in magenta and green states, respectively. Mean ± s.e.m. P-values (two-sided t-test): 0.36 for blunt-end vs. 3’-oh, 0.002 for blunt-end vs. 10-nt 5’-oh, 0.005 for blunt-end vs.15-nt 5’-oh, and 0.0002 for 10-nt 5’-oh vs. -GC 5’-oh (n = 104, 90, 51, 46, 137 trajectories from at least three independent biological replicates each; see Extended Data Fig. 6a for dot-plot overlay). f, Transition step sizes (Δ and ΔF) for blunt-end and 5’-oh substrates. Mean ± s.e.m (n = 34, 18, 19, 33, 20, 13, 15, 13 transitions, from at least three independent biological replicates each). g, Model for RecBCD initiation on dsDNA with different double-stranded break geometries. ‘B’ and ‘D’ indicate RecB and RecD motors, respectively. Trajectories in (a), (b), and (d) are offset vertically and are representative of at least three independent biological replicates. Data acquired at 50 μM ATP (a-b, d-f), 10% glycerol, solution pH 8, 500 Hz.
In addition to blunt-end DNA, natural substrates for RecBCD include dsDNA with either 3’ or 5’ ssDNA overhangs9. How RecBCD is able to initiate on this diverse range of substrates remains unclear. We hypothesized that the transient, ATP-independent unwinding transitions observed on blunt-end dsDNA may not be required for initiation on substrates with ssDNA overhangs that are long enough to reach the corresponding motor domains. To test this hypothesis, we first designed a substrate with a 6-nucleotide (nt) 3’ overhang, which should be sufficiently long to engage the RecB motor18. We observed RecBCD-mediated DNA unwinding on this substrate but not two-state transitions during the initiation phase (Fig. 3d, left panel; Fig. 3e; Extended Data Fig. 6), consistent with our hypothesis that contact of the RecB motor by a ssDNA overhang allows the enzyme to bypass the initial ATP-independent unwinding. We next tested whether contact of 5’ ssDNA overhang with the RecD motor could have the same effect. We designed substrates without 3’ overhangs but with 10-nt or 15-nt 5’ overhangs, both of which should be sufficiently long to engage RecD18,21. In contrast to the 3’-overhang (3’-oh) substrate, the 5’-overhang (5’-oh) substrates exhibited the initiation two-state transitions with a magnitude matching that of the blunt-end dsDNA (Fig. 3d, right panel, and 3f). Like the blunt-end substrate, processive unwinding of the 5’-overhang substrates started after ~5 bp were unwound. Interestingly, the 5-oh substrates had a longer initiation phase due to a much longer dwell time in the wound state, but spent less total time in the unwound state before processive unwinding started (Fig. 3e, Extended Data Fig. 6a). Similar dependence on the overhang geometry was observed in experiments conducted at both 50 μM and 300 μM ATP (compare Fig. 3 and Extended Data Fig. 6 with Extended Data Fig. 7). The slower transition to the unwound state with the 5-oh substrates may be due to a higher activation barrier created by the additional contacts between the 5’ overhang and RecBCD18. Because initiation on these 5-oh substrates was strongly rate-limited by unwinding of the first ~5 bp, we hypothesized that initiation could be accelerated by weakening these base pairs. Indeed, conversion of the G-C pairs in the initial 5 base pairs to A-T (5-oh, ‘-GC’) reduced the average initiation time of the 5’-oh overhang substrate (Fig. 3e, Extended Data Fig. 6).
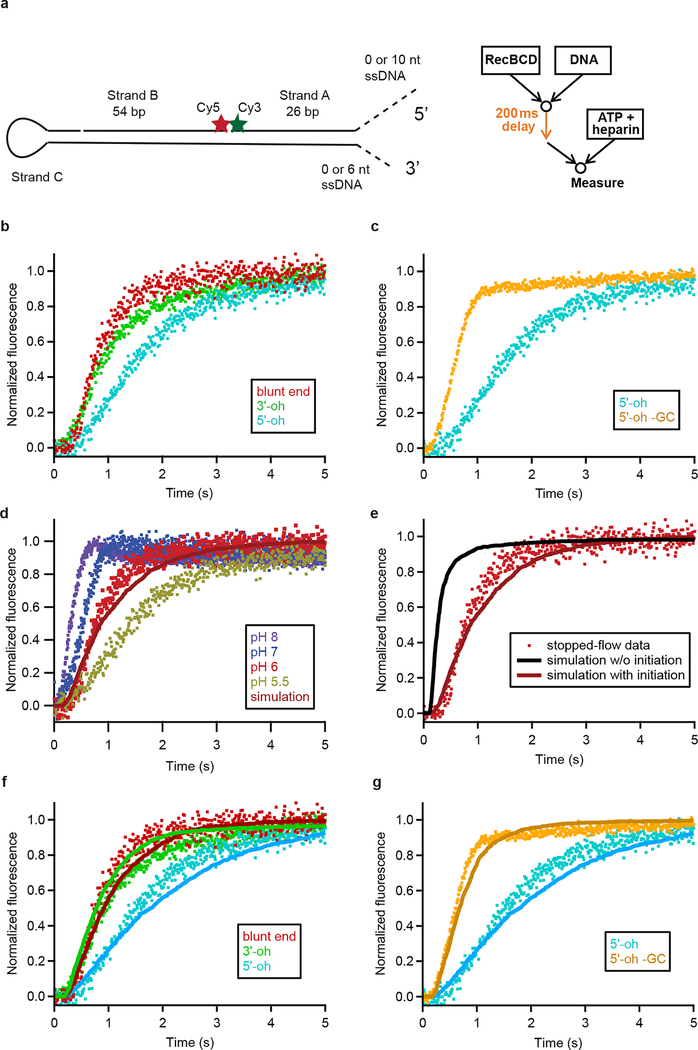
To further test our single-molecule results, we used an ensemble stopped-flow assay to measure RecBCD initiation kinetics (Extended Data Fig. 8a). We found that addition of a 5’ overhang delayed unwinding, and that this delay was diminished by G-C to A-T conversion in the first 5 bp (Extended Data Fig. 8b, c), corroborating our single-molecule results. In addition, we generated ensemble time course predictions using the initiation and unwinding rates determined from single-molecule experiments, taking into account the facts that silicate glass coverslip surfaces are negatively charged, thus leading to local accumulation of H+ ions and pH shift (Supplementary Discussion), and that RecBCD initiation rates were pH dependent (compare Fig. 3e and Extended Data Fig. 9). The predicted time courses from single-molecule results quantitatively agreed with the stopped-flow measurements for all blunt-end, 3’-oh and 5’-oh substrates tested, without any fitting parameters (Extended Data Fig. 8d–g).
Taken together, our results suggest that engagement of the 3’ DNA strand with the RecB motor plays an important role in the initiation of DNA unwinding and that for DNA substrates that lack a 3’ overhang, an ATP-independent unwinding transition is used to engage the 3’ DNA strand with RecB (Fig. 3g). Processive, ATP-dependent DNA unwinding did not start immediately after the ATP-independent unwinding of the blunt-end substrate or immediately after RecBCD binding to the substrate with a 3’ overhang to engage RecB. Additional waiting time was observed before processive unwinding in both cases, indicating the presence of another rate-limiting step. This additional waiting time was shorter for substrates with a 5’ overhang (Fig. 3e; Extended Data Fig. 6), suggesting a role of the 5’ overhang and RecD motor in initiation once the 3’ strand has reached RecB, consistent with previous suggestions of RecD involvement during initiation21,22 and a previous observation that the addition of a sufficiently long 5’ overhang to a DNA substrate containing 3’ overhang can accelerate initiation21. We also note that RecBCD with an ATPase-deficient RecB mutant can initiate processive unwinding on dsDNA with a 5’ overhang but not on a blunt-end dsDNA23, suggesting that RecD can partially compensate for defective RecB in initiation.
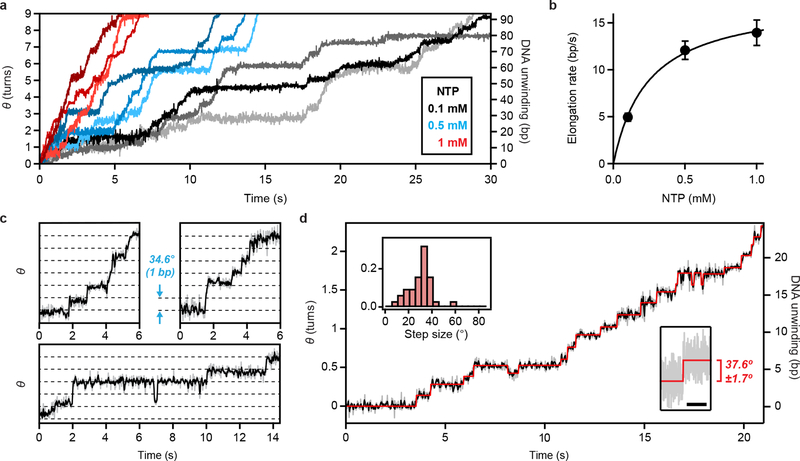
To further demonstrate the general utility of our method, we used ORBIT to probe DNA rotation during transcription by RNAP. We generated stalled RNAP elongation complexes on dsDNA templates attached to origami rotors (by depletion of one of the NTPs), adsorbed these complexes onto a coverslip, and resumed elongation while imaging by adding all four NTPs. The ORBIT trajectories revealed processive rotational motion during transcription, punctuated by pauses (Fig. 4a), reminiscent of the dynamics of the linear movements of RNAP observed previously24–26. The elongation rate measured by rotation exhibited a Michaelis-Menten dependence on NTP concentration (KM = 240 ± 30 μM, vmax = 17.5 ± 0.8 bp/s; Fig. 4b), consistent with previously reported values6,24–26.
Figure 4 |. DNA rotation and single-base-pair rotational steps during transcription by RNAP detected by ORBIT.
a, Single-molecule trajectories of RNAP-driven DNA rotation at three NTP concentrations (0.1 mM, grayscale; 0.5 mM, blue hues; 1 mM, red hues) recorded at 200 Hz, solution pH 8. For clarity, the start of processive elongation is set as (0,0). b, Dependence of elongation rate on NTP concentration at room temperature. The average rates were fit to Michaelis-Menten kinetics (vmax = 17.5 ± 0.8 bp s−1; KM = 240 ± 30 μM). Error bars indicate s.e.m (n = 32, 31, and 39 trajectories from three independent biological replicates at each NTP concentration). c, Example trajectories showing single-base-pair rotational steps at low NTP concentration (gray: raw 50 Hz data; black: 3-point boxcar filter). Horizontal dashed lines correspond to the average single-base-pair twist angle (34.6°). d, Example single-molecule trajectory of RNAP-driven DNA rotation (gray: raw 50 Hz data, black: 3-point boxcar filter) and hidden Markov model (HMM) fit (red). Top left inset: Distribution of most probable step size >5° in each trajectory derived from HMM fits (n = 31 trajectories). Bottom right inset: high-resolution measurement of a RNAP-induced DNA rotation step recorded at 200 Hz (grey). Red lines represent means before and after the step. Scale bar is 1 s. Step size given as difference in mean ± s.e.m for n = 200 data points on either side of the transition. Trajectories in (a), (c) and (d) are representative of three independent biological replicates. Data in (c-d) were acquired with GTP, UTP, ATP, CTP concentrations at 5, 5, 2.5, 1.25 μM, solution pH 8.
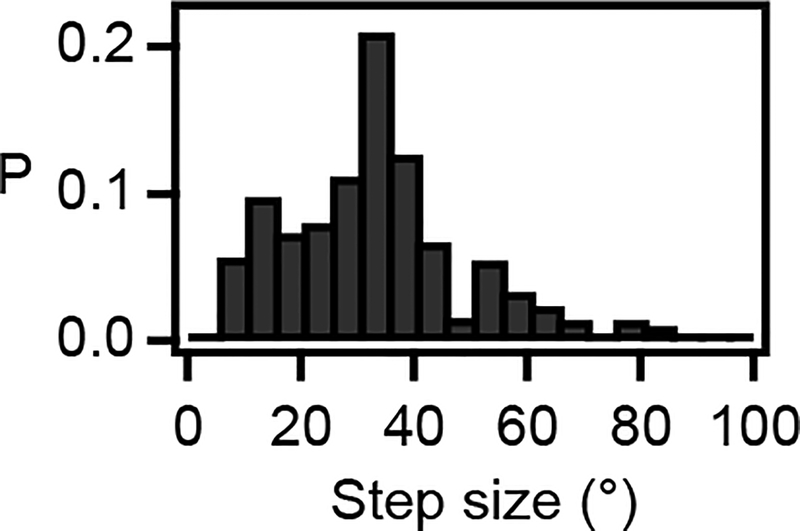
We next investigated the fundamental step size of RNAP rotation during transcription. Optical tweezers studies have detected single-base-pair translocation steps of RNAP by measuring linear movements of RNAP during transcription under an applied force27,28. However, single-base-pair steps have not been observed in the absence of an applied force. Furthermore, while RNAP generally rotates along the DNA helix6, rotational steps have not been previously observed. Our ORBIT trajectories recorded at low NTP concentrations showed clear stepping patterns (Fig. 4c, d). In many segments of the trajectories, steps consistent with single-base-pair motion (~35°) were visually apparent (Fig. 4c). Hidden Markov model analysis of the raw data revealed a preferred step size of ~35° with most steps distributed between 25–40° (Fig. 4d, Extended Data Fig. 10), consistent with the 27–40° range of the sequence-dependent twist angles between subsequent base pairs observed in the B-DNA structure29. Our results thus show that RNAP rotates in steps corresponding to single-base-pair translocation, suggesting a close coupling between the rotational motion of RNAP and the DNA helix at the single-base scale.
To summarize, we have developed ORBIT, a method for tracking single-molecule rotation with high resolution and throughput. Applying ORBIT to track RecBCD-mediated DNA unwinding revealed distinct phases of initiation, unwinding, pausing and backtracking, and shed light on the mechanism of RecBCD initiation. When applied to study RNAP, we observed single-base-pair rotational steps during transcription. Our studies demonstrate the power of DNA nanotechnology to amplify biomolecular movements for mechanistic studies. Considering that the rotation tracking capabilities of our approach require only a standard fluorescence microscope and that the structural properties of the origami rotors can be easily customized, we anticipate that ORBIT will have broad applications to rotation measurements and studies of enzyme mechanisms. Combined with the ability to manipulate DNA origami with an external electric field30, our approach could further enable a high-throughput platform for single-molecule force/torque spectroscopy. The coupling of origami structures to molecular machines that translocate on DNA could also enable the development of ATP-driven actuators for nanoscale applications.
Extended Data
Extended Data Figure 1 |. Origami rotor and anchor designs.
a, Routing diagram of the origami rotor consisting of two 160-nm arms (Supplementary Table 1). The intact arm (a six-helix bundle) passes through a break in the orthogonal arm (two half-length six-helix bundles). Additional helices stabilize the junction. Two of these helices contain staple strands (black) that are extended from the center of rotor (extension not shown; see (c)). Six staples within 14 nm of the end of the intact arm (light green) are labeled with Cy3 at their 3’ ends. b, 3D rendering of the rotor design. c, Magnified view showing the two staple strands (red) extending from the center of the rotor, forming a 14-bp dsDNA and a 12-nt ssDNA overhang for ligation. d, The overhang is ligated to a longer piece of dsDNA, which serves as the substrate of the DNA-interacting enzyme. e, A large field of view AFM image of origami rotors, representative of more than 10 independent biological replicates. Scale bar: 1 μm. f, Routing diagram of the origami anchor consisting of three 20-nm wing, each made of a short six-helix bundle motif (Supplementary Table 2). Several staple strands were extended with binding sites for biotin-labeled secondary oligomers for surface attachment. From the center of the structure, three strands (black) were used to make an adaptor to allow ligation to additional DNA. Following the final strand crossover, the adaptor consists of 26 bp of dsDNA followed by a 12-nt ssDNA overhang. g, 3D renderings of the origami anchor. h, Origami structure used for characterizing the Brownian dynamics. The origami rotor, anchor, and a dsDNA linker (as needed), were ligated together. The origami anchor is attached to the microscope surface using multiple biotin tags. i, Representative images of the origami anchors from one TEM experiment.
Extended Data Figure 2 |. Characterization of the angular and radial position uncertainty of the origami rotor.
a, Power spectrum showing the Brownian fluctuation in the angular position of the rotor attached to the anchor by 52 bp of dsDNA, representative of three independent biological replicates. Red line shows the modified Lorentzian fit, as described in Supplementary Discussion (Equation S1). This fit yields the torsional stiffness, κ, and hydrodynamic drag, γ. b, Dependence of the inverse of the torsional stiffness κ on the length of linker DNA between the rotor and origami. The slope of the linear fit yields the torsional stiffness per unit length of the dsDNA in the absence of an applied force (Equation S3 in Supplementary Discussion), C = 200 ± 10 pN nm2 rad−1, which is consistent with previous measurements under zero force12. The inverse of the y-offset from this fit, κother = 30 ± 8 pN nm rad−1 (Equation S3), represents the torsional stiffness of the remainder of the structure, which is the equivalent of ~20 bp of dsDNA. c, Dependence of the relaxation time, τ = γ/κ, on the length of linker DNA between the rotor and anchor calculated using the κ and γ derived from the power spectrum fit (Equation S1 in Supplementary Discussion). Data in (b-c) are mean ± s.e.m. (n = 203, 195, 133 rotor-anchor complexes from three independent biological replicates). d, Dependence of the hydrodynamic drag γ of the origami rotor on the viscosity of the buffer. The origami rotor was connected by a 92-bp dsDNA to the anchor. The different viscosities were achieved using 0%, 10% and 25% glycerol. Data are mean ± s.e.m. (n = 195, 210, 150 rotor-anchor complexes from three independent biological replicates). e, Standard deviation of the angular positions of the rotor as a function of integration time. Black line shows the standard deviation measured from a single rotor connected to the anchor with a 52-bp dsDNA tracked at 3 kHz after down-sampling to the indicated integration time, representative of three independent biological replicates. Red and blue curves show predicted precision with and without taking into account the contribution of localization uncertainty (Equation S2 in Supplementary Discussion; κ = 7.8 pN·nm·rad−1; γ = 5.0 fN·nm·s; localization uncertainty per frame = 0.038 rad2.) κ and γ were derived from the measurements of multiple (n = 203) rotors with 52-bp dsDNA connecting the rotor to the anchor and was estimated using the measurement uncertainty in radial position and converted to an angular value using the radius of the circular trajectory. The crossing points of the upper and lower dashed lines with the standard deviation vs. integration time curve give the integration times required for detection of single base-pair rotation (34.6°) with a signal-to-noise ratio of 1 and 3, respectively. f, Radial localization uncertainty (standard deviation) during processive unwinding by RecBCD as a function of the average fluorescence signal intensity (mean) from individual rotors, representative of three independent biological replicates. We apply a localization uncertainty threshold of 16 nm (0.1 pixel), shown in red, to select only trajectories with relatively high localization precision. All measurements were performed with 0% glycerol, except for (d).
Extended Data Figure 3 |. Unwinding rate distributions.
Histograms of the average unwinding rate of individual molecules at various ATP concentrations (solution pH 8.0). a, 15 μM ATP. b, 25 μM ATP. c, 50 μM ATP. d, 75 μM ATP. e, 150 μM ATP. f, 300 μM ATP.
Extended Data Figure 4 |. RecBCD unwinding rate and pausing characteristics at solution pH 6.
a, Average unwinding rate as a function of ATP concentrations fit to a Michaelis-Menten dependence with vmax = 290 ± 10 bp/s, KM = 130 ± 10 μM. Data are mean ± s.e.m (n = 47, 94, 80, 37, 110 trajectories from at least three independent biological replicates for each condition). b, ATP concentration dependence of the pause frequency. Pause frequency was determined as the average number of pauses per second for each single-molecule trajectory. Data are mean ± s.e.m. (n = 47, 94, 80, 37, 110 trajectories, from at least three independent biological replicates for each condition). c, Median duration of pauses during forward unwinding at various ATP concentrations. The error bars are the s.d. of the median derived from resampling (n = 76, 62, 27, 18 events, from at least three independent biological replicates for each condition). d, Mean backtracking distance at various ATP concentrations. Data are mean ± s.e.m (n = 20, 22, 16, 10 events, from at least three independent biological replicates for each condition). e, Median recovery pause duration after a backtracking event at various ATP concentrations. The error bars are the s.d. of the median derived from resampling. The p-values for the differences between the 25 μM ATP data point and the 50, 75, and 300 μM ATP data points are 0.05, 0.004, and 0.09, respectively, derived from two-sided Kolmogorov-Smirnov test of the distributions of the pause durations (n = 20, 22, 16, and 10 events for the 25, 50, 75, and 300 μM points, respectively). Note that not all trajectories contain a backtracking event. Data acquired at 10% glycerol, solution pH 6, 500 Hz. f, Schematic of a kinetic model of RecBCD-induced DNA unwinding. During DNA unwinding, pausing occurs frequently and some pauses lead to enzyme backtracking; the enzyme can exit the backtracking state and resume DNA unwinding through a recovery pause intermediate, which is distinct from the initial pause state.
Extended Data Figure 5 |. RecBCD unwinding measured using ensemble stopped-flow assay.
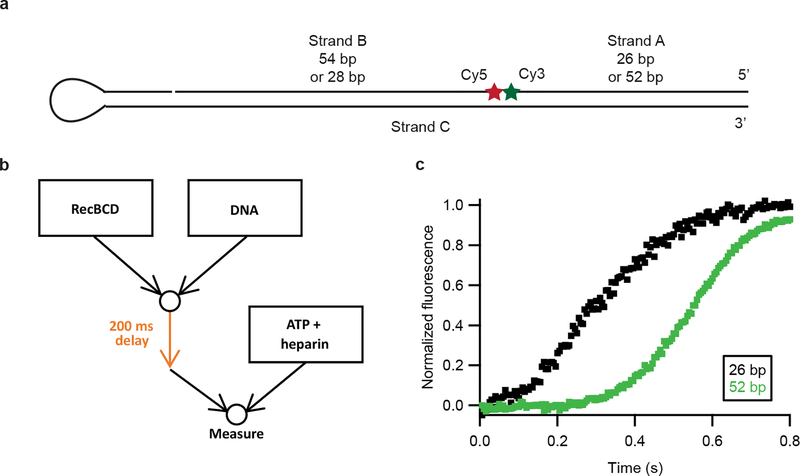
a, Design of the DNA substrate for the stopped-flow experiments21. The Cy3 on strand A is initially quenched by the Cy5 on strand B. RecBCD activity causes the dissociation of strand A, resulting in an increase in fluorescence. The hairpin on the left side (strand C) ensures that activity can only begin from the right side. b, Dual mixing stopped-flow experiment design. The RecBCD and DNA were mixed together for 200 ms in the delay loop before mixing with ATP and heparin, which prevents additional RecBCD-DNA binding after single turnover. c, Stopped-flow fluorescence measurements on blunt-end substrates with strand A either having 26 (black) or 52 (green) base pairs, at 50 μM ATP and solution pH 8, 10% glycerol, representative of at least three independent biological replicates. The ratio of the difference in strand A lengths for the two samples to the difference in measured half-rise times of the two samples allows the unwinding rate to be estimated as ~100 bp/s, assuming that the initiation kinetics are not different for these two substrates because they have the same geometry and sequence at the double stranded break. This unwinding rate is comparable to the 85 bp/s value determined by our single-molecule ORBIT measurements at the same ATP concentration.
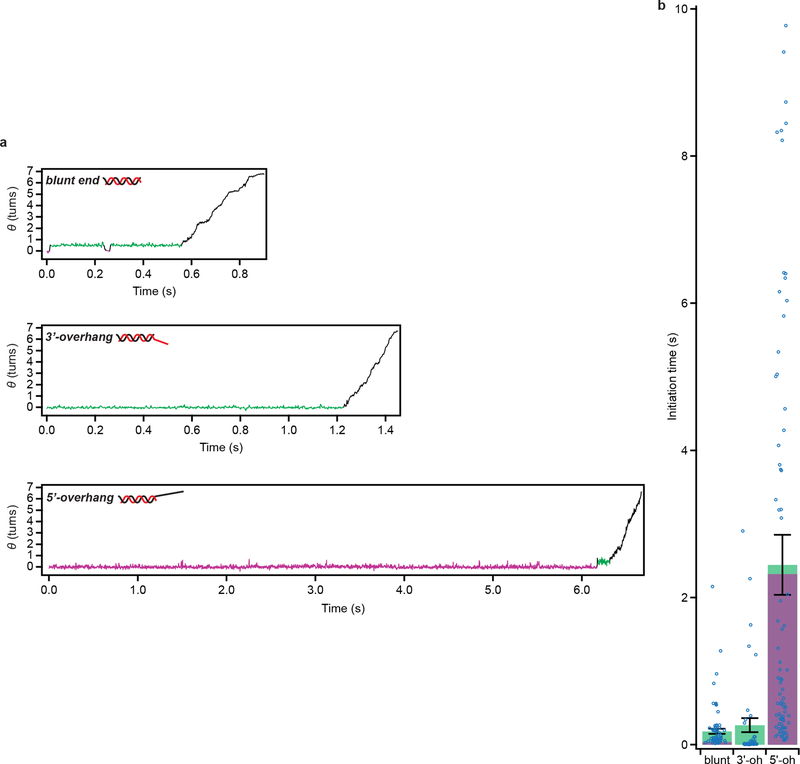
Extended Data Figure 6 |. Distributions of RecBCD initiation phase durations on variation types of substrates at 50 μM ATP, solution pH 8.
Reproduction of Fig. 3e, but with individual data points of initiation-phase durations overlaid as dot plots. Bar graph statistics are described in Fig. 3e. Note that the distributions of initiation-phase durations are expected to be long-tailed exponential-like distributions due to the stochastic nature of kinetic transitions.
Extended Data Figure 7 |. RecBCD initiation kinetics at 300 μM ATP, solution pH 8.
a, Example trajectories of initiation for the blunt-end, 6-nt 3’-overhang (3’-oh), and 10-nt 5’-overhang (5’-oh) DNA substrates, representative of at least three independent biological replicates. The green/magenta color coding is as described in Fig. 3a. b, Mean initiation phase duration (total time from substrate binding until processive unwinding) for the blunt-end, 6-nt 3’-oh, and 10-nt 5’-oh substrates. The green and magenta portions indicate the mean cumulative dwell times in the green and magenta states, respectively. Error bars are s.e.m. (n = 80, 44, 85 trajectories from at least three independent biological replicates). Individual data points of initiation-phase durations are overlaid as dot plots. Data acquired at 300 μM ATP, solution pH 8, 10% glycerol, 500 Hz.
Extended Data Figure 8 |. RecBCD unwinding kinetics measured using ensemble stopped-flow assay.
a, Design of the DNA substrate for the stopped-flow experiments, as described in Extended Data Fig. 5a, b, except that either a 3’ or a 5’ ssDNA overhangs were added as indicated (dashed lines), to prepare the respective overhang substrates. b, Stopped-flow fluorescence measurements for blunt-end, 6-nt 3’-oh, and 10-nt 5’-oh substrates, showing slower kinetics when the 5’-oh is added. c, Stopped-flow fluorescence measurements for 10-nt 5’-oh and 10-nt 5’-oh substrate with G-C pairs in the initial 5 bp converted to A-T (5’-oh -GC). d, Comparison of predicted ensemble time course (red line) based on the initiation and unwinding rates derived from single molecule data (collected at a solution pH of 8) to measured stopped-flow time courses (colored symbols) on the blunt-end substrate at several pH values. To simulate the ensemble time course without fit parameters, we modeled initiation as a single-exponential process using our measured initiation rates from the single-molecule data and unwinding as a series of 1-bp unwinding steps with each molecule in the simulation having an unwinding rate drawn from our experimentally measured distribution of unwinding rates from the single-molecule data. As expected, due to the fact that the silica coverslip surface is charged, leading to local pH shift of ~2 units (see Supplementary Discussion), the predicted curve from the initiation and unwinding rates measured by single-molecule experiments at solution pH of 8 (surface pH of 6) matches the stopped-flow data measured at pH 6. e, Comparison of stopped-flow data (red symbols) for blunt-end substrates at pH 6 to the time courses predicted from both initiation and unwinding rates (red) or from unwinding rates alone (black line), derived from single molecule data obtained at a solution pH of 8 (surface pH of 6). Thus, inclusion of the initiation phase in the simulation is required to match the experimental results. f-g, Comparison of stopped-flow data at pH 6 (color symbols) shown in (b-c) to predicted ensemble time courses (lines with matched color) using initiation and unwinding rates derived from the single-molecule data at a solution pH of 8 (surface pH of 6) as described for (d). All stopped-flow experiments were conducted at 50 μM ATP, 10% glycerol, pH 6 except for (d), for which pH is indicated in the legend, and are representative of at least three individual experiments for each condition. Dot plots with the same colors are duplicates of the same data set placed in different panels for comparison purposes.
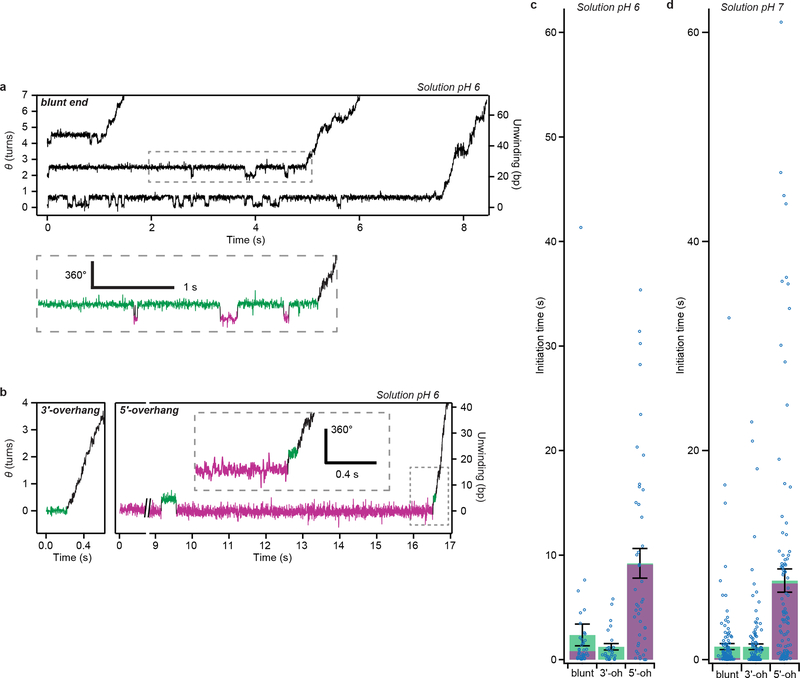
Extended Data Figure 9 |. RecBCD initiation kinetics at different pH values.
a, Single-molecule trajectories showing RecBCD initiation on blunt-end substrates at 50 μM ATP, solution pH 6, 10% glycerol, recorded at 500 Hz. Arbitrary vertical offsets are applied to different trajectories for display purposes. The region in the dashed box is magnified below, in which the wound and unwound angle states are marked in magenta and green, respectively. b, Single-molecule substrates showing RecBCD initiation on 3’ overhang (3’-oh, 6-nt) and 5’ overhang (5’-oh, 10-nt) substrates under the same conditions. The dash-boxed region is magnified in the inset. Data in (a-b) are representative of at least three independent biological replicates. c-d, Mean initiation-phase duration (total time from substrate binding until processive unwinding) for the blunt-end, 3’-oh and 5’-oh substrates at solution pH 6 (c) and solution pH 7 (d), 50 μM ATP, 10% glycerol. The green and magenta portions indicate the cumulative dwell times in the green and magenta states, respectively. Error bars are s.e.m (n = 40, 27, 44 trajectories in (c) and n = 149, 154, 108 trajectories in (d), from at least three independent biological replicates for each condition). Individual data points of initiation-phase durations are overlaid as dot plots.
Extended Data Figure 10 |. Additional analysis of RNAP base pair stepping.
Full probability distribution of forward step sizes (>5°) from the HMM analysis of the single-molecule trajectories of RNAP-induced DNA rotation. Here all detected step probabilities in individual single-molecule trajectories are used to construct the histogram, instead of using the most probable step size of each trajectory as shown in the inset of Fig. 4d.
Supplementary Material
Acknowledgments.
This work was supported in part by the National Institutes of Health. B.D.A. was supported by a National Institutes of Health Training Grant for the Graduate Program in Biophysics at Harvard University and a National Science Foundation Graduate Research Fellowship. M.D. was supported by a Howard Hughes Medical Institute International Student Research Fellowship. X.Z. is a Howard Hughes Medical Institute Investigator.
Footnotes
Supplementary Information is linked to the online version of the paper.
The authors declare no competing financial interests.
Data Availability The data that support the findings of this study are available from the corresponding author upon reasonable request.
Code Availability The single-molecule data was analyzed using custom Python and Igor Pro code. This code is available at https://github.com/altheimerb/python-sma/.
References
- 1.Bryant Z et al. Structural transitions and elasticity from torque measurements on DNA. Nature 424, 338–341 (2003). [DOI] [PubMed] [Google Scholar]
- 2.Gore J et al. Mechanochemical analysis of DNA gyrase using rotor bead tracking. Nature 439, 100–104 (2006). [DOI] [PMC free article] [PubMed] [Google Scholar]
- 3.Lebel P et al. Gold rotor bead tracking for high-speed measurements of DNA twist, torque, and extension. Nat. Methods 11, 456–462 (2014). [DOI] [PMC free article] [PubMed] [Google Scholar]
- 4.Deufel C, Forth S, Simmons CR, Dejgosha S & Wang MD Nanofabricated quartz cylinders for angular trapping: DNA supercoiling torque detection. Nat. Methods 4, 223–225 (2007). [DOI] [PubMed] [Google Scholar]
- 5.Lipfert J, van Oene MM, Lee M, Pedaci F & Dekker NH Torque spectroscopy for the study of rotary motion in biological systems. Chem. Rev 115, 1449–1474 (2015). [DOI] [PubMed] [Google Scholar]
- 6.Harada Y et al. Direct observation of DNA rotation during transcription by Escherichia coli RNA polymerase. Nature 409, 113–115 (2001). [DOI] [PubMed] [Google Scholar]
- 7.Liu S et al. A viral packaging motor varies its DNA rotation and step size to preserve subunit coordination as the capsid fills. Cell 157, 702–713 (2014). [DOI] [PMC free article] [PubMed] [Google Scholar]
- 8.Lipfert J, Wiggin M, Kerssemakers JWJ, Pedaci F & Dekker NH Freely orbiting magnetic tweezers to directly monitor changes in the twist of nucleic acids. Nat. Commun 2, 439 (2011). [DOI] [PMC free article] [PubMed] [Google Scholar]
- 9.Dillingham MS & Kowalczykowski SC RecBCD enzyme and the repair of double-stranded DNA breaks. Microbiol. Mol. Biol. Rev 72, 642–671 (2008). [DOI] [PMC free article] [PubMed] [Google Scholar]
- 10.Rothemund PWK Folding DNA to create nanoscale shapes and patterns. Nature 440, 297–302 (2006). [DOI] [PubMed] [Google Scholar]
- 11.Douglas SM et al. Self-assembly of DNA into nanoscale three dimensional shapes. Nature 459, 414–418 (2009). [DOI] [PMC free article] [PubMed] [Google Scholar]
- 12.Nomidis SK, Kriegel F, Vanderlinden W, Lipfert J & Carlon E Twist-bend coupling and the torsional response of double-stranded DNA. Phys. Rev. Lett 118, 217801 (2017). [DOI] [PubMed] [Google Scholar]
- 13.Roman LJ & Kowalczykowski SC Characterization of the helicase activity of the Escherichia coli RecBCD enzyme using a novel helicase assay. Biochemistry 28, 2863–2873 (1989). [DOI] [PubMed] [Google Scholar]
- 14.Bianco PR et al. Processive translocation and DNA unwinding by individual RecBCD enzyme molecules. Nature 409, 374–378 (2001). [DOI] [PubMed] [Google Scholar]
- 15.Dohoney KM & Gelles J Chi-Sequence recognition and DNA translocation by single RecBCD helicase/nuclease molecules. Nature 409, 370–374 (2001). [DOI] [PubMed] [Google Scholar]
- 16.Perkins TT, Li H-W, Dalal RV, Gelles J & Block SM Forward and reverse motion of single RecBCD molecules on DNA. Biophys. J 86, 1640–1648 (2004). [DOI] [PMC free article] [PubMed] [Google Scholar]
- 17.Liu B, Baskin RJ & Kowalczykowski SC DNA unwinding heterogeneity by RecBCD results from static molecules able to equilibrate. Nature 500, 482–485 (2013). [DOI] [PMC free article] [PubMed] [Google Scholar]
- 18.Saikrishnan K, Griffiths SP, Cook N, Court R & Wigley DB DNA binding to RecD: role of the 1B domain in SF1B helicase activity. EMBO J 27, 2222–2229 (2008). [DOI] [PMC free article] [PubMed] [Google Scholar]
- 19.Farah JA & Smith GR The RecBCD enzyme initiation complex for DNA unwinding: enzyme positioning and DNA opening. J. Mol. Biol 272, 699–715 (1997). [DOI] [PubMed] [Google Scholar]
- 20.Von Hippel PH, Johnson NP & Marcus AH Fifty years of DNA ‘breathing’: Reflections on old and new approaches. Biopolymers 99, 923–954 (2013). [DOI] [PMC free article] [PubMed] [Google Scholar]
- 21.Wu CG & Lohman TM Influence of DNA end structure on the mechanism of initiation of DNA unwinding by the Escherichia coli RecBCD and RecBC helicases. J. Mol. Biol 382, 312–326 (2008). [DOI] [PMC free article] [PubMed] [Google Scholar]
- 22.Carter AR et al. Sequence-dependent nanometer-scale conformational dynamics of individual RecBCD–DNA complexes. Nucleic Acids Res 44, 5849–5860 (2016). [DOI] [PMC free article] [PubMed] [Google Scholar]
- 23.Dillingham MS, Webb MR & Kowalczykowski SC Bipolar DNA translocation contributes to highly processive DNA unwinding by RecBCD enzyme. J. Biol. Chem 280, 37069–37077 (2005). [DOI] [PubMed] [Google Scholar]
- 24.Forde NR, Izhaky D, Woodcock GR, Wuite GJL & Bustamante C Using mechanical force to probe the mechanism of pausing and arrest during continuous elongation by Escherichia coli RNA polymerase. Proc. Natl. Acad. Sci 99, 11682–11687 (2002). [DOI] [PMC free article] [PubMed] [Google Scholar]
- 25.Adelman K et al. Single molecule analysis of RNA polymerase elongation reveals uniform kinetic behavior. Proc. Natl. Acad. Sci 99, 13538–13543 (2002). [DOI] [PMC free article] [PubMed] [Google Scholar]
- 26.Neuman KC, Abbondanzieri E. a., Landick R, Gelles J & Block SM Ubiquitous Transcriptional Pausing Is Independent of RNA Polymerase Backtracking. Cell 115, 437–447 (2003). [DOI] [PubMed] [Google Scholar]
- 27.Abbondanzieri EA, Greenleaf WJ, Shaevitz JW, Landick R & Block SM Direct observation of base-pair stepping by RNA polymerase. Nature 438, 460–465 (2005). [DOI] [PMC free article] [PubMed] [Google Scholar]
- 28.Righini M et al. Full molecular trajectories of RNA polymerase at single base-pair resolution. Proc. Natl. Acad. Sci 115, 1286–1291 (2018). [DOI] [PMC free article] [PubMed] [Google Scholar]
- 29.Kabsch W, Sander C & Trifonov EN The ten helical twist angles of B-DNA. Nucleic Acids Res 10, 1097–1104 (1982). [DOI] [PMC free article] [PubMed] [Google Scholar]
- 30.Kopperger E et al. A self-assembled nanoscale robotic arm controlled by electric fields. Science 359, 296–301 (2018). [DOI] [PubMed] [Google Scholar]
Associated Data
This section collects any data citations, data availability statements, or supplementary materials included in this article.


