Abstract
The recent finding that β-catenin levels play an important rate-limiting role in processes regulating insulin secretion lead us to investigate whether its binding partner α-catenin also plays a role in this process. We find that levels of both α-E-catenin and α-N-catenin are rapidly up-regulated as levels of glucose are increased in rat clonal β-cell models INS-1E and INS-832/3. Lowering in levels of either α-catenin isoform using siRNA resulted in significant increases in glucose stimulated insulin secretion (GSIS) and this effect was attenuated when β-catenin levels were lowered indicating these proteins have opposing effects on insulin release. This effect of α-catenin knockdown on GSIS was not due to increases in insulin expression but was associated with increases in calcium influx into cells. Moreover, simultaneous depletion of α-E catenin and α-N catenin decreased the actin polymerisation to a similar degree as latrunculin treatment and inhibition of ARP 2/3 mediated actin branching with CK666 attenuated the α-catenin depletion effect on GSIS. This suggests α-catenin mediated actin remodelling may be involved in the regulation of insulin secretion. Together this indicates that α-catenin and β-catenin can play opposing roles in regulating insulin secretion, with some degree of functional redundancy in roles of α-E-catenin and α-N-catenin. The finding that, at least in β-cell models, the levels of each can be regulated in the longer term by glucose also provides a potential mechanism by which sustained changes in glucose levels might impact on the magnitude of GSIS.
Keywords: actin, alpha-catenin, beta-catenin, calcium influx, insulin secretion, type 2 diabetes
Introduction
The proper control of glucose homeostasis relies on the appropriate levels of insulin being secreted from the β-cells in the pancreas so there has been an intense effort to understand the mechanisms by which glucose levels control insulin secretion [1,2]. Some parts of the process are understood. It is clear that the initial retention of insulin containing vesicles inside the cells and their release upon glucose stimulation involves regulation of the microtubules and the actin cytoskeletons [3,4]. The acute release of insulin upon glucose stimulation requires ATP production and subsequent closure of the ATP sensitive K+ channel. The resulting membrane depolarisation leads to increased activity of voltage sensitive L-type calcium channels and the consequent influx of calcium allows t-snare/v-snare interactions that permits insulin granules to fuse with the plasma membrane [1,2].
β-cells are also a polarised cell type and this is important for proper GSIS [5–7]. They have membrane domains facing the blood vessels that interact with the extracellular matrix via focal adhesions and these are important for proper regulation of GSIS [8,9]. The lateral domains play an equally important role and appear to be where most of the glucose transporters and calcium channels are located [6,7]. It is clear that adherens junctions play an important role in forming interactions of lateral domains and there is a growing body of evidence that these adherens junctions also play an important role in the processes allowing the β-cells to release insulin in response to changes in extracellular glucose concentration [5,10–15]. These studies were initially restricted to showing a requirement for the cell surface cadherins but we have recently begun to investigate the role of the intracellular proteins that associate with cadherins and mediate their effects in the cell. The two most well studied components of these complexes are β-catenin, which binds directly to the cadherins, and α-catenin, which binds indirectly to the cadherins by binding first to β-catenin [16]. We have previously shown that loss of β-catenin results in attenuation of GSIS suggesting an important role for this protein in this process [17,18]. These effects appear to be independent of transcriptional effects of β-catenin but the full mechanisms remain to be elucidated, including the role of other proteins associated with β-catenin such as α-catenin.
One interesting finding of our previous work is that glucose exposure rapidly increases β-catenin levels in β-cells [17,18]. We have also recently shown that β-catenin levels increase rapidly in several regions of the hypothalamus after feeding which raises the possibility that such mechanisms may be important in regulating secretion of other hormones regulating energy metabolism [19]. This suggests that dynamic regulation of this protein could be playing a role in modulating the potential of β-cells to release insulin. The levels of β-catenin are regulated by ubiquitination and proteasomal degradation and the association of α-catenin with β-catenin is important in modulating this process [16].
Here we investigate the role of α-catenin in β-cell models INS-1E and INS-832/3. We find that levels of α-catenin isoforms in β-cell models rise following glucose exposure in a similar time frame to which β-catenin levels rise. However, we find loss of α-catenin has the opposite effect to loss of β-catenin and causes large increases in glucose stimulated release of insulin from β-cells. These increases are associated with parallel increases in voltage dependent calcium influxes into the β-cells lacking α-catenin and these are necessary for the increased insulin secretion. Moreover, α-catenin depletion in INS-1E cells decreases the actin polymerisation suggesting that α-catenin mediated regulation of GSIS may occur through modulation of actin cytoskeleton.
Experimental procedures
Cell culture
INS-1E cells were kindly provided by Professor C. B. Wollheim and INS-1 832/3 cells were kindly provided by Professor Christopher B. Newgard.INS-1E and INS-832/3 β-cells were maintained in RPMI 1640 medium containing 11.1 mM glucose, supplemented with 10% (v/v) FBS (fetal bovine serum), 100 units/ml penicillin, 100 µg/ml streptomycin, 10 mM Hepes, 2 mM l-glutamine, 1 mM sodium pyruvate (all Gibco, Life Technologies), and 50 µM 2-mercaptoethanol. Glucose treatment experiments were performed in confluent cells in six well culture plates and insulin secretion experiments were performed on >80% confluent cells in 12-well culture plates after serum-starvation in Krebs-Ringer Bicarbonate Hepes buffer (KRBH: 119 mM NaCl, 4.74 mM KCl, 1.19 mM MgSO4, 25 mM NaHCO3, 1.19 mM KH2PO4, 2.54 mM CaCl2 and 50 mM Hepes), pH 7.4, with 0.2% BSA (low fatty acid).
Cell transfection
All siRNAs and siRNA transfection reagents were purchased from Life Technologies and used according to manufacturer's instructions. All siRNA transfections were performed using reverse transfection method with either negative control siRNA (StealthTM RNAi siRNA Negative Control, Med GC) or siRNA specific for α-E catenin (RSS 358211, RSS 316764, RSS 316766), α-N catenin (RSS 311110, RSS 311111, RSS 355878) or β-catenin (RSS331357) at a final concentration of 30 nM using Lipofectamine™ 2000 transfection reagent. 5 × 10⁵ INS-1E cells were used in each well of 12 well plate and cells were plated in media lacking antibiotics. 24 h after transfection, medium was replaced with RMPI with antibiotics and experiments were performed 48 h after transfection.
Cell lysate preparation for western blot
After treatments, cells were rinsed with ice-cold 1xPBS and lysates were collected in buffer containing 20 mM Tris–HCl (pH 7.5), 150 mM NaCl, 1 mM EDTA, 1 mM EGTA, 1% Triton X-100, 2.5 mM sodium pyrophosphate, 1 mM β-glycerol phosphate, 1 mM vanadate, 100 mM NaF, 1 mM 4-(2-aminoethyl) benzenesulfonyl fluoride hydrochloride (AESBF), 4 µg/ml aprotinin, 0.4 µg/ml pepstatin, 4 µg/ml leupeptin, and 30 µM N-[N-(N-Acetyl-L-leucyl)-L-leucyl]-L-norleucine (ALLN). Lysates were centrifuged at 16 100×g for 10 min, and supernatants were analysed by polyacrylamide gel electrophoresis for Western blotting.
Western blot analysis
Western blot analysis was done using antibodies against α-E catenin (1 : 1000; Cell Signalling Technologies, catalogue number # 240) and α-N catenin (1;1000; Cell Signalling Technologies, catalogue number 2163) and total β-catenin (1 : 2000: Symansis, catalogue number 3024C), α-tubulin (1 : 20 000; Sigma–Aldrich, catalogue number T6074) and β-actin (1 : 20 000; Sigma–Aldrich, catalogue number A1978). After overnight incubation at 4°C with primary antibodies, membranes were washed and incubated with respective secondary antibodies anti-mouse IgG HRP (1 : 20 000; Sigma–Aldrich), anti-rabbit IgG HRP (1 : 10 000 Santa Cruz biotechnology) or anti-sheep IgG HRP (1 : 20 000; Dako) for 1 h at room temperature and developed with Clarity™ Western ECL substrate (Bio-Rad Laboratories).
Measuring insulin concentrations
Forty-eight hours after siRNA transfection, cells were starved in KRBH buffer. After starvation, media were replaced with KRBH containing either 0.5 mM or 10 mM glucose for 2 h. To measure the amount of secreted insulin levels, aliquots of supernatants were collected, and insulin concentrations were measured using the AlphaLISA Insulin Assay kit (PerkinElmer) according to the manufacturer's instructions. To measure the total insulin content, cell lysates were collected, diluted accordingly and performed AlphaLISA insulin assay.
F actin G actin assay
INS-1E cells were plated in 12 well plate during siRNA transfection. Forty-eight hours after siRNA transfection, cells were washed with PBS and lysed with actin stabilisation buffer 50 mM NaCl, 5 mM MgCl2, 50 mM PIPES, 5 mM EGTA, 5% (v/v) glycerol, 0.1% Nonidet P-40,, pH 6.9, 0.1% Triton X-100, 0.1% Tween 20, 0.1% 2-mercaptoethanol, 0.001% Antifoam A, 1 mM ATP, and protease inhibitors. Cells were collected by scraping and homogenised by passing through a 24-gauge needle five times. Cell lysates were incubated at 37°C for 10 min and centrifuged at 2000×g for 5 min to separate the cell debri. The G-actin was separated from F-Actin by centrifuging at 10 000×g for 1 h at 37°C. F-Actin pellet was resuspended in Milli-Q water containing 10 μM of cytochalsin D. Latrunculin-A was used as a negative control that reduces actin polymerisation and phalloidin was used as a positive control for actin polymerisation. F-Actin and G-Actin samples were run on 8% SDS PAGE gel and the expression of α-E catenin, α-N catenin and β-actin proteins were analysed.
Statistical analysis
Results are presented as means ± S.E.M. Statistical differences were determined using two-way ANOVA with Dunnett's or Tukey's post hoc test or unpaired t-tests and statistical significance is displayed as * P < 0.05 or ** P < 0.01. Statistical analyses were performed using statistical software package GraphPad Prism 6.0 (GraphPad Software Inc.).
Results
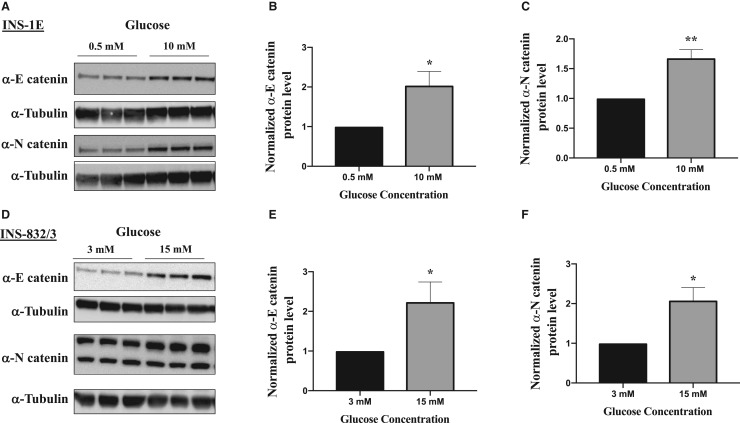
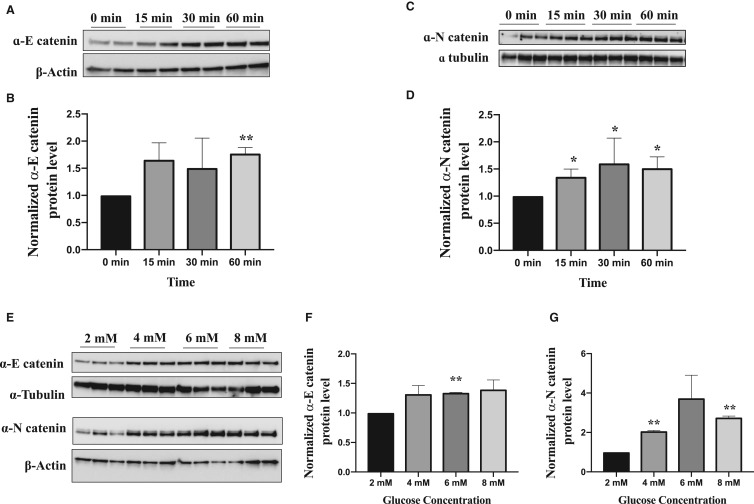
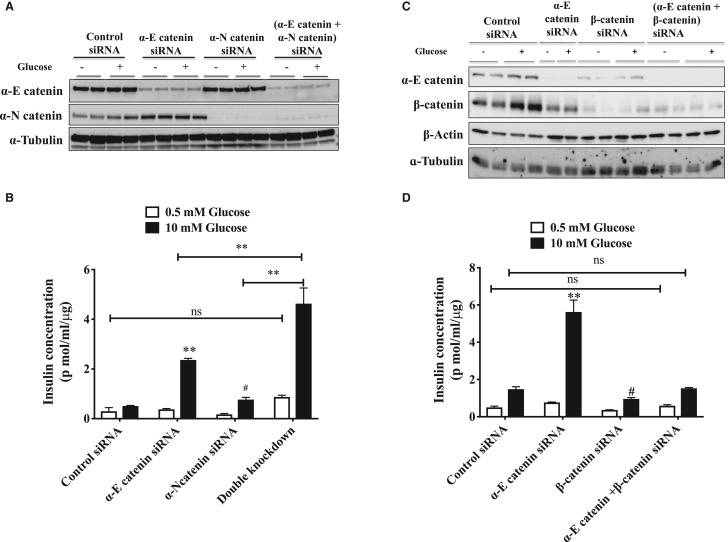
We find that increasing levels of glucose in INS-1E cells from 0.5 mM to 10 mM resulted in an increase in the levels of both α-E and α-N catenin in these cells which broadly parallels the increases we observe in β-catenin (Figure 1A–C). Similar results were seen in the INS-1 832/3 cells (Figure 1D–F). These increases occur in a time dependent manner(Figure 2A–D) and across a physiologically relevant range of glucose concentrations (Figure 2E–G) suggesting their potential involvement in insulin secretion process. Furthermore, we see an increase in α-N catenin levels when α-E catenin is depleted in these cells using siRNA but not an increase in α-E catenin when α-N catenin is depleted (Figure 4A) indicating that α-N catenin might compensate for the loss of α-E catenin in this system.
Figure 1. α-E catenin and α-N catenin protein levels increase with glucose stimulation.
After serum starvation in KRBH buffer, INS-1E cells (A) and INS 832/3 cells (D) were stimulated with 10 mM glucose or 15 mM, respectively for 3 h and lysates were subjected to western blot analysis using α-tubulin as a loading control. (B and C) Densitometry analysis of α-catenin protein levels in western blot images of INS-1E lysates and (E and F) INS-832/3 lysates. Results are mean ± S.E.M of three independent experiments. * P < 0.05 and ** P < 0.01 compared with control glucose condition as assessed by unpaired t-test (1B,C,E,F). Results are representative of least three independent experiments.
Figure 2. α-catenin responds to glucose at physiologically relevant concentrations and in a time dependent manner.
(A–D) Following serum starvation in KRBH buffer, INS-1E cells were stimulated with 10 mM glucose for the indicated time. Cell lysates were subjected for western blot analysis using α-E catenin, α-N catenin antibodies and β-actin and α-tubulin as loading controls. (E–G) After serum starvation, INS-1E cells were stimulated with increasing concentrations of glucose ranging from 2 mM-8 mM for 3 h and cell lysates were subjected for western blot analysis. Results are representative of at least three independent experiments. Results are mean ± S.E.M. of 2–4 independent experiments * P < 0.05 and ** P < 0.01 compared with control glucose condition as assessed by unpaired t-test (1B,D,F,G).
Figure 4. α-E catenin and α-N catenin is functionally redundant in β-cells.
INS-1E cells were transfected with negative control siRNA, α-E catenin siRNA, α-N-catenin siRNA or a combination of both α-E catenin and α-N-catenin siRNA. (A) Immunoblot analysis of INS-1E lysates after siRNA transfection using α-E catenin antibody, α-N catenin antibody and α-Tubulin. (B) Insulin concentrations in supernatants of siRNA transfected cells. β-catenin depletion attenuates α-E catenin knockdown effect on glucose stimulated insulin secretion. INS-1E cells were transfected with negative control siRNA, α-E catenin siRNA, β-catenin siRNA or a combination of both α-E catenin and β-catenin siRNA. (C) Immunoblot analysis of INS-1E lysates after siRNA transfection. (D) Insulin concentrations in supernatants of siRNA transfected cells. Results are mean ± S.E.M. * P < 0.05 and ** P < 0.01 compared with control siRNA. glucose stimulated condition as assessed by two-way ANOVA. # P < 0.05 compared with control siRNA glucose stimulated condition as assessed by t-test. Similar results were obtained in at least three independent experiments.
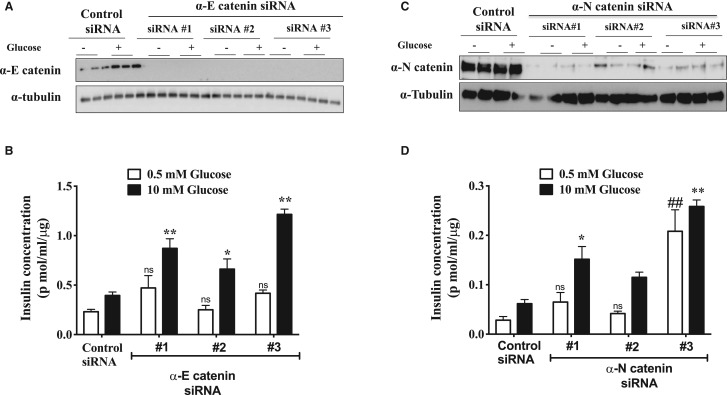
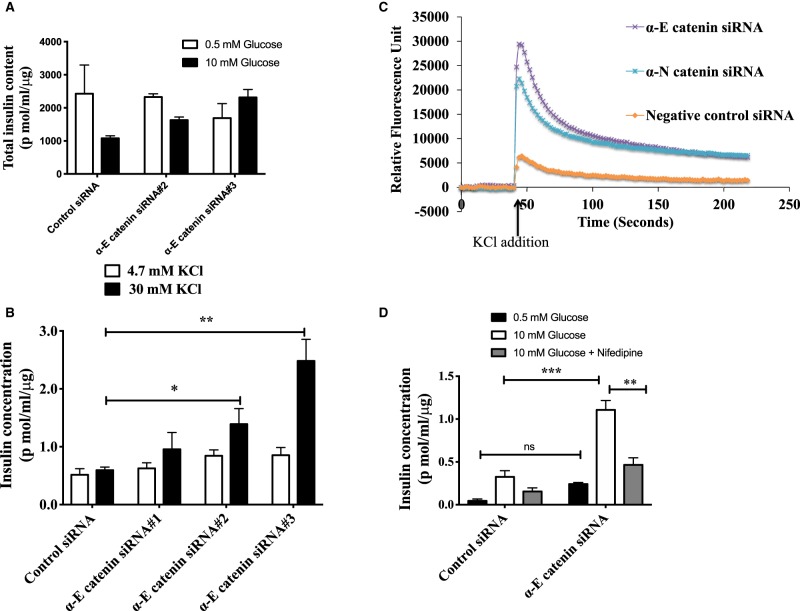
We independently investigated the roles of both of the isoforms of α-catenin in insulin secretion. Depletion of each isoform alone surprisingly resulted in an increase in GSIS in INS-1E (Figure 3A–D). Similar results were found in INS-1 832/3 cells (data not shown). Simultaneous depletion of both α-catenin isoforms had an additive increase on GSIS (Figure 4A,B). This effect of α-catenin depletion was the opposite of what we find when we deplete β-catenin, therefore we investigated the effect of simultaneous knockdown of both α- and β-catenin (Figure 4C,D). In these experiments we find that α-catenin induced increase in GSIS was almost totally attenuated when β-catenin was also knocked down. To investigate the mechanism by which α-catenin might be regulating insulin secretion we investigated the possibility that α-catenin was increasing levels of insulin overall in the β-cells but this was not the case (Figure 5A). We next investigated whether loss of α-catenin affected calcium influx into the cells. We used FLIPR to investigate the effects on voltage sensitive calcium influx into the β-cells initiated by K+ induced depolarisation. We find that KCl mediated increases in insulin release were increased in α-catenin depleted cells (Figure 5B) and that this is associated with a large increase in calcium influx into the cells (Figure 5C). Consistent with this influx in calcium being linked to the increase in insulin secretion we find that the calcium channel blocker nifedipene largely attenuated the increases in insulin secretion in the α-catenin depleted cells at a concentration of drug at which it is selective for L-type channels (Figure 5D).
Figure 3. α-catenin involve in the negative feedback mechanism during glucose stimulated insulin secretion.
INS-1E cells were transfected with either control siRNA or siRNA specific for α-E catenin or α-N catenin. Forty-eight hours after siRNA transfection, cells were serum starved for 2 h and stimulated with either 0.5 mM Glucose or 10 mM glucose for 2 h. Insulin concentrations were measured by performing alphaLIZA assays and were normalised to total protein content. (A) Immunoblot analysis of α-E catenin levels in INS-1E lysates after siRNA transfection and (B) insulin concentrations in supernatants of negative control or α-E catenin siRNA transfected cells. (C) Immunoblot analysis of α-N catenin protein level in INS-1E lysates after siRNA transfection and (D) insulin concentrations in supernatants of negative control or α-N catenin siRNA transfected cells. Results are mean ± S.E.M. * P < 0.05 and ** P < 0.01 compared with control glucose stimulated condition as assessed by two-way ANOVA. Similar results were obtained in at least three independent experiments.
Figure 5. α-E catenin depletion affects Calcium influx to β-cells.
(A) Forty-eight hours after siRNA transfection total insulin contents in the cell lysates were measured by alphaLIZA and normalised to total protein content. Similar results were obtained in at least two independent experiments. (B) INS-1E cells were transfected with either control siRNA or siRNA specific for α-E catenin. Forty-eight hours after siRNA transfection, cells were serum starved for 2 h and stimulated with either 4.7 mM KCl or 30 mM KCl for 2 h. Insulin concentrations were measured by performing alphaLISA assays and were normalised to total protein content. Results are mean ± S.E.M. * P < 0.05 and ** P < 0.01 compared with control/low glucose condition as assessed by two-way ANOVA. Similar results were obtained in at least three independent experiments. (C) α-catenin depletion increases the K+ stimulated Calcium flux into β-cells. INS-1E cells were transfected either with negative control siRNA or siRNA specific for either α-E catenin or α-N catenin. Forty-eight hours after siRNA transfection cells were incubated with calcium binding dye for 1 h at 37°C and readings were taken for 225 s at 2 s intervals. At 40 s, 10 µl of KCl was added to each well, such that the final KCl concentration is 30 mM. Relative Fluorescence units (RFU) were calculated by subtracting each fluorescence signal from initial fluorescence signal in different siRNA conditions. Similar results were obtained in at least three independent experiments. (D) Nifedipine treatment attenuates the α-E catenin knockdown effect on K+ stimulated insulin secretion. Forty-eight hours after siRNA transfection cells were stimulated with 10 mM glucose in the presence or absence of Calcium channel inhibitor-Nifedipine. Insulin concentrations were measured by performing alphaLISA assays and were normalised to total protein content. Results are mean ± S.E.M. * P < 0.05 and ** P < 0.01 compared with control/low glucose condition as assessed by two-way ANOVA.
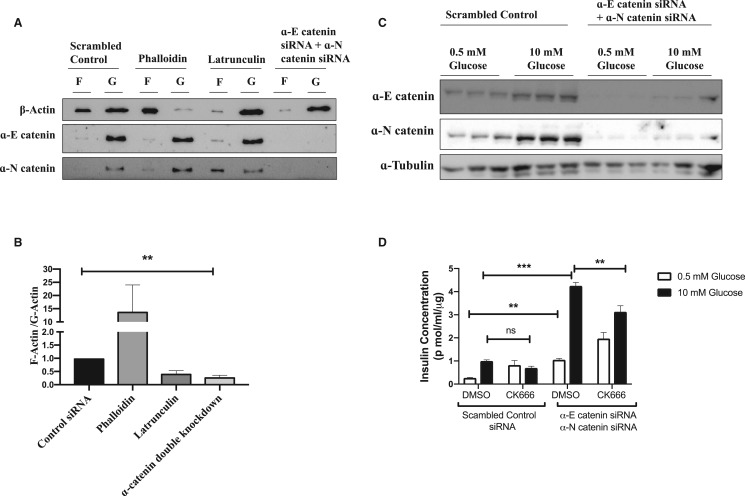
As α-catenin is a well-known actin cytoskeleton regulator, we investigated the effect of α-catenin depletion on actin polymerisation. When we simultaneously knockdown α-E catenin with α-N catenin we find that the ratio between filamentous (F)-actin and monomeric (G)-actin is significantly reduced (Figure 6A,B), similar to the effect of latrunculin which is also known to potentiate the GSIS [20]. Furthermore when we inhibit actin branching with ARP 2/3 inhibitor CK666, α-catenin knockdown effect on GSIS is attenuated indicating the α-catenin mediated regulation of insulin secretion potentially involves the regulation of branching of the actin cytoskeleton (Figure 6C,D).
Figure 6. α-catenin depletion affects actin polymerisation in INS-1E cells.
INS 1-E cells were transfected with either control siRNA or siRNA specific for α-E catenin and α-N catenin siRNA. Phalloidin was used as a positive control for actin polymerisation while latrunculin was used as a negative control. (A) F-actin was separated from G-actin by ultracentrifugation and expression of F-actin and G-actin were analysed by performing western blot analysis using β-actin antibody. (B) F-actin and G-actin ratio was analysed by densitometry. Results are mean ± S.E.M of four independent experiments. * P < 0.05 and ** P < 0.01 compared with control siRNA as assessed by unpaired t-test. INS-1E cells were transfected with either control siRNA or siRNA specific for α-E catenin and α-N catenin. Forty-eight hours after siRNA transfection cells were serum starved and stimulated with 10 mM Glucose in the presence of either DMSO or CK666. (C) Lysates were used for western blot analysis to confirm the knockdown. (D) AlphaLIZA assays were performed to measure the secreted insulin concentrations. Results are mean ± S.E.M. * P < 0.05 and ** P < 0.01 compared with control/low glucose condition as assessed by two-way ANOVA.
Discussion
Adherens junctions play an important role in the regulation of some vesicle trafficking processes, including GSIS [5,18,21,22]. β-catenin mediates some effects of adherens junctions [23] and we have previously shown its is required for the proper translocation of GLUT4 containing vesicles in adipocytes [21] and of insulin containing vesicles in β-cells [18]. The current study further explores the mechanisms involved by examining the role of the β-catenin binding partner α-catenin in GSIS. These studies show α-catenin is involved in negative feedback regulation of GSIS. At least in these these rat clonal model β-cell models the most likely interpretation of our data is that both α-E-catenin and α-N-catenin isoforms play functionally redundant roles in this process. We find that lowering α-catenin levels has a similar effect on insulin secretion and actin polymerisation to that clasically seen with latrunculin suggesting the α-catenin is important in maintaining appropriate cytoskeletal architecture to achieve proper regulation of insulin secretion.
Our evidence indicates that one role of the α-catenin is to regulate the processes regulating calcium levels in the β-cells following membrane depolarisation. Consistent with this it has previously been shown that dispersed β-cells have spontaneous fluctuations in intracellular calcium levels while stable calcium levels are seen in confluent β-cells [24]. The confluent β-cells have adherens junctions which provide a pool of α-catenin localised near the plasma membrane [25] and this could be involved in restraining the calcium fluxes. We have previously shown that lowering β-catenin levels attenuates glucose and KCl mediated release of insulin [17,18] but we did not find any effect of lowering β-catenin on calcium influx.
We find that reductions in β-catenin strongly attenuate the increases in GSIS seen when α-catenin levels are reduced indicating that the requirement for β-catenin in insulin secretion dominates over the effect of α-catenin. This suggests it is possible that the pool of β-catenin/α-catenin heterodimers act separately from α-catenin homodimers. The dimeric form of α-catenin is known to play a key role in regulating the actin cytoskeleton, a process known to be important in the control of insulin secretory vesicles [3,4]. Alpha-catenin dimers control the switch of actin from branch chains to linear cable structures by competing with for binding with the ARP 2/3 protein[25]. Consistant with this it has previously been shown that knockdown of N-WASP, which is an activator of ARP 2/3, suppresses GSIS suggesting that activation of ARP 2/3 is important for proper GSIS [26]. In our system where we lower α-catenin levels there will be less inhibitory effect on ARP 2/3 leading to more branched actin filaments and less linear actin cables, which can potentially give easy access to insulin granules to fuse with the plasma membrane. In accordance with this hypothesis, we found that when we inhibit actin branching with ARP 2/3 inhibitor CK666 in an α-catenin depleted system the α-catenin knockdown effect on insulin secretion is reduced. Overall these findings suggest that α-catenin mediated regulation of GSIS may occur through modulation of actin dynamics though the details by which α-catenin regulates GSIS remain to be resolved in future studies.
Our findings here that levels of α-catenin proteins are important in regulating insulin secretion means that factors controlling levels of these proteins have the potential to impact on the ability of β-cells to release insulin. Our finding that α-catenin levels change rapidly in response to changes in glucose in β-cell models thus suggests a mechanism by which high glucose levels might feed back to control levels of insulin secretion. This would potentially be important in fine-tuning insulin secretion in normal states but it would also be of interest to understand how changes in the levels of these proteins might be involved in causing the changes in β-cell function bought about by long term exposure to insulin resistant and diabetic states. Very little information is available on this although a redistribution of α-catenin away from adherens junctions has been observed in islets of mice fed a high fat diet [27].
Overall these studies show that α-catenin and β-catenin play opposing roles in regulating GSIS. The α-catenin is able to inhibit both calcium fluxes and insulin secretion while the β-catenin plays a separate role that is required for GSIS with the relative levels of each thus having potential to influence the overall ability of β-cells to secrete insulin after membrane depolarisation. However, since these studies are confined to rat clonal β-cell models, further studies will be required to understand whether these mechanisms play a role in the regulation of insulin secretion in functional islets where the proper cellular architecture will be present.
Acknowledgements
This work was supported by the Health Research Council of New Zealand and by a PhD Scholarship from the University of Auckland (W.D.) and a Rutherford Foundation Postdoctoral Research Fellowship (B.S.).
Abbreviations
- FBS
fetal bovine serum
- GSIS
glucose stimulated insulin secretion
Competing Interests
The authors declare that there are no competing interests associated with the manuscript.
Open Access
Open access for this article was enabled by the participation of University of Auckland in an all-inclusive Read & Publish pilot with Portland Press and the Biochemical Society under a transformative agreement with CAUL.
Author Contribution
Waruni Dissanayake, Brie Sorrenson, Kate Lee, and Peter Shepherd contributed to the experimental design. Waruni Dissanayake, Brie Sorrenson, Kate Lee, Sandra Barre performed the experiments. Waruni Dissanayake, Peter Shepherd analysed and interpreted the data. Waruni Dissanayake and Peter Shepherd wrote the paper.
References
- 1.Röder P.V., Wong X., Hong W. and Han W. (2016) Molecular regulation of insulin granule biogenesis and exocytosis. Biochem. J. 473, 2737–2756 10.1042/BCJ20160291 [DOI] [PubMed] [Google Scholar]
- 2.Rorsman P. and Braun M. (2013) Regulation of insulin secretion in human pancreatic islets. Annu. Rev. Physiol. 75, 155–179 10.1146/annurev-physiol-030212-183754 [DOI] [PubMed] [Google Scholar]
- 3.Zhu X., Hu R., Brissova M., Stein R.W., Powers A.C., Gu G. et al. (2015) Microtubules negatively regulate insulin secretion in pancreatic beta cells. Dev. Cell 34, 656–668 10.1016/j.devcel.2015.08.020 [DOI] [PMC free article] [PubMed] [Google Scholar]
- 4.Jewell J.L., Luo W., Oh E., Wang Z. and Thurmond D.C. (2008) Filamentous actin regulates insulin exocytosis through direct interaction with Syntaxin 4. J. Biol. Chem. 283, 10716–10726 10.1074/jbc.M709876200 [DOI] [PMC free article] [PubMed] [Google Scholar]
- 5.Dissanayake W.C., Sorrenson B. and Shepherd P.R. (2018) The role of adherens junction proteins in the regulation of insulin secretion. Biosci. Rep. 38, 10.1042/BSR20170989 [DOI] [PMC free article] [PubMed] [Google Scholar]
- 6.Gan W.J., Zavortink M., Ludick C., Templin R., Webb R., Webb R. et al. (2017) Cell polarity defines three distinct domains in pancreatic beta-cells. J. Cell Sci. 130, 143–151 10.1242/jcs.185116 [DOI] [PMC free article] [PubMed] [Google Scholar]
- 7.Geron E., Boura-Halfon S., Schejter E.D. and Shilo B.-Z. (2015) The edges of pancreatic islet beta cells constitute adhesive and signaling microdomains. Cell Rep. 10, 317–325 10.1016/j.celrep.2014.12.031 [DOI] [PubMed] [Google Scholar]
- 8.Meda P. (2013) Protein-mediated interactions of pancreatic islet cells. Scientifica (Cairo) 2013, 621249 10.1155/2013/621249 [DOI] [PMC free article] [PubMed] [Google Scholar]
- 9.Arous C. and Halban P.A. (2015) The skeleton in the closet: actin cytoskeletal remodeling in beta-cell function. Am. J. Physiol. Endocrinol. Metab. 309, E611–E620 10.1152/ajpendo.00268.2015 [DOI] [PubMed] [Google Scholar]
- 10.Rouiller D.G., Cirulli V. and Halban P.A. (1991) Uvomorulin mediates calcium-dependent aggregation of islet cells, whereas calcium-independent cell adhesion molecules distinguish between islet cell types. Dev. Biol. 148, 233–242 10.1016/0012-1606(91)90332-W [DOI] [PubMed] [Google Scholar]
- 11.Yamagata K., Nammo T., Moriwaki M., Ihara A., Iizuka K., Yang Q. et al. (2002) Overexpression of dominant-negative mutant hepatocyte nuclear fctor-1 alpha in pancreatic beta-cells causes abnormal islet architecture with decreased expression of E-cadherin, reduced beta-cell proliferation, and diabetes. Diabetes 51, 114–123 10.2337/diabetes.51.1.114 [DOI] [PubMed] [Google Scholar]
- 12.Wakae-Takada N., Xuan S., Watanabe K., Meda P. and Leibel R.L. (2013) Molecular basis for the regulation of islet beta cell mass in mice: the role of E-cadherin. Diabetologia 56, 856–866 10.1007/s00125-012-2824-6 [DOI] [PMC free article] [PubMed] [Google Scholar]
- 13.Johansson J.K., Voss U., Kesavan G., Kostetskii I., Wierup N., Radice G.L. et al. (2010) N-cadherin is dispensable for pancreas development but required for beta-cell granule turnover. Genesis 48, 374–381 10.1002/dvg.20628 [DOI] [PMC free article] [PubMed] [Google Scholar]
- 14.Parnaud G., Lavallard V., Bedat B., Matthey-Doret D., Morel P., Berney T. et al. (2015) Cadherin engagement improves insulin secretion of single human beta-cells. Diabetes 64, 887–896 10.2337/db14-0257 [DOI] [PubMed] [Google Scholar]
- 15.Bosco D., Rouiller D.G. and Halban P.A. (2007) Differential expression of E-cadherin at the surface of rat beta-cells as a marker of functional heterogeneity. J. Endocrinol. 194, 21–29 10.1677/JOE-06-0169 [DOI] [PubMed] [Google Scholar]
- 16.Shapiro L. and Weis W.I. (2009) Structure and biochemistry of cadherins and catenins. Cold Spring Harb. Perspect. Biol. 1, a003053 10.1101/cshperspect.a003053 [DOI] [PMC free article] [PubMed] [Google Scholar]
- 17.Cognard E., Dargaville C.G., Hay D.L. and Shepherd P.R. (2013) Identification of a pathway by which glucose regulates beta-catenin signalling via the cAMP/protein kinase A pathway in beta-cell models. Biochem. J. 449, 803–811 10.1042/BJ20121454 [DOI] [PubMed] [Google Scholar]
- 18.Sorrenson B., Cognard E., Lee K.L., Dissanayake W.C., Fu Y., Han W. et al. (2016) A critical role for β-catenin in modulating levels of insulin secretion from β-cells by regulating actin cytoskeleton and insulin vesicle localization. J. Biol. Chem. 291, 25888–25900 10.1074/jbc.M116.758516 [DOI] [PMC free article] [PubMed] [Google Scholar]
- 19.McEwen H.J.L., Cognard E., Ladyman S.R., Khant-Aung Z., Tups A., Shepherd P.R. et al. (2018) Feeding and GLP-1 receptor activation stabilize beta-catenin in specific hypothalamic nuclei in male rats. J. Neuroendocrinol. 30, e12607 10.1111/jne.12607 [DOI] [PubMed] [Google Scholar]
- 20.Thurmond D.C., Gonelle-Gispert C., Furukawa M., Halban P.A. and Pessin J.E. (2003) Glucose-stimulated insulin secretion is coupled to the interaction of actin with the t-SNARE (target membrane soluble N-ethylmaleimide-sensitive factor attachment protein receptor protein) complex. Mol. Endocrinol. 17, 732–742 10.1210/me.2002-0333 [DOI] [PubMed] [Google Scholar]
- 21.Dissanayake W.C., Sorrenson B., Cognard E., Hughes W.E. and Shepherd P.R. (2018) β-catenin is important for the development of an insulin responsive pool of GLUT4 glucose transporters in 3T3-L1 adipocytes. Exp. Cell Res. 366, 49–54 10.1016/j.yexcr.2018.03.011 [DOI] [PubMed] [Google Scholar]
- 22.Hou J.C., Shigematsu S., Crawford H.C., Anastasiadis P.Z. and Pessin J.E. (2006) Dual regulation of Rho and Rac by p120 catenin controls adipocyte plasma membrane trafficking. J. Biol. Chem. 281, 23307–23312 10.1074/jbc.M603127200 [DOI] [PubMed] [Google Scholar]
- 23.Vlad-Fiegen A., Langerak A., Eberth S. and Müller O. (2012) The Wnt pathway destabilizes adherens junctions and promotes cell migration via β-catenin and its target gene cyclin D1. FEBS Open Bio 2, 26–31 10.1016/j.fob.2012.02.004 [DOI] [PMC free article] [PubMed] [Google Scholar]
- 24.Jaques F., Jousset H., Tomas A., Prost A.-L., Wollheim C.B., Irminger J.-C. et al. (2008) Dual effect of cell-cell contact disruption on cytosolic calcium and insulin secretion. Endocrinology 149, 2494–2505 10.1210/en.2007-0974 [DOI] [PubMed] [Google Scholar]
- 25.Pokutta S., Drees F., Yamada S., Nelson W.J. and Weis W.I. (2008) Biochemical and structural analysis of alpha-catenin in cell-cell contacts. Biochem. Soc. Trans. 36, 141–147 10.1042/BST0360141 [DOI] [PMC free article] [PubMed] [Google Scholar]
- 26.Uenishi E., Shibasaki T., Takahashi H., Seki C., Hamaguchi H., Yasuda T. et al. (2013) Actin dynamics regulated by the balance of neuronal wiskott-Aldrich syndrome protein (N-WASP) and cofilin activities determines the biphasic response of glucose-induced insulin secretion. J. Biol. Chem. 288, 25851–25864 10.1074/jbc.M113.464420 [DOI] [PMC free article] [PubMed] [Google Scholar]
- 27.Falcão V.T.F.L., Maschio D.A., de Fontes C.C., Oliveira R.B., Santos-Silva J.C., Almeida A.C.S. et al. (2016) Reduced insulin secretion function is associated with pancreatic islet redistribution of cell adhesion molecules (CAMS) in diabetic mice after prolonged high-fat diet. Histochem. Cell Biol. 146, 13–31 10.1007/s00418-016-1428-5 [DOI] [PubMed] [Google Scholar]


