

Abstract
People who inject drugs (PWID) face disparities in human immunodeficiency virus (HIV) treatment outcomes and may be less likely to achieve durable viral suppression. We characterized transitions into and out of viral suppression from 1997 to 2017 in a long-standing community-based cohort study of PWID, the AIDS Link to Intravenous Experience (ALIVE) Study, analyzing HIV-positive participants who had made a study visit in or after 1997. We defined the probabilities of transitioning between 4 states: 1) suppressed, 2) detectable, 3) lost to follow-up, and 4) deceased. We used multinomial logistic regression analysis to examine factors associated with transition probabilities, with a focus on transitions from suppression to other states. Among 1,061 participants, the median age was 44 years, 32% were female, 93% were African-American, 59% had recently injected drugs, and 28% were virologically suppressed at baseline. Significant improvements in durable viral suppression were observed over time; however, death rates remained relatively stable. In adjusted analysis, injection drug use and homelessness were associated with increased virological rebound in earlier time periods, while only age and race were associated with virological rebound in 2012–2017. Opioid use was associated with an increased risk of death following suppression in 2012–2017. Despite significant improvements in durable viral suppression, subgroups of PWID may need additional efforts to maintain viral suppression and prevent premature mortality.
Keywords: acquired immunodeficiency syndrome, HIV, HIV care continuum, mortality, opioids, people who inject drugs, viral suppression
The widespread use of antiretroviral therapy (ART) since the mid-1990s has had a substantial impact on human immunodeficiency virus (HIV) incidence, morbidity, and mortality in the modern era. Rates of viral suppression have nearly universally improved across populations and countries (1, 2). However, despite the realization of enormous gains for people living with HIV and significant improvements in key populations, people who inject drugs (PWID) and those with a history of injection drug use continue to face vast disparities in treatment outcomes and experience higher HIV-related mortality rates than other key populations living with HIV (3, 4).
While overall rates of viral suppression have increased among PWID (5, 6), rates remain lower among PWID than in other key populations (6–8). Understanding durable suppression is critical, since it is now well recognized that a longer duration of HIV viral suppression is associated with reduced adverse outcomes (9–11). Indeed, rebound of viral load is associated with negative consequences for both individual health, including viral resistance (9), and the population at large, because persons with ongoing viremia can continually transmit the virus.
The lower rates of viral suppression among PWID may be explained by a confluence of factors, including poorer access to HIV care, lower adherence to ART, and decreased retention in HIV care over time (4, 6, 7, 12, 13), as compared with other groups. Inconsistent engagement in HIV care is at least partly explained by social and structural factors such as incarceration and residential instability (8, 14, 15), which may be exacerbated in urban settings of socioeconomic marginalization and violence (16, 17).
The relationship between active injection drug use and poor treatment outcomes has been consistently reported across geographic settings (6, 7, 18, 19). However, much of the United States has experienced a shift in drug-use patterns as a result of the opioid crisis (20), which may further impact durable viral suppression among PWID in the era of modern HIV therapy (21). The AIDS Link to Intravenous Experience (ALIVE) Study has charted the natural and treated history of HIV among PWID in Baltimore, Maryland, since 1988. In 1988, when the first participants were enrolled, PWID in Baltimore injected predominantly heroin or speedball (heroin combined with cocaine). However, over the past decade, commensurate with shifts throughout the United States and in Maryland and Baltimore City, the ALIVE investigators have observed shifting patterns of drug use, with increased use of prescription opioids and of heroin adulterated with fentanyl (20, 22–26). The ALIVE Study provides a unique context in which to explore how changing patterns of substance use affect durable viral suppression in an aging population of PWID.
Our objective in this study was to examine longitudinal trends in durable viral suppression and mortality among people who currently inject or formerly injected drugs in Baltimore. We further examined whether associations of transitions into and out of viral suppression with drug use and related social-structural factors varied over 3 time periods (1997–2004, 2005–2011, and 2012–2017) representing important changes in HIV treatment guidelines and the dynamics of opioid use.
METHODS
Study population
ALIVE is a community-based cohort study that has followed people who inject drugs or have a history of injection drug use in Baltimore since 1988. The study has been described in detail elsewhere (27). Briefly, participants were eligible for recruitment if they were 18 years of age or older and reported a history of injection drug use. Overall, 5,084 PWID enrolled in ALIVE over the course of 5 recruitment waves; 1,369 (27%) of them were HIV-positive. Following the initial recruitment of 707 HIV-positive PWID in 1988–1989, 80 were recruited in 1994–1995, 114 in 1998, 317 in 2005–2008, and 151 in 2015–2018. At semiannual follow-up visits, participants complete laboratory testing for HIV RNA and report on behavioral, demographic, and other sociostructural factors via interviewer-administered questionnaires and audio computer-assisted self-interviews. Death is ascertained using the National Death Index. The current analysis includes data from all HIV-positive participants who were alive and in study follow-up for at least 9 months during or after 1997. Follow-up data collected through 2017 were included.
Definition of states
We partitioned time into fixed 9-month intervals starting from study enrollment. Although study visits are scheduled at 6-month intervals, we used 9-month intervals to accommodate late visits. Participant status at each interval endpoint was classified using 4 mutually exclusive states: 1) suppressed, 2) detectable, 3) lost to follow-up, and 4) deceased. Viral suppression was defined conservatively as an HIV RNA load less than or equal to 400 copies/mL to account for changes in the lower level of detection over the 20 years of the study. Loss to follow-up was defined as having made no study visits within the 9-month interval. While patients could transition out of the suppressed, detectable, and lost-to-follow-up states, death was an absorbing state.
Statistical analysis
We employed descriptive statistics to characterize the study sample at baseline with regard to 3 time periods: 1997–2004, 2005–2011, and 2012–2017. These time periods were chosen to reflect advances in HIV treatment, changes in health insurance policies, and shifts in patterns of opioid use and interventions. Pearson’s χ2 test was used to examine differences in baseline characteristics by time period.
Discrete-time multistate models were used to estimate the probability of entering each state: viral suppression, detectable, lost to follow-up, and death. Separate models estimated the probability of transition from detectable to other states and from lost to follow-up to other states. The state transition rates were defined as pjk(t) = Pr(in state k at time t | in state j at time t − 1) = Pr(transition from state j to state k at time t). For example, p12(t) is the probability of viral rebound and p11(t) is the probability of durable viral suppression. We examined probabilities of durable suppression and transitions to death, overall and by year, from 1997 to 2017.
Multinomial regression models were used to estimate the associations of demographic, sociostructural, health-care, and substance–use factors with state transitions. Time-fixed demographic characteristics included sex (male/female), age (years), race (African-American vs. other), and educational attainment (high school diploma or more vs. less than high school). Informed by prior research on viral suppression among PWID and conceptual frameworks of sociostructural aspects of substance use (7, 8, 18, 19, 28, 29), we also examined time-varying characteristics in the prior 6 months across several domains, including: 1) sociostructural factors: employment (yes/no), homelessness (yes/no,) and incarceration for 7 days or longer (yes/no); 2) health, mental health, and HIV care access: initiation of ART (ever vs. never), time since ART initiation (years), having a regular primary-care provider (yes/no), possession of health insurance (yes/no), and use of medication-assisted therapy (MAT), including methadone (1997–2017) and buprenorphine (2005–2017) (yes/no); and 3) substance use: injection drug use (yes/no), crack cocaine use (yes/no), use of opioids, including heroin (1997–2017) and nonmedical prescription opioids (2005–2017) by any route of administration (yes/no), and frequency of alcohol use (daily or more often, less than daily, or none). Depressive symptoms, measured using the Center for Epidemiologic Studies Depression Scale (30) (score ≥23 vs. <23), and HIV care were measured starting in 2005 and were therefore only considered from 2005 to 2017.
We examined differences in state transitions by calendar period, comparing 1997–2004 (early ART era) with 2005–2011 (modern ART and prescription opioid era) and 2012–2017 (test-and-treat and fentanyl era). We examined whether covariates associated with state transitions differed by time period with stratified analysis. We formally evaluated effect modification by time period for the associations of injection drug use and opioid use with the outcome by including interaction terms in the models. Coefficients are log relative risk ratios, and adjusted relative risk ratios represent the association between the covariate and state transitions relative to remaining in the reference state. Covariates were included in adjusted analysis depending on our conceptual framework, informed by a priori factors known to be associated with viral suppression in PWID and complete measurement across the 20-year study period. We excluded any variable with sparse data (cell sizes of 0 in unadjusted analysis) from the adjusted analysis. Variables related to ART initiation (time since ART initiation, history of ever using ART, engagement in HIV care) were excluded from multivariable models because of potentially mediating effects. We conducted sensitivity analysis by examining results from the final model while varying the length of the time intervals (9 months vs. 7 months).
RESULTS
Sample characteristics
In total, there were 18,796 nine-month time intervals among 1,061 HIV-positive participants. Each individual contributed a median of 15 time intervals (interquartile range (IQR), 8–25). The median age was 44 years (IQR, 39–49); 32% of participants were female, 93% were African-American, and 59% had injected drugs during the 6 months prior to the first visit included in this analysis (Table 1). Twenty-eight percent of participants (n = 294) were virally suppressed at the first included study visit. The median duration of time since ART initiation was 3.9 years (IQR, 2.4–6.7). Participants had a higher median age in 2012–2017 (P < 0.0001) and a lower proportion were African-American in 2012–2017 (P < 0.0001), compared with the earlier time periods.
Table 1.
Sociodemographic and Recent (Prior 6 Months) Behavioral Characteristics at the First Eligible Study Visit (During or After 1997), by Calendar Period, for 1,061 People Living With HIV Who Formerly or Currently Injected Drugs, ALIVE Study, Baltimore, Maryland, 1997–2017a
| Baseline Characteristic | Time Period | P Value | |||||||
|---|---|---|---|---|---|---|---|---|---|
| Total (n = 1,061) | 1997–2004 (n = 673) | 2005–2011 (n = 300) | 2012–2017 (n = 88) | ||||||
| No. | % | No. | % | No. | % | No. | % | ||
| Demographic characteristics | |||||||||
| Age, yearsb | 44 (39–49) | 41 (37–46) | 47 (42–51) | 53 (48–57) | <0.0001 | ||||
| Female sex | 339 | 32 | 205 | 30 | 112 | 37 | 22 | 25 | 0.04 |
| African-American race | 983 | 93 | 646 | 96 | 263 | 88 | 74 | 84 | <0.0001 |
| High school diploma or more | 412 | 39 | 254 | 38 | 118 | 39 | 40 | 45 | 0.45 |
| Sociostructural factors in prior 6 months | |||||||||
| Employed | 139 | 13 | 108 | 16 | 26 | 9 | 5 | 6 | 0.001 |
| Incarcerated | 188 | 18 | 129 | 20 | 54 | 19 | 5 | 6 | 0.01 |
| Homeless | 191 | 18 | 94 | 14 | 75 | 26 | 22 | 25 | <0.0001 |
| HIV care | |||||||||
| ART initiationc | 930 | 88 | 575 | 85 | 267 | 89 | 88 | 100 | <0.0001 |
| Time since first ART initiationb | 3.9 (2.4–6.7) | 3.6 (2.5–4.8) | 5.2 (0.8–13.9) | 12.2 (6.7–19.3) | <0.0001 | ||||
| Health care and mental health in prior 6 months | |||||||||
| Regular primary-care provider | 830 | 80 | 476 | 72 | 269 | 93 | 85 | 97 | <0.0001 |
| Possession of health insurance | 763 | 74 | 421 | 64 | 255 | 88 | 87 | 99 | <0.0001 |
| Medication-assisted therapyd | 209 | 20 | 96 | 15 | 60 | 21 | 53 | 60 | <0.0001 |
| Depressive symptomse,f | 108 | 29 | 81 | 28 | 27 | 31 | 0.61 | ||
| Substance use in prior 6 months | |||||||||
| Any injection drug use | 618 | 59 | 379 | 57 | 180 | 62 | 59 | 68 | 0.10 |
| Crack cocaine use | 311 | 30 | 141 | 21 | 124 | 43 | 46 | 53 | <0.0001 |
| Alcohol use | 0.37 | ||||||||
| None | 423 | 41 | 276 | 42 | 115 | 40 | 32 | 37 | |
| Less than daily | 507 | 49 | 309 | 47 | 150 | 52 | 48 | 55 | |
| Daily or more often | 107 | 10 | 75 | 11 | 25 | 9 | 7 | 8 | |
| Any opioid useg | 588 | 57 | 374 | 57 | 157 | 54 | 57 | 66 | 0.17 |
| Nonmedical prescription opioid usee | 80 | 21 | 56 | 20 | 24 | 28 | 0.11 | ||
Abbreviations: ALIVE, AIDS Link to Intravenous Experience; ART, antiretroviral therapy; HIV, human immunodeficiency virus.
a Participants with missing values were excluded from the calculation of percentages.
b Values are expressed as median (interquartile range).
c Ever use of ART.
d Includes methadone (1997–2017) and methadone and/or buprenorphine (2014–2017).
e Among those with a first eligible study visit in or after 2005.
f Center for Epidemiologic Studies Depression Scale score ≥23.
g Includes heroin by any route and nonmedical prescription opioids (2005–2017).
Transition probabilities
HIV-positive PWID experienced a median of 5 transitions (IQR, 3–8). Among the 708 (67%) PWID with at least 1 suppressed interval, the median duration of viral suppression was 2 intervals (IQR, 1–4), with a median of 2 transitions out of the suppressed state (IQR, 1–3).
From 1997 to 2017, the probabilities of durable suppression, viral rebound, and death when suppressed were 0.72, 0.15, and 0.02, respectively (Figure 1). The probabilities of staying detectable, becoming suppressed, or dying when detectable were 0.67, 0.14, and 0.04, respectively. The probability of durable viral suppression increased, on average, from 0.46 in 1997 to 0.80 in 2017 (Figure 2A). The probability of viral rebound initially increased from 0.23 in 1997 to 0.35 in 1999 and then decreased to 0.15 in 2017. The probability of remaining detectable remained relatively flat, ranging from 0.75 in 1998 to 0.72 in 2009, with a downward trend from 2009 onward, to 0.51 in 2017 (Figure 2A).
Figure 1.
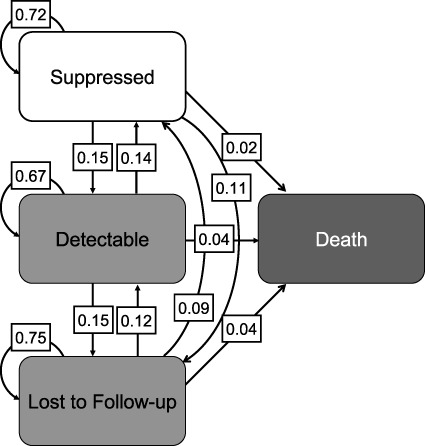
Overall probabilities of transitions between states (suppressed, detectable, lost to follow-up, and death) among people living with human immunodeficiency virus who inject drugs, ALIVE Study, Baltimore, Maryland, 1997–2017. ALIVE, AIDS Link to Intravenous Experience.
Figure 2.
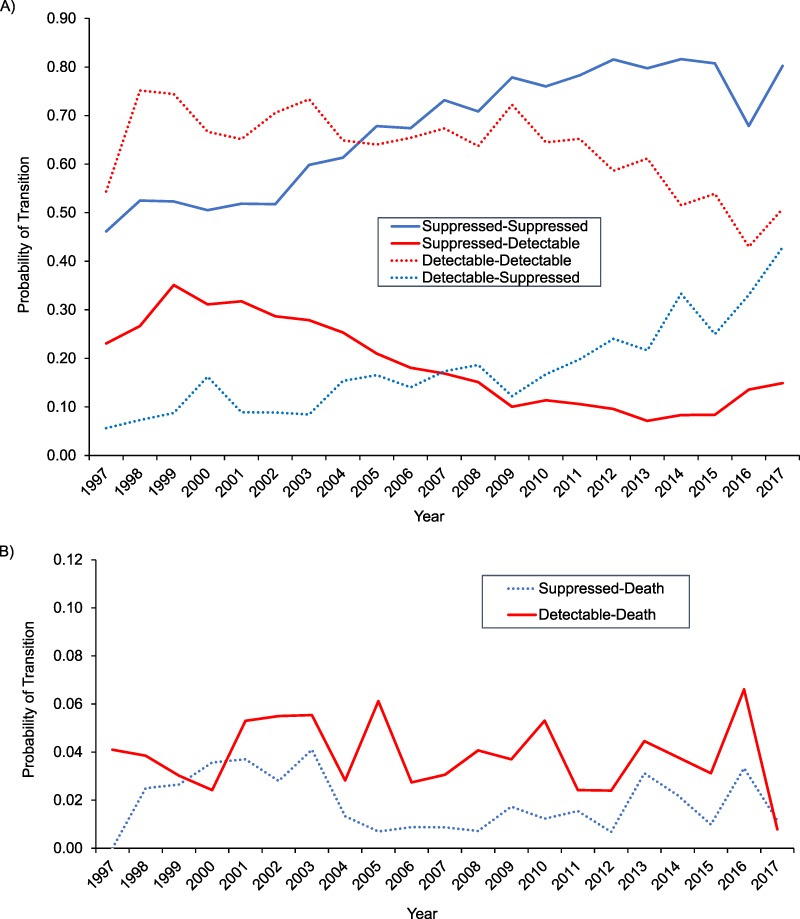
Probability of transitions between suppressed and detectable states, by year (A), and probability of transitioning out of the suppressed or detectable state to death, by year (B), among people living with HIV who inject drugs, ALIVE Study, Baltimore, Maryland, 1997–2017. ALIVE, AIDS Link to Intravenous Experience; HIV, human immunodeficiency virus.
There were 584 deaths between 1997 and 2017, and the overall probability of mortality was 0.03 (Figure 2B). While the probability of death following detectable HIV RNA remained relatively stable from 1997 to 2017, the probability of death following suppression was lowest between 2005 and 2011.
Associations between covariates and viral rebound following suppression
Demographic factors.
Older age was associated with decreased probability of viral rebound in 2005–2011 and 2012–2017, but not in 1997–2004 (Table 2). African-American PWID were less likely than other PWID to transition from the suppressed state to the detectable state in 2012–2017 (relative risk ratio = 0.39, 95% confidence interval (CI): 0.22, 0.72).
Table 2.
Association of Covariates With Transitions From the Virally Suppressed State to a Detectable State or Death Among People Living With HIV Who Inject Drugs, ALIVE Study, Baltimore, Maryland, 1997–2017
| State at Time t j | Time Period and State a | |||||||||||
|---|---|---|---|---|---|---|---|---|---|---|---|---|
| 1997–2004 | 2005–2011 | 2012–2017 | ||||||||||
| (n = 328 Participants and | (n = 427 Participants and | (n = 400 Participants and | ||||||||||
| 1,097 Time Intervals) | 2,319 Time Intervals) | 2,031 Time Intervals) | ||||||||||
| Detectable | Death | Detectable | Death | Detectable | Death | |||||||
| RRR | 95% CI | RRR | 95% CI | RRR | 95% CI | RRR | 95% CI | RRR | 95% CI | RRR | 95% CI | |
| Demographic characteristics | ||||||||||||
| Age, years | 0.99 | 0.96, 1.02 | 1.04 | 0.97, 1.12 | 0.94 | 0.91, 0.96 | 0.99 | 0.93, 1.04 | 0.95 | 0.93, 0.97 | 1.04 | 1.00, 1.08 |
| Female sex | 1.17 | 0.78, 1.75 | 1.39 | 0.64, 3.04 | 1.21 | 0.84, 1.73 | 0.52 | 0.19, 1.41 | 0.97 | 0.66, 1.44 | 0.71 | 0.35, 1.44 |
| African-American race | 1.25 | 0.43, 3.60 | 1.49 | 0.17, 13.0 | 0.56 | 0.28, 1.09 | 0.34 | 0.10, 1.10 | 0.39 | 0.22, 0.72 | 0.72 | 0.21, 2.48 |
| High school education or more | 0.89 | 0.60, 1.31 | 0.68 | 0.30, 1.53 | 0.53 | 0.36, 0.76 | 0.91 | 0.40, 2.03 | 0.93 | 0.65, 1.32 | 1.32 | 0.72, 2.44 |
| Sociostructural factorsb | ||||||||||||
| Employed | 0.75 | 0.50, 1.12 | 0.96 | 0.40, 2.29 | 0.77 | 0.47, 1.23 | 0.49 | 0.11, 1.90 | 0.73 | 0.45, 1.17 | 1.02 | 0.39, 2.71 |
| Incarceratedb,c | 3.79 | 1.73, 8.31 | 2.03 | 1.09, 3.80 | 3.37 | 0.79, 14.40 | 1.32 | 0.46, 3.83 | ||||
| Homeless | 2.27 | 1.28, 4.03 | 2.08 | 0.62, 6.90 | 2.08 | 1.43, 3.03 | 1.15 | 0.26, 5.01 | 2.17 | 1.25, 3.77 | 1.14 | 0.28, 4.72 |
| Health care and mental healthb | ||||||||||||
| Time since ART initiation, years | 0.99 | 0.95, 1.04 | 0.99 | 0.91, 1.08 | 0.96 | 0.94, 0.99 | 0.96 | 0.90, 1.01 | 0.97 | 0.95, 0.99 | 1.02 | 0.98, 1.06 |
| HIV cared | 0.73 | 0.51, 1.04 | 0.35 | 0.14, 0.86 | 1.24 | 0.63, 2.45 | 0.88 | 0.26, 2.89 | ||||
| Regular primary-care providerc | 0.54 | 0.25, 1.18 | 0.47 | 0.17, 1.30 | 0.30 | 0.12, 0.79 | 0.39 | 0.06, 2.66 | ||||
| Possession of health insurancec | 0.86 | 0.53, 1.40 | 1.60 | 0.36, 7.16 | 0.31 | 0.18, 0.54 | 0.65 | 0.08, 5.01 | 0.23 | 0.07, 0.76 | ||
| Medication-assisted therapy | 1.06 | 0.72, 1.54 | 1.02 | 0.44, 2.33 | 1.34 | 0.93, 1.92 | 0.88 | 0.33, 2.35 | 1.05 | 0.76, 1.46 | 0.65 | 0.34, 1.25 |
| Depressive symptomsd,e | 1.34 | 0.91, 1.97 | 1.54 | 0.61, 3.88 | 1.35 | 0.93, 1.96 | 1.39 | 0.71, 2.73 | ||||
| Substance useb | ||||||||||||
| Any injection drug use | 1.59 | 1.08, 2.32 | 1.42 | 0.65, 3.11 | 2.48 | 1.79, 3.45 | 1.31 | 0.48, 3.53 | 1.48 | 1.00, 2.20 | 2.79 | 1.49, 5.22 |
| Crack cocaine use | 1.66 | 0.92, 3.01 | 0.38 | 0.05, 2.91 | 1.44 | 0.98, 2.11 | 2.24 | 0.95, 5.25 | 1.71 | 1.18, 2.48 | 1.18 | 0.58, 2.41 |
| Alcohol use | 1.45 | 1.00, 2.10 | 0.64 | 0.26, 1.56 | 1.31 | 0.96, 1.78 | 1.23 | 0.56, 2.76 | 1.59 | 1.16, 2.19 | 1.44 | 0.79, 2.63 |
| Any opioid use | 1.46 | 0.99, 2.16 | 0.88 | 0.36, 2.17 | 1.87 | 1.30, 2.69 | 1.71 | 0.67, 4.40 | 1.30 | 0.88, 1.92 | 3.42 | 1.86, 6.30 |
| Nonmedical prescription opioid used | 2.13 | 1.25, 3.63 | 2.15 | 0.50, 9.30 | 0.62 | 0.27, 1.41 | 1.51 | 0.53, 4.28 | ||||
Abbreviations: ALIVE, AIDS Link to Intravenous Experience; ART, antiretroviral therapy; CI, confidence interval; HIV, human immunodeficiency virus; RRR, relative risk ratio.
a Relative to durable viral suppression (suppressed at time tj−1 and suppressed at time tj).
b Data reflect behaviors/characteristics from the prior 6 months.
c Not estimated for death because of a cell size of 0.
d Data were only available from 2005–2016.
e Center for Epidemiologic Studies Depression Scale score ≥23.
Sociostructural factors.
Incarceration was associated with increased probability of viral rebound in 1997–2004 and 2005–2011, but not in 2012–2017 (Table 2). Viral rebound was consistently 2-fold more likely among persons reporting homelessness across all time periods.
HIV treatment and health care.
Time since ART initiation and possession of health insurance were significantly associated with lower probability of viral rebound in the later 2 time periods, while having a regular primary-care provider was associated with lower probability of viral rebound in the late period only (Table 2).
Substance use.
Injection drug use was consistently associated with increased probability of viral rebound in unadjusted analysis in all time periods (Table 2). Alcohol use was associated with increased viral rebound in the early (1997–2004) and late (2012–2017) time periods, while crack use was associated with viral rebound in the late (2012–2017) time period. Opioid use and nonmedical prescription opioid use were associated with increased risk of viral rebound in the middle time period only (2005–2011).
Associations between covariates and death following viral suppression
Older age, injection drug use, and opioid use were positively associated with death following suppression in the late time period (2012–2017). There was a protective association between recent HIV care and death following suppression in the middle time period. There were no other demographic, sociostructural, or health-care utilization factors significantly associated with transition from suppression to death in any time period.
Multivariable models for transitions from suppression to viral rebound
Older age and high school education in 2005–2011 and older age and African-American race in 2012–2017 remained associated with decreased probability of viral rebound in multivariable analysis (Table 3). Homelessness remained positively associated with viral rebound in 1997–2004 and 2005–2011, but not in 2012–2017. Active injection drug use was associated with viral rebound in the middle time period (adjusted relative risk ratio (aRRR) = 2.20, 95% CI: 1.39, 3.48), but not in the early or later time period.
Table 3.
Adjusteda Associations of Covariates With Transitions From the Virally Suppressed State to a Detectable State or Death Among People Living With HIV Who Inject Drugs, ALIVE Study, Baltimore, Maryland, 1997–2017
| State at Time t j | Time Period and State b | |||||||||||
|---|---|---|---|---|---|---|---|---|---|---|---|---|
| 1997–2004 | 2005–2011 | 2012–2017 | ||||||||||
| (n = 325 Participants and | (n = 424 Participants and | (n = 397 Participants and | ||||||||||
| 1,094 Time Intervals) | 2,302 Time Intervals) | 2,017 Time Intervals) | ||||||||||
| Detectable | Death | Detectable | Death | Detectable | Death | |||||||
| RRR | 95% CI | RRR | 95% CI | RRR | 95% CI | RRR | 95% CI | RRR | 95% CI | RRR | 95% CI | |
| Demographic characteristics | ||||||||||||
| Age, years | 1.00 | 0.97, 1.03 | 1.06 | 0.98, 1.14 | 0.93 | 0.91, 0.96 | 0.98 | 0.92, 1.04 | 0.96 | 0.93, 0.99 | 1.04 | 0.99, 1.09 |
| Female sex | 1.22 | 0.78, 1.91 | 1.62 | 0.70, 3.73 | 1.11 | 0.76, 1.61 | 0.51 | 0.18, 1.46 | 0.90 | 0.60, 1.33 | 0.91 | 0.44, 1.89 |
| African-American race | 1.45 | 0.45, 4.72 | 1.64 | 0.19, 14.4 | 0.62 | 0.30, 1.26 | 0.35 | 0.10, 1.20 | 0.48 | 0.27, 0.88 | 0.51 | 0.13, 2.03 |
| High school education or more | 0.90 | 0.61, 1.32 | 0.71 | 0.31, 1.62 | 0.54 | 0.36, 0.79 | 0.81 | 0.33, 1.96 | 0.80 | 0.55, 1.16 | 1.12 | 0.58, 2.14 |
| Sociostructural factorsc | ||||||||||||
| Employed | 0.84 | 0.56, 1.25 | 1.13 | 0.45, 2.87 | 0.95 | 0.58, 1.57 | 0.49 | 0.11, 2.11 | 0.80 | 0.46, 1.37 | 1.41 | 0.50, 3.96 |
| Homeless | 2.10 | 1.17, 3.75 | 1.76 | 0.59, 5.25 | 1.76 | 1.17, 2.64 | 0.90 | 0.17, 4.69 | 1.58 | 0.88, 2.81 | 1.01 | 0.23, 4.34 |
| Health care and mental healthc | ||||||||||||
| Medication-assisted therapy | 1.05 | 0.72, 1.55 | 1.02 | 0.42, 2.47 | 1.01 | 0.68, 1.48 | 0.70 | 0.21, 2.28 | 0.88 | 0.63, 1.23 | 0.47 | 0.23, 0.94 |
| Substance usec | ||||||||||||
| Any injection drug use | 1.33 | 0.76, 2.33 | 3.63 | 1.51, 8.73 | 2.20 | 1.39, 3.48 | 0.68 | 0.14, 3.31 | 1.27 | 0.78, 2.08 | 1.37 | 0.57, 3.33 |
| Crack cocaine use | 1.34 | 0.78, 2.33 | 0.39 | 0.05, 3.30 | 1.10 | 0.70, 1.72 | 2.30 | 0.82, 6.49 | 1.36 | 0.87, 2.14 | 0.58 | 0.25, 1.36 |
| Alcohol use | 1.26 | 0.88, 1.80 | 0.62 | 0.26, 1.52 | 1.21 | 0.85, 1.72 | 0.78 | 0.32, 1.95 | 1.43 | 0.99, 2.07 | 1.13 | 0.58, 2.18 |
| Any opioid use | 0.97 | 0.56, 1.67 | 0.39 | 0.12, 1.27 | 0.87 | 0.52, 1.45 | 1.54 | 0.34, 6.92 | 0.84 | 0.51, 1.39 | 4.15 | 1.54, 11.1 |
Abbreviations: ALIVE, AIDS Link to Intravenous Experience; ART, antiretroviral therapy; CI, confidence interval; HIV, human immunodeficiency virus; RRR, relative risk ratio.
a Results were adjusted for all variables in the table, plus year of enrollment in ALIVE.
b Relative to durable viral suppression (suppressed at time tj−1 and suppressed at time tj).
c Data reflect behaviors/characteristics from the prior 6 months.
Multivariable models for transitions from suppression to death
Active injection drug use was associated with a nearly 4-fold increased probability of death (aRRR = 3.63, 95% CI: 1.51, 8.73) in 1997–2004, but not in the later time periods. While none of the other substance use variables were associated with death following suppression, opioid use was associated with a 4-fold increase in mortality (aRRR = 4.15, 95% CI: 1.54, 11.1) in 2012–2017. MAT was associated with reduced probability of death in 2012–2017 (aRRR = 0.47, 95% CI: 0.23, 0.94).
Associations between covariates and loss to follow-up from viral suppression
Older PWID were less likely to be lost to follow-up after viral suppression, while incarceration was positively associated with loss following suppression in all 3 time periods (see Web Table 1, available at https://academic.oup.com/aje). In adjusted analysis, African-American PWID were less likely to be lost in the early and middle time periods, and homelessness was associated with losses in the early and later time periods (Web Table 2).
Sensitivity analyses
Sensitivity analyses demonstrated that results were robust to changes in interval length. Tests for interaction were not statistically significant (P < 0.05) with respect to drug use, time period, and transitions from suppression to the detectable state and death, except for the interaction of opioid use and time period with death (P < 0.01). Additional results examining transitions from the detectable state are presented in Web Tables 3–5.
DISCUSSION
Durable HIV viral suppression is critical for both the maintenance of individual health and the prevention of onward transmission of HIV at the population level (10, 31). It was encouraging that in this long-standing urban cohort of PWID, the probability of durable virological suppression increased over time, consistent with trends in virological suppression observed in other settings and populations (32–34). Moreover, while injection drug use and homelessness were key drivers of virological rebound and death among PWID prior to 2011, they demonstrated more modest associations with virological rebound in recent years that were attenuated in adjusted analysis. However, the apparent gains in virological suppression were offset by increasing mortality, even among persons with sustained viral suppression. Indeed, though in the cohort as a whole HIV-related mortality has declined appreciably over time (35), the data presented here demonstrate that all-cause mortality has remained relatively constant among PWID living with HIV, potentially reflecting the combination of aging and changing patterns of substance use and overdose.
Previous studies carried out since the early years of ART, including studies from this same cohort in Baltimore, have demonstrated that PWID can achieve virological response (7, 18, 36). However, it has also been widely shown that among PWID, the overall proportion achieving viral suppression is lower than in other groups (37), that virological rebound following suppression is common (7), and that PWID spend less time suppressed than people without a history of injection drug use (38). Our findings add to this literature by showing substantial improvements in durable viral suppression among PWID since the introduction of ART. These changes are probably due to a combination of the simplification of ART regimens and the aging of the PWID population, which may have resulted in greater social and economic stability.
However, despite the improvement in durable viral suppression over the study period and a decline in HIV-related mortality (35), overall all-cause mortality in this aging cohort of PWID living with HIV has not declined appreciably over the past 2 decades (39). Mortality related to chronic conditions is increasing in HIV-infected patients in general and among PWID in particular due to the additional burden of the long-term consequences of drug use. Finally, although drug-related mortality has declined in this cohort over the past 3 decades, mortality from drug overdose appears to be increasing, commensurate with the opioid crisis (35, 40) and the presence of fentanyl adulteration in illicit drug markets (41, 42). Our demonstration of a 4-fold increased risk of death associated with opioid use following viral suppression in the most recent time period further reinforces this, reflecting either that stable suppressed PWID have increased opioid use or that ongoing opioid use in this group is newly associated with mortality risk due to the presence of more potent fentanyl. Additional research is needed to further examine the heightened mortality risk associated with opioid use among persons who are virally suppressed.
Interestingly, while opioid use was associated with mortality in the later time period, it was not associated with virological rebound. Moreover, while ongoing injection drug use has been identified as a key barrier to durable viral suppression in other cohorts (18), as it was in the earlier time periods in this cohort, we observed a shift in its relative importance over time, with demographic factors demonstrating stronger associations with virological rebound in the late period. Specifically, we observed that older age and African-American race were associated with reductions in viral rebound during 2012–2017. While we cannot rule out the possibility that these associations related to race and age may be at least partially explained by different patterns of drug use not completely measured in our data, inclusion of injection drug use, opioid use, crack use, and alcohol use in the adjusted model did not attenuate these associations. Moreover, younger age has previously been associated with lower ART adherence and longer time to viral suppression (43). These findings suggest that there may be subpopulations of PWID who experience greater challenges in maintaining viral suppression, potentially related to shifting demographic patterns of opioid use in the United States.
These demographic differences were further not explained by other sociostructural factors in the later period. While in the early years of ART availability we observed strong associations between sociostructural factors and transitions from suppression that confirmed prior research (14, 41), these associations have changed over time. In a recent longitudinal analysis from Vancouver, British Columbia, Canada, Kennedy et al. (44) demonstrated that homelessness and lack of social support were associated with significantly more time with detectable viremia and that after accounting for these factors, ongoing injection drug use was no longer associated with longer durations of detectable viremia. While we observed strong associations between incarceration and homelessness and virological rebound in the earlier time periods, these associations did not persist in the more recent time period, potentially at least partly reflecting lower incarceration rates and higher losses to follow-up in the recent time period.
Taken together, these findings suggest that although durable HIV suppression among PWID has improved over time, the drivers of virological rebound have changed, and that to achieve complete epidemic control, efforts should focus on persons who continue to cycle into and out of viral suppression. Moreover, strategies need to be tailored to the populations at risk. Data from Baltimore have demonstrated shifting patterns in opioid/heroin use (26), and it may be that different approaches for achieving viral suppression are needed commensurate with these shifts in the contextual drivers of use. While neither social and structural factors nor opioid/drug use was associated with virological rebound in the most recent time period, the associations with mortality suggest that it is possible that those most at risk for virological rebound are dying from drug overdose. Similarly, although we observed no association between MAT and suppression as has been seen elsewhere (45), there was a strong protective association between MAT and mortality in the most recent time period. In order to comprehensively address the harms associated with substance use and maintain the gains that have been made with respect to HIV suppression and HIV-related mortality, interventions need to expand overdose prevention strategies, including naloxone and drug-checking strategies, provision of MAT, and integrated treatment for HIV infection and opioid use disorder.
A number of limitations of this study must be acknowledged. First, our approach modeled transitions in viral suppression, and therefore we cannot draw inferences regarding long-term individual trajectories. Second, the ALIVE cohort is a convenience sample from a single urban setting; therefore, our results may be relevant only to northeastern US cities with substantial opioid epidemics. Still, because recruitment is community-based and the demographic shifts in our study population are commensurate with changes observed in Baltimore, we believe the study population is representative of Baltimore PWID. Survival bias may have affected the inferences, since only participants who survived until 1997 could be included, and those who remain in study follow-up may be different from those who are lost. It is possible that the observed improvements in durable viral suppression were related to these potential biases. African-American PWID were less likely to be lost to follow-up in the later time periods, and PWID experiencing homelessness or incarceration and PWID using opioids were more likely to be lost, which may have affected conclusions regarding viral rebound in this population. Finally, several variables of interest were derived from self-reported data and thus were subject to recall and social desirability bias. However, most sensitive information was collected via audio computer-assisted self-interview, which has been demonstrated to elicit more sensitive reports of high-risk behavior (46).
In conclusion, we observed an increasing trend of durable virological suppression among PWID in this urban setting over the 20 years since ART became available. The primary barriers to durable virological suppression have changed from injection drug use and sociostructural factors to demographic factors. Despite advances in HIV treatment, mortality has remained stable, with opioid use being associated with elevated mortality, particularly notable among PWID who have achieved viral suppression. Efforts to improve viral suppression and health outcomes among PWID need to target high-risk groups who may not be stable or engaged in HIV care, while also mitigating the consequences of new or ongoing opioid use.
ACKNOWLEDGMENTS
This work was supported by the National Institutes of Health (grants U01 DA036297 and R01 DA125698) and the Johns Hopkins Center for AIDS Research (grant P30 AI094189).
We thank the ALIVE Study staff and the participants who have generously donated their time over the years.
The views expressed in this article are those of the authors and do not necessarily reflect the views of the National Institutes of Health or the Food and Drug Administration.
Conflict of interest: none declared.
Abbreviations
- ALIVE
AIDS Link to Intravenous Experience
- aRRR
adjusted relative risk ratio
- ART
antiretroviral therapy
- CI
confidence interval
- IQR
interquartile range
- MAT
medication-assisted therapy
- PWID
people who inject drugs
REFERENCES
- 1. Joint United Nations Program on HIV/AIDS Ending AIDS: Progress Towards the 90-90-90 Targets. (Global AIDS Update 2017). Geneva, Switzerland: Joint United Nations Program on HIV-AIDS; 2017. http://www.unaids.org/sites/default/files/media_asset/Global_AIDS_update_2017_en.pdf. Accessed March 1, 2019. [Google Scholar]
- 2. Althoff KN. U.S. trends in antiretroviral therapy use, HIV RNA plasma viral loads, and CD4 T-lymphocyte cell counts among HIV-infected persons, 2000 to 2008. Ann Intern Med. 2012;157(5):325–335. [DOI] [PMC free article] [PubMed] [Google Scholar]
- 3. Samji H, Cescon A, Hogg RS, et al. Closing the gap: increases in life expectancy among treated HIV-positive individuals in the United States and Canada. PLoS One. 2013;8(12):e81355. [DOI] [PMC free article] [PubMed] [Google Scholar]
- 4. Hanna DB, Buchacz K, Gebo KA, et al. Trends and disparities in antiretroviral therapy initiation and virologic suppression among newly treatment-eligible HIV-infected individuals in North America, 2001–2009. Clin Infect Dis. 2013;56(8):1174–1182. [DOI] [PMC free article] [PubMed] [Google Scholar]
- 5. Delaugerre C, Ghosn J, Lacombe JM, et al. Significant reduction in HIV virologic failure during a 15-year period in a setting with free healthcare access. Clin Infect Dis. 2015;60(3):463–472. [DOI] [PubMed] [Google Scholar]
- 6. Yehia BR, Fleishman JA, Metlay JP, et al. Sustained viral suppression in HIV-infected patients receiving antiretroviral therapy. JAMA. 2012;308(4):339–342. [DOI] [PMC free article] [PubMed] [Google Scholar]
- 7. Westergaard RP, Hess T, Astemborski J, et al. Longitudinal changes in engagement in care and viral suppression for HIV-infected injection drug users. AIDS. 2013;27(16):2559–2566. [DOI] [PMC free article] [PubMed] [Google Scholar]
- 8. Milloy M-J, Kerr T, Buxton J, et al. Social and environmental predictors of plasma HIV RNA rebound among injection drug users treated with antiretroviral therapy. J Acquir Immune Defic Syndr. 2012;59(4):393–399. [DOI] [PMC free article] [PubMed] [Google Scholar]
- 9. Lima VD, Bangsberg DR, Harrigan PR, et al. Risk of viral failure declines with duration of suppression on highly active antiretroviral therapy irrespective of adherence level. J Acquir Immune Defic Syndr. 2010;55(4):460–465. [DOI] [PMC free article] [PubMed] [Google Scholar]
- 10. Mugavero MJ, Napravnik S, Cole SR, et al. Viremia copy-years predicts mortality among treatment-naive HIV-infected patients initiating antiretroviral therapy. Clin Infect Dis. 2011;53(9):927–935. [DOI] [PMC free article] [PubMed] [Google Scholar]
- 11. Cole SR, Napravnik S, Mugavero MJ, et al. Copy-years viremia as a measure of cumulative human immunodeficiency virus viral burden. Am J Epidemiol. 2010;171(2):198–205. [DOI] [PMC free article] [PubMed] [Google Scholar]
- 12. Viswanathan S, Detels R, Mehta SH, et al. Level of adherence and HIV RNA suppression in the current era of highly active antiretroviral therapy (HAART). AIDS Behav. 2015;19(4):601–611. [DOI] [PMC free article] [PubMed] [Google Scholar]
- 13. Fleishman JA, Yehia BR, Moore RD, et al. Establishment, retention, and loss to follow-up in outpatient HIV care. J Acquir Immune Defic Syndr. 2012;60(3):249–259. [DOI] [PMC free article] [PubMed] [Google Scholar]
- 14. Westergaard RP, Kirk GD, Richesson DR, et al. Incarceration predicts virologic failure for HIV-infected injection drug users receiving antiretroviral therapy. Clin Infect Dis. 2011;53(7):725–731. [DOI] [PMC free article] [PubMed] [Google Scholar]
- 15. Palepu A, Milloy M-J, Kerr T, et al. Homelessness and adherence to antiretroviral therapy among a cohort of HIV-infected injection drug users. J Urban Heal. 2011;88(3):545–555. [DOI] [PMC free article] [PubMed] [Google Scholar]
- 16. German D, Davey MA, Latkin CA. Residential transience and HIV risk behaviors among injection drug users. AIDS Behav. 2007;11(6 suppl):21–30. [DOI] [PubMed] [Google Scholar]
- 17. Richardson LA, Long C, DeBeck K, et al. Socio-economic marginalization in the structural production of vulnerability to violence among people who use illicit drugs. J Epidemiol Community Health. 2015;69(7):686–692. [DOI] [PMC free article] [PubMed] [Google Scholar]
- 18. Ladak F, Socias E, Nolan S, et al. Substance use patterns and HIV-1 RNA viral load rebound among HIV-positive illicit drug users in a Canadian setting. Antivir Ther. 2019;24(1):19–25. [DOI] [PMC free article] [PubMed] [Google Scholar]
- 19. Palepu A, Tyndall M, Yip B, et al. Impaired virologic response to highly active antiretroviral therapy associated with ongoing injection drug use. J Acquir Immune Defic Syndr. 2003;32(5):522–526. [DOI] [PubMed] [Google Scholar]
- 20. Jones CM, Logan J, Gladden RM, et al. Vital signs: demographic and substance use trends among heroin users—United States, 2002–2013. MMWR Morb Mortal Wkly Rep. 2015;64(26):719–725. [PMC free article] [PubMed] [Google Scholar]
- 21. Small W, Milloy MJ, McNeil R, et al. Plasma HIV-1 RNA viral load rebound among people who inject drugs receiving antiretroviral therapy (ART) in a Canadian setting: an ethno-epidemiological study. AIDS Res Ther. 2016;13(1):Article 26. [DOI] [PMC free article] [PubMed] [Google Scholar]
- 22. Rudd RA, Aleshire N, Zibbell JE, et al. Increases in drug and opioid overdose deaths—United States, 2000–2014. Am J Transplant. 2016;64(50-51):1378–1382. [DOI] [PubMed] [Google Scholar]
- 23. Cicero TJ, Ellis MS, Surratt HL, et al. The changing face of heroin use in the United States: a retrospective analysis of the past 50 years. JAMA Psychiat. 2014;71(7):821–826. [DOI] [PubMed] [Google Scholar]
- 24. Martins SS, Segura LE, Santaella-Tenorio J, et al. Prescription opioid use disorder and heroin use among 12–34 year-olds in the United States from 2002 to 2014. Addict Behav. 2017;65:236–241. [DOI] [PMC free article] [PubMed] [Google Scholar]
- 25. Latkin C, Mandell W, Oziemkowska M, et al. Using social network analysis to study patterns of drug use among urban drug users at high risk for HIV/AIDS. Drug Alcohol Depend. 1995;38(1):1–9. [DOI] [PubMed] [Google Scholar]
- 26. Cepeda JA, Astemborski J, Kirk GD, et al. Rising role of prescription drugs as a portal to injection drug use and associated mortality in Baltimore, Maryland. PLoS One. 2019;14(3):e0213357. [DOI] [PMC free article] [PubMed] [Google Scholar]
- 27. Vlahov D, Anthony JC, Munoz A, et al. The ALIVE Study: a longitudinal study of HIV-1 infection in intravenous drug users: description of methods. J Drug Issues. 1991;21(4):759–776. [PubMed] [Google Scholar]
- 28. Rhodes T, Singer M, Bourgois P, et al. The social structural production of HIV risk among injecting drug users. Soc Sci Med. 2005;61(5):1026–1044. [DOI] [PubMed] [Google Scholar]
- 29. Poundstone KE, Strathdee SA, Celentano DD. The social epidemiology of human immunodeficiency virus/acquired immunodeficiency syndrome. Epidemiol Rev. 2004;26(1):22–35. [DOI] [PubMed] [Google Scholar]
- 30. Radloff LS. The CES-D Scale: a self-report depression scale for research in the general population. Appl Psychol Meas. 1977;1(3):385–401. [Google Scholar]
- 31. Cohen MS, Chen YQ, McCauley M, et al. Antiretroviral therapy for the prevention of HIV-1 transmission. N Engl J Med. 2016;375(9):830–839. [DOI] [PMC free article] [PubMed] [Google Scholar]
- 32. Nance RM, Delaney JAC, Simoni JM, et al. HIV viral suppression trends over time among HIV-infected patients receiving care in the United States, 1997 to 2015. Ann Intern Med. 2018;169(6):376–384. [DOI] [PMC free article] [PubMed] [Google Scholar]
- 33. Bradley H, Mattson CL, Beer L, et al. Increased antiretroviral therapy prescription and HIV viral suppression among persons receiving clinical care for HIV infection. AIDS. 2016;30(13):2117–2124. [DOI] [PMC free article] [PubMed] [Google Scholar]
- 34. O’Connor J, Smith C, Lampe FC, et al. Durability of viral suppression with first-line antiretroviral therapy in patients with HIV in the UK: an observational cohort study. Lancet HIV. 2017;4(7):e295–e302. [DOI] [PMC free article] [PubMed] [Google Scholar]
- 35. Sun J, Piggott D, Muzaale AD, et al. Shifting mortality trends among persons with HIV and injection drug use over 30 years [abstract 891] Presented at the 2018 Conference on Retroviruses and Opportunistic Infections, Boston, Massachusetts, March 4–7, 2018 http://www.croiconference.org/sessions/shifting-mortality-trends-among-persons-hiv-and-injection-drug-use-over-30-years. Accessed March 1, 2019. [Google Scholar]
- 36. Brown AE, Attawell K, Hales D, et al. Monitoring the HIV continuum of care in key populations across Europe and Central Asia. HIV Med. 2018;19(7):431–439. [DOI] [PubMed] [Google Scholar]
- 37. Karch DL, Gray KM, Shi J, et al. HIV infection care and viral suppression among people who inject drugs, 28 U.S. jurisdictions, 2012–2013. Open AIDS J. 2016;10:127–135. [DOI] [PMC free article] [PubMed] [Google Scholar]
- 38. Lesko CR, Edwards JK, Moore RD, et al. A longitudinal, HIV care continuum: 10-year restricted mean time in each care continuum stage after enrollment in care, by history of IDU. AIDS. 2016;30(14):2227–2234. [DOI] [PMC free article] [PubMed] [Google Scholar]
- 39. Genberg BL, Kirk GD, Astemborski J, et al. Improving viral suppression but stable mortality among people who inject drugs from 1997–2015 [abstract 888] Presented at the 2018 Conference on Retroviruses and Opportunistic Infections, Boston, Massachusetts, March 4–7, 2018 http://www.croiconference.org/sites/default/files/posters-2018/1430_Genberg_888.pdf. [Google Scholar]
- 40. Genberg BL, Astemborski J, Sun J, et al. HIV and overdose among people who inject drugs in a community-based cohort [abstract 883] Presented at the 2019 Conference on Retroviruses and Opportunistic Infections, Seattle, Washington, March 4–7, 2019 https://www.croiconference.org/sessions/hiv-and-overdose-among-people-who-inject-drugs-community-based-cohort [Google Scholar]
- 41. Mars SG, Ondocsin J, Ciccarone D. Sold as heroin: perceptions and use of an evolving drug in Baltimore, MD. J Psychoactive Drugs. 2018;50(2):167–176. [DOI] [PMC free article] [PubMed] [Google Scholar]
- 42. Mars SG, Rosenblum D, Ciccarone D. Illicit fentanyls in the opioid street market: desired or imposed? Addiction. 2019;114(5):774–780. [DOI] [PMC free article] [PubMed] [Google Scholar]
- 43. Hadland SE, Milloy M-J, Kerr T, et al. Young age predicts poor antiretroviral adherence and viral load suppression among injection drug users. AIDS Patient Care STDS. 2012;26(5):274–280. [DOI] [PMC free article] [PubMed] [Google Scholar]
- 44. Kennedy MC, Kerr TH, Wood E, et al. Social and structural factors associated with greater time with a plasma HIV-1 RNA viral load above log10(1500) copies/ml among illicit drug users. AIDS. 2018;32(8):1059–1067. [DOI] [PMC free article] [PubMed] [Google Scholar]
- 45. Low AJ, Mburu G, Welton NJ, et al. Impact of opioid substitution therapy on antiretroviral therapy outcomes: a systematic review and meta-analysis. Clin Infect Dis. 2016;63(8):1094–1104. [DOI] [PMC free article] [PubMed] [Google Scholar]
- 46. Macalino GE, Celentano DD, Latkin C, et al. Risk behaviors by audio computer-assisted self-interviews among HIV-seropositive and HIV-seronegative injection drug users. AIDS Educ Prev. 2002;14(5):367–378. [DOI] [PubMed] [Google Scholar]