

Abstract
An experiment was conducted to examine the fractionation of nitrogen stable isotopes in a continuous culture system containing field collected estuarine phytoplankton and blue mussels, Mytilus edulis. Nitrate and phosphate were added to culture vessels at concentrations above ambient levels and nitrogen isotope ratios (δ15N) were measured in particulate matter (PM) and blue mussels over the course of the 15-day experiment. The added nutrients resulted in large productivity and chlorophyll increases in the system. Study results indicate that rapid and significant nitrogen isotope fractionation can occur during incorporation by phytoplankton grown under conditions of excess dissolved inorganic nitrogen, as shown by δ15N values depleted by as much as 9 ‰ in PM from the higher nutrient treatments. These lower δ15N values were also reflected in mussels exposed to culture vessels effluents. Therefore, nitrogen concentration needs to be considered when using δ15N values in biota as indicators of anthropogenic nitrogen inputs.
Keywords: Nitrogen stable isotopes, Fractionation, Phytoplankton, Blue mussels
Introduction
Nitrogen isotope ratios (δ15N) in biota have been widely used to track anthropogenic nitrogen inputs to aquatic systems (Savage, 2005; Martinetto et al., 2006; Bannon and Roman, 2008). The δ15N values in Waste Water Treatment Facility (WWTF) effluents are generally elevated and high values have been used to indicate the influence of WWTF nitrogen on receiving waters (Heaton, 1986; Anisfeld et al., 2007); however, previous studies have documented that nitrogen isotope ratios in biota were unexpectedly low in the northern reaches of Narragansett Bay (Pruell and Taplin, 2015; Oczkowski et al., 2018a), an area that is heavily influenced by WWTF inputs.
Subsequent sampling, following large reductions in nitrogen inputs to the Bay, showed that δ15N values of particulate matter, seaweeds, shellfish, and winter flounder significantly increased in this area (Pruell et al., 2017; Oczkowski et al., 2018a). These findings may indicate that concentration-dependent fractionation led to the previously low isotopic values and now that nitrogen concentrations have decreased in the upper portion of the estuary, fractionation has been reduced or is no longer occurring during uptake at the base of the food chain. Similar concentration-dependent fractionation of nitrogen during uptake by phytoplankton (Pennock et al., 1996; Waser et al., 1998) and bacteria (Hoch et al., 1992) has been investigated in laboratory experiments with monocultures and has been observed in several field studies (Cifuentes et al., 1988; Liu et al., 2013; Montoya et al., 1991).
This phenomenon; however, has not been studied using field collected phytoplankton mixtures in a laboratory setting. Also, the transfer of this fractionated signal to primary consumers has not been investigated. Therefore, to investigate the potential role of preferential uptake of 14N over 15N in well-fertilized coastal ecosystems, we conducted an experiment using field collected seawater samples from Narragansett Bay which were exposed to ambient light and temperature conditions. A continuous culture system was designed, and an experiment was conducted to study these processes under environmentally realistic but somewhat controlled conditions. The objective of this study was to examine the fractionation of nitrogen by primary producers under conditions of high nitrogen concentrations as well as the transfer from primary production to the blue mussel (Mytilus edulis), a primary consumer. Blue mussels were selected as the primary consumer because they grow rapidly, are widespread in estuarine environments and are often used in monitoring studies.
2. Materials and Methods
2.1. Experimental setup
We used a continuous culture system (Ecostat) modified from Grear et al. (2017) and based on Pickell et al. (2009) to conduct this laboratory experiments in June of 2018 (Fig. 1). This system was also used for a previously published study (Oczkowski et al., 2018b). The experiment was conducted outdoors and consisted of nine acid-washed 9.l L polycarbonate culture vessels incubated in a bath (3×1.3×0.4 m) containing flow-through Narragansett Bay seawater, keeping the culture vessels at ambient bay temperature and exposed to in situ light regimes. Unfiltered seawater for culture vessels was collected from the Greenwich Cove area (N 41° 39’ 23.31”, W 71° 26’ 53.88”) of Narragansett Bay, RI, USA on 14 June 2018, screened through a 150 μm nylon mesh (Nitex) to remove macro grazers, and gently homogenized in acid-washed 20 L carboy containers.
Figure 1.

Schematic diagram of the continuous culture Ecostat system used for the experiment. The system consisted of nine-9 L culture vessels that were fed with dosed seawater from 20 L cubitainers at 2 ml/min using a peristaltic pump. Target concentrations for the experiment were 5.0 μM, 40.0 μM and 60.0 μM NO3−. The culture vessels were gently rocked using a mixing motor that moved cradles holding the culture vessels. Effluent from the culture vessels flowed to chambers holding 3 blue mussels. The picture in the lower right shows the system at the start of the experiment. Figure from Oczkowski et al. (2018b). This system was modified from a system used by Grear et al. (2017) which was based on a system designed by Pickell et al. (2009).
Polycarbonate culture vessels were filled one third with the unfiltered seawater collected from Narragansett Bay and two thirds with filtered (0.2 μm) seawater from the laboratory intake system. The culture vessels were then amended with a potassium nitrate stock solution to target concentrations (above preexisting nutrient concentrations) of 5.0 μM, 40.0 μM and 60.0 μM NO3−. This stock solution consisted of a mixture of potassium nitrate (KNO3, P-383, Fisher Scientific Company, USA) and 10 % 15N labelled KNO3 (Cambridge Isotope Laboratories, Inc., USA) designed to create a δ15N value close to that of the blue mussels used in the experiment (9.79 ± 0.1 ‰). The δ15N value of the spiking solution was 10.2 ± 0.1 ‰. Phosphate (phosphorus pentaoxide, P4O10, AC21575, Fisher Scientific Company, USA) was also added to the stock solution at target concentrations of 0.3, 2.5, and 3.8 μM PO4−, respectively, above background levels. The nitrate and phosphate were added in a 16:1 ratio, consistent with phytoplankton found in coastal and open ocean regions (Goldman et al., 1979). Nitrate and phosphate were added to the control treatment (5.0 μM) to maintain a phytoplankton population at levels that would allow for the measurement of particulate matter (PM) δ15N values and sufficient phytoplankton for the blue mussels.
Culture vessels received filtered (0.2 μm) seawater amended with the same targeted nutrient concentrations, through acid-washed silicone tubing (0.64 mm ID, platinum cured) attached to a 16-channel peristaltic pump (Ismatec IP/IPC 16, Cole-Palmer Instrument Company LLC, USA). Source water feeding the vessels was stored in 20 L cubitainers, the flow rates from these containers to the polycarbonate culture vessels were approximately 2 ml min−1. Thus, with the controlled flow rates, full turnover of the culture vessels occurred every 3.2 days or about 5 times over the 15-day experiments. The vessels were secured in cradles in the bath and attached to a motorized arm that rocked the cradles back and forth, approximately 30◦ to the left and to the right, supplying constant mixing (Pickell et al., 2009).
Juvenile blue mussels were collected from Beavertail Point at the mouth of Narragansett Bay (N 41° 26’ 56.00”, W 71° 24’ 0.28”). Three mussels (10-15 mm) were measured for length, marked with waterproof paint and placed into acid washed mussel chambers (250 ml screw cap polypropylene jars) with 70 mm screw caps. Mussel chambers were partially immersed in the mesocosm and received outflow water from a designated polycarbonate culture vessel, through an acid washed silicone line (0.64 mm ID, platinum cured). An additional outflow line coming from the top of each mussel chamber insured flow through conditions and allowed flow rates to be measured daily. One mussel from each treatment was collected at the beginning of the experiment and on Days 7 and 15. After the Day 7 collection another mussel of similar size was added to the chamber to maintain consistent biomass. The number of mussels added to each chamber, and therefore the amount of replication was low because of concerns about the amount of food available to the mussels given the low (2 ml min−1) flow rate. The physiological condition of the blue mussels maintained in the system was assessed in two ways. These included the measurement of shell growth (mm) and the calculation of a condition index. The condition index (CI) was calculated using the dry weight of the tissue (mg) and the total dry weight (g) of the mussel (tissue and shell). The CI is reported as a ratio of these measurements (mg tissue wtdry/g total wtdry*100).
Seawater temperatures were measured in the experimental table daily during the experiment and ranged from 12.3 to 18.1°C. Temperatures and salinities were measured in the mussel chambers on Days 0, 7 and 15. The range of values observed for temperature and salinity in the chambers were 12.5-18.5 °C and 26.4-29.3 PSU, respectively.
2.2. Seawater collection
Seawater for the experiment was collected on Day 0 and the Ecostat system was set up and allowed to stabilize overnight. Samples were collected the following morning (Day 1) and on Days 3, 7, 10 and 15. For chlorophyll analysis, 50 ml seawater samples were filtered through 25 mm Whatman GF/F Glass Microfiber Filters (GE Healthcare UK Limited, UK). The filter samples were placed in a pre-chilled 90:10 acetone/water mixture and then stored in a freezer for 24 h before analysis. To obtain PM samples for stable isotope analysis, seawater samples collected from the system were filtered through muffled (450 °C for 6 hr) 25 mm GF/F Glass Microfiber Filters. The volume of water filtered varied during each experiment to ensure that we reached instrument detection levels for our particulate matter analyses. At the start of each experiment, one liter was filtered, after that, water volumes ranged from 300 ml to 1 L, depending on how quickly the filters clogged. Samples (20 ml each) of the filtrate were also collected for nutrient and isotopic analysis; these samples were frozen until analyzed.
2.3. Nutrient measurements
Samples were analyzed for nitrate (NO3−), nitrite (NO2−), ammonium (NH4+), and phosphate (PO4−) concentrations using an Astoria-Pacific Astoria2 Analyzer (Astoria-Pacific, Inc, USA). Although NO2− and NH4+ were not added to the culture vessels, these analytes were measured to better define the DIN (NO3−+NO2−+NH4+) distributions in the systems. All analyses followed EPA water quality methods (US EPA methods 353.2, 350.1, and 365.2) and sample concentrations were determined against a 5-point calibration curve. Check standards and instrument duplicates were measured every 15 and 10 samples respectively, and did not exceed 20 % difference, while Milli-Q® Type 1 (MilliporeSigma, USA) water blanks were run every 10 samples.
2.4. Chlorophyll
Filters to be analyzed for chlorophyll were held for at least 24 h in 90 % acetone in a dark, −20 °C freezer. Prior to analysis, samples were warmed to room temperature, gently shaken on a vortex mixer, and a portion of the homogenate transferred to muffled fluorometer glass cuvettes (test tubes) under dim light. Acetone solutions were then analyzed on a Turner Designs AU-10 Trilogy Fluorometer (Turner Designs, USA). The instrument was calibrated against five secondary standards ranging from 40-400 ug/L, which were made from a primary standard (chlorophyll a- Anacystis nidulans, CS144-1MG, Sigma Corp, USA). The excitation (440 nm) and emission (685 nm) wavelengths of samples were measured fluorometrically.
2.5. Productivity and respiration
To measure biological oxygen demand (BOD), eighteen acid-washed (with 10 % HCl) Wheaton 60 ml BOD clear glass bottles (DWK Life Sciences, USA) were prepared. One half of the bottles was covered with black plastic to serve as the dark BOD bottles while the other half was uncovered. These bottles were filled with seawater from the culture vessels via a closed system using a 200 ml opaque collection plastic container. The initial dissolved oxygen concentration (DO) and temperature were immediately measured from each BOD bottle using a Hach DO probe (LBOD101 Luminescent/Optical Dissolved Oxygen Sensor; 0.1 mg/L resolution) (Hach Company, USA) before sealing with a glass stopper. The top portion of the dark bottles was covered with parafilm to minimize any contamination and aluminum foil to prevent any exposure to light. The stoppers of the BOD bottles were secured with rubber bands to tighten the seal before they were completely submerged in the experimental bath. After 24 hours of incubation, BOD bottles were placed in a separate container filled with water from the experimental bath and triplicate measurements of the final DO concentrations from both the light and dark BOD bottles were made immediately. The average coefficient of variation (CV) of the DO concentration was about 0.05%. Measurements were performed on seawater collected from the culture vessels on Days 3, 7, 10 and 15.
Respiration (R) and net primary production (NPP) were calculated using changes in DO after 24 hr using the oxygen measurements in dark and light bottles, respectively. NPP is defined here as the net balance of gross production and respiration for the entire microbial community. Gross primary production (GPP) was calculated by subtracting the final DO concentrations of dark bottles from those of the light bottles. The following equations were used to calculate R, NPP and GPP converted to grams of carbon:
DO = dissolved oxygen concentration (mg/L)
T = length of incubation in days
R = (DO change in dark bottle (mg/L)) * 0.375/T (mg C/L/day)
NPP = (DO change in light bottle (mg/L)) * 0.375/T (mg C/L/day)
GPP = (final DO light bottle – final DO dark bottle (mg/L)) * 0.375/T (mg C/L/day).
2.6. Isotopic analysis
Seawater nitrate δ15N was measured in the filtered seawater samples by the UC Davis Stable Isotope Facility using a ThermoFinnigan GasBench + PreCon trace gas concentration system interfaced to a ThermoScientific Delta V Plus isotope-ratio mass spectrometer (IRMS) (ThermoScientific Bremen, GmbH, Germany). Gas samples were purged from vials through a double-needle sampler into a helium carrier stream (25 mL/min). The gas sample was passed through a CO2 scrubber (Ascarite) and N2O was trapped and concentrated in two liquid nitrogen cryo-traps operated in series such that the N2O is held in the first trap until the non-condensing portion of the sample gas was replaced by helium carrier, then passed to the second, smaller trap. The second trap was warmed to ambient and the N2O was carried by helium to the IRMS via an Agilent GS-Q capillary column (30m X 0.32 mm, 40°C, 1.0 mL/min) which separated N2O from residual CO2. A reference N2O peak was used to calculate provisional isotope ratios for the sample peak. Final δ15N values were calculated by adjusting provisional values against the δ15N values of laboratory reference materials. The calibration standards used included the nitrates USGS 32, USGS 34, and USGS 35, from NIST (National Institute of Standards and Technology, USA). Additional laboratory reference materials were included in each batch to monitor and correct for instrumental drift and linearity. The limit of quantification for this method was 2 μM of NO3− in seawater with a precision of 0.4 ‰.
Particulate samples retained by the filters were placed in aluminum pans and dried at 60°C for 24 hr. The filters were then wrapped in foil squares and pelletized for isotopic analysis. Mussels were measured for total length and their tissues were removed and dried at 60°C for 24 hr. Dried tissues were then ground to a fine powder using a mortar and pestle and stored in glass vials until analysis. Mussel (about 1.5 mg) and whole filter samples were analyzed using a GV Instruments IsoPrime continuous flow IRMS coupled with a Vario Micro Cube elemental analyzer (Elementar Americas, Inc., USA). Nitrogen isotope ratios were determined using a three-point calibration line that included the international standards IAEA-N-2 (ammonium sulfate) and IAEA-N-3 (potassium nitrate) (International Atomic Energy Agency, Austria) and an in-house standard (DORM-3-dogfish tissue, National Research Council Canada, Canada). Each of these standards was analyzed at the beginning, middle and end of each instrumental run. The average relative standard deviation for these triplicate standard runs was 1.3 %. A blank sample was also analyzed at the start of each sample run to verify that N2 backgrounds were low. Blank levels were always <1 % of sample values and the data were not blank corrected. For the mussel samples a sample duplicate was analyzed after every ten samples; the average isotopic difference measured for these duplicate samples was about 0.3 ‰ for δ15N measurements.
2.7. Statistical analyses
Prior to performing statistical analyses, results for ammonium, chlorophyll, gross primary production and blue mussel growth were log-transformed due to increasing variability with increasing measurement values as well as a positively skewed distribution of results. For all other parameters, statistical tests of normality and constant variability did not indicate any departures from the underlying assumptions of the statistical models, and no data transformations were applied.
General evaluations of the temporal and treatment impacts were made using two-factor Analysis of Variance (ANOVA) models, with day, treatment, and a treatment/day interaction term included in each model. Overall assessments of the significance of each term were made at the 5% significance level. The interpretation of the model results depended on whether the day/treatment interaction term was statistically significant. When this was the case, this indicated that the temporal pattern of the results varied significantly among treatments, and that any differences among treatments varied significantly among days. As a result, specific day differences were evaluated separately for each treatment, and specific treatment differences were evaluated separately for each day. Pairwise day-specific treatment differences and treatment-specific day differences were identified using the Bonferroni correction to ensure that the overall probability of falsely identifying any differences was held to 0.05 for the given treatment or day. To identify the specific day or treatment differences, pairwise comparisons were conducted using Tukey-Kramer post-hoc tests, ensuring an overall 0.05 probability of falsely identifying any day or treatment differences.
For the blue mussel condition index and mussel δ15N, the Day 1 data were not specific to any treatment but more of a reference category. Therefore, these initial measurements were not included in the ANOVA models as described above. Comparisons between the Day 1 data to each treatment/day set were performed separately using a series of two-sample t-tests. A similar approach was used for comparisons to spike data for the PM and NO3 δ15N and blue mussel δ15N results. Because the variability of the reference data (especially spike isotopic data) tended to be much lower than for the non-reference data, a Satterthwaite’s correction for non-constant variance was used for most of these analyses. Additionally, the significance levels of the individual comparisons were adjusted so that the probability of a Type I error for any of the comparisons would be 0.05, consistent with the Bonferroni correction applied in the model-specific comparisons.
3. Results
3.1. Nutrient concentrations
A 15-day Ecostat experiment was conducted using seawater collected from Narragansett Bay. Experimental culture vessels were amended with nitrate and phosphate at three different target concentrations (5, 40 and 60 μM for NO3− ; 0.3, 2.5, and 3.8 μM for PO4−). Nitrate, nitrite, ammonium and phosphate were measured in seawater samples collected from the system on Days 1, 3, 7, 10 and 15. Although the culture vessels were continuously dosed with nitrate and phosphate at the three target concentrations levels, NO3−+NO2− and PO4− concentrations decreased during the 15-day experiment in all three treatments (Fig. 2). For the 40 and 60 μM NO3− treatments, significant decreases in NO3−+NO2− occurred by Day 7 (t ranged between 4.22 and 8.52 when comparing Day 7 to earlier days for the given treatment, p<0.0002 in all cases) and then did not significantly change for the remainder of the study. Ammonium concentrations were low and fairly constant, except for the 60.0 μM treatments, in which NH4+ levels significantly increased on Day 3 (t was 4.12-11.2 when compared to other days, p<0.0002) and then decreased during the remainder of the experiment. Phosphate concentrations significantly decreased in all treatments between Days 1 and 3 (t was 3.66-13.9 for the three treatments, p<0.008 for all three comparisons). After Day 7 no significant differences were observed in PO4− concentrations among treatments.
Figure 2.
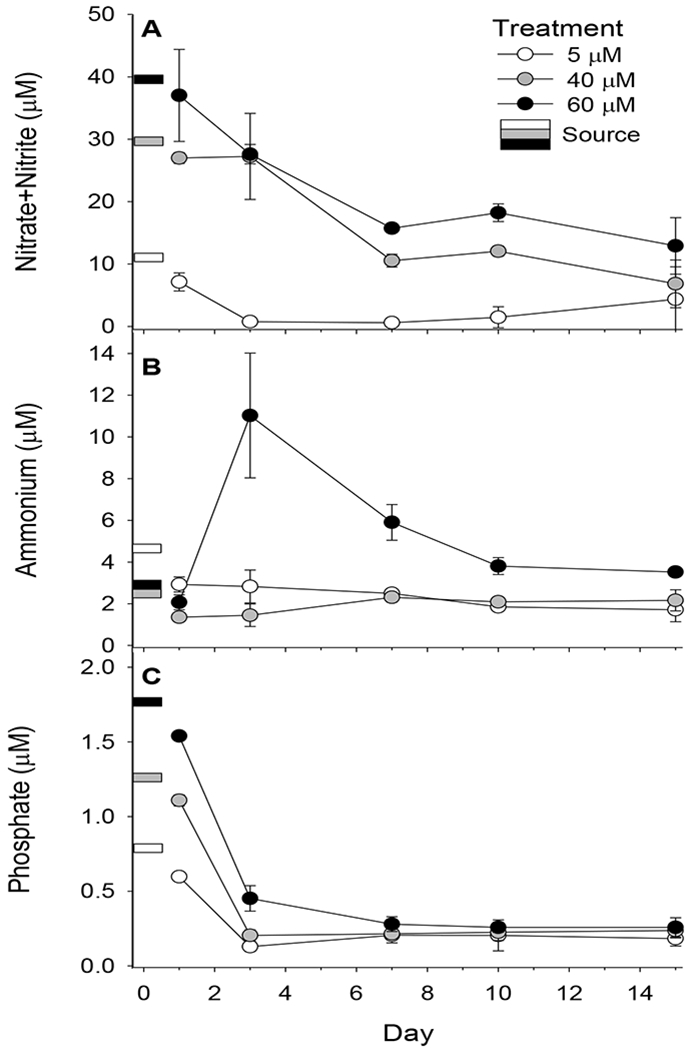
(a) Nitrate + nitrite, (b) ammonium and (c) phosphate concentrations (μM, mean ± standard deviation) in the source water and culture vessels during the 15-day experiment. The target concentrations for the three treatments were 5.0 μM, 40.0 μM and 60.0 μM NO3−. The source values shown in the figure are concentrations measured in the seawater being added to the three treatments.
3.2. Chlorophyll and productivity
Chlorophyll levels significantly increased (t ranging between 7.19 and 8.71, p<0.0001) in all three treatments between Days 1 and 3 (Fig. 3) and in the 40.0 μM and 60.0 μM NO3− culture vessels through Day 7 (t= 5.61 and 6.10, respectively, when comparing Days 7 and 10 for the 40 μM and 60 μM treatments; p<0.0001 in both cases). Thereafter, chlorophyll concentrations rapidly decreased in the 40.0 μM, and 60.0 μM NO3− culture vessels and were relatively low and not statistically different among all treatments by Day 10 (t between 0.07 and 0.51, p-values between 0.62 and 0.94 when comparing treatments on Day 10. Chlorophyll levels significantly increased again in the 40.0 μM treatment on Day 15 (t=5.15, p<0.0001).
Figure 3.

Chlorophyll concentrations (ug/L, mean ± standard deviation) in the culture vessels during the 15-day experiment in the three treatments (5.0 μM, 40.0 μM and 60.0 μM NO3−).
Gross primary production (Fig. 4a) was low on Day 3, increased significantly (p<0.0001 comparing Day 3 vs. all later days, based on Tukey-Kramer pairwise comparisons) in all NO3− treatments by Day 7 and remained elevated for the remainder of the experiment. Respiration rates were, for unknown reasons, negative on Day three and then significantly increased (t ranging between 5.30 and 10.5 when comparing Day 3 to later days for the same treatment; p<0.0001) in all treatments by Day 7 and were variable for the remainder of the experiment (Fig. 4b). Net primary production values (Fig. 4c) were highest on Day 3 (Tukey-Kramer p-values ranging between 0.0001 and 0.0124 when comparing Day 3 to each other day) and were generally lower and variable on Days 7, 10 and 15. In addition, large differences were observed in the composition of the phytoplankton during the experiment. At the beginning of the experiment the phytoplankton community was dominated by dinoflagellates (small armored dinoflagellates); however, by Day 15 it had become a diatom dominated community (e.g., Cylindrotheca (cf.) was dominant, Chaetoceros was common) (Dr. Michael Murrell, personal communication).
Figure 4.

(a) Gross primary production (mg C/L/d, mean ± standard deviation) (b) respiration (mg C/L/d, mean ± standard deviation) and (c) net primary production (mg C/L/d, mean ± standard deviation) in the culture vessels (mg C/L/d) during the experiment in the tree treatments (5.0 μM, 40.0 μM and 60.0 μM NO3−).
3.3. δ15N values of nitrate and particulate matter
Seawater nitrate δ15N values (Fig. 5) were lowest on Day 1 (all Tukey-Kramer p-values <0.0001 when comparing Day 1 to later days across treatments), increased to 17.2 ± 1.0 ‰ and 14.3 ± 0.5 ‰ in the 40.0 μM, and 60.0 μM treatments by Day 3 and were highest at 19.3 ± 0.8 ‰ and 18.0 ± 0.4 ‰ on day 7 (Tukey-Kramer p-value 0.0003 when comparing Day 7 to Day 3 across treatments), respectively (Fig. 5). These values then decreased on Days 10 and 15 (Tukey-Kramer p-values <0.0001 when comparing Day 7 to Days 10 and 15).
Figure 5.

δ15N (‰, mean ± standard deviation) values of seawater nitrate (o) and particulate matter (bars) during the experiment in the three treatments (5.0 μM, 40.0 μM and 60.0 μM NO3−). δ15N values were not available for most of the samples from the 5.0 μM treatment because the NO3− concentrations were below the limit of quantification of the method (2.0 μM NO3−).
The δ15N values of PM samples from the nine culture vessels ranged from 8.4 to 10.3 on Day 1 of the experiment and were not significantly different from those of the spiking solution. On Day 3 there was no change in values for the 5.0 μM (8.1 ± 1.9 ‰) treatments (t=1.86, p=0.2033); however, significant decreases were observed in the δ15N values of PM samples collected from the 40.0 μM, and 60.0 μM NO3− culture vessels (40 μM, t=39.4, p=0.0005; 60 μM, t=38.8, p=0.0006). These Day 3 values were 0.7 ± 0.1 ‰ and −0.2 ± 0.5 ‰ in the 40.0 μM, and 60.0 μM NO3− treatments, respectively (Fig. 5). The PM δ15N values of the DIN enriched culture vessels increased after Day 3 (t ranging between 6.12 and 9.50 when compared to Day 3 for that treatment, p<0.0001 in all cases) but remained significantly lower than the 5.0 μM treatments (t ranging between 3.33 and 5.50 when comparing to the 5.0 μM treatment for the same day; p-values 0.0033 or lower) until Day 15 when the 40.0 μM treatments were not significant different from the 5.0 μM treatments.
3.4. Blue mussel δ15N values
Blue mussels held in chambers receiving effluent from each of the culture vessels were sampled on Days 7 and 15. There were no significant differences in growth among the three treatment groups during the experiment (F=0.11, p=0.8961). Nitrogen isotope ratios in the mussels did not significantly change in the 5 μM treatments during the experiment (Fig. 6). However, on both Days 7 and 15 mussel δ15N values were significantly lower in the 40 and 60 μM treatments when compared with the δ15N values of mussels from the 5 μM treatments (F=10.2, p=0.0026 for overall treatment effect; Tukey-Kramer p-values 0.0127 and 0.0029 for 40 μM and 60 μM, respectively).
Figure 6.

δ15N (‰, mean ± standard deviation) values of blue mussels maintained in chambers receiving effluents from the culture vessels. The dotted line represents the δ15N value of the KNO3 used for the experiment. The slashed bar at Time 0 shows the δ15N values of the Day 0 blue mussels that were used in all three treatments (5.0 μM, 40.0 μM and 60.0 μM NO3−).
4. Discussion
4.1. Phytoplankton response
We saw significant increases in chlorophyll concentrations in the culture vessels by Day 3 suggesting substantial phytoplankton blooms in the 40 and 60 μM nitrate treatments. Gross primary production significantly increased by Day 7 and remained elevated for the remainder of the experiment. Respiration rates increased by Day 7 and remained high in most treatments for the remainder of the experiment. Net primary production was highly variable but had declined significantly by Day 15. There was also a change in the phytoplankton community during the experiment which was initially dominated by dinoflagellates but became a diatom dominated community by the end of the study.
4.2. Nitrogen fractionation
Significant nitrogen isotope fractionation was observed in PM collected on Day 3 of the experiment in both the 40 and 60 μM nitrate treatments. The fractionation observed was as large as 9 ‰ relative to the Day 1 PM samples or the spiking solution. This occurred while chlorophyll levels were increasing, and DIN concentrations were high, suggesting that N was not limiting phytoplankton growth. Since the seawater added to the experiment was filtered to 0.2 μm, detrital contributions to the particulate matter pool was minimal and most of the material on the filters was biologically generated in the culture vessels. As the experiment progressed DIN concentrations dropped as did the extent of nitrogen fractionation. Seawater nitrate δ15N increased rapidly in the 40 and 60 μM nitrate treatments reaching maximum values on Day seven and then decreasing. This indicates that the phytoplankton and/or bacteria preferentially incorporated the lighter 14N isotope leaving increased relative amounts of 15N in the dissolved phase.
Blue mussels are filter feeding bivalves that feed on particulate material from the water column. In this experiment, which utilized filtered seawater, most of the particulates accumulated by the mussels were likely the phytoplankton and bacteria that grew in the culture vessels. The growth and condition of the mussels maintained in the effluent seawater from the culture vessels was not different among treatment groups. Therefore, the amount of nutrients added, and the increased phytoplankton populations did not cause detectable effects on the growth or condition of the mussels. However, blue mussels from the 40 and 60 μM NO3− treatments had δ15N values about 2 ‰ lower than those from the 5 μM controls by the end of the experiment. Although small mussels were selected for this experiment, because they have faster growth rates than larger mussels (Bayne and Worrall, 1980); there may still be a lag in the incorporation of isotopic signals due to tissue turnover or the addition of new tissues associated with growth (Aberle and Malzahn, 2007). Therefore, these isotopic changes in the mussels likely represented an integrated signal over the 15-day experiment but may also reflect a lag time for the incorporation of the lower isotopic values.
4.3. Comparisons to other studies
Concentration-related fractionation of nitrogen during assimilation by phytoplankton (Pennock et al., 1996; Waser et al., 1998) and bacteria (Hoch et al., 1992) has been investigated in several laboratory experiments. Many factors have been shown to influence the degree of nitrogen isotope fractionation in phytoplankton including growth rates, light levels, degree of mixing, and species (Montoya and McCarthy, 1995). Also, experiments conducted in batch compared to continuous culture systems show differences due to changing nutrient levels in the continuous systems (Needoba et al., 2003). These studies showed that the difference between the δ15N values of the nitrogen source and those the biota, often referred to as the isotopic enrichment factor (ε) (Montoya and McCarthy, 1995), was variable depending on the nitrogen species incorporated, the phytoplankton or bacteria involved and the concentration. The range of values that have been observed are similar to what was measured in the present study. For example, Pennock et al. (1996) reported that ε averaged 9.0 ‰ for NO3− by Skeletonema costatum. Waser et al. (1998) measured an average isotopic enrichment factor for NO3- assimilation by the marine diatom, Thalassiosira pseudonana, of 5.2 ‰, but lower values for NO2− (0.9 ‰) and NH4+ (0.8 ‰) and Granger et al. (2004) reported a wide range of ε values (5.6-20.4 ‰) based on species and experimental conditions for three marine diatoms. Bacteria (Vibrio harveyi) grown on NH4+ displayed a wide range ε values (4-27 ‰) depending on NH4+ concentration (Hoch et al., 1992). While each of these studies focused on specific species of plankton and bacteria, ours is the first to look for net measurements of ε in the phytoplankton and bacteria present in mixed, estuarine water samples in a laboratory experiment. It is also the first to document the transfer of ε from primary to secondary production.
The present study demonstrates some aspects of the dynamic nature of isotopic fractionation during algal blooms, which has also been observed in several estuarine systems. Montoya et al. (1991) detected different degrees of δ15N fractionation between NH4+ and particulate nitrogen along the nutrient gradient in Chesapeake Bay. The ε values averaged 7.1 ‰ in the northern area of the estuary, where higher NH4+ concentrations were found, and 2.9 ‰ in the southern areas. Cifuentes et al. (1988) reported that fractionation of NH4+ by phytoplankton occurred at concentrations above 20 μM in Delaware Bay. Liu et al. (2013) examined the relationship between NH4+ concentration and the degree of nitrogen isotope fractionation by phytoplankton in Danshuei Estuary and reported ε values ranging between 4.7 and 16.4 ‰ depending on NH4+ concentrations. They also compiled data from numerous laboratory and field studies and found that the greatest amount of isotopic fractionation in primary producers occurred at NH4+ concentrations between about 10 and 100 μM with a maximum isotopic enrichment factor of about 20 ‰ at concentrations near 100 μM.
4.4. Relevance to Narragansett Bay studies
Pruell et al. (2006) reported concentrations of NH4+ and NO3− as high as 46.7 and 15.9 μM, respectively, in upper Narragansett Bay during 1999. Given our results, in conjunction with the observations of others (e.g., Montoya et al. 1991, Cifuentes et al. 1988, Liu et al. 2013), the nitrogen concentrations measured at this site were high enough to cause significant concentration-dependent nitrogen isotope fractionation in phytoplankton and bacteria. This may have led to the preferential accumulation of a lighter δ15N signature by the base of the food web in this area which was then passed to consumers such as winter flounder. The muscle tissues of flounder collected during 2002-2004 from the northernmost station in Narragansett Bay sampled (Passeonkquis Cove) had δ15N ratios between 12.7 and 13.7 ‰ (Pruell and Taplin, 2015), which were lower than stations further south in the Bay which were less impacted by WWTP inputs. However, after large reductions in DIN inputs to the estuary (Oczkowski et al., 2018a), the δ15N values in flounder collected between 2012 - 2014 increased by 2 - 3 ‰ at that location (Pruell et al., 2017). Similar increases have also been observed in other species from the northernmost areas of Narragansett Bay (Oczkowski et al., 2018a). Therefore, similar to what was observed in the present study, we believe that this may have occurred because fractionation during nitrogen uptake at the base of the food chain was reduced or eliminated; however, some of this increase could also be related to δ15N enrichment in sewage effluents due to the enhanced treatment processes employed (Schmidt et al., 2016).
The changes observed in this 15-day experiment demonstrate that nitrogen isotope ratios in primary producers can change significantly due to changes in DIN concentrations and that these changes can quickly become incorporated into estuarine food webs. Therefore, nitrogen concentration needs to be considered when using δ15N values in biota as indicators of anthropogenic nitrogen inputs in systems with very high nitrogen concentrations.
5. Conclusions
This Ecostat experiment demonstrated the extent to which high concentrations of dissolved inorganic nitrogen can lead to the fractionation of nitrogen isotopes during uptake by primary producers, as well the transfer of this fractionation to consumers. Three levels of nitrate and phosphate were added to experimental chambers held under ambient temperature and light conditions. Significant phytoplankton blooms occurred in the 40 and 60 μM NO3− treatments and during the early stages of these blooms, while DIN concentrations remained high, significant nitrogen isotope fractionation occurred. The fractionation observed in particulate matter, which consisted mostly of phytoplankton, occurred rapidly and was as large as 9 ‰. Significant increases in the δ15N of NO3− were also observed in the culture vessels. At the end of the experiment the δ15N values of blue mussels feeding on effluent seawater from the high nutrient systems (40 and 60 μM NO3−) were about 2 ‰ lower than their initial values and those of the nutrient spike. Therefore, high nitrogen concentrations can significantly influence the nitrogen isotope signature incorporated by estuarine food webs.
Supplementary Material
Acknowledgements
We would like to thank Dr. Michael Murrell for the phytoplankton identifications. The sample collections were conducted under permit from the Rhode Island Department of Environmental Management. Adam Kopacsi helped construct the Ecostat while the design and parts of the Ecostat were borrowed from Ed Baker and Dr. Suzanne Menden-Deuer’s research group at the University of Rhode Island Graduate School of Oceanography (GSO). We also thank Amanda Montalbano for providing technical support and assistance during the exposure set-up for these studies and Stephanie Anderson and Jacob Strock, GSO’s phytoplankton assistants, for providing valuable chlorophyll data for Narragansett Bay. We also thank Kelly Addy of the University of Rhode Island’s Watershed Watch for conducting ammonia and phosphate measurements. This is ORD Tracking Number ORD-032811. The views expressed in this article are those of the authors and do not necessarily represent the views or policies of the U.S. Environmental Protection Agency. Any mention of trade names, products, or services does not imply an endorsement by the U.S. Government or the U.S. Environmental Protection Agency. The EPA does not endorse any commercial products, services, or enterprises.
Footnotes
Declarations of Interest: None
References
- Aberle N, Malzahn AM 2007. Interspecific and nutrient-dependent variations in stable isotope fractionation: experimental studies simulating pelagic multitrophic systems. Oecol 154: 291–303. [DOI] [PubMed] [Google Scholar]
- Anisfeld SC, Barnes RT, Altabet MA, Taixing W 2007. Isotopic apportionment of atmospheric and sewage nitrogen sources in two Connecticut rivers. Environ Sci Technol 41: 6363–6369. [DOI] [PubMed] [Google Scholar]
- Bannon RO, Roman CT 2008. Using stable isotopes to monitor anthropogenic nitrogen inputs to estuaries. Ecol Appl 18: 22–30. [DOI] [PubMed] [Google Scholar]
- Bayne BL, Worrall CM 1980. Growth and production of mussels Mytilus edulis from two populations. Mar Ecol Prog Ser 3: 317–328. [Google Scholar]
- Cifuentes LA, Sharp JH, Fogel ML 1988. Stable carbon and nitrogen isotope biogeochemistry in the Delaware estuary. Limnol Oceanogr 33: 1102–1115. [Google Scholar]
- Goldman JC, McCarthy JJ, Peavey DG 1979. Growth rate influence on the chemical composition of phytoplankton in oceanic waters. Nature 279: 210–215. [Google Scholar]
- Granger J, Sigman DM, Needoba JA, Harrison PJ 2004. Coupled nitrogen and oxygen isotope fractionation during assimilation by cultures of marine phytoplankton. Limnol Oceanogr 49: 1763–1773. [Google Scholar]
- Grear JS, Rynearson TA, Montalbano AL, Govenar B, and Menden-Deuer S 2017. pCO2 effects on species composition and growth of an estuarine phytoplankton community. Estuar Coast. Shelf Sci 190: 40–49. [DOI] [PMC free article] [PubMed] [Google Scholar]
- Heaton THE 1986. Isotopic studies of nitrogen pollution in the hydrosphere and atmosphere: a review. Chem Geol 59: 87–102. [Google Scholar]
- Hoch MP, Fogel ML, Kirchman DL 1992. Isotope fractionation associated with ammonium uptake by a marine bacterium. Limnol Oceanogr 37: 1447–1459. [Google Scholar]
- Liu K-K, Kao S-J, Chiang K-P, Gong G-C, Chang J, Cheng J-S, Lan C-Y 2013. Concentration dependent nitrogen isotope fraction during ammonium uptake by phytoplankton under an algal bloom condition in the Danshuei estuary, northern Taiwan. Mar Chem 157: 242–252. [Google Scholar]
- Martinetto P, Teichberg M, Valiela I 2006. Coupling of estuarine benthic and pelagic food webs to land-derived nitrogen sources in Waquoit Bay, Massachusetts, USA. Mar Ecol Prog Ser 307: 37–48. [Google Scholar]
- Montoya JP, Horrigan SG, McCarthy JJ 1991. Rapid, storm-induced changes in the natural abundance of 15N in a planktonic ecosystem, Chesapeake Bay, USA. Geochim Cosmochim Acta 55: 3627–3638. [Google Scholar]
- Montoya JP, McCarthy JJ 1995. Isotopic fractionation during nitrate uptake by phytoplankton grown in continuous culture. J Plankton Res 17: 439–464. [Google Scholar]
- Needoba JA, Waser NA, Harrison PJ, Calvert SE 2003. Nitrogen isotope fractionation in 12 species of marine phytoplankton during growth on nitrate. Mar Ecol Prog Ser 255: 81–91. [Google Scholar]
- Oczkowski A, Schmidt C, Santos E, Miller K, Hanson A, Cobb D, Krumholz J, Pimenta A, Heffner L, Robinson S, Chaves J, McKinney R 2018a. How the distribution of anthropogenic nitrogen has changed in Narragansett Bay (RI, USA) following major reductions in nutrient loads. Estuar Coast 41: 2260–2276. [DOI] [PMC free article] [PubMed] [Google Scholar]
- Oczkowski A, Taplin B, Pruell R, Pimenta A, Johnson R, Grear J 2018b. Carbon stable isotope values in plankton and mussels reflect changes in carbonate chemistry associated with nutrient enhanced net production. Front Mar Sci 5: 43. [DOI] [PMC free article] [PubMed] [Google Scholar]
- Pennock J Velinsky DJ, Ludlam JM, Sharp JH 1996. Isotopic fractionation of ammonium and nitrate during uptake by Skeletonema costatum: δ15N dynamics under bloom conditions. Limnol Oceanogr 41: 451–459. [Google Scholar]
- Pickell LD, Wells ML, Trick CG, Cochlan WP 2009. A seagoing continuous culture system for investigating phytoplankton community response to macro- and micro-nutrient manipulations. Limnol Oceanogr Methods 7: 21–32. [Google Scholar]
- Pruell RJ, Taplin BK 2015. Carbon and nitrogen isotope ratios of juvenile winter flounder as indicators of inputs to estuarine systems. Mar Pollut Bull 101: 624–631. [DOI] [PubMed] [Google Scholar]
- Pruell RJ, Taplin BK, Lake JL, Jayaraman S 2006. Nitrogen isotope ratios in estuarine biota collected along a nutrient gradient in Narragansett Bay, Rhode Island, USA. Mar Pollut Bull 52: 612–620. [DOI] [PubMed] [Google Scholar]
- Pruell RJ, Taplin BK, Miller KM 2017. Trends in nitrogen isotope ratios of juvenile winter flounder reflect changing nitrogen inputs to Rhode Island, USA estuarine systems. Mar Pollut Bull 118: 41–47. [DOI] [PMC free article] [PubMed] [Google Scholar]
- Savage C 2005. Tracing the influence of sewage nitrogen in coastal ecosystems using stable nitrogen isotopes. Ambio 34: 145–150. [PubMed] [Google Scholar]
- Schmidt CE, Robinson RS, Fields L, Nixon SW 2016. Changes to nitrate isotopic composition of wastewater treatment effluent and rivers after upgrades to tertiary treatment in the Narragansett Bay watershed, RI. Mar Pollut Bull 104: 61–69. [DOI] [PubMed] [Google Scholar]
- Waser NAD, Harrison PJ, Nielsen B, Calvert SE 1998. Nitrogen isotope fractionation during uptake and assimilation of nitrate, nitrite, ammonium, and urea by a marine diatom. Limnol Oceanogr 43: 215–224. [Google Scholar]
Associated Data
This section collects any data citations, data availability statements, or supplementary materials included in this article.