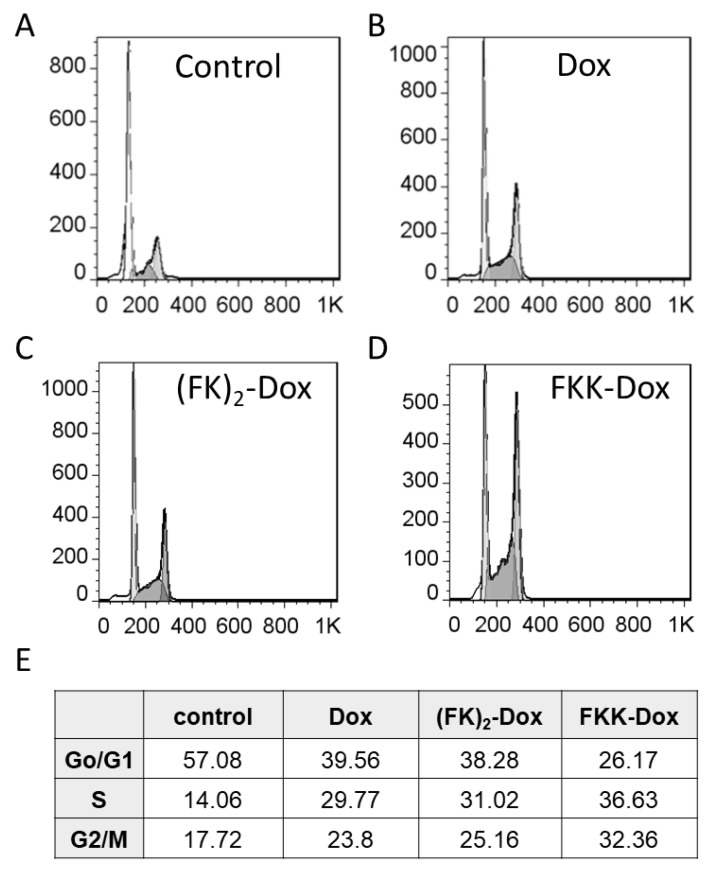
Figure 8.
(A–D) Cell cycle distribution analysis. Hela cells were treated with free Dox (100 nM), (FK)2-Dox (100 nM of Dox) or FKK-Dox (100 nM of Dox) and analyzed at 24 h after the treatment. Raw data for a representative experiment is shown. (B) Quantitative analysis of cell cycle distribution based on Figure 8A–D.

