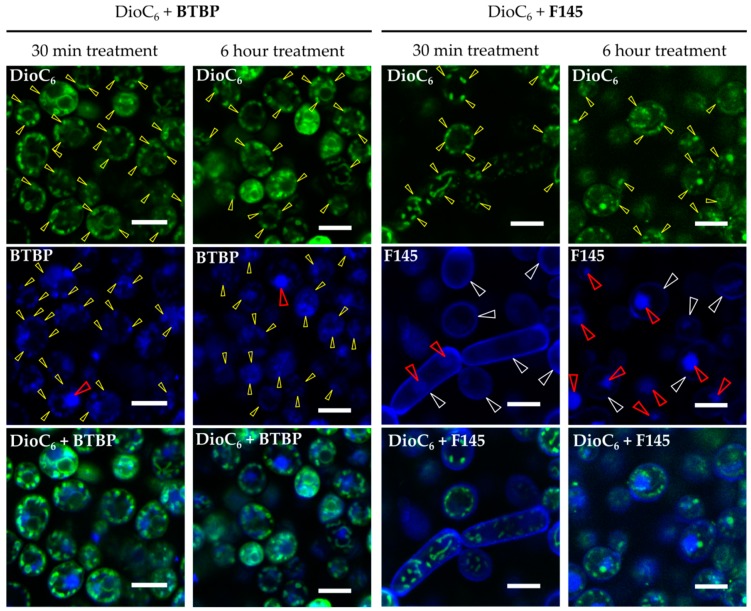
Figure 5.
CLSM of C. albicans cells treated with DioC6(3) and F145 for either 30 min or 6 h; control treated with DioC2(3) and BTBP fluorophore for 30 min or 6 h, respectively. White arrows indicate the stained cell wall, yellow arrows show the stained mitochondria, and red arrows indicate the stained nucleus. Scale bar is 5 μm.

