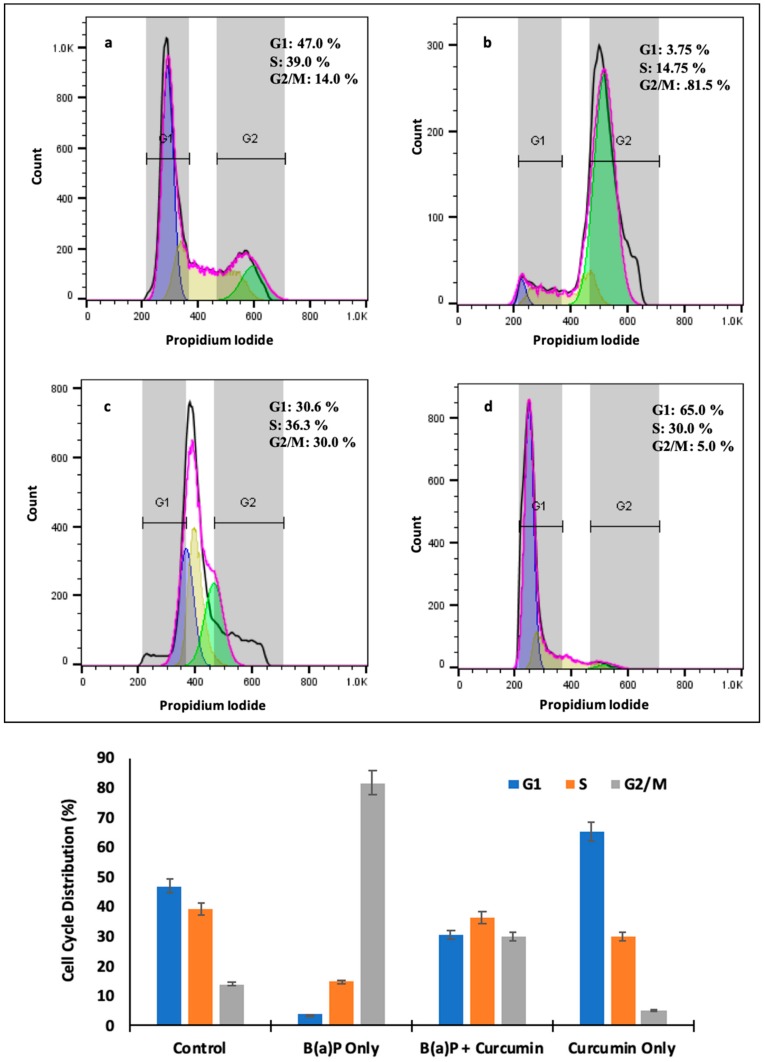
Figure 8.
Effect of curcumin on cell cycle phase distribution by flow cytometry (a) control group 30.6% cell were arrested in G1; (b) high shift in G2/M phase in BaP-only treated group; (c) significant change in curcumin + BaP treated group; (d) marginal shift was observed from G2/M to G1 in the curcumin only treated group. The cell cycle distributions were calculated and expressed as means ± SDs of three independent experiments.

