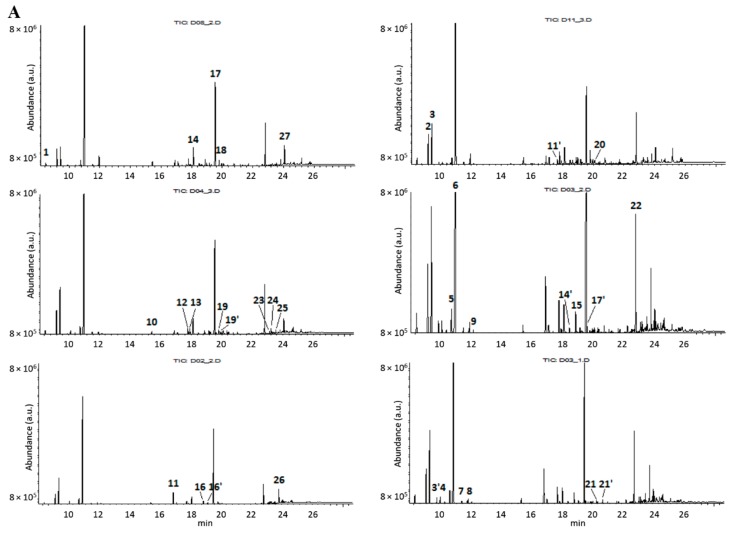
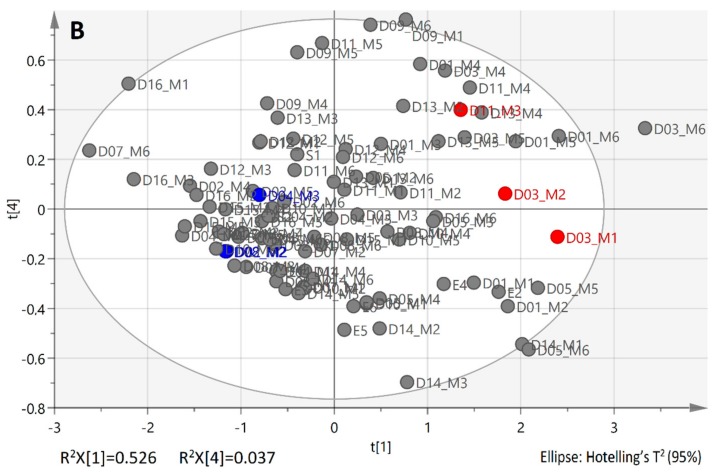
Figure 4.
GC-MS chromatographic profiles of randomly selected EOs originated from three female and three male bay laurel leaves (A); projection of the same EO samples on the PC14 scoreplot of the reference FT-IR dataset (B). •: female trees •: male trees. Dot codes refer to the tree (D#) and harvest month (M#) identifiers. The chromatographic peaks were cross-referenced against the NIST mass spectral library (version 2.0f, 2008) and assigned to compounds no 1–27, as shown in Table S1.


