

Abstract
Mobile healthcare increasingly relies on analytical tools that can extract meaningful information from ambulatory physiological recordings. We tested whether a nonlinear tool of fractal physiology could predict long-term health consequences in a large, elderly cohort. Fractal physiology is an emerging field that aims to study how fractal temporal structures in physiological fluctuations generated by complex physiological networks can provide important information about system adaptability. We assessed fractal temporal correlations in the spontaneous fluctuations of ambulatory motor activity of 1,275 older participants at baseline, with a follow-up period of up to 13 years. We found that people with reduced temporal correlations (more random activity fluctuations) at baseline had increased risk of frailty, disability, and all-cause death during follow-up. Specifically, for 1 standard deviation decrease in the temporal activity correlations of this studied cohort, the risk of frailty increased by 31%; the risk of disability increased by 15%-25%; and the risk of death increased by 26%. These incidences occurred on average 4.7 years (frailty), 3-4.2 years (disability), and 5.8 years (death) after baseline. These observations were independent of age, sex, education, chronic health conditions, depressive symptoms, cognition, motor function, and total daily activity. The temporal structures in daily motor activity fluctuations may contain unique prognostic information regarding wellness and health in the elderly population.
One Sentence Summary:
More random fluctuations in daily motor activity predicts deteriorated quality of life and high death rate in elderly subjects.
Introduction
Advances in wearable technologies in the last decade have made it possible to monitor physiological function unobtrusively for long periods of time (1, 2). One of the most commonly collected types of physiological data is motor activity. Several watch-like actimetry sensors, worn on the wrist or ankle, have been developed to enable monitoring of motor activity (namely actigraphy – noninvasive monitoring of movement amplitude to assess rest versus active periods) continuously for days and months. Actigraphy has widely been used to objectively estimate physical activity (3), daily/circadian activity rhythms, and sleep (4, 5), leading to many original physiological findings related to health and diseases. Despite the potential application of wearable devices in health care, harnessing the wealth of data from these devices is still a contemporary challenge. One of the main barriers is that uncontrolled daily schedules and environmental conditions may affect traditional physiological measures and complicate interpretation of results. New biomarkers that can reflect intrinsic properties of physiological systems while being resilient to external influences are desirable.
In parallel, the last 20 years have witnessed an exponential growth of an interdisciplinary field in physiology, namely ‘fractal physiology’, which is focused on understanding complex physiologic networks. One key finding in this field is that many physiological outputs such as motor activity and cardiac activity exhibit fractal fluctuations (similar temporal structural and statistical properties of the fluctuations at a wide range of timescales) (6–11). One advantage of fractal fluctuations is that they appear to be stable within the same individuals and sensitive to pathological conditions. For instance, fractal patterns in motor activity of healthy young humans persist under different environmental conditions (free running or highly controlled in-lab conditions) despite large variations in mean physical activity (6); fractal fluctuations of human movement degrade with aging and in pathological states (12–15); and degraded fractal motor activity patterns in patients with dementia can better predict neurodegenerations in the circadian master clock of these patients as compared to traditional circadian measures (circadian amplitude and intra-daily variability) (16). In addition, restoration or optimization of fractal patterns is considered a potential, promising target of neurologic physical therapy (17–20). Supporting this concept, some pilot studies showed that sleep and memory can be enhanced with acoustic stimulations during specific sleep stage using pink noise — a sound possessing similar fractal temporal correlations as observed in many physiological signals such as motor activity, heartbeat, and brain activity (21, 22).
As a hallmark of healthy physiology, fractal regulation is believed to represent the system adaptability and to reflect the complexity of physiological networks in which regulatory processes function interactively over a wide range of timescales (23–26). Consistently, our recent study further showed that the degraded fractal motor activity regulation is associated with cognitive impairment and predicts the risk of developing Alzheimer’s dementia in elderly individuals many years before the clinical onset of dementia (27). However, its value for predicting other adverse health consequences has not been fully explored. Here, we tested the hypothesis that fractal regulation in motor activities predicts frailty, disability, and all-cause mortality in a large community-based elderly cohort. Frailty and disability affect overall health and quality of life, particularly in older individuals, and there is evidence showing that both frailty and disability are linked to increased mortality (28–31). Thus, we also explored whether the effect of fractal regulation on all-cause death is independent of frailty and disability.
Results
At the time of analysis, 1,398 participants finished their baseline actigraphy assessments. Among them, 8 participants were screened out during preprocessing because of poor signal quality and 115 participants were excluded because of lack of follow-up clinical examinations (67 died before follow-up, 43 were not yet eligible for follow-up, and 5 withdrew from further participation). Thus, a total of 1,275 participants were included in this study. Detrended fluctuation analysis (DFA) was used to extract two metrics that quantify the temporal correlations of motor activity recordings in two timescale regions: α1 at timescales < 1.5 h, and α2 at timescales > 2 h (up to 10 h). Examples of motor activity recordings and the corresponding DFA plots are shown in Fig. 1. In 5 participants, the maximal timescale when performing the DFA was < 8 hours, such that the metric α2 could not be obtained reliably.
Fig. 1. Fractal patterns of daily motor activity fluctuations.
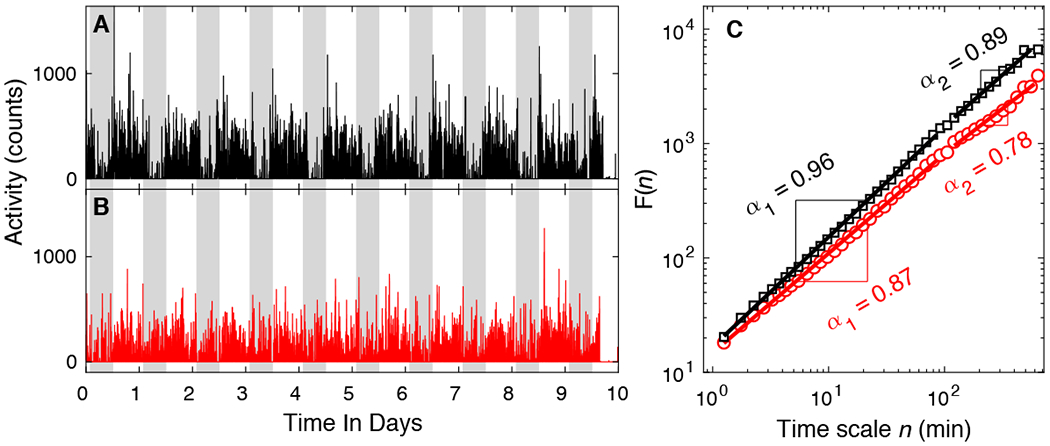
(A-B) Representative motor activity recordings of two ~81-year-old female participants. The participant whose activity is shown in (A) survived after the follow-up of 9 years; the participant whose activity is shown in (B) was deceased 7 years after baseline. Gray shaded area indicates 9PM-7AM. (C) The detrended fluctuation analysis results of the signals in (A) and (B). The fluctuation functions F(n) at different timescale n are plotted in log-log scale. F(n) is fitted using power-law functions in two regions: 1.25-90 min and 120-600 min. The slopes of the fitting lines in the two regions are denoted by α1 and α2, respectively. For better visualization and comparison between the two signals, F(n) of signal (B) has been vertically shifted.
Demographic, actigraphical, and clinical characteristics of participants at baseline are summarized in Table 1. α1 ranged from 0.63 to 1.21 (mean: 0.92; median: 0.92; standard deviation [SD]: 0.06), and α2 ranged from 0.51 to 1.32 (mean: 0.82; median: 0.81; SD: 0.10), suggesting positive temporal correlations in the activity fluctuations (α > 0.5) in motor activity in both timescale regions and in all participants. α1 was weakly correlated with α2 (Pearson r = 0.07, P = 0.008). Both α1 and α2 were negatively correlated with age (α1: r = −0.10, P = 0.004; α2: r = −0.18, P < 0.0001). α1 was positively correlated with years of education (r = 0.07, P = 0.009) but α2 was not (P = 0.7). There were no sex differences in either α1 or α2 (both P > 0.05).
Table 1.
Demographical, actigraphical, and clinical characteristics at baseline.
| Variable | All (N = 1,275) | Not frail (N = 936) | Not ADL-disabled (N = 1,073) | Not IADL-disabled (N = 641) | Not mobility disabled (N = 684) |
|---|---|---|---|---|---|
| Mean (SD), median [IQR], or N (%) | Mean (SD), median [IQR], or N (%) | Mean (SD), median [IQR], or N (%) | Mean (SD), median [IQR], or N (%) | Mean (SD), median [IQR], or N (%) | |
| Demographics | |||||
| Age at baseline (year) | 81.2 (7.3) | 81.7 (7.1) | 80.6 (7.1) | 78.9 (7.1) | 79.3 (7.2) |
| Sex (female) | 974 (76.4%) | 712 (76.1%) | 813 (75.8%) | 459 (71.6%) | 490 (71.6%) |
| Education (year) | 15.0 (3.0) | 14.9 (2.9) | 15.2 (3.0) | 15.7 (3.0) | 15.6 (3.0) |
| Actigraphical | |||||
| Total daily activity (× 105) | 1.75 (1.75) | 1.75 (1.34) | 1.85 (1.83) | 2.01 (2.11) | 1.94 (1.41) |
| α1 | 0.92 (0.06) | 0.92 (0.06) | 0.92 (0.05) | 0.93 (0.05) | 0.93 (0.05) |
| α2 | 0.82 (0.10) | 0.82 (0.10) | 0.83 (0.09) | 0.84 (0.10) | 0.84 (0.09) |
| Clinical | |||||
| Vascular risk factora | 1 [1] | 1 [1] | 1 [1] | 1 [2] | 1 [2] |
| Vascular diseasesb | 0 [1] | 0 [1] | 0 [0] | 0 [0] | 0 [0] |
| Depressive symptomsc | 0 [2] | 0 [1] | 0 [1] | 0 [1] | 0 [1] |
| Global cognitiond | 0.07 (0.65) | 0.05 (0.64) | 0.12 (0.61) | 0.27 (0.51) | 0.20 (0.57) |
| Motor functione | 1.00 (0.23) | 0.99 (0.22) | 1.03 (0.22) | 1.11 (0.20) | 1.11 (0.20) |
A composite measure of vascular risk burden considering three self-reported factors (hypertension, diabetes, and smoking history);
A composite measure of vascular disease burden considering four self-reported diseases (myocardial infarction, congestive heart failure, claudication, and stroke);
Assessed with a modified 10-item version of the Center for Epidemiologic Studies Depression scale;
A composite score for overall cognitive function based on a battery of 19 cognitive tests;
A composite measure of global motor function covering 10 motor performance tests.
ADL = activities of daily living; IADL = instrumental activities of daily living; IQR = interquartile range; SD = standard deviation.
Perturbed fractal motor activity regulation predicts incident physical frailty
There were 936 participants (73.4% of 1,275; female/male: 712/224) who were not frail (number of frailty components < 2) at baseline. Over a mean of 4.7 (SD: 2.8; range: 0.7-12.2) years of follow-up, incident frailty was rendered for 291 (31.1% of 936; Female/Male: 263/28) participants. To assess the relationship between α1/α2 and frailty, we performed Cox proportional hazards models of incident frailty with α1, and separately α2, adjusted for age, sex, and education. A lower level of α1 was associated with an increased risk of frailty: for 1-SD decrease in α1, the hazard ratio (HR) was 1.31 (95% CI: 1.16-1.48; Table 2) which is equivalent to being 3.3 years older at baseline (table S1). Fig. 2A shows the predicted probability of being not frail as a function of time for different values of α1. The participants with α1 = 0.85 (the 10th percentile) had overall a 1.7-fold increased hazard of frailty compared to the participant with α1 = 0.98 (the 90th percentile). The association between α1 and frailty remained after adjusting separately for multiple potential covariates such as chronic health conditions, depressive symptoms, cognitive function, motor function, and physical activity (table S1). We did not observe a significant association (P > 0.2) between α2 and incident frailty as shown in Table 2 and Fig. 2B.
Table 2.
Fractal regulation in motor activity, potential confounders, and risk of frailty, disability, and death.
| Outcome | α1a | α2a |
|---|---|---|
| Frailty | 1.31 (1.16, 1.48), <0.0001, <0.0001 | 1.09 (0.95, 1.24), 0.2, >0.2 |
| ADL disability | 1.25 (1.14, 1.36), <0.0001, <0.0001 | 1.11 (1.01, 1.22), 0.02, 0.03 |
| IADL disability | 1.15 (1.04, 1.26), 0.01, 0.02 | 1.03 (0.94, 1.13), 0.6, >0.6 |
| Mobility disability | 1.19 (1.08, 1.32), 0.0004, 0.001 | 1.02 (0.93, 1.13), 0.6, >0.6 |
| All-cause death | 1.26 (1.17, 1.37), <0.0001, <0.0001 | 1.12 (1.02, 1.23), 0.01, 0.02 |
Results are presented as HR (95% CI), P value, FDR-corrected P value.
Results for 1-SD decrease.
ADL = activities of daily living; CI = confidential interval; FDR = false discovery rate; HR = hazard ratio; IADL = instrumental activities of daily living; SD = standard deviation.
Fig. 2. Predicted survival curves from Cox proportional hazards models.
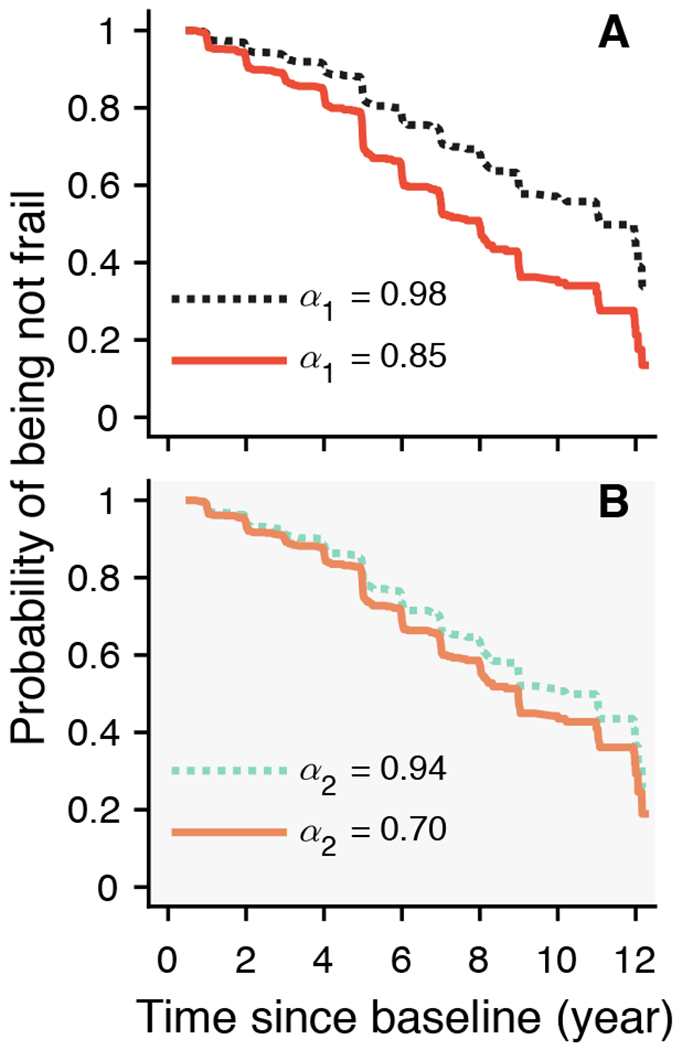
The predicted probabilities of being not frail for two representative participants whose fractal metrics (A) α1 or (B) α2 were in the 90th (dashed lines) or the 10th percentiles (solid lines). Shading in (B) indicates not statistically significant association between α2 and incident frailty.
Perturbed fractal motor activity regulation predicts incident disability
There were 1,073 participants (84.2% of 1,275; female/male: 813/260) who reported no disability on basic activities of daily living (ADL). Over a mean of 4.2 (SD: 2.8; range: 0.6-12.3) years of follow-up, 529 (49.3% of 1,073; female/male: 419/110) developed ADL disability. Cox proportional hazards models of incident ADL disability with α1, and separately α1, adjusted for age, sex, and education were performed. A lower level of α1 was associated with an increased risk of ADL disability: for 1-SD decrease in α1, the HR is 1.25 (95% CI: 1.14-1.36; Table 2) which is equivalent to being 2.3 years older at baseline (table S2). Fig. 3A shows the predicted probability of being not disabled as a function of time for different values of α1. The participants with α1 = 0.85 (the 10th percentile) had overall a 1.6-fold increased hazard of disability compared to the participant with α1 = 0.98 (the 90th percentile). The association between α1 and disability remained after adjusting separately for all tested covariates (table S2). Similarly, a lower level of α2 was also associated with an increased risk of ADL disability: HR was 1.11 (95% CI: 1.01-1.22; Table 2) for 1-SD decrease in α2, which is equivalent to being about 1.1 years older at baseline (table S3). As shown in Fig. 3D, the participant with lower α2 (α2 = 0.70, the 10th percentile) had an overall 1.2-fold increased hazard of disability compared to the participant with higher α2 (α2 = 0.94, the 90th percentile). The association between α2 and disability remained significant after controlling separately for the other risk factors except for total daily activity level (table S3).
Fig. 3. Predicted survival curves from Cox proportional hazards models.
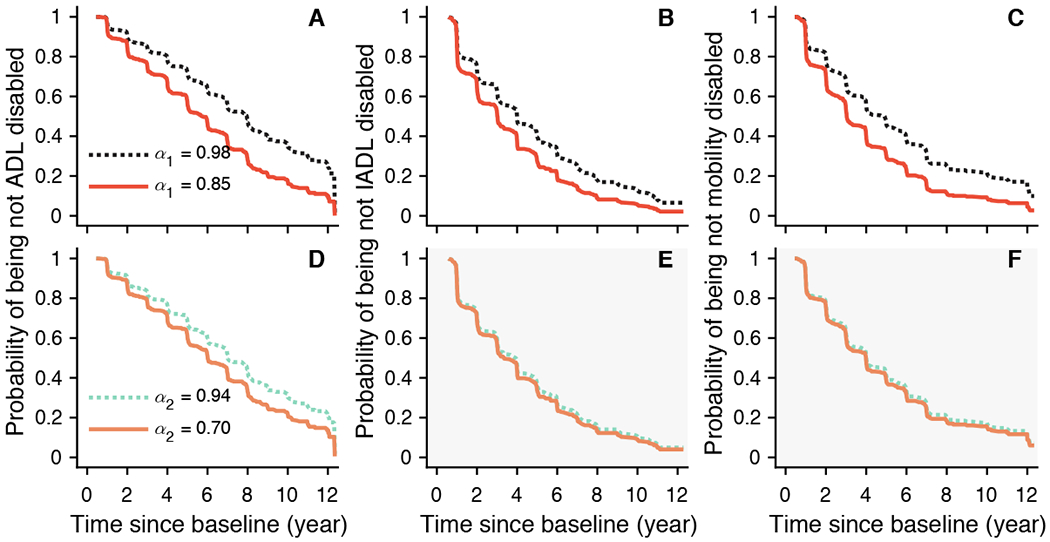
The predicted probabilities of being not ADL disabled (left), not IADL disabled (middle), and not mobility disabled (right) for two representative participants whose fractal metrics (A-C) α1 or (D-F) α2 were in the 90th (dashed lines) or the 10th percentiles (solid lines). Shading in (E-F) indicates not statistically significant association between α2 and the corresponding outcome.
There were 641 participants (50.3% of 1,275; female/male: 459/182) who reported independence in instrumental activity of daily living (IADL) at baseline. Over a mean of 3.0 (SD: 2.3; range: 0.6-11.1) years of follow-up, 442 (70.0% of 641; female/male: 320/122) developed IADL disability. Cox proportional hazards models of incident IADL disability with α1, and separately α2, adjusted for age, sex, and education were performed. A lower level of α1 was associated with an increased risk of IADL disability: for 1-SD decrease in α1, HR is 1.15 (95% CI: 1.04-1.26; Table 2) which is equivalent to being 1.9 years older at baseline (table S4). Fig. 3B shows the predicted probability of being not disabled as a function of time for different values of α1. The participants with α1 = 0.85 (the 10th percentile) had overall a 1.3-fold increased hazard of disability compared to the participant with α1 = 0.98 (the 90th percentile). The association between α1 and disability remained after adjusting separately for the possible confounders (table S4). We did not observe a significant association (P > 0.5) between α2 and incident IADL disability as shown in Table 2 and Fig. 3E.
There were 684 participants (53.6% of 1,275; female/male: 490/194) who reported no mobility disability on the Rosow-Breslau scale at baseline. Over a mean of 3.1 (SD: 2.3; range: 0.6-12.1) years of follow-up, 443 (64.8% of 684; female/male: 331/112) developed mobility disability. Cox proportional hazards models of incident mobility disability with α1, and separately α2, adjusted for age, sex, and education were performed. A lower level of α1 was associated with an increased risk of mobility disability: HR was 1.19 (95% CI: 1.08-1.32; Table 2) for 1-SD decrease in α1 which is equivalent to being 2.6 years older at baseline (table S5). Fig. 3C shows the predicted probability of being not disabled as a function of time for different values of α1. The participants with α1 = 0.85 (the 10th percentile) have overall a 1.4-fold increased hazard of disability compared to the participant with α1 = 0.98 (the 90th percentile). The association between α1 and disability remained after adjusting separately for all tested confounders (table S5). We did not observe a significant association between α2 and incident mobility disability as shown in Table 2 and Fig. 3F (P > 0.5).
Perturbed fractal motor activity regulation predicts increased all-cause mortality
Among all 1,275 participants, there were 535 deaths (42% of cohort; female/male: 388/147) after a mean of 5.8 (SD =2.9, range 0.6-12.7) years. Older age, being a male, or fewer years of education was associated with higher risk of death (tables S6 and S7). Cox proportional hazards models with α1, and separately α2, as a predictor adjusted for age, sex, and education were performed to examine the survival of participants. A lower level of α1 was associated with an increased risk of death: for 1-SD decrease in α1, HR was 1.26 (95% CI: 1.17-1.37; Table 2), which is equivalent to being 2 years older at baseline (table S6). Fig. 4A shows the predicted probability of survival as a function of time for different values of α1. The participants with α1 = 0.85 (the 10th percentile) have overall a 1.6-fold increased risk of death compared to the participant with α1 = 0.98 (the 90th percentile). The association between α1 and death remained after adjusting separately for all tested covariates, as well as after adjusting separately for the disability status at baseline (table S6). Similarly, a lower level of α2 was also associated with an increased risk of death, with an HR of 1.12 (95% CI: 1.02-1.23; Table 2) for 1-SD decrease in α2, which is equivalent to being 1 year older at baseline (table S7). As shown in Fig. 4B, the participant with lower α2 (α2 = 0.70, the 10th percentile) had an overall 1.3-fold increased risk of death compared to the participant with higher α2 (α2 = 0.94, the 90th percentile). The association between α2 and death remained significant after controlling separately for all tested risk factors except for motor function and the three disability measures (table S7; all P < 0.05). Of note, post hoc χ2 tests suggest potential violation of the proportional hazard assumption for both α1 and α2 (P < 0.05), suggesting that the association with mortality may not be constant over time. Therefore, we augmented the core model for α1, and separately the core model for α2, by including an interaction term with time to death (32). The results showed that the associations of both α’s with mortality were attenuated in participants with longer survival time (table S8), Briefly, for a representative female participant of mean age and having mean years of education, the HR for 1-SD decrease in α1 was attenuated by 0.06 with every 1 additional year of survival. Similarly, the HR for 1-SD decrease in α2 was reduced by 0.05 with every 1 additional year of survival.
Fig. 4. Predicted survival curves from Cox proportional hazards models.
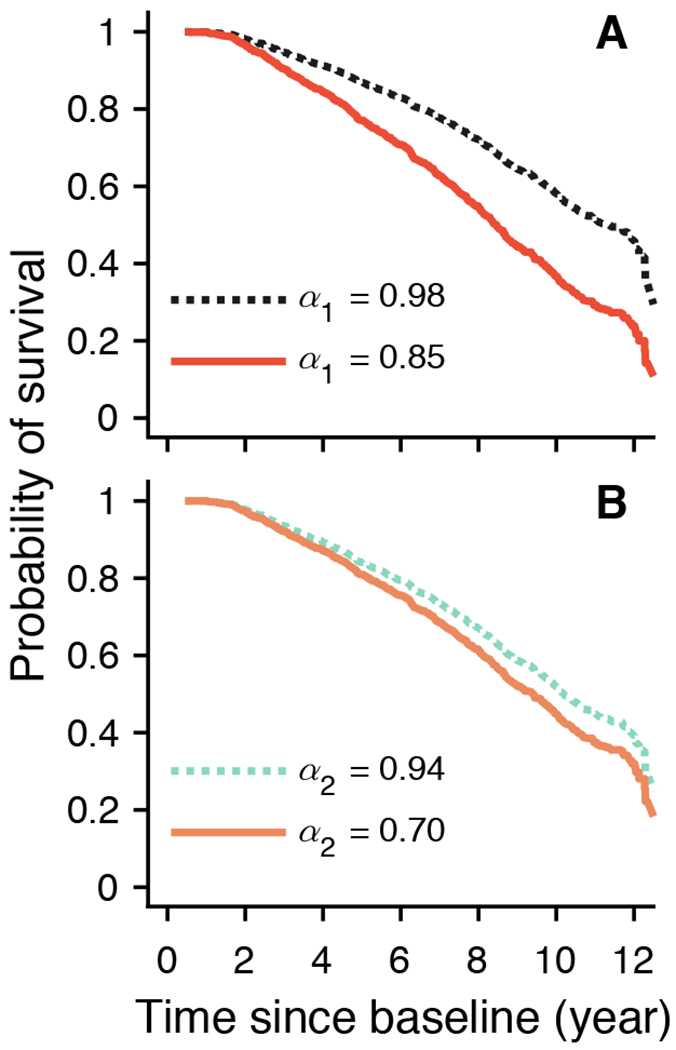
The predicted probabilities of survival for two representative participants whose fractal metrics (A) α1 or (B) α2 were in the 90th (dashed lines) or the 10th percentiles (solid lines).
Discussion
By following a cohort of 1,275 older persons for up to 13 years, we found that degraded fractal regulation in ambulatory motor activity predicted a higher risk of incident frailty, incident disability, and death. Specifically, a higher risk for frailty was observed in participants who had more random motor activity fluctuations at timescales between ~1-90 min (as indicated by smaller values of the fractal activity metric α1). Similarly, a higher risk for ADL, IADL, and mobility disability was observed in these participants with smaller α1. A higher risk for ADL disability was also associated with more random activity fluctuations at timescales > 2 h (as indicated by smaller values of the fractal activity metric α2). A higher risk for mortality was associated with more random motor activity fluctuations in both timescale regions (smaller α1 and α2). These associations remained after accounting for other factors associated to risk of frailty, disability, or decreased life expectancy including age, sex, education, chronic health conditions, depressive symptoms, cognition, motor function, and total daily activity. These findings indicate that spontaneous fluctuations in daily motor activity contain useful information about wellness and health, and that nonlinear dynamic analysis can serve as a powerful tool to extract such information.
Frailty is believed to reflect declines in physiological reserve across multiorgan systems, thus increasing vulnerability to stressors. Our results showed that degraded fractal motor activity regulation precedes and predicts frailty; within those without frailty at baseline, frailty occurred ~4.7 years on average after motor activity monitoring. This finding supports the theory that fractal regulation reflects the complexity of physiological control. And conversely, the degradation suggests a reduced complexity in the system; thus the system becomes less adaptive to perturbations and more vulnerable to catastrophic events (26, 33).
One common risk factor for frailty, disability, and mortality that can be derived from actigraphy is low physical activity. Health benefits of physical activity have long been acknowledged, and there is indisputable evidence for the association between higher physical activity and lower risk for disability and mortality (28, 34–37). Physical activity may also be beneficial for reducing the risk of frailty in the elderly (38), although the role of being physically active in preventing sedentary elderlies from being physically frail is still under debate (39). Here, we showed that, independent of total daily activity, fractal patterns in the spontaneous activity fluctuations provide distinct insights into frailty, disability, and mortality in the elderly. This may not be surprising because fractal motor activity regulation reflects the system integrity that is required for successful, repetitive execution of different motor tasks. Altered fractal fluctuations of motor activity may represent sub-clinical information stemming from disruptions to multiple physiological functions, including cognition, psychiatric stability, coordination, and physical conditioning. This interpretation is supported by our previous findings that fractal motor activity regulation was degraded in dementia and associated with cognitive impairment (13, 27, 40), and the finding in this study that the associations between α1 and frailty/disability/mortality were slightly weakened (but still statistically significant) when the composite motor function measure (incorporating many tests that involve cognition) was included in the model. Together, these findings support that fractal motor activity regulation provides additional valuable information about physiological function beyond total daily activity.
It has been established that frailty and disability predict mortality (28–31). One logical hypothesis is that frailty and disability mediate the effect of degraded fractal motor activity regulation on death. This hypothesis is supported by the reduced effects of fractal activity metrics on mortality after controlling for baseline frailty or disability: HR for mortality corresponding to 1-SD decrease in α1 was reduced from 1.26 to 1.20 after controlling for baseline frailty; and the association between α2 and mortality became not significant after controlling for baseline disability. Because frailty and disability predict not only mortality but also neuropathological changes, such as Alzheimer’s disease, our findings highlight the possibility that degraded fractal motor activity regulation may serve as an earlier sign or risk factor for pathological changes.
It is also worth noting that the association between α1 and mortality persisted after accounting for baseline frailty/disability. This finding provides strong evidence that there should be additional pathways leading to increased mortality, independent of the tested frailty and disability measures, and that degraded fractal motor activity regulation provides information for the prediction of all-cause death.
Although both α1 and α2 showed significant associations with ADL disability and death, the effects of decreased α1 on the two outcomes appeared to be stronger than those of decreased α2. The associations between α2 and these health outcomes became borderline or not significant after adjusting for motor function or total daily activity. On the other hand, our previous studies showed that α2 seems more sensitive to night shifts and it recovered more slowly after night shifts (41). These distinct responses or associations of α1 and α2 suggest that fractal fluctuations at different timescales involve different physiological or biological mechanisms, and their changes reflect different physio-pathological alterations that contribute to disability and mortality.
Despite the current limited understanding of the neural network(s) responsible for fractal regulation, it is well established that the circadian control system is required to maintain fractal fluctuations in motor activity, especially at larger timescales (26). In rats, lesioning the suprachiasmatic nucleus (SCN) — the central circadian clock in mammals — led to completely random activity fluctuations at timescales > ~4 h (α2 close to 0.5) (42); and lesioning the dorsomedial hypothalamic nucleus — one of the important neural nodes that relays the influences of the SCN on motor activity — also caused a significant reduction in α2 (43). In humans, perturbed fractal motor activity regulation in terms of the difference between α1 and α2 (more reduced α2) was associated with greater loss of vasopressin and neurotensin neurons, two major neurotransmitters in the SCN (16). Thus, the observed effects of α2 on risk of disability/mortality may be linked to circadian dysfunction.
Recent human studies showed that the degradation of the fractal motor activity regulation at timescales < 2 h (smaller α1) was associated with dysregulations in higher brain activities including mood and cognitive function (44–49), indicating that the decrease of α1 could be an omen of accelerated cognitive degeneration. This hypothesis was supported by our recent study showing that α1 reduction predicted faster cognitive decline and increased risk for dementia (27). This hypothesis was further supported by our observed association between smaller baseline α1 and increased risk of IADL disability, considering that the decline in IADL is likely to represent a decline in cognitive function. On the other hand, we found that, even after controlling for cognition, α1 still predicted frailty, ADL disability, and mobility disability that may be closely related and linked to physical problems. These findings indicate previously un-identified contributions of mobility control to fractal regulation. The neural circuitry of fractal activity regulation at small timescales may thus involves multiple physiological control mechanisms.
This study indicates that multiscale characteristics derived from spontaneous daily movement can be useful for heath monitoring in older adults. As compared to the traditional clinical assessments of frailty, disability, and mortality, actigraphy-based methods have many advantages because the unobtrusive data collection is cost-efficient and requires less effort from individuals and healthcare providers. To further establish the fractal motor activity regulation indices as a diagnostic tool, the following issues need to be addressed: (1) Replications using a separate, larger database are required to validate our findings. (2) The optimal timescale regions in which the scaling behavior can better predict health outcomes are yet to be determined. (3) The cohort used here consisted of relatively old participants. It is worth investigating whether the fractal indices can predict similar outcomes in middle-aged and younger adults. As the technique for motor activity monitoring is very mature, many large-cohort research or clinical studies such as the UK Biobank have included or have collected motor activity recordings. Analyzing the data in these studies is crucial not only for validating our findings but also for better application of wearable technologies in health monitoring.
In addition, it may become possible to apply the actigraphy-derived tools as a part of long-term home care monitoring, which may open up new avenues for clinical practice and healthcare research. Together with other clinical and physiological measures, the fractal regulation indices based on actigraphy may improve identification of older people at risk of frailty such that these individuals might benefit from early interventions. The advantages of the actigraphy-derived tools include noninvasiveness and cost-efficiency as compared to the traditional clinical assessments. For instance, the motor score also showed to be associated to outcomes; but it was derived from 10 motor performance tests (including Purdue Pegboard test, finger-tapping test, time to cover a distance of 8 feet, number of steps required to cover 8 feet, 360 degree turn time, number of steps to complete a 360 degree turn, leg stand, toe stand, grip strength, and pinch strength) (50) which require clinical visits and significant time/effort of those elder participants. Importantly, fractal motor activity patterns appear to be modifiable. For example, increased daily light exposure has been shown to diminish or even abolish the degradations of fractal motor activity regulation with aging in older persons with dementia (40). Studies on movement rehabilitation have implied the therapeutic milieu of promoting complexity of movement and restoring the optimal amount of movement variability to prevent motor system rigidity or instability (17–20). Further investigations are merited to determine whether fractal motor activity regulation can identify targets for interventions with the aim to improve physical wellbeing and longevity. One testable hypothesis is that improving fractal regulation in motor activity can help maintain physical wellbeing and increase life expectancy.
There are also limitations that are worth noting. First, the comorbidity and other health related data were self-reported, which potentially limits the validity of the study. Second, the frailty and disability are questionnaire-based surrogate endpoints. The associations of fractal motor regulation with objective health outcomes such as falls, fractures, hospitalization, and care consumption are yet to be determined. Third, the regions of timescales for the two fractal regulation metrics were determined empirically based on previous studies of aging and dementia. They are not necessarily optimal for predicting different outcomes. Further works are warranted to finely tune timescale region(s) to better define outcome-specific metrics. And last, the DFA approach assesses temporal fractal structure by examining the scaling behavior. There might be properties that are not be captured by DFA. The use of different methods, including other fractal or nonlinear dynamic analyses, to extract more health-related information from spontaneous fluctuations of motor activity should be encouraged.
Materials and Methods
Study design
We reported results from an on-going prospective, observational cohort study, namely, the Rush Memory and Aging Project (MAP) that is conducted at the Rush Alzheimer’s Disease Center, Rush University Medical Center. This current study focused on the use of noninvasive and unobtrusive activity monitoring to identify predictors of adverse health outcomes (including frailty, disability, and mortality) in an aging population of human participants. The results were reported in accordance with the guidelines for reporting observational studies — the Strengthening the Reporting of Observational Studies in Epidemiology (STROBE) Statement. The MAP project began in 1997. In 2005, a watch-like device was introduced to record daily movement or motor activity which was the specific baseline for the current study (see Data Collection and Preprocessing) (51). By mid-2018, motor activity recordings were collected from 1,398 participants (age at baseline: 56-100 years old; female: 1,065). Participants without follow-up clinical examinations were excluded from this study (n = 115); the remained participants were followed annually for up to 13 years (range: 1-13; mean: 6; standard deviation: 3). The protocol of the parent MAP study was approved by the Institutional Review Board of Rush University Medical Center. Written informed consent was obtained from all participants, and all participants signed a repository consent to allow their data to be repurposed. More information regarding the data can be found at www.radc.rush.edu. The protocol for this current study was approved by the Institutional Review Board of Partners Healthcare Inc.
Data collection and preprocessing
Motor activity (Fig. 1 and fig. S1) was collected continuously for up to 10 days at baseline using an activity monitor (Actical, Philips Respironics) worn on the non-dominant wrist. The device predominantly measures acceleration in a direction parallel to the face of the device with a continuous sampling frequency of 32 Hz. By built-in data processor, the raw acceleration data were integrated into proprietary counts in 15-second epochs (actigraphy data) that essentially reflect the movement amplitude. The activity recordings were subject to signal quality screenings with the assistance of a self-designed MATLAB GUI program (Ver. R2015a, the MathWorks Inc.) in order to identify: i) isolated huge spikes with amplitude going beyond 10 standard deviations away from the individual global mean levels; and ii) sequences of zeros with duration > 60 minutes during the daytime (as occurred when participants took the device off). The identified data points or segments were marked as gaps (52). Recordings of < 4 days or with identified gaps > 60% of data were excluded prior to subsequent analysis.
Assessment of fractal regulation
To assess the fractal regulation of motor activity, detrended fluctuation analysis (DFA) was performed to examine the temporal correlations of motor activity fluctuations at different timescales (52, 53). The method calculates the fluctuation amplitude, F(n), as a function of timescale n. Specifically, for a time series {xi|i = 1,2, …, N}, DFA performs following processes (see figs. S2 and S3 for demonstrations) (6, 51):
Removing the global mean and integrating the time series by where denotes the mean value of the time series xi;
Dividing the integrated signal Xt into non-overlapping windows of the same chosen size n;
Detrending the integrated signal Xt in each window using polynomial functions to obtain residuals by where Yt denotes the trend obtained by polynomial fit and the integrated time series after detrending;
Calculating the root mean square of residuals in all windows as detrended fluctuation amplitude using
The same four steps are repeated for different timescales (n). The 2nd order of polynomial function was used to detrend data in step 3 to eliminate the effect of possible linear trends in original data (6). A power-law form of F(n), where F(n)~nα, indicates a fractal structure in the fluctuations (Fig. 1). The parameter α, called the scaling exponent, quantifies the temporal correlation as follows: if α = 0.5, there is no correlation in the fluctuations (‘white noise’); if α > 0.5, there are positive correlations, where large values are more likely to be followed by large values (and vice versa); if α < 0.5, there are negative correlations, where large values are more likely to be followed by small values (and vice versa). For many physiological outputs under healthy conditions, α values are close to 1.0 (6, 54–56), indicating the most complex underlying control mechanisms. To ensure reliable estimation of F(n) at a timescale n, at least six segments without gaps of size n are required. Otherwise F(n) at and beyond that timescale will not be estimated. We have implemented the DFA using computer programs written in MATLAB which are openly available at Zenodo (57).
In humans, aging and dementia lead to breakdown in the multiscale patterns in motor activity that can be as characterized by different correlations (indicated by different α) over two distinct timescale regions with the boundary at ~1.5-2 hours (13, 16, 40). Thus, two scaling exponents of F(n) were calculated in this study: α1 at < 90 minutes, and α2 from 2 hours up to 10 hours (Fig. 1). Note that the transitional region of timescales between 1.5 and 2 hours was omitted. To ensure a reliable estimation of α1, F(n) must be available for up to at least n = 5 min. To ensure a reliable estimation of α2, F(n) must be available between timescales n = 2 hours to at least 8 hours.
Annual assessment of frailty
Physical frailty was assessed annually based on five components (58): (1) Gait speed was based on time to walk 8 feet; (2) Grip strength is measured using the Jamar hydraulic hand dynamometer (Lafayette Instruments) and is the average of 4 trials (2 per hand); (3) BMI was calculated as weight (kg)/height-m2; (4) Fatigue was assessed using two questions derived form a modified version of the Center for Epidemiologic Studies - Depression Scale; and (5) Self-reported physical activity was based on the number of hours per week that participants engage in 5 types of activities including walking, gardening, calisthenics, bicycle riding, and swimming. We dichotomized each of the five components used to construct a categorical composite measure of physical frailty similar to other investigators (59). The lowest quintile of grip, gait, BMI and physical activity were defined as frail and any reports of fatigue were considered consistent with frailty. Due to level differences between men and women on performance measures, sex-specific quintiles were used for grip, gait and physical activity. Similar to Fried et al (59), frailty was present in participants with 3 or more frail components.
Annual assessment of disability
Disability was annually assessed using three tests including basic activities of daily living (ADL), instrumental activities of daily living (IADL), and mobility disability. ADL was assessed using a modified version of the Katz measure (34, 60). IADL was assessed using items adapted from the Duke Older Americans Resources and Services project (34, 61). The Rosow-Breslau scale was used to assess mobility disability (62). These assessments resulted in three composite measures, separately, for ADL (ranging between 0-6), IADL (0-8), or mobility disability (0-3) with the values indicting the numbers of items required help/assistance reported by the participants. For each composite measure, the participants who had non-zero values were classified as having disability.
Other covariates
To test whether the multiscale indices predict incident frailty, incident disability, and mortality independent of known risk factors, we also consider the following covariates at baseline:
chronic health conditions assessed by a composite measure of three vascular risk factors (hypertension, diabetes, and smoking) and a cumulative score for four vascular diseases (myocardial infarction, congestive heart failure, claudication, and stroke) (35);
depressive symptoms assessed by the modified 10-item Center for Epidemiologic Studies Depression scale (63, 64);
cognitive performance assessed by a composite score of cognition based on performances on 19 neuropsychological tests (65);
motor function assessed by a composite score covering 10 motor performance tests (50);
total daily activity assessed in term of counts per day estimated based on actigraphy (3, 35, 66).
Statistical analysis
A series of Cox proportional hazards models were used to assess the associations of fractal indices with incident frailty, incident disabilities, and all-cause mortality. Results are reported as hazard ratio (HR) and 95% confidential intervals (CI). For each outcome (frailty, ADL, IADL, mobility disability, and all-cause mortality), we performed two core models that included α1 (model A1) or separately α2 (model A2) as a predictor while controlled for age, sex, and education. As secondary analysis, we augmented the two core models by further adjusting for: chronic health conditions (models B1 and B2); depressive symptoms (models C1 and C2); cognitive performance (models D1 and D2); motor function (models E1 and E2); physical activity (models F1 and F2).
For the core models for mortality, we also adjusted for baseline frailty and disability measure (models G1/2, H1/2, I1/2, and J1/2) to test whether frailty or disability could mediate the associations between α1/α2 and death. These statistical analyses were done using JMP Pro (Ver. 13, SAS Institute). The proportional hazards assumption was assessed using a global χ2 test in R (67). Statistical significance was determined a priori at nominal level of alpha = 0.05 (two-sided). Considering our hypothesis testing involves two predictors (α1 and α2) and five incident events (frailty, ADL, IADL, mobility disability, and all-cause mortality), we re-examined the association after correction for multiple comparisons using false discovery rate (FDR) (68), and the results were unchanged (Table 2).
Supplementary Material
Acknowledgments
Funding: Supported by the National Institutes of Health [grant numbers RF1AG059867 to K.H., RF1AG064312 to K.H., R01AG048108 to K.H., R01AG048108-04S1 to K.H., R01AG017917 to D.A.B., R01NS078009 to A.S.B., and R01AG056352 to A.S.B.]. P.L. was also partially supported by the International Postdoctoral Exchange Fellowship [grant number 20150042] from the China Postdoctoral Council. K.H. was also supported by P01AG009975.
Footnotes
Competing interests: None.
Data and materials availability: All data associated with this study are present in the paper or supplementary materials. Researchers can apply to use the MAP resource and access the motor activity data used via www.radc.rush.edu. Computer programs specifically designed for the used fractal analysis are available at Zenodo (DOI: 10.5281/zenodo.3407188).
References:
- 1.Steinhubl SR, Muse ED, Topol EJ, The emerging field of mobile health, Sci. Transl. Med 7, 283rv3–283rv3 (2015). [DOI] [PMC free article] [PubMed] [Google Scholar]
- 2.Kumar S, Nilsen WJ, Abernethy A, Atienza A, Patrick K, Pavel M, Riley WT, Shar A, Spring B, Spruijt-Metz D, Hedeker D, Honavar V, Kravitz R, Lefebvre RC, Mohr DC, Murphy SA, Quinn C, Shusterman V, Swendeman D, Mobile health technology evaluation: the mHealth evidence workshop, Am. J. Prev. Med 45, 228–236 (2013). [DOI] [PMC free article] [PubMed] [Google Scholar]
- 3.Buchman AS, Boyle PA, Yu L, Shah RC, Wilson RS, Bennett DA, Total daily physical activity and the risk of AD and cognitive decline in older adults, Neurology 78, 1323–1329 (2012). [DOI] [PMC free article] [PubMed] [Google Scholar]
- 4.Martin JL, Hakim AD, Wrist Actigraphy, Chest 139, 1514–1527 (2011). [DOI] [PMC free article] [PubMed] [Google Scholar]
- 5.Lim ASP, Yu L, Costa MD, Buchman AS, Bennett DA, Leurgans SE, Saper CB, Quantification of the fragmentation of rest-activity patterns in elderly individuals using a state transition analysis, Sleep 34, 1569–1581 (2011). [DOI] [PMC free article] [PubMed] [Google Scholar]
- 6.Hu K, Ivanov PC, Chen Z, Hilton MF, Stanley HE, Shea SA, Non-random fluctuations and multi-scale dynamics regulation of human activity, Phys. -Stat. Mech. Its Appl 337, 307–318 (2004). [DOI] [PMC free article] [PubMed] [Google Scholar]
- 7.Fadel PJ, Barman SM, Phillips SW, Gebber GL, Fractal fluctuations in human respiration, J. Appl. Physiol. Bethesda Md 1985 97, 2056–2064 (2004). [DOI] [PubMed] [Google Scholar]
- 8.Nunes Amaral LA, Ivanov PC, Aoyagi N, Hidaka I, Tomono S, Goldberger AL, Stanley HE, Yamamoto Y, Behavioral-independent features of complex heartbeat dynamics, Phys. Rev. Lett 86, 6026–6029 (2001). [DOI] [PubMed] [Google Scholar]
- 9.Scafetta N, Marchi D, West BJ, Understanding the complexity of human gait dynamics, Chaos Woodbury N 19, 026108 (2009). [DOI] [PubMed] [Google Scholar]
- 10.He BJ, Zempel JM, Snyder AZ, Raichle ME, The temporal structures and functional significance of scale-free brain activity, Neuron 66, 353–369 (2010). [DOI] [PMC free article] [PubMed] [Google Scholar]
- 11.Bhogal AS, Mani AR, Pattern Analysis of Oxygen Saturation Variability in Healthy Individuals: Entropy of Pulse Oximetry Signals Carries Information about Mean Oxygen Saturation, Front. Physiol 8 (2017), doi: 10.3389/fphys.2017.00555. [DOI] [PMC free article] [PubMed] [Google Scholar]
- 12.Buzzi UH, Stergiou N, Kurz MJ, Hageman PA, Heidel J, Nonlinear dynamics indicates aging affects variability during gait, Clin. Biomech. Bristol Avon 18, 435–443 (2003). [DOI] [PubMed] [Google Scholar]
- 13.Hu K, Van Someren EJW, Shea SA, Scheer FAJL, Reduction of scale invariance of activity fluctuations with aging and Alzheimer’s disease: Involvement of the circadian pacemaker, Proc. Natl. Acad. Sci. U. S. A 106, 2490–2494 (2009). [DOI] [PMC free article] [PubMed] [Google Scholar]
- 14.Cavanaugh JT, Kochi N, Stergiou N, Nonlinear analysis of ambulatory activity patterns in community-dwelling older adults, J. Gerontol. A. Biol. Sci. Med. Sci 65, 197–203 (2010). [DOI] [PMC free article] [PubMed] [Google Scholar]
- 15.Stergiou N, Decker LM, Human movement variability, nonlinear dynamics, and pathology: is there a connection?, Hum. Mov. Sci 30, 869–888 (2011). [DOI] [PMC free article] [PubMed] [Google Scholar]
- 16.Hu K, Harper DG, Shea SA, Stopa EG, Scheer FAJL, Noninvasive fractal biomarker of clock neurotransmitter disturbance in humans with dementia, Sci. Rep 3, 2229 (2013). [DOI] [PMC free article] [PubMed] [Google Scholar]
- 17.Stergiou N, Harbourne RT, Cavanaugh JT, Optimal Movement Variability: A New Theoretical Perspective for Neurologic Physical Therapy, J. Neurol. Phys. Ther 30, 120–129 (2006). [DOI] [PubMed] [Google Scholar]
- 18.Stergiou N, Kent JA, McGrath D, Human Movement Variability and Aging, Kinesiol. Rev 5, 15–22 (2016). [Google Scholar]
- 19.Harrison SJ, Stergiou N, Complex Adaptive Behavior and Dexterous Action, Nonlinear Dyn. Psychol. Life Sci 19, 345–394 (2015). [PMC free article] [PubMed] [Google Scholar]
- 20.Cavanaugh JT, Kelty-Stephen DG, Stergiou N, Multifractality, Interactivity, and the Adaptive Capacity of the Human Movement System: A Perspective for Advancing the Conceptual Basis of Neurologic Physical Therapy, J. Neurol. Phys. Ther. JNPT 41, 245–251 (2017). [DOI] [PMC free article] [PubMed] [Google Scholar]
- 21.Ngo H-VV, Martinetz T, Born J, Mölle M, Auditory Closed-Loop Stimulation of the Sleep Slow Oscillation Enhances Memory, Neuron 78, 545–553 (2013). [DOI] [PubMed] [Google Scholar]
- 22.Papalambros NA, Santostasi G, Malkani RG, Braun R, Weintraub S, Paller KA, Zee PC, Acoustic Enhancement of Sleep Slow Oscillations and Concomitant Memory Improvement in Older Adults, Front. Hum. Neurosci 11, 109 (2017). [DOI] [PMC free article] [PubMed] [Google Scholar]
- 23.Bassingthwaighte JB, Liebovitch LS, West BJ, Fractal Physiology (American Physiological Society, 1994). [Google Scholar]
- 24.Goldberger AL, Amaral LAN, Hausdorff JM, Ivanov PC, Peng C-K, Stanley HE, Fractal dynamics in physiology: alterations with disease and aging, Proc. Natl. Acad. Sci. U. S. A 99 Suppl 1, 2466–2472 (2002). [DOI] [PMC free article] [PubMed] [Google Scholar]
- 25.West BJ, Fractal physiology and the fractional calculus: a perspective, Front. Physiol 1, 12 (2010). [DOI] [PMC free article] [PubMed] [Google Scholar]
- 26.Pittman-Polletta BR, Scheer FAJL, Butler MP, Shea SA, Hu K, The role of the circadian system in fractal neurophysiological control, Biol. Rev. Camb. Philos. Soc 88, 873–894 (2013). [DOI] [PMC free article] [PubMed] [Google Scholar]
- 27.Li P, Yu L, Lim ASP, Buchman AS, Scheer FAJL, Shea SA, Schneider JA, Bennett DA, Hu K, Fractal regulation and incident Alzheimer’s disease in elderly individuals, Alzheimers Dement. J. Alzheimers Assoc 14, 1114–1125 (2018). [DOI] [PMC free article] [PubMed] [Google Scholar]
- 28.Lear SA, Hu W, Rangarajan S, Gasevic D, Leong D, Iqbal R, Casanova A, Swaminathan S, Anjana RM, Kumar R, Rosengren A, Wei L, Yang W, Chuangshi W, Huaxing L, Nair S, Diaz R, Swidon H, Gupta R, Mohammadifard N, Lopez-Jaramillo P, Oguz A, Zatonska K, Seron P, Avezum A, Poirier P, Teo K, Yusuf S, The effect of physical activity on mortality and cardiovascular disease in 130 000 people from 17 high-income, middle-income, and low-income countries: the PURE study, Lancet Lond. Engl 390, 2643–2654 (2017). [DOI] [PubMed] [Google Scholar]
- 29.Majer IM, Nusselder WJ, Mackenbach JP, Klijs B, van Baal PHM, Mortality Risk Associated With Disability: A Population-Based Record Linkage Study, Am. J. Public Health 101, e9–e15 (2011). [DOI] [PMC free article] [PubMed] [Google Scholar]
- 30.Seitz DP, Anderson GM, Austin PC, Gruneir A, Gill SS, Bell CM, Rochon PA, Effects of impairment in activities of daily living on predicting mortality following hip fracture surgery in studies using administrative healthcare databases, BMC Geriatr. 14, 9 (2014). [DOI] [PMC free article] [PubMed] [Google Scholar]
- 31.Yuki A, Otsuka R, Tange C, Nishita Y, Tomida M, Ando F, Shimokata H, Physical frailty and mortality risk in Japanese older adults, Geriatr. Gerontol. Int 18, 1085–1092 (2018). [DOI] [PubMed] [Google Scholar]
- 32.Allison PD, Survival Analysis Using SAS®: A Practical Guide [Book] (SAS Institute, 1995; https://www.oreilly.com/library/view/survival-analysis-using/9781555442798/). [Google Scholar]
- 33.Li P, Yu L, Yang J, Lo M-T, Hu C, Buchman AS, Bennett DA, Hu K, Interaction between the progression of Alzheimer’s disease and fractal degradation, Neurobiol. Aging (2019), doi: 10.1016/j.neurobiolaging.2019.08.023. [DOI] [PMC free article] [PubMed] [Google Scholar]
- 34.Boyle PA, Buchman AS, Wilson RS, Bienias JL, Bennett DA, Physical activity is associated with incident disability in community-based older persons, J. Am. Geriatr. Soc 55, 195–201 (2007). [DOI] [PubMed] [Google Scholar]
- 35.Buchman AS, Yu L, Boyle PA, Shah RC, Bennett DA, Total Daily Physical Activity and Longevity in Old Age, Arch. Intern. Med 172, 444–446 (2012). [DOI] [PMC free article] [PubMed] [Google Scholar]
- 36.Vermeulen J, Spreeuwenberg MD, Daniels R, Neyens JCL, Van Rossum E, De Witte LP, Does a falling level of activity predict disability development in community-dwelling elderly people?, Clin. Rehabil 27, 546–554 (2013). [DOI] [PubMed] [Google Scholar]
- 37.Mankowski RT, Anton SD, Axtell R, Chen S-H, Fielding RA, Glynn NW, Hsu F-C, King AC, Layne AS, Leeuwenburgh C, Manini TM, Marsh AP, Pahor M, Tudor-Locke C, Conroy DE, Buford TW, Device-Measured Physical Activity As a Predictor of Disability in Mobility-Limited Older Adults, J. Am. Geriatr. Soc 65, 2251–2256 (2017). [DOI] [PMC free article] [PubMed] [Google Scholar]
- 38.Peterson MJ, Giuliani C, Morey MC, Pieper CF, Evenson KR, Mercer V, Cohen HJ, Visser M, Brach JS, Kritchevsky SB, Goodpaster BH, Rubin S, Satterfield S, Newman AB, Simonsick EM, Physical Activity as a Preventative Factor for Frailty: The Health, Aging, and Body Composition Study, J. Gerontol. A. Biol. Sci. Med. Sci 64A, 61–68 (2009). [DOI] [PMC free article] [PubMed] [Google Scholar]
- 39.Trombetti A, Hars M, Hsu F-C, Reid KF, Church TS, Gill TM, King AC, Liu CK, Manini TM, McDermott MM, Newman AB, Rejeski WJ, Guralnik JM, Pahor M, Fielding RA, LIFE Study Investigators, Effect of Physical Activity on Frailty: Secondary Analysis of a Randomized Controlled Trial, Ann. Intern. Med 168, 309–316 (2018). [DOI] [PMC free article] [PubMed] [Google Scholar]
- 40.Hu K, Riemersma-van der Lek RF, Patxot M, Li P, Shea SA, Scheer FAJL, Van Someren EJW, Progression of Dementia Assessed by Temporal Correlations of Physical Activity: Results From a 3.5-Year, Longitudinal Randomized Controlled Trial, Sci. Rep 6, 27742 (2016). [DOI] [PMC free article] [PubMed] [Google Scholar]
- 41.Li P, Morris CJ, Patxot M, Yugay T, Mistretta J, Purvis TE, Scheer FAJL, Hu K, Reduced Tolerance to Night Shift in Chronic Shift Workers: Insight From Fractal Regulation, Sleep 40, zsx092 (2017). [DOI] [PMC free article] [PubMed] [Google Scholar]
- 42.Hu K, Scheer F. a. J. L., Ivanov PC, Buijs RM, Shea SA, The suprachiasmatic nucleus functions beyond circadian rhythm generation, Neuroscience 149, 508–517 (2007). [DOI] [PMC free article] [PubMed] [Google Scholar]
- 43.Lo M-T, Chiang W-Y, Hsieh W-H, Escobar C, Buijs RM, Hu K, Interactive Effects of Dorsomedial Hypothalamic Nucleus and Time-Restricted Feeding on Fractal Motor Activity Regulation, Front. Physiol 7, 174 (2016). [DOI] [PMC free article] [PubMed] [Google Scholar]
- 44.Krane-Gartiser K, Henriksen TEG, Morken G, Vaaler A, Fasmer OB, Actigraphic assessment of motor activity in acutely admitted inpatients with bipolar disorder, PloS One 9, e89574 (2014). [DOI] [PMC free article] [PubMed] [Google Scholar]
- 45.Sano W, Nakamura T, Yoshiuchi K, Kitajima T, Tsuchiya A, Esaki Y, Yamamoto Y, Iwata N, Enhanced persistency of resting and active periods of locomotor activity in schizophrenia, PloS One 7, e43539 (2012). [DOI] [PMC free article] [PubMed] [Google Scholar]
- 46.Indic P, Murray G, Maggini C, Amore M, Meschi T, Borghi L, Baldessarini RJ, Salvatore P, Multi-scale motility amplitude associated with suicidal thoughts in major depression, PloS One 7, e38761 (2012). [DOI] [PMC free article] [PubMed] [Google Scholar]
- 47.Aybek S, Ionescu A, Berney A, Chocron O, Aminian K, Vingerhoets FJG, Fractal temporal organisation of motricity is altered in major depression, Psychiatry Res 200, 288–293 (2012). [DOI] [PubMed] [Google Scholar]
- 48.Indic P, Salvatore P, Maggini C, Ghidini S, Ferraro G, Baldessarini RJ, Murray G, Scaling behavior of human locomotor activity amplitude: association with bipolar disorder, PloS One 6, e20650 (2011). [DOI] [PMC free article] [PubMed] [Google Scholar]
- 49.Hu K, Riemersma-van der Lek RF, Patxot M, Li P, Shea SA, Scheer FA, Van Someren EJ, Progression of dementia assessed by temporal correlations of physical activity: Results from a 3.5-year, longitudinal randomized controlled trial, Sci. Rep 6, 27742 (2016). [DOI] [PMC free article] [PubMed] [Google Scholar]
- 50.Buchman AS, Wilson RS, Leurgans SE, Bennett DA, Barnes LL, Change in motor function and adverse health outcomes in older African-Americans, Exp. Gerontol 70, 71–77 (2015). [DOI] [PMC free article] [PubMed] [Google Scholar]
- 51.Bennett DA, Schneider JA, Buchman AS, Barnes LL, Boyle PA, Wilson RS, Overview and findings from the rush Memory and Aging Project, Curr. Alzheimer Res 9, 646–663 (2012). [DOI] [PMC free article] [PubMed] [Google Scholar]
- 52.Hu K, Ivanov PC, Chen Z, Carpena P, Stanley HE, Effect of trends on detrended fluctuation analysis, Phys. Rev. E 64, 011114 (2001). [DOI] [PubMed] [Google Scholar]
- 53.Peng CK, Buldyrev SV, Havlin S, Simons M, Stanley HE, Goldberger AL, Mosaic organization of DNA nucleotides, Phys. Rev. E Stat. Phys. Plasmas Fluids Relat. Interdiscip. Top 49, 1685–1689 (1994). [DOI] [PubMed] [Google Scholar]
- 54.Peng CK, Havlin S, Hausdorff JM, Mietus JE, Stanley HE, Goldberger AL, Fractal mechanisms and heart rate dynamics. Long-range correlations and their breakdown with disease, J. Electrocardiol 28 Suppl, 59–65 (1995). [DOI] [PubMed] [Google Scholar]
- 55.Peng CK, Mietus JE, Liu Y, Lee C, Hausdorff JM, Stanley HE, Goldberger AL, Lipsitz LA, Quantifying fractal dynamics of human respiration: age and gender effects, Ann. Biomed. Eng 30, 683–692 (2002). [DOI] [PubMed] [Google Scholar]
- 56.Hausdorff JM, Mitchell SL, Firtion R, Peng CK, Cudkowicz ME, Wei JY, Goldberger AL, Altered fractal dynamics of gait: reduced stride-interval correlations with aging and Huntington’s disease, J. Appl. Physiol. Bethesda Md 1985 82, 262–269 (1997). [DOI] [PubMed] [Google Scholar]
- 57.Li Peng, pliphd/MATLAB-detrended-fluctuation-analysis: An MATLAB application for detrended fluctuation analysis (Zenodo, 2019; https://zenodo.org/record/3407188#.XXuZ_ZNKiX0). [Google Scholar]
- 58.Buchman AS, Wilson RS, Bienias JL, Bennett DA, Change in frailty and risk of death in older persons, Exp. Aging Res 35, 61–82 (2009). [DOI] [PMC free article] [PubMed] [Google Scholar]
- 59.Fried LP, Tangen CM, Walston J, Newman AB, Hirsch C, Gottdiener J, Seeman T, Tracy R, Kop WJ, Burke G, McBurnie MA, Cardiovascular Health Study Collaborative Research Group, Frailty in older adults: evidence for a phenotype, J. Gerontol. A. Biol. Sci. Med. Sci 56, M146–156 (2001). [DOI] [PubMed] [Google Scholar]
- 60.Katz S, Akpom CA, A measure of primary sociobiological functions, Int. J. Health Serv. Plan. Adm. Eval 6, 493–508 (1976). [DOI] [PubMed] [Google Scholar]
- 61.Hardy SE, Gill TM, Recovery from disability among community-dwelling older persons, JAMA 291, 1596–1602 (2004). [DOI] [PubMed] [Google Scholar]
- 62.Rosow I, Breslau N, A Guttman health scale for the aged, J. Gerontol 21, 556–559 (1966). [DOI] [PubMed] [Google Scholar]
- 63.Kohout FJ, Berkman LF, Evans DA, Cornoni-Huntley J, Two shorter forms of the CES-D (Center for Epidemiological Studies Depression) depression symptoms index, J. Aging Health 5, 179–193 (1993). [DOI] [PubMed] [Google Scholar]
- 64.Wilson RS, Barnes LL, Mendes de Leon CF, Aggarwal NT, Schneider JS, Bach J, Pilat J, Beckett LA, Arnold SE, Evans DA, Bennett DA, Depressive symptoms, cognitive decline, and risk of AD in older persons, Neurology 59, 364–370 (2002). [DOI] [PubMed] [Google Scholar]
- 65.Wilson RS, Boyle PA, Yu L, Barnes LL, Sytsma J, Buchman AS, Bennett DA, Schneider JA, Temporal course and pathologic basis of unawareness of memory loss in dementia, Neurology 85, 984–991 (2015). [DOI] [PMC free article] [PubMed] [Google Scholar]
- 66.Buchman AS, Wilson RS, Bennett DA, Total daily activity is associated with cognition in older persons, Am. J. Geriatr. Psychiatry Off J. Am. Assoc. Geriatr. Psychiatry 16, 697–701 (2008). [DOI] [PubMed] [Google Scholar]
- 67.Grambsch PM, Therneau TM, Proportional hazards tests and diagnostics based on weighted residuals, Biometrika 81, 515–526 (1994). [Google Scholar]
- 68.McDonald JH, Handbook of biological statistics (Sparky House Publishing, Baltimore, Maryland, ed. 3rd). [Google Scholar]
Associated Data
This section collects any data citations, data availability statements, or supplementary materials included in this article.