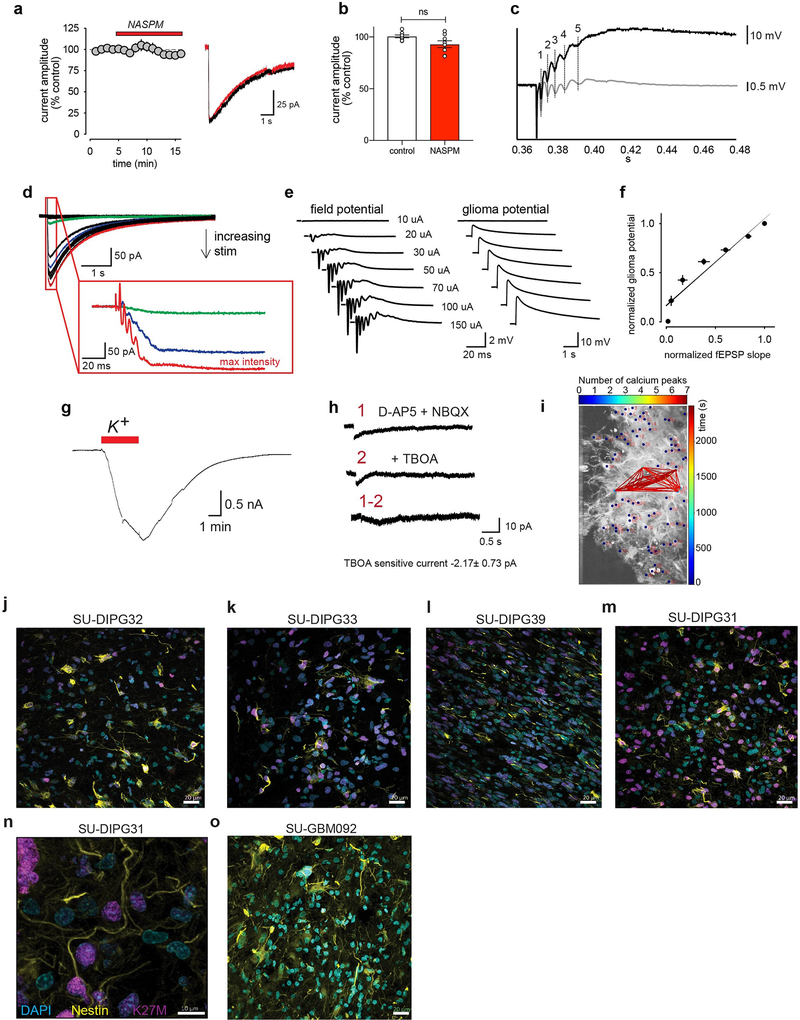
Extended Data Figure 5: Prolonged glioma currents and pediatric glioma tumor microtubes.
a, Time course of prolonged current block by NASPM (100μM; duration=red bar; n=8/5 cells/mice. Data are means ± s.e.m. (left); Representative traces of evoked prolonged current (block) unaffected by NASPM (red). b, Quantification of (a). P values determined by two-tailed paired Student’s t-test. NS = not significant. c, Alignment of phase-locked simultaneous recording of glioma prolonged potential with the field potential of firing neuronal population. d, Representative prolonged current traces with increasing stimulation intensity. Maximum intensity, red; intermediate intensities, blue and green (inset). Zoomed-in view illustrates distinct spike-like waveforms consistent with response to neuronal population firing. e, Relationship of extracellular field potential to magnitude of prolonged current (SU-DIPGXIII-FL xenograft) illustrated by simultaneous field potential (fEPSP) and whole-cell glioma current-clamp recordings. f, Prolonged glioma potential amplitudes vs. slope of fEPSPs elicited by electrical stimulation (10, 20, 30, 50, 70, 100 and 150 μA; R2= 0.92; n=14/4 cells:fields/mice for each except n=11/3 cells:fields/mice for 30 μA). g, Representative trace of potassium (K+)-induced prolonged current in SU-DIPGXIII-FL xenografts (n=9/2 cells/mice). h, Effect of TBOA on prolonged current in glioma (SU-DIPGXIII-FL). (1) Representative trace of residual current left after application with D-AP5 + NBQX in prolonged response to stimulation (top). D-AP5 + NBQX likely reduces the prolonged current due to the effect on CA1 pyramidal neurons, not through direct effect on the glioma cells themselves; (2) Representative trace of residual current after trace 1 was then treated with glutamate transporter blocker, 200μM TBOA (middle); (1 minus 2) Subtraction of trace 2 from trace 1 reveals 2pA current, that can be accounted for by TBOA. It should be noted that a small residual current remains (bottom; n=5/2 cells/mice). i, Synchronicity analysis of calcium peaks in glioma cells in Figure 3 shown over the course of 10 minutes. Red lines indicate cells synchronized with one another at various timepoints during indicated period. j-o, Confocal micrographs of primary human glioma tissue samples illustrate density and length of nestin immunopositive tumor microtubes. j-n, primary human tissue samples of pediatric H3K27M+ diffuse midline gliomas of the pons (also known as diffuse intrinsic pontine glioma, DIPG), sampled at the time of autopsy. o, Analysis in a primary tissue sample from an adult glioblastoma (SU-GBM092) illustrates similarity to adult glioma. For all images, blue, DAPI; yellow, nestin; magenta, H3K27M (tumor-specific antigen). Scale bar=20μm, except in (n), scale bar is 10μm. Data independently replicated in three sections per sample.

