


Abstract
In vertebrates, genomic DNA double-strand breaks (DSBs) are removed by non-homologous end-joining processes: classical non-homologous end-joining (c-NHEJ) and alternative end-joining (alt-EJ); or by homology-dependent processes: gene-conversion (GC) and single-strand annealing (SSA). Surprisingly, these repair pathways are not real alternative options restoring genome integrity with equal efficiency, but show instead striking differences in speed, accuracy and cell-cycle-phase dependence. As a consequence, engagement of one pathway may be associated with processing-risks for the genome absent from another pathway. Characterization of engagement-parameters and their consequences is, therefore, essential for understanding effects on the genome of DSB-inducing agents, such as ionizing-radiation (IR). Here, by addressing pathway selection in G2-phase, we discover regulatory confinements in GC with consequences for SSA- and c-NHEJ-engagement. We show pronounced suppression of GC with increasing DSB-load that is not due to RAD51 availability and which is delimited but not defined by 53BP1 and RAD52. Strikingly, at low DSB-loads, GC repairs ∼50% of DSBs, whereas at high DSB-loads its contribution is undetectable. Notably, with increasing DSB-load and the associated suppression of GC, SSA gains ground, while alt-EJ is suppressed. These observations explain earlier, apparently contradictory results and advance our understanding of logic and mechanisms underpinning the wiring between DSB repair pathways.
INTRODUCTION
Among lesions induced in the DNA by diverse chemical or physical agents, the DNA double strand break (DSB) is rather special because it not only breaks the molecule, but also compromises a fundamental concept utilized in the repair of common DNA lesions: The engagement of the complementary DNA strand to faithfully restore DNA sequence after lesion removal (1). As a result, an unprocessed DSB can be a lethal event, while an incorrectly processed DSB can increase, in addition to cell lethality, also its predisposition to cancer (2,3).
To counteract these risks cells engage several pathways to remove DSBs from their genome. Surprisingly, however, these multiple pathways have not evolved as alternative and equivalent options ensuring the faithful restoration of integrity and sequence in the DNA molecule (1). Instead, they show striking differences in their speed and accuracy, as well as in their functional fluctuations throughout the cell cycle (4). As a consequence, the engagement of one particular pathway to process a given DSB will directly also define the associated risks for genome integrity. Characterization of the parameters underpinning the engagement of a particular pathway in DSB repair is therefore required for our understanding of the biological effects of agents effectively inducing DSBs, such as ionizing radiation (IR). This information is likely to benefit human health, as it will help the development of approaches aiming at reducing the adverse effects of DSBs and protect thus individuals from medical or accidental exposures to IR (5). At the same time, this information will help the development of approaches to potentiate IR effects, specifically in tumor cells, and improve thus the outcome of radiation therapy (6–8).
Intensive work during the last few decades provided mechanistic insights of DSB processing pathways and allows now their classification on the basis of requirements for homology, DNA-end processing and cell-cycle-dependence (9). C-NHEJ operates with high speed throughout the cell cycle and requires no homology to function (10–13). It restores integrity in the DNA molecule after minimal processing of the DNA ends, but is not designed to ensure either the joining of the correct ends, or the restoration of DNA sequence at the generated junction (1).
All remaining pathways begin with the processing (also termed ‘resection’) of the 5′-DSB-end to generate a single-stranded 3′-DNA-end (ssDNA) of variable length that is utilized to search for homology – either within the broken DNA molecule, or in the sister chromatid. These pathways are therefore commonly classified as homology-directed repair (HDR) or homologous recombination repair pathways. The activity and abundance of the majority of proteins controlling and executing resection are cell cycle regulated, increasing as cells enter S-phase from low levels in G1 and reaching a maximum in G2-phase. Naturally, also the engagement of resection-dependent DSB repair pathways shows a similar increase during the S- and G2-phase of the cell cycle (14,15). Resection starts with DNA incisions by the MRE11–CtIP nuclease complex and continues with more processive resection by EXO1 exonuclease and the BLM–DNA2 helicase–endonuclease complex (15,16) generating ssDNA that is coated by RPA. The decision points and the parameters that determine whether a DSB will be repaired by c-NHEJ or be shunted away from this pathway is a key question that remains incompletely understood.
The most accurate way to process a resected DSB in S- or G2-phase of the cell cycle is by gene conversion (GC) using the sister chromatid as a homologous template. GC is an error-free, homology-dependent DSB repair pathway ensuring the restoration of integrity and sequence in the DNA molecule (9). For GC, RPA in the resected end is replaced by the RAD51 recombinase, via the coordinated action of BRCA1, BRCA2, PALB2 and DSS1 proteins (17,18). Owing to these unique properties, GC is often considered a natural first choice for DSB processing when the sister chromatid is available. However, as we will see here decisions for GC engagement are complex, tightly regulated and dependent on parameters that only recently have begun to be characterized.
A second homology-dependent pathway beginning with resection is single strand annealing (SSA). For this pathway to initiate, RPA at the resected DNA ends needs to trigger the assembly of RAD52 recombinase (14,16). SSA shows strong preference for homologies present in the same DNA molecule at some distance from the DSB site and is accompanied by deletion of the intervening DNA segment, which can be of substantial length (9). It is therefore inherently error-prone.
Resected DNA ends in S- and G2-phase of the cell cycle and to some degree also in G1-phase, are also processed by alt-EJ, an incompletely defined repair pathway that functions also as backup to c-NHEJ and GC, benefiting from short homologies (microhomologies) revealed by resection (10–13). This pathway is also known to be highly error-prone and to cause, in addition to sequence alterations at the DSB junction also chromosomal translocations.
It is evident from the above outline that with the exception of GC, all pathways engaging in DSB repair are inherently error-prone in the sense that their functional design accepts events altering the DNA sequence in the vicinity of the DSB and tolerates rearrangements in the genome. Notably, since GC is cell cycle-dependent, error-free processing of a DSB is possible only in S/G2-phase, when resection is activated and the sister chromatid available. But what determines the shunting of a DSB to GC, away from c-NHEJ, in S/G2-phase? In addition, while resection remains critical for DSB processing by GC, its extent is critical for correct function. Indeed the degree of resection correlates inversely with repair fidelity and over-resection favors the error-prone SSA (14).
It is commonly thought that in G2-phase, c-NHEJ and GC have at first equal access to the DSB and that the ultimate pathway engagement is determined by competition (1,14). In line with this expectation, salient features of GC, such as RAD51 foci formation, appear increased in cells deficient in c-NHEJ (19) and reporter assays for the processing of I-SceI-induced DSBs show similar contributions for c-NHEJ and GC (20). In contrast, when repair of IR-induced DSBs is analyzed in G2-phase, estimates for GC contributions in the range between 10% and 20% are obtained (21–23). Strikingly, a DSB repair defect cannot be detected, even in G2-phase, when repair of IR-induced DSBs is measured by pulsed-field gel electrophoresis (PFGE) in GC mutants of Chinese hamster, mouse or chicken origin, suggesting that the contribution of GC can under certain conditions be below the limit of detection (24–26). Such widely divergent estimates of the contribution of GC to DSB repair hint to as of yet unrecognized parameters for DSB repair pathway selection that are further analyzed here.
Recent work suggests that selection of a DSB repair pathway involves inputs from DSB-flanking chromatin. Central in this response is the ubiquitination of histone H2A on lysines 13 and 15 by the RNF168 E3 ligase that generate an affinity trap for 53BP1, a protein that plays a crucial role in DSB-repair decision (27). Through this interaction, H2A ubiquitination is coupled to the recruitment of the proteins RIF1, REV7, PTIP and Artemis, which may shield DSBs against resection (28–36) and promote c-NHEJ at the expense of HDR (27,37). This is indeed the function expected from a potential pathway selector. But what cues are followed for the activation of the RNF168–53BP1 pathway and which are the ultimate aims of such activation?
An additional and for the present study directly relevant line of investigation reveals that the RNF168–53BP1 pathway operates in a narrow dynamic range generated by the rapid turnover of RNF168 that allows the efficient assembly of 53BP1 at only ∼20–40 DSBs (38,39). Furthermore, analysis of repair dynamics in the S and G2-phases of the cell cycle, suggests that the RNF168–53BP1 pathway restrains without abolishing DSB resection to favor error-free RAD51-mediated GC over mutagenic RAD52-driven SSA (40).
Here, we address DSB repair pathway selection with special emphasis on parameters limiting GC. Our analysis focuses on cells in G2-phase of the cell cycle, where GC is an option for DSBs induced over the entire genome, rather than the replicated genome only, as is the case during S-phase. Furthermore, in G2-phase estimates of the relative contributions of c-NHEJ, GC and SSA is possible, as all these pathways are active. We show pronounced suppression of GC with increasing DSB-load that is delimited but not defined by 53BP1 and RAD52. Strikingly, at low DSB-loads, GC repairs ∼50% of DSBs, whereas at high DSB-loads its contribution is undetectable and SSA gains ground, while alt-EJ is suppressed.
MATERIALS AND METHODS
Cell culture, synchronization of cells by centrifugal elutriation and cell cycle analysis
A549 (human lung epithelial carcinoma cells), HA-AsiSI-ER-U2OS (human bone osteosarcoma epithelial cells), parental HCT116 and LIG4-/- deficient HCT116 cells, as well as U2OS cells harboring DSB repair reporter substrates (DR-GFP, EJ5-GFP, SA-GFP and EJ2-GFP) (41) were grown as a monolayer in McCoy's 5A medium supplemented with 10% fetal bovine serum (FBS) and antibiotics. 53BP1+/+ and 53BP1−/− U2OS cells were grown in McCoy's 5A medium supplemented with 10% FBS and antibiotics. 82-6 hTert, a hTert immortalized normal human fibroblasts, were grown in Eagle's minimum essential medium (MEM) supplemented with 10% FBS and antibiotics. Mouse embryonic stem cells (MES), deficient or proficient for 53BP1 were grown in DMEM/F12, supplemented with 10% FBS and 1% non-essential amino acids. All cell lines were grown in an atmosphere of 95% air and 5% CO2 at 37°C.
To obtain cell populations enriched in the different phases of the cell cycle, we employed centrifugal elutriation. For this purpose, cells were harvested in the exponential phase of growth and processed as described elsewhere (26). To evaluate the distribution of cells throughout the cell cycle, cells were fixed in 70% ethanol and DNA was stained with propidium iodide (PI). PI signal was evaluated on a Gallios flow cytometer (Beckman Coulter). When required by the experimental protocol, appropriate inhibitors were used at the concentration indicated in each individual experiment. All inhibitors were diluted in DMSO to obtain 10 mM stock solutions.
Radiation exposure
Irradiations were carried out with an X-ray generator (GE-Healthcare) operated at 320 kV, 10 mA with a 1.65 mm Al filter (effective photon energy ∼90 kV), at a distance of 500 mm, and a dose rate of ∼1.3 Gy/min. Dosimetry was performed with a PTW and/or a chemical dosimeter, which were used to calibrate an infield ionization monitor. Cells were returned to the incubator immediately after exposure to IR.
Immunofluorescence microscopy
For immunofluorescence (IF) analysis, cells were either directly grown on poly-l-lysine coated coverslips, or seeded on such coverslips after centrifugal elutriation. For scoring of IR induced repair foci specifically in G2-phase, when indicated, exponentially growing cells were pulse-labeled for 30 min with 10 μM EdU just before irradiation and EdU negative (EdU−) cells analyzed in the G2-phase compartment. Alternatively, ∼0.5 × 10⁶ G2-phase-enriched elutriated cells were plated in full medium for 1h on poly-L lysine coated coverslips in the presence of 0.04 μg/ml nocodazole to prevent division and were subsequently exposed to IR. At the indicated times thereafter, cells were fixed for 15 min in 2% paraformaldehyde and washed with PBS (0.14 M NaCl, 0.01 M phosphate buffer, pH 7.0). Cells were permeabilized for 5 min in 0.5% Triton X-100, 100 mM Tris–HCl and 50 mM EDTA, washed with PBS and blocked overnight at 4°C in PBG buffer (0.2% Gelatin, 0.5% BSA fraction V, dissolved in PBS). For RAD51 detection an anti-RAD51 mouse monoclonal antibody (clone 14B4, GeneTex; 1/400 dilution in PBG), or an anti-RAD51 rabbit polyclonal antibody (Ab-1, Calbiochem; 1/400 dilution in PBG) were used. For γ-H2AX and cyclin B1 visualization, an anti-γ-H2AX monoclonal mouse antibody (clone 3F2, Abcam; 1/400 dilution) and an anti-cyclin B1 polyclonal rabbit antibody (H-433, Santa Cruz; 1/100 dilution) were used. The detection of RPA70 was accomplished using a mouse monoclonal antibody (42) and the detection of 53BP1 with a rabbit polyclonal antibody (H-300, Santa Cruz). Primary antibodies were incubated for 1.5 h and were removed by three PBS washing steps (5 min) to add subsequently the anti-mouse IgG, Alexa Fluor 488-conjugated, or anti-rabbit IgG Alexa Fluor 568-conjugated secondary antibodies for 1 h (ThermoFisher Scientific). If EdU labeling was applied, the slides were also processed with Click-IT staining kit (ThermoFisher Scientific) according to the manufacturer's instructions. Finally, coverslips were washed with PBS, incubated for 15 min in 0.1 μg/ml DAPI solution and embedded in Prolong Gold Antifade mounting media (ThermoFisher Scientific). To detect repair foci, processed slides were scanned on a Leica TCS SP5 confocal microscope. Sequential scanning was employed to exclude spillover from different channels. For better comparison between experiments, detector settings were kept constant for the same antibody batch.
Digital image analysis
For analysis of the captured three-dimensional image stacks, the module of the Imaris 8.0 software (Bitplane), Spots and Split Spots, was used to determine the foci numbers. Alternatively, the Cell module of the Imaris 8.0-9.3 software was utilized. The grayscale value thresholds for the separation of signal and background were kept constant in different experiments with the same antibody batch to ensure comparability between data sets. Only objects with a minimum diameter of 0.5 μm after thresholding were counted as foci. For every dose and time point, ∼150 cells were quantified. When cyclin B1 was used to identify G2-phase cells, only cells with clearly visible cyclin B1 staining in the cytoplasm were included in the analysis. For cell cycle specific analysis of DSB repair foci in EdU negative (EdU−), G2-phase cells, data obtained using the Imaris software were processed by the open source graphic software package, Orange.
Cell cycle dependent evaluation of DSB repair foci by quantitative image-based cytometry (QIBC).
Where indicated, the cell cycle dependent evaluation of γ-H2AX and RAD51 foci was performed, after processing for IF as described above, on the AxioScan.Z1 platform (Zeiss) for high-throughput slide-scanning analysis. Cells were labeled with 10 μM EdU for 30 min and were irradiated with increased X-ray doses. At the indicated times after irradiation, cells were processed, mounted on cover slips and areas 4 × 4 mm scanned. Depending on cell density in selected areas, 10 000–20 000 cells were captured. Images were subjected to cell fragmentation analysis (Imaris), which provides information for nuclear fluorescence intensities for DAPI and EdU staining, as well as for the number of γ-H2AX and RAD51 foci. Data generated by Imaris software were converted to the format used for the analysis of flow cytometry data (Kaluza, Beckman Coulter) and processed to generate the data at the corresponding figures. Cells in G2-phase at the time of irradiation, as well as during the post-irradiation incubation period were specifically analyzed as described above.
Immunofluorescence analysis of DSB repair foci and analysis of DNA end resection in HA-AsiSI-ER cells
At the indicated time points 300 nM 4-OH-Tamoxifen (4-OHT) was added to the U2OS HA-AsiSI-ER cells (a gift of Dr G. Legube) and cells were processed for immunofluorescence analysis as described above. In order to evaluate the effect of IR on DNA end resection at specific AsiSI-induced DSBs, cells were incubated with 4-OHT and exposed to 2, 4 or 8 Gy of X-rays. Four hours later cells were collected, genomic DNA (gDNA) isolated using a commercially available genomic DNA extraction kit (Macherey-Nagel) and quantitated using a Qubit device. To analyze resection, the amount of ssDNA was determined, by quantitative polymerase chain reaction (qPCR) at two efficiently cleaved AsiSI sites on chromosome 1 (DSB1, chromosome 1: 89231183 and DSB2, chromosome 1:109838221), as well as at a control genomic site on chromosome 22, where the AsiSI sequence is not present (noDSB) (43,44). To increase the specificity of the reaction, site-specific TaqMan probes were used. Prior to qPCR, 10 μg of gDNA was digested, or mock-digested, overnight with BsrGI-HF, BamHI-HF or HindIII-HF in CutSmart buffer at 37○C. Digested gDNA was recovered using spin columns and quantitated. Forty nanograms of digested, or mock-digested, gDNA were used as template in a 25 μl qPCR reaction containing 12.5 μl of 2× Taqman Universal PCR Master Mix, 0.5 μM of each primer and 0.2 μM of TaqMan probe. PCR reactions were run on StepOne Plus Real-Time PCR System (ThermoFischer Scientific). The percentage of ssDNA (ssDNA%) generated by resection at selected sites was determined using the following equation: ssDNA% = 1/(2(ΔCt-1) + 0.5) × 100. ΔCt, was calculated by subtracting the Ct value of the mock-digested samples from the Ct value of the corresponding digested samples.
Biochemical fractionation of cell extracts
Cells were collected with a cell scraper, washed with PBS and subjected to biochemical fractionation as follows. About 2–3 × 10⁶ cells were suspended in 500 μl CSK buffer (0.5% Triton X-100, 100 mM NaCl, 3 mM MgCl2, 300 mM sucrose, 1 mM EGTA, 10 mM PIPES pH 6.8) containing protease inhibitors (Complete inhibitors, Roche) and incubated for 10 min on ice. Cells were centrifuged at 500 × g for 5 min at 4°C and the soluble material collected. The pellet was extracted with 200 μl of 0.2 M ammonium sulphate. After 10 min incubation on ice, the cell suspension was centrifuged at 2000 × g for 5 min at 4°C and the supernatant added to the previously collected soluble fraction. The combined supernatant was additionally cleared by centrifugation at 10 000 × g for 10 min at 4°C and was termed the ‘soluble fraction’. To generate the ‘chromatin fraction’, the pellet was washed with buffer A (10 mM NaCl, 5 mM MgCl2, 250 mM sucrose, 1 mM EGTA, 10 mM Tris–HCl, pH 7.6) containing protease and phosphatase inhibitors and was dissolved in Laemmli sample buffer.
SDS-PAGE and western blot analysis
Electrophoresis was carried out by using 10–12.5% polyacrylamide gels according to Laemmli (45). For western blot analysis, proteins were transferred onto 0.2 μm nitrocellulose membranes by wet or ‘dry’ iBlot (ThermoFisher scientific) transfer. Equal loading and transfer efficiency were monitored by Ponceau S staining of the membrane, combined with immunodetection of fraction-specific proteins to ascertain the quality of the fractionation. After transfer, membranes were incubated in blocking buffer (5% non-fat dry milk in 0.1% Tween-20, 150 mM NaCl, 25 mM Tris–HCl, pH 7.6) for 1 h at room temperature (RT), or overnight, and were incubated for 2 h at RT, or overnight, at 4°C with the primary antibody. Subsequently, membranes were washed three times for 10 min with TBS-T (0.1% Tween-20, 150 mM NaCl, 25 mM Tris–HCl, pH 7.6) and incubated for 1 h with the secondary antibody. The following primary antibodies were used: anti-RAD51 rabbit polyclonal (Ab-1, Calbiochem); anti β-tubulin rabbit polyclonal (Cell signaling); α-tubulin mouse monoclonal (Sigma-Aldrich); anti-Lamin A/C mouse monoclonal (Santa Cruz); anti-RAD52 mouse monoclonal (Abcam); anti-MRE11 rabbit polyclonal (Novus Biologicals); anti-KU80 rabbit polyclonal (Santa Cruz); anti-KU70 mouse monoclonal (GeneTex); anti-RPA34 mouse monoclonal (42) and anti-53BP1 rabbit polyclonal (Santa Cruz), anti-pKAP1-S824 rabbit polyclonal (Bethyl Laboratories), anti-LIG4 (D-8) mouse monoclonal (SantaCruz), anti-LIG4 (HPA001334) rabbit polyclonal (Sigma-Aldrich). The secondary antibodies were: anti-mouse IgG, anti-rabbit IgG conjugated with horseradish peroxidase, anti-mouse IgG conjugated with IRDye680 (Li-COR) and anti-rabbit IgG conjugated with IRDye800 (Li-COR). Membrane development was accomplished using the ECL+ chemiluminescence detection kit (GE Healthcare) as recommended by the manufacturer. Western blots were visualized and quantified by the VersaDoc imaging system (Bio-Rad) using the Quantity One software (Bio-Rad). Alternatively, membranes were scanned and quantified in the Odyssey infrared scanner (Li-COR).
Flow cytometry analysis of RPA70 and γ-H2AX
For DNA end-resection analysis using RPA70 detection, exponentially growing cells were pulse-labelled for 30 min with 10 μM EdU. After EdU incubation, the growth medium was removed and cells were rinsed once with pre-warmed PBS. Fresh medium was supplied and cells were exposed to X-rays. At different times thereafter, cells were collected by trypsinization and unbound RPA was extracted by incubating the cell pellets for 5 min in ice-cold PBS containing 0.2% Triton™ X-100. Cells were spun-down for 5 min and pellets were fixed for 15 min with 3% paraformaldehyde and 2% sucrose dissolved in PBS. Cells were blocked with PBG blocking buffer overnight at 4°C and incubated for 1.5 h with a monoclonal antibody raised against RPA70 (αSSB70B, mouse hybridoma cell line kindly provided by Dr J. Hurwitz), or an anti-γ-H2AX monoclonal antibody (Abcam). Cells were washed twice with PBS and incubated for 1.5 h with a secondary antibody conjugated with Alexa Fluor 488 (Thermo Fisher Scientific, A11001). Subsequently, when applicable, EdU signal was developed using an EdU staining kit (ThermoFisher Scientific) according to the manufacturer's instructions. Three-parameter analysis was carried out with a Gallios flow cytometer (Beckman Coulter) and quantitated using the appropriate software (Kaluza 1.3-2.1, Beckman Coulter).
RNA interference
To deplete selected DNA repair proteins, commercially available, specific siRNA (QIAGEN) against RAD51 (Hs_RAD51_7 FlexiTube siRNA), Rad52 (Hs_RAD52_5 and Hs_RAD52_6 FlexiTube siRNA) and CtIP (Hs_RBBP8_6 FlexiTube siRNA) were utilized. These siRNAs were delivered to the cells by nucleofection, using Nucleofector 2D device (Lonza Bioscience). The efficiency of the knock-down was assessed by quantitating protein levels using western blot analysis, 24 h after nucleofection.
Analysis of GC, SSA, alt-EJ and c-NHEJ function on I-SceI induced DSBs using GFP reporter cell lines
U2OS GFP reporter cells (a gift of Dr J. Stark) were employed to measure repair of I-SceI induced DSBs by a specific DSB repair pathway (41,46). DR-GFP reporter cell line is specific for gene conversion (GC), EJ5-GFP is specific for non-homologous end-joining, SA-GFP is specific for SSA while EJ2-GFP is specific for alt-EJ. Upon transfection of cells by nucleofection with the I-SceI expression plasmid, an I-SceI mediated DSB is generated at the corresponding location and its repair by the indicated DSB repair pathway generates GFP signal that is quantified (see Supplementary Figure S5 for more details). For experiments, 2 × 10⁶ cells were irradiated at different times before or after transfection by nucleofection (Lonza) with 2 μg of the I-SceI expressing plasmid, pCMV3xNLS-I-SceI. At 24 hours post transfection, cells were collected by trypsinization and GFP expression analyzed by flow cytometry (Gallios, Beckman Coulter) using a 488nm argon laser. GFP emission was collected at FL1 using a 510BP filter. The frequency of repair events was calculated as the frequency of GFP-positive cells. Transfection efficiency was determined in each experiment using replicate cultures and 1 μg per 1 × 10⁶ cells of the pEGFP-N1 construct expressing GFP. Only experiments with transfection efficiency above 80% were analyzed further.
Premature chromosome condensation (PCC)
Exponentially growing cell cultures were irradiated and allowed to repair at 37°C for various times after irradiation. 50 nM Calyculin-A was added for 45 min before harvesting the respective time point to induce PCC. The time of calyculin-A treatment is included in the repair time shown in the graphs. Cells were harvested and prepared using standard protocols of chromosome damage analysis at metaphase. About 150 G2-PCCs were scored for each experimental point from three independent experiments. Scoring of excess PCC fragments was carried out using bright field microscopy (Olympus VANOX-T, Japan). Alternatively, slides were scanned in a MetaSystems platform, equipped with an AxioImager.Z2 fluorescence microscope (Zeiss) and a camera for automated image capture. Analysis was carried out using the Ikaros imaging software (MetaSystems, Germany).
RESULTS
GC is suppressed with increasing DSB-load in the genome
We have shown before (47) that DSB processing as measured by pulsed-field gel electrophoresis (PFGE) is highly efficient in actively growing chicken, bursa-derived DT40 cells showing 1000-fold increase in gene targeting efficiency owing to GC activation (48). Notably, DSB processing remains equally effective in derivative DT40 mutants with defects in RAD51, RAD51B, RAD52 and RAD54 at IR doses between 20–80 Gy (see Supplementary Figure S1A for a summary of PFGE results after exposure to 80 Gy) (47). We also reported (26) that actively growing mouse embryonic fibroblast (MEF) mutants defective in GC owing to RAD54 deletion, process DSBs with efficiency similar to that of wt cells (Supplementary Figure S1B). Also Chinese hamster mutants with defects in XRCC2 or XRCC3 were reported (25) to process DSBs in G2-phase, as efficiently as their wt counterpart (Supplementary Figure S1C). Finally, Chinese hamster fibroblasts, V79, process DSBs highly efficiently after exposure to a range of doses between 20 and 80 Gy, with no signs of saturation for the underlying repair pathways (Supplementary Figure S1D).
These results immediately attest an overall impressive DSB processing efficiency, even at extremely high DSB-loads, in a diverse group of vertebrate cells. Strikingly, these PFGE results fail at the same time to detect any contribution of GC to overall DSB processing, which sharply contrasts the known radiosensitivity of GC mutants that clearly documents significant GC contributions to genome integrity. What is the basis of these apparently contradictory observations?
Because the PFGE methods employed in the above experiments have been validated in different experimental settings and cannot be questioned in principle, we chose to address this conundrum by engaging in a systematic, in-depth analysis of DSB processing as a function of IR dose. Indeed, while cell radiosensitivity is measured by colony formation between 0 and 10 Gy, the PFGE analysis shown above typically requires IR doses >20 Gy. Is it possible that the contribution of GC diminishes with increasing IR dose?
Measurements of GC-contributions to DSB processing is best carried out in the G2-phase of the cell cycle (4). Therefore, we either irradiated asynchronously growing cells and analyzed by IF, specifically in late S/G2, cells identified by co-staining of cyclin B1 (to be referred to hereafter as CycB1+ cells) (Supplementary Figure S2A) (49). Alternatively, we fractionated by centrifugal elutriation asynchronously growing cells and analyzed fractions enriched in G2-phase cells (to be referred to hereafter as G2-cells) (Supplementary Figure S2B).
IF based kinetic analysis of γ-H2AX foci in A549 cells exposed to gradually increasing IR doses in G2-phase (CycB1+), shows that foci develop rapidly reaching a maximum at 1 h, independently of IR dose (Figure 1A and B). The number of foci scored at this maximum, increases linearly with dose up to 4 Gy (Figure 1C). Foci analysis at higher doses is hampered by foci overlap, a problem that can be overcome by cell cycle specific quantitation of total γ-H2AX signal using flow cytometry (Figure 1D and Supplementary Figure S2C). In such two-parameter measurements, the normalized γ-H2AX signal intensity (arithmetic mean) per G2–phase cell increases linearly up to 20 Gy (Figure 1E). We conclude that similar to DSBs, γ-H2AX foci are induced linearly with IR dose with ∼40 DSBs, or γ-H2AX foci, induced per Gy in a G2-phase A549 cell (50).
Figure 1.
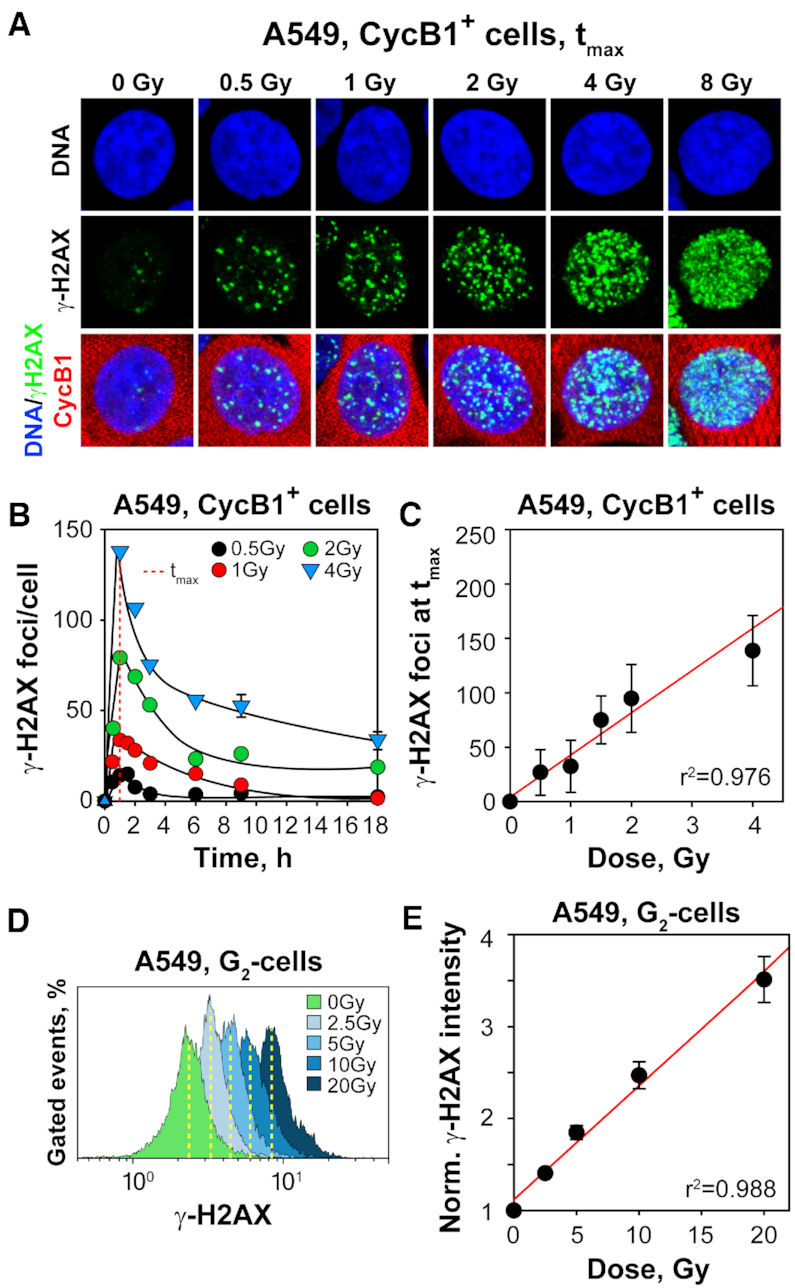
γ-H2AX foci formation increases linearly with increasing IR dose in G2-phase A549 cells. (A) Maximum intensity projection (MIP) images of γ-H2AX foci (green) at tmax (1h) in G2-phase, A549 cells (CycB1+; red), counterstained with DAPI (blue) after exposure to the indicated IR doses. (B) Kinetics of γ-H2AX foci formation and decay in cells exposed to 0.5, 1, 2 and 4 Gy. The dashed red line indicates the time point at which foci numbers reach maximum (tmax) at indicated IR doses. (C) Numbers of γ-H2AX foci at tmax as a function of IR dose. The red line has been calculated by linear regression through the data points. (D) Representative flow cytometry histograms of γ-H2AX intensity (1 h) as a function of IR dose, specifically for G2-phase cells selected by propidium iodide staining; Supplementary Figure S2C depicts the gates applied. (E) Normalized, arithmetic mean of γ-H2AX signal intensity as a function of IR dose. Normalization was carried out by dividing the mean signal intensity measured in irradiated cells by that measured in non-irradiated cells. Data points represents the mean and standard deviation calculated from three independent experiments.
The decay in the number of γ-H2AX foci observed after 1 h (Figure 1B), suggests efficient processing of DSBs, but offers no information on the repair pathway(s) involved. To generate pathway-relevant information, we analyzed RAD51 foci formation as evidence for GC engagement (51,52). RAD51 foci form readily in A549 cells examined in G2-phase (CycB1+) at different times after exposure to increasing doses of IR (Figures 2A, B). A very similar response is also observed in elutriated G2-cells (data not shown, but see below). However, in contrast to γ-H2AX, where foci formation peaks at 1 h independently of the IR dose administered, RAD51 foci formation peaks at times that increase markedly with increasing IR dose. Plotting of the time required for RAD51 foci to peak (tmax) as a function of IR dose (Figure 2C) reveals a monotonous increase up to 8 Gy followed by a plateau and possibly a decline at higher doses—both for CycB1+ cells, as well for G2-phase cells obtained by centrifugal elutriation. A second notable outcome of this analysis is the strong deviation from linearity in the maximum induction of RAD51 foci with increasing IR dose and the plateau reached above 4 Gy (Figure 2D). Similar results are also obtained using an hTert immortalized normal human fibroblast cell line, 82-6 hTert, suggesting a rather general response with similar manifestations in normal and tumor cells (data not shown).
Figure 2.

The contribution of GC to DSB processing decreases with increasing IR dose in G2-phase cells. (A) MIP images of RAD51 foci (green) at tmax in G2-phase, A549 cells (CycB1+, red). Other details as in Figure 1A. (B) Kinetics of RAD51 foci formation and decay in cells exposed to 0.5, 1, 4 and 8 Gy. The dashed red lines indicate the time points at which RAD51 foci reach maximum (tmax). (C) Dependence of tmax as defined in (B) on IR dose; the graph also includes results obtained in similar experiments carried out with centrifugal elutriation G2-enriched cells (red circles). The red dashed line traces tmax for γ-H2AX foci formation as shown in Figure 1B. (D) RAD51 foci numbers at tmax as a function of IR dose for CycB1+ A549 cells. Red symbols represent results obtained in similar experiments with centrifugal elutriation G2-enriched A549 cells. (E) Ratio of RAD51 to γ-H2AX foci as a function of IR dose in G2-phase irradiated cells. The value of this ratio reflects the proportion of IR-induced DSBs that are processed by GC at each IR dose. Results are shown for G2-phase, CycB1+ cells (black circles), as well as results obtained with centrifugal elutriation enriched G2-cells (red circles). (F) Results as in (E) for CycB1+ cells plotted as a function of DSB-load. For the calculation of these values, we assumed that 1 Gy of IR generates 40 DSBs in a G2-irradiated A549 cell. (G) Results showing RAD51 to γ-H2AX foci ratio as a function of IR dose in G2-phase irradiated HCT116-wt and HCT116 LIG4−/− deficient cells (n = 2). Data points represent means and standard deviations from three independent determinations.
Assuming that the peak number of RAD51 foci forming in a cell reflects the number of DSBs processed by GC, the results suggest that the engagement of GC is strongly suppressed at IR doses >2 Gy. To obtain a quantitative estimate of GC contribution as a function of IR dose, we calculated the ratio between γ-H2AX (total DSBs, 40/Gy independently of dose (50)) and RAD51 foci at tmax, as shown in Figure 2D. Figure 2E summarizes results from the above experiments, as well as from several additional experiments carried out using CycB1+ detection or centrifugal elutriation, and includes IR doses in addition to those shown in Figure 2B.
Strikingly, we uncover a dramatic, biphasic linear decrease in the engagement of GC with increasing IR dose. The steep and shallow components intersect in this cell line at ∼2 Gy. At the highest dose analyzed (16 Gy), the contribution of GC is undetectable in line with the results summarized in Supplementary Figure S1. With decreasing IR dose, the contribution of GC steadily rises and reaches 10% at 2 Gy in line with earlier reports (21–23). Strikingly, below 2 Gy the GC contribution rapidly increases further approaching 30% at 1 Gy and even 50% at 0.5 Gy. Figure 2F shows the same results plotted as a function of DSB-load per cell, calculated assuming the induction of 40 DSBs/Gy per cell. A contribution by GC is undetectable >500 DSBs per cell, 10% at ∼50 DSBs and 50% when only a few DSBs are present in a cell, as is the case in I-SceI based assays (20).
To investigate whether the above suppression of GC with increasing IR dose simply reflects the dominance of c-NHEJ over other DSB processing pathways, we carried out similar experiments in c-NHEJ deficient cells. Among the different mutants available, we selected LIG4 deficient, as they show the strongest impairment in DSB processing. HCT116 LIG4−/− cells generated on the genetic background of the human colorectal carcinoma cell line HCT116 by targeted disruption of the corresponding gene, have documented deficiency in c-NHEJ (53). We analyzed the IR-dose-dependent RAD51 response of HCT116 LIG4−/− cells as described above and compared the results to those obtained with their wt counterparts. For these experiments, we employed high-content analysis involving the scoring of γ-H2AX and RAD51 foci in ∼10 000 DAPI-stained nuclei per sample (Supplementary Figure S3A–D). Cells were incubated with EdU 30 min prior to IR to label cells in S-phase at exposure. Foci scoring was restricted to EdU− cells in the G2-compartment (determined by DAPI signal analysis), as they represent cells in G2 at the time of IR exposure and during the period of analysis thereafter (see Supplementary Figure S3E and F for representative results and the definition of the gates applied). Supplementary Figure S4A documents the LIG4 deficiency of the mutant with two different antibodies, while Supplementary Figure S4B shows the response of γ-H2AX as a function of IR dose in the linear portion of the dose-response curve and S4C the response of RAD51 foci as a function of IR dose, determined from the corresponding full kinetics (not shown) as illustrated in Figure 2B. From these data, calculation of the RAD51/γ-H2AX ratio, as illustrated in Figure 2E, yields the results shown in Figure 2G. Notably, the response obtained as a function of IR dose can be fitted using similar functions as in Figure 2E, and strikingly the response of HCT116 LIG4−/− cells is indistinguishable from that of the wt HCT116 cells. We conclude that c-NHEJ function is not a pre-requisite for the IR dose dependent suppression of GC.
RAD51 protein availability is not limiting GC at high IR doses
We inquired whether exhaustion of RAD51 underpins the reduced contribution of GC with increasing IR dose, as it has been reported for RPA in the DNA replication checkpoint (54). RAD51 associates with chromatin as it engages in GC. We exposed therefore to IR, A549 cells enriched in G2-phase by centrifugal elutriation and fractionated 6 h later cellular protein in soluble and chromatin-bound fractions. As a control, we also analyzed cells enriched in G1-phase, where GC is inactive (55). Western blot analysis shows a dose-dependent increase of RAD51 in the chromatin fraction that reaches a plateau at 4 Gy (Figure 3A and B)—as did also for RAD51 foci formation (Figure 2D). Yet, despite marked accretion on chromatin with increasing IR dose, RAD51 remains abundant in the soluble fraction. Under the same conditions, G1-cells show a slight suppression, rather than increase, in chromatin bound RAD51 (Figure 3C and D). To quantitatively estimate the fraction of RAD51 protein that binds to chromatin after exposure to IR, we calibrated the western blots using purified protein (Supplementary Figure S5A and B). With the help of this calibration, we can quantitatively estimate that only ∼20% of total RAD51 is chromatin bound at the maximum level of recruitment. We conclude that causes other than limited RAD51 availability underpin the plateaus reached in RAD51 chromatin accretion and in RAD51 foci formation with increasing dose of IR.
Figure 3.
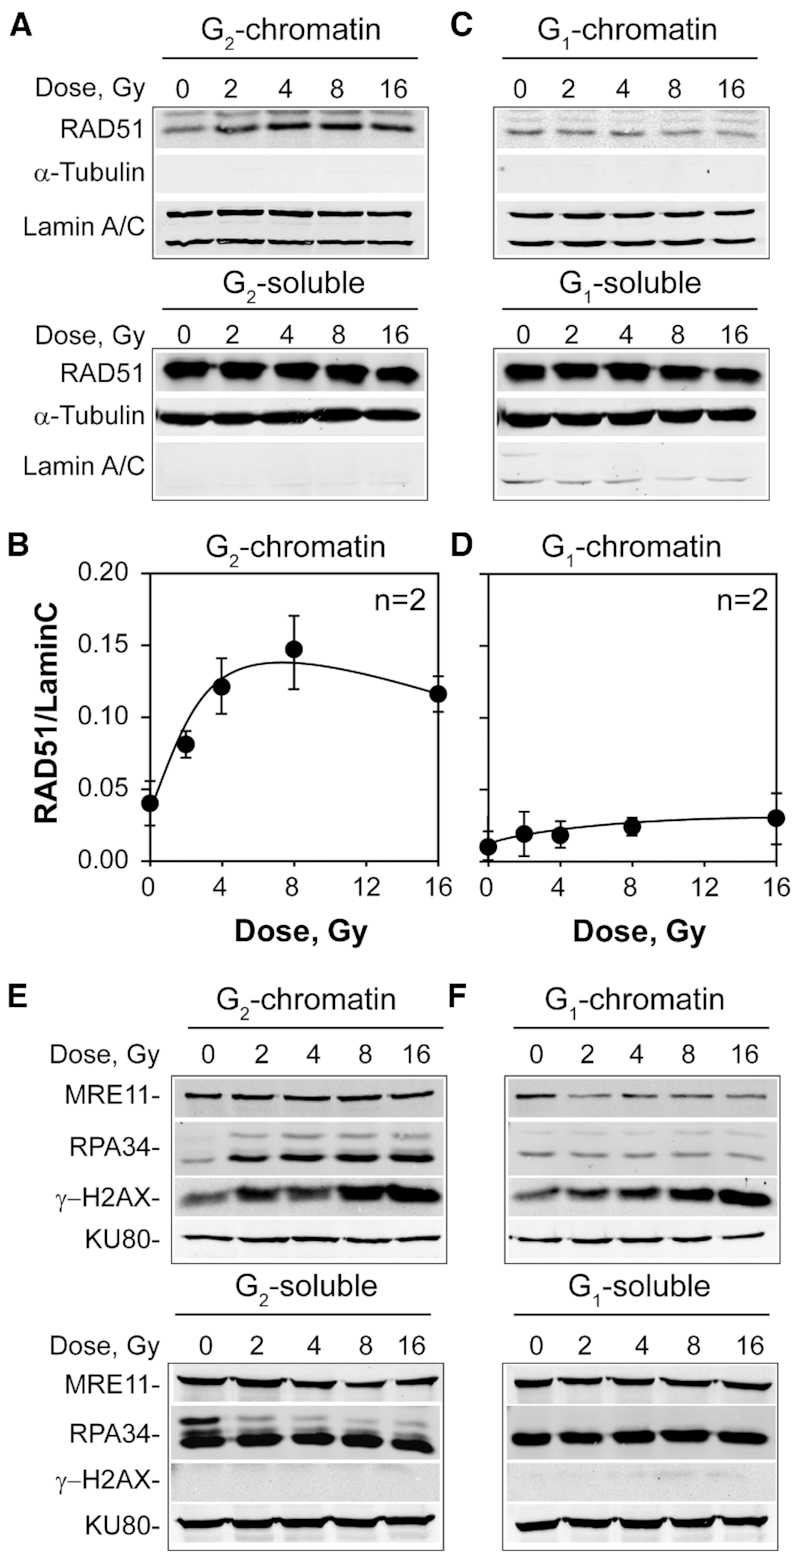
Suppression of GC at high IR doses cannot be attributed to limitations in the RAD51 protein pool. (A) Western blot analysis of RAD51 protein distribution in soluble and chromatin-bound fractions as a function of IR dose in A549 cells enriched in G2-phase by centrifugal elutriation. Lamin A/C and α-Tubulin are diagnostic of chromatin-bound and soluble fractions, respectively and serve also as loading controls. (B) Densitometry analysis of RAD51 band intensity shown in (A). Plotted is the ratio of RAD51 to Lamin signal as a function of IR dose. Data points represent average values and standard deviations from two independent determinations. (C) As in (A) for centrifugal elutriation enriched G1-cells. (D) As in (B) for the results shown in (C). (E) Fractionation analysis as in (A) for MRE11, RPA34, γ-H2AX and KU80 proteins. (F) As in (E) for G1-enriched cells.
We inquired whether other proteins involved in GC, such as RPA and MRE11, show chromatin accretion characteristics similar to RAD51. Figure 3E shows that in G2-cells, RPA accretion to chromatin increases steadily with increasing IR dose with no evidence of a plateau at 4 Gy. We will return to this point later. Interestingly, MRE11 shows no increased accretion to chromatin after exposure to increasing doses of IR. γ-H2AX formation is measured in this experiment as a control and shows the expected monotonous increase with increasing IR dose. The results with G1-irradiated cells contrast those of G2-phase irradiated cells (Figure 3F), as they show no increase in RPA accretion to chromatin and a reduction in chromatin-bound MRE11 with increasing dose, although a normal γ-H2AX response is measured. All these responses are absent when the soluble fraction is examined in G2 and G1–phase of the cell cycle.
To confirm that functional GC is pre-requisite for chromatin accretion of RAD51, we carried out similar experiments with Capan1 cells that are deficient in GC owing to a defect in BRCA2 (56,57). In Capan1 cells, enriched by centrifugal elutriation in G2-phase (Supplementary Figure S5C), accretion of RAD51 to chromatin decreases, rather than increases, with increasing IR dose and the proteins remains practically exclusively in the soluble fraction (Supplementary Figure S5D).
Cells gauge DSB numbers to suppress GC
DSBs induced in cells by IR are accompanied by an overwhelmingly (∼20-fold) larger number of single strand breaks and base damages, the processing of which may interfere with GC. Therefore, we investigated a human cell system allowing the generation of genomic DSBs through the regulated expression of a restriction endonuclease, excluding thus the induction of single strand breaks or base damages. HA-AsiSI-ER-U2OS cells express a fusion protein consisting of a modified estrogen-receptor hormone-binding domain and the AsiSI restriction endonuclease. AsiSI recognizes an eight base-pair sequence (Figure 4A) present multiple (∼800) times in the human genome (58) and can therefore induce multiple DSBs. Normally, AsiSI-ER remains sequestered in the cytoplasm and is innocuous for the genome. However, upon administration of 4-OH-Tamoxifen (4-OHT) the protein rapidly translocates to the nucleus inducing DSBs in a treatment-time dependent manner, as indicated by the gradually increasing formation of γ-H2AX foci (Figure 4B and Supplementary Figure S6A). A fraction of these DSBs is processed by GC as indicated by the treatment-time dependent formation of RAD51 foci (Figure 4B and Supplementary Figure S6B).
Figure 4.

Increased DSB-load suppresses RAD51 foci formation and promotes SSA. (A) HA-AsiSI-ER, U2OS cells express a chimeric form of hemagglutinin (HA)-tagged, AsiSI nuclease fused to estrogen receptor (ER), which upon administration of tamoxifen (4-OHT) is translocated from the cytoplasm to the nucleus, generating DSBs at sites with the indicated 8 bp recognition sequence that is present ∼800 times in the human genome. (B) MIP images of γ-H2AX and RAD51 foci at different times after administration of 4-OHT. (C) Results as in Figure 2D for HA-AsiSI-ER, U2OS cells treated for the indicated periods of time with 4-OHT and exposed to increasing IR doses. Specific analysis in G2-phase was achieved by selecting CycB1+ cells. (D) Effect of IR on the induction of GFP+ cells in the DR-GFP, U2OS cell line reporting GC events 24h after transfection with the I-SceI expression plasmid. Plotted is the normalized number of GFP+ cells after exposure to the indicated doses of IR at the indicated times, before or after transfection. Values obtained with non-irradiated cells were used as basis in the normalization. (E) As in (D) for SA-GFP, U2OS cells reporting SSA events. (F) Effect of RAD51 and RAD52 knockdown on SSA. Normalization is always against the corresponding non-irradiated cells, and in the case of knockdowns against mock transfected cells. (G) As in (F) for DR-GFP, U2OS cells. Data represent means and standard deviations of at least two independent experiments. A detailed statistical analysis of the results shown here is presented in Supplementary Table S1 (Supplementary Table S1).
We inquired how AsiSI-ER-induced DSBs affect the IR-dose dependent formation of RAD51 foci. HA-AsiSI-ER-U2OS cells were incubated with 4-OHT for 2 and 4 h to generate about 10 and 25 RAD51 foci per cell, respectively (Supplementary Figure S6B). These cells were subsequently exposed to different doses of IR and RAD51 foci kinetics measured in CycB1+ cells, as described in Figure 2B, to determine the peak numbers of RAD51 foci reached at each dose. The results in Figure 4C reveal that untreated cells develop a dose response with a shape similar to that of A549 cells and a plateau reached at 4 Gy, albeit at RAD51 foci levels nearly double those of A549 cells. Strikingly, AsiSI-ER-induced DSBs combine with IR induced DSBs in a fully equivalent manner, such that a plateau is always reached at the same total number of RAD51 foci under all conditions examined. We conclude that the mechanism suppressing GC gauges the DSB-load and remains unaffected by single strand breaks or base damages induced in the genome by IR.
GC suppression by IR-induced DSBs is detectable in I-SceI based reporter assays
I-SceI based reporter assays are extensively used to analyze the functionality of DSB processing pathways in vertebrates (41,59). We inquired whether GC, as measured in such reporter cell lines, is also suppressed by the presence of excess IR-induced DSBs. DR-GFP-U2OS cells harbor a copy of the DR-GFP reporter (41) and respond as expected for GC function upon transient transfection with a plasmid expressing I-SceI (Supplementary Figure S7A): GFP-signal at 24 h is practically abolished by RAD51 or CtIP knockdown, remains unaffected by RAD52 knockdown and markedly enhanced in the presence of the DNA-PKcs inhibitor, NU7441 (Supplementary Figure S7A). We measured GC activity in this reporter cell line after exposure to different doses of IR 4 h before, as well as immediately (0 h) or 4 and 12 h after transfection. The results summarized in Figure 4D indicate an over 80% suppression of GC when cells are exposed to high IR doses either 4 h before, or immediately after transfection. This suppression gradually fades when IR is administered at 4 h, and more pronouncedly at 12 h after transfection. This suggests that at 12 h the majority of GC events scored are completed and therefore resistant to IR. We conclude that the mechanism suppressing GC at high DSB-loads operates also on events underpinning signal generation in the GC reporter cell line tested.
SA-GFP-U2OS cells harbor the SA-GFP construct (Supplementary Figure S7B) and report for SSA efficiency (41). The GFP signal generated in these cells 24 h after transfection with an I-SceI expressing plasmid is strongly suppressed by knockdown of RAD52 or CtIP, but increases markedly after RAD51 knockdown, or inhibition of DNA-PKcs (Supplementary Figure S7B). Strikingly, exposure up to 16 Gy IR generates a marked, IR-dose-dependent increase in SSA at 4 and 12 h after transfection, while exposure to 32 Gy strongly suppresses SSA at all times examined (Figure 4E). Knockdown of RAD51 largely eliminates the IR-dose dependent increase in SSA, whereas RAD52 knockdown suppresses as expected SSA nearly completely (Figure 4F).
The interplay uncovered in these experiments between GC and SSA encouraged us to investigate further the response to IR of GC measured using the DR-GFP reporter. Figure 4G shows that while knockdown of RAD51 completely abrogates GC, knockdown of RAD52 eliminates the IR-mediated suppression of GC.
The above striking results indicate a bimodal effect of SSA to increasing DSB-load, with doses lower than 20 Gy enhancing and doses >20 Gy suppressing its function. The results further show a crosstalk between GC and SSA, with inactivation of GC by RAD51 knockdown partly eliminating the DSB-load-dependent activation of SSA and inactivation of SSA by RAD52 knockdown eliminating the dose-dependent suppression of GC. It is unlikely that the observed effects derive from direct hits by IR of the I-SceI site, as it small size makes such direct hit unlikely.
EJ2-GFP-U2OS cells harbor a copy of the EJ2-GFP reporter (41) for alt-EJ, another resection dependent DSB repair pathway (Supplementary Figure S7C). EJ2-GFP-U2OS cells respond as expected upon transient expression of I-SceI (Supplementary Figure S7C): GFP-signal at 24 h is drastically reduced upon CtIP knockdown, is markedly enhanced in the presence of NU7441 and remains unchanged after knockdown of RAD51. We measured alt-EJ activity in this reporter cell line after exposure to different doses of IR, 4 h before and after transfection. The results summarized in Supplementary Figure S7D indicate marked suppression of alt-EJ in irradiated cells that reaches 50% in cells irradiated immediately after transfection. Such suppression of alt-EJ with increasing IR dose has been reported before using alternative methods to quantitate DSB processing (60,61) and is illustrated in Supplementary Figure S1E for KU80 deficient Xrs6 cells analyzed for DSB processing by PFGE at increasing IR doses.
Notably, EJ5-GFP-U2OS cells that report mainly NHEJ (see Supplementary Figure S7E for results validating the assay) reveal that similar radiation exposures have practically no effect on this repair pathway (Supplementary Figure S7F). We conclude that only the activity of resection-dependent DSB repair pathways is tightly regulated by the DSB-load and that this regulation is inhibitory for GC and alt-EJ but promoting for SSA; it apparently involves an intricate crosstalk between SSA and GC.
Increased DSB-load uncouples GC from DNA-end resection
As outlined in the Introduction, inception of resection at a DSB-end is a critical decision point in the shunting of a DSB for processing, instead by c-NHEJ, to resection-dependent pathways—including GC, SSA and alt-EJ (14). Therefore, if about half of the DSBs are processed by GC at low IR doses (Figure 2E), then at least the same proportion should undergo DNA end-resection. To address this point, we analyzed the kinetics of RPA foci formation (RPA70) as a measure of resection activity, in A549 cells exposed to IR in G2-phase. Figure 5A shows that RPA70 foci readily form 1 h after IR in CycB1+, A549 cells. Their formation peaks at 3 h for doses up to 8 Gy, but we note a trend to longer peak times at higher doses (Figure 5B). Plotting of the peak number of RPA70 foci as a function of IR dose, shows a linear but biphasic response (Figure 5C) with a steep and a shallow component that intersect at ∼4 Gy. Figure 5D depicts the ratio between RPA and γ-H2AX foci as a function of IR dose and shows that while at low IR doses ∼40% of the DSBs are resected, resection occurs in only ∼20% of DSBs at high IR doses. The dose dependence of this form of suppression is different from that observed for RAD51 foci. It is evident that with increasing IR dose more DSBs are resected than are processed by GC—a trend that is graphically illustrated in Figure 5E as ratio of RPA70 to RAD51 foci as a function of IR dose.
Figure 5.

GC suppression with increasing IR dose is not mediated by suppression of DNA end resection. (A) MIP images of RPA70 foci formation (green) at tmax in CycB1+, G2-phase A549 cells (red). Other details as in Figure 1A. (B) Kinetics of RPA70 foci formation and decay in CycB1+ cells exposed to 1, 2, 4, 8 and 16 Gy. The dashed red lines indicate the time points at which RPA70 foci reach maximum (tmax). (C) RPA70 foci numbers at tmax as a function of IR dose for CycB1+ cells. The lines represent bi-phasic linear regressions. (D) Ratio of RPA70 to γ-H2AX foci as a function of IR dose in CycB1+ A549 cells. The value of this ratio reflects the proportion of IR-induced DSBs that are resected at each IR dose. (E) Ratio of RAD51 to RPA70 foci as a function of IR dose in CycB1+, G2-phase A549 cells. The value of this ratio reflects the proportion of resected DSBs that are processed by GC at each IR dose. (F) DNA end resection analysis by flow cytometry. Plotted is the normalized RPA70 signal intensity measured in EdU−, G2-phase cells as outlined in Supplementary Figure S8. Normalization is carried out against the signal measured in non-irradiated cells. (G) DNA end resection analysis at specific DSBs (DSB1 and DSB2), generated in HA-AsiSI-ER, U2OS cells, by AsiSI nuclease. Cells are processed for analysis 4h after administration of 4-OHT and irradiation with 2, 4 and 8 Gy. DNA end resection at DSB1 and DSB2 at non-induced condition, as well as resection at genomic location where no AsiSI recognition sequence is present (noDSB), serve as negative control. Results are generated from two independent qPCR runs using DNA templates from one experiment. Data points represent the mean and standard deviations from at least two independent determinations unless indicated otherwise.
To expand the range of doses at which RPA accretion to chromatin can be measured, we introduced a flow cytometry based method allowing the specific analysis of resection in G2-phase cells in a wide range of doses (62,63). The method includes a 30 min pre-labeling of S-phase cells with EdU and analysis at various times after IR of the chromatin associated RPA signal, specifically in EdU negative (EdU−), G2-phase cells (see Supplementary Figure S8A–C for details of the analysis in a wide range of IR doses). Supplementary Figure S8A shows histograms of the robust signal generated in G2-phase cells after exposure to increasing doses of IR and validates the assay in the cell cycle-specific quantification of resection. Figure 5F shows that the increase in RPA70 signal as a function of IR dose is biphasic with each phase fitted by straight lines that intercept at ∼20 Gy. It is interesting that this is the range of doses found to change the response of SSA to IR - from an activating to a suppressing mode. We postulate that the initial steep component reflects a linear increase in resection with increasing IR dose, whereas the shallow component, the recently reported RPA exhaustion at high DNA damage loads (54), and/or the reported reduction of CtIP stability at high IR doses (64). The bending in the dose-response observed at 4 Gy in Figure 5C is not detectable in Figure 5F. We are presently investigating whether this difference reflects mechanistically significant deviations between RPA foci-scoring and RPA integral signal with increasing IR dose, or whether it simply reflects RPA foci scoring limitations at doses >4 Gy. In aggregate, these results reaffirm that not all resected DSBs are committed to GC and that this commitment decreases drastically as the dose of IR increases >2 Gy.
We also explored the effects of IR on resection measured using qPCR approach at two specific DSBs induced in HA-AsiSI-ER-U2OS cells after exposure to 4-OHT (DSB1 and DSB2) as described earlier (43,44). For this purpose HA-AsiSI-ER-U2OS cells were treated with 4-OHT and exposed to 2, 4 or 8 Gy of IR immediately thereafter. Cells were analyzed at different endpoints 4 h later. Supplementary Figure S9A shows the expected phosphorylation of KAP1 at Serine 824 (pKAP-S824) after exposure of these cells to 4-OHT and/or IR documenting the formation of DSBs. Supplementary Figure S9B shows the dose-response of γ-H2AX foci induction after exposure to IR alone, whereas S9C the response of RPA70 foci induction after exposure to IR alone. Notice that the nick at 4 Gy is observed again, as in A549 cells. Also after exposure to high IR doses HA-AsiSI-ER-U2OS cells show by RPA analysis resection patterns similar to those of A549 cells (Supplementary Figure S9D).
Analysis of resection at DSB1 and DSB2 using qPCR to directly quantitate the amount of ssDNA generated, shows that exposures up to 4 Gy suppress resection (Figure 5G), which is in line with the GC suppression noted in Figure 4C. The effect observed is quantitatively different in the two DSBs analyzed, but shows the same qualitative trends. Notably, resection both at DSB1 as well as DSB2 recovers after exposure to 8 Gy pointing to shifts in processing similar to those indicated in Figure 4 favoring SSA. However, it is not possible to directly compare resection results obtained at individual DSBs with those obtained following the global analysis shown in Figure 5A–F, but the results confirm intriguing adaptations in end-processing as a function of DSB load that certainly deserve further investigations.
53BP1 delimits the DSB-load dependent GC engagement
The interplay between 53BP1 and BRCA1 is central for the selection between c-NHEJ and GC in the processing of DSBs, with 53BP1 favoring c-NHEJ and BRCA1, GC (see Introduction). We inquired whether the DSB-load-mediated suppression of GC is regulated by 53BP1 and analyzed the response of a 53BP1 deficient mouse embryonic stem cell line (MES-53BP1−/−) against their wild-type counterparts (MES-53BP1+/+). Supplementary Figure S10A confirms the absence of 53BP1 protein in MES-53BP1−/− cells. The centrifugal elutriation-enriched G2-phase MES cells (Supplementary Figure S10B) show the expected robust increase in the formation of RAD51 foci when 53BP1 is absent (Supplementary Figure S10C).
One of the most salient features of 53BP1 loss is the increase in DNA end resection that allows DSB processing by GC and other resection-dependent pathways. Therefore, we examined resection by RPA signal analysis in MES-53BP1+/+ and MES-53BP1−/− cells. Figures 6A summarizes results obtained by IF analysis of RPA70 foci, while Figure 6B depicts results generated by flow cytometry. Both forms of analysis document the expected robust increase of resection in MES-53BP1−/− cells as compared to their wt counterparts after exposure to 4 or 20 Gy. Notably, detailed kinetic analysis of peak RAD51 foci formation in G2-enriched, MES-53BP1−/− and MES-53BP1+/+ cells at different doses of IR confirms that 53BP1 is a major suppressor of GC (Figure 6C, Supplementary Figure S10D and E). However, even in the absence of 53BP1, a plateau of RAD51 foci formation is reached, albeit at about twice the number of RAD51 foci. We conclude that while 53BP1 clearly delimits GC as a function of DSB-load, additional mechanisms must be in place to generate the shape of the dose response observed.
Figure 6.
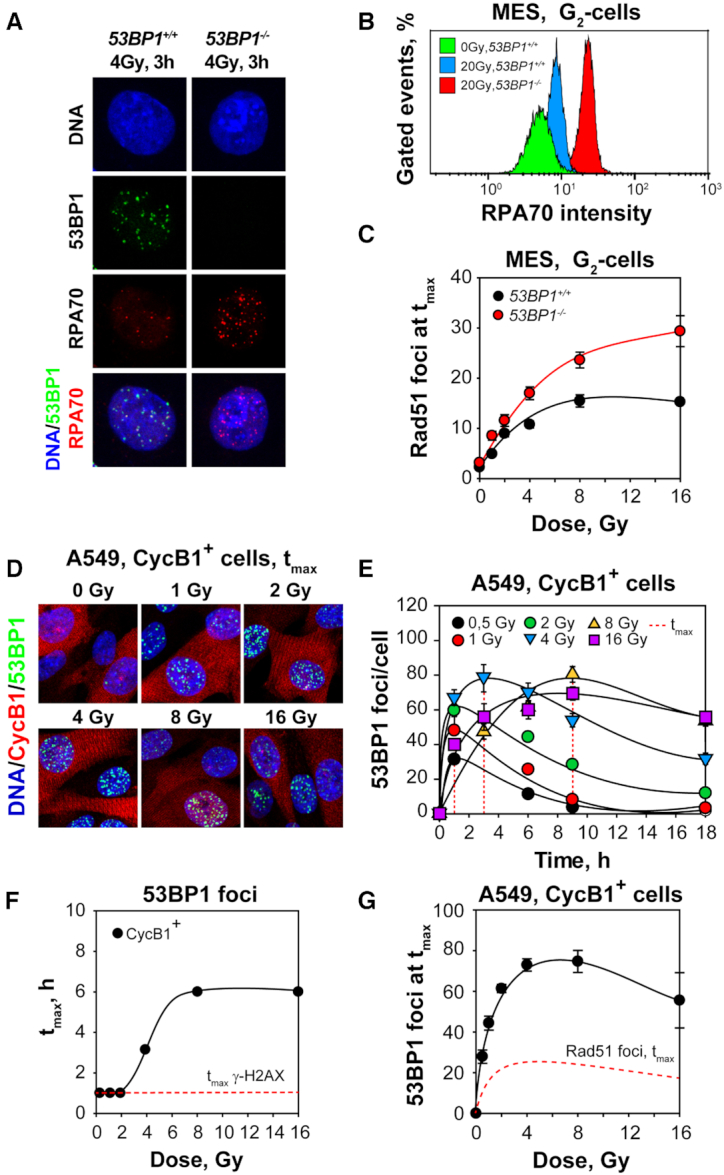
53BP1 delineates the plateau of RAD51 foci at high IR doses. (A) Representative MIP images of 53BP1 and RPA70 foci in G2-phase-enriched populations of 53BP1+/+ and 53BP1−/− MES cells obtained by centrifugal elutriation. (B) Bivariate flow cytometry analysis of RPA70 signal intensity in G2-phase, 53BP1 proficient and deficient MES cells exposed to 20 Gy and analyzed 3 h later. (C) Results as in Figure 2D for 53BP1 proficient and deficient, centrifugal elutriation, G2-enriched MES cells, exposed to increasing IR doses. (D) MIP images of 53BP1 foci scored in CycB1+, A549 cells. (E) Kinetics of formation and decay of 53BP1 foci in cells exposed to 0.5, 1, 2, 4, 8, and 16 Gy. The dashed red lines indicate the time points at which 53BP1 foci reach maximum (tmax). (F) Dependence of tmax on IR dose as shown in (E). The red dashed line traces tmax for γ-H2AX foci formation as determined in Figure 1B. (G) 53BP1 foci at tmax as a function of IR dose for CycB1+ cells. The dashed line traces the results obtained for RAD51 foci formation under similar conditions and shown in Figure 2D. Data points represent mean and standard deviation from three independent experiments.
The above results and a recent publication (40) inspired us to analyze 53BP1 foci formation in G2-phase A549 cells (CycB1+) using the same experimental design as for RAD51 foci analysis. Figure 6D shows robust formation of 53BP1 foci in irradiated CycB1+ cells, while Figure 6E summarizes the kinetics of foci formation and decay at different IR doses. Notably, the kinetics of 53BP1 foci formation are markedly different from those of γ-H2AX (Figure 1). While at IR doses up to 2 Gy, the 53BP1-foci-peak is reached at 1 h (tmax), as for γ-H2AX, at higher doses progressively longer times are required to reach the peak. Although the form of the kinetics makes a precise determination of tmax difficult, Figure 6F shows a clearly increasing trend with increasing IR dose.
Another point of divergence between γ-H2AX and 53BP1 foci is their non-linear induction at doses >2 Gy that is not a consequence of foci saturation (Figure 6G). Indeed, the dose response for the induction of 53BP1 foci at tmax has a shape similar to that of RAD51 foci, with a maximum at 4 Gy followed by a plateau and a decline at higher doses. Yet, the number of 53BP1 foci measured at all doses is higher than that of RAD51 foci by more than a factor of three (Figures 6G). This suggests that a higher proportion of DSBs recruits 53BP1 to chromatin as compared to RAD51. Notably, the ratio between RAD51 and 53BP1 foci remains nearly unchanged as a function of IR dose administered (Supplementary Figure S10F). On the other hand, analysis of the 53BP1/γ-H2AX ratio as function of IR dose shows a strong suppression of 53BP1 foci formation with increasing IR dose, similar to that observed for RAD51, but clearly shifted to higher percentages (Supplementary Figure S10G).
The above general conclusions are confirmed in CRISPR/Cas9 generated 53BP1 knockout mutants in U2OS cells (65). It is evident that also in these cells RAD51 foci formation plateaus at doses >4 Gy and that the level of this plateau increases after deletion of 53BP1 (Supplementary Figure S11). The results in aggregate suggest intriguing mechanistic connections between γ-H2AX, RAD51, RPA and 53BP1.
RAD52 suppresses the DSB-load-dependent GC engagement
Since RAD52 is essential for SSA that was shown to gain ground under conditions suppressing GC (Figure 4) (40), we investigated its contribution to the dose-dependent suppression of GC using the recently developed, specific RAD52 inhibitor, 6-OH-DOPA (RAD52i) (66). IF analysis shows that incubation of cells with RAD52i for 24 h has no effect on background, or IR-induced, γ-H2AX or 53BP1 foci formation (Supplementary Figure S12A and B). Notably, the numbers of RAD51 foci at tmax in CycB1+, G2-A549 cells treated with RAD52i increase significantly indicating that RAD52 suppresses GC (Figures 7A, B, Supplementary Figure S12C and D). The effect is more pronounced at high IR doses, which parallels the activation of SSA shown above using reporter assays (Figure 4E, F).
Figure 7.
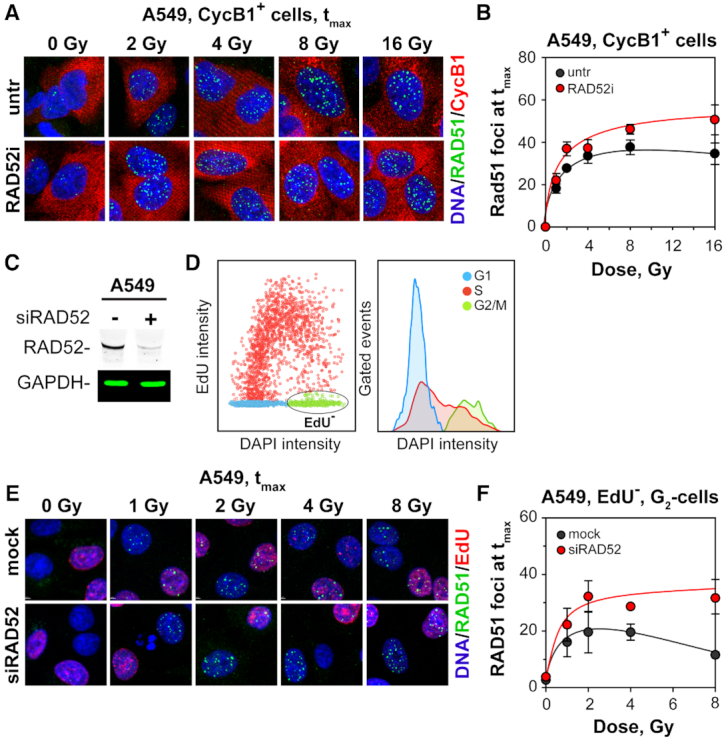
Suppression of SSA partly restores GC at high IR doses. (A) MIP images of RAD51 foci in CycB1+, A549 cells treated or not with 10 μM of RAD52-specific inhibitor, 6-OH-DOPA (RAD52i). (B) RAD51 foci numbers at tmax as a function of IR dose for CycB1+ cells. (C) Western blot analysis showing RAD52 knockdown in A549 cells. (D) Dot and histogram plots showing the gates used to select cells for IF analysis after Rad52 knockdown. EdU− cells in G2-phase are selected for analysis of RAD51 foci formation (ellipse in left panel). (E) MIP images of RAD51 foci formation at tmax in mock transfected and in siRAD52 transfected A549 cells. (F) As in (B) for A549 cells after RAD52 knockdown. Data points represent mean and standard deviation from two independent experiments.
Similar results are also obtained following RAD52 knockdown in A549 cells (Figure 7C), when RAD51 foci are scored by IF in EdU−, G2-phase cells using the gates defined in Figure 7D. It is evident that RAD52 deficiency increases the number of RAD51 foci forming after exposure to increasing IR doses (Supplementary Figure S12E and F) generating the peak in RAD51 foci shown in Figure 7F. The peak numbers of RAD51 foci scored in these experiments in mock-transfected cells are lower than those of the experiments discussed above, an effect we attribute to transfection stress. We conclude that a switch from SSA to GC as suggested here is an integral part of the mechanism regulating DSB processing with increasing DSB-load.
Switch to c-NHEJ of chromosome break repair at high IR doses in GC deficient cells
To demonstrate pathway switch with increasing IR dose in a direct manner, we carried out chromosome break analysis in G2-phase by means of premature chromosome condensation (PCC) in Chinese hamster cells, where characterized GC mutants are available (67). In this set of experiments, aphidicolin was used at a final concentration of 5 μM to prevent irradiated S-phase cells from entering into G2-phase. Exposure of wt, V79 cells to 1 Gy induces chromosome breaks that are effectively repaired within 6 h (Figure 8A). In contrast and as reported earlier (Soni A., Ph.D. Thesis), the XRCC3 deficient irs1 mutant is nearly entirely defective in the processing of chromosome breaks (Figure 8A). Strikingly, when cells are tested at 5 Gy, efficient repair is observed not only in wt, V79 cells but also in the irs1 mutant demonstrating the IR-dose dependent activation of alternative pathways processing chromosome breaks (Figure 8B).
Figure 8.
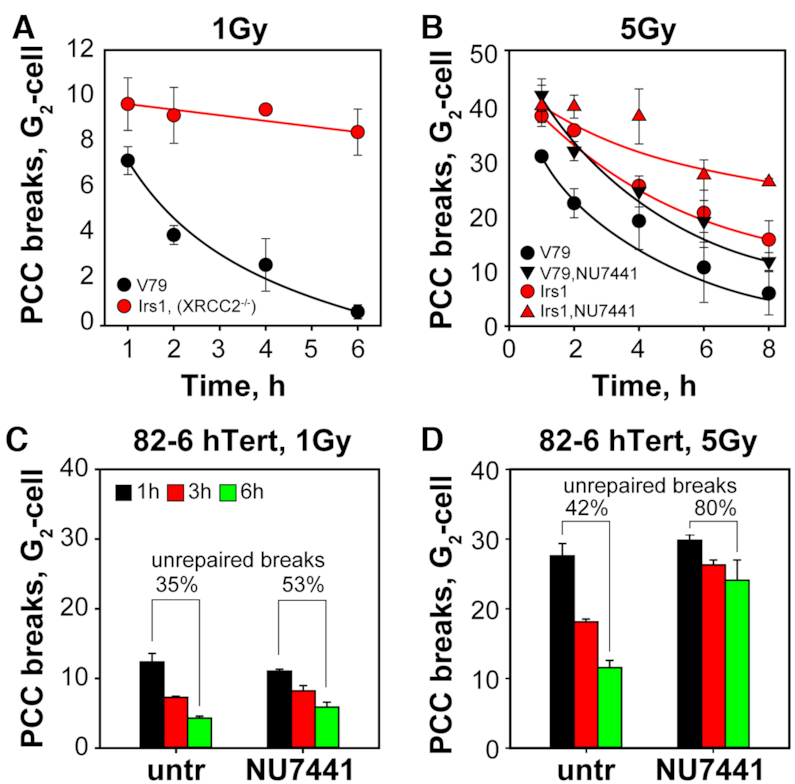
Switch from GC to other pathways with increasing IR dose during processing of chromosome breaks in the G2-phase of the cell cycle. (A) Premature chromosome condensation (PCC) analysis of chromatid break repair in wild-type, V79 and GC deficient irs1 (XRCC2 mutant) Chinese hamster cells. Approximately 50–100 PCCs are analyzed at each time point after exposure to 1 Gy. The methodology used for PCC allows analysis of chromatid break repair specifically in G2-phase. To prevent S-phase cells from entering G2-phase, cells are incubated post irradiation with aphidicolin. This ensures that only cells irradiated in G2-phase are included in the analysis. (B) As in (A) for cells exposed to 5 Gy. In this set the effect of 10 μM NU7441, a specific DNA-PKcs inhibitor, is also analyzed. (C) PCC analysis of chromatid break repair in 82-6 hTert cells exposed to 1 Gy and treated or not with NU7441. Approximately 50–100 metaphases are analyzed at each time point. (D) As in (C) for cells exposed to 5 Gy. Data points represent the mean and standard deviation from three independent experiments.
To analyze the contribution of c-NHEJ in this repair activity, we treated both cell lines with NU7441 to inhibit DNA-PKcs. While in wild-type cells inhibition of DNA-PKcs increased the initial number of chromatid breaks scored without affecting the kinetics of their repair (in line with them being processed by other repair pathways), it generated a marked inhibition in irs1 cells without increasing the initial number of breaks scored. Despite inhibition, however, residual chromatid break repair is observed pointing to contributions from SSA and possibly also alt-EJ.
Finally, inhibition of DNA-PKcs by treatment with NU7441 in 82-6 hTert cells and analysis of G2-PCC-break repair shows that the inhibition is clearly stronger at high (5 Gy) versus low (1 Gy) IR doses (Figure 8C and D), in line with the above shown increased engagement of c-NHEJ with increasing IR dose.
These results in aggregate suggest that the subset of DSBs causing chromatid breaks in G2-phase are exclusively repaired by GC at low IR doses. As a direct consequence, defects in GC fully abrogate chromatid-break processing at low DSB loads; strikingly repair pathways other than GC are unable to contribute and we infer, therefore, that they are actively suppressed. At high DSB loads, on the other hand, this suppression is somehow relieved and processing by c-NHEJ, alt-EJ and SSA becomes possible and directly detectable.
DISCUSSION
The present study addresses a fundamental and largely unresolved question regarding principles, logic and mechanisms underpinning DSB repair pathway selection in vertebrates (68). This apparently simple question has proven particularly difficult to resolve in these organisms for several reasons. First, the number of DSB repair pathways available: GC, SSA, alt-EJ and c-NHEJ is large, generating multiple options for the mechanisms orchestrating pathway selection. Second, their efficiency shows profound fluctuations throughout the cell cycle generating thus different opportunities in the different cell cycle phases. Third, the pathways are unequal in efficiency and ability to restore the genome; and with the exception of GC, they all are inherently error-prone, accepting DNA sequence changes and genome rearrangements. Fourth, in several settings and uniquely in higher eukaryotes, c-NHEJ appears dominant and thus often taken to represent the main component of DSB processing. Fifth, DSBs of different complexity can be induced in the genome generating specific requirements for their processing (1,68). Sixth, when DSBs are induced stochastically by IR, they can occur in regions of chromatin with different degrees of condensation and transcriptional activity, which strongly affects processing.
It becomes evident from the above list that widely divergent requirements need to be taken into consideration in the design of experiments addressing DSB repair pathway selection mechanisms. Since DSB processing fidelity is paramount to genome stability, which organisms always strive for, the first fundamental question to address is the basis of selection between error-free GC and error-prone, but apparently dominant, c-NHEJ. The exclusive use of the sister chromatid makes the G2-phase a requirement for addressing mechanisms of GC engagement and justifies the experimental design of the present study. As a consequence, conclusions drawn and models presented here are restricted to events in this phase of the cell cycle, extending our previous work on cell-cycle-specific regulation of DNA end resection and checkpoint activation (62,63).
As outlined in the Introduction, selection between c-NHEJ and GC in G2-phase is often considered to be stochastic, ultimately determined by the outcome of competition of the respective processing factors for DNA ends (1,14). DSB repair pathway selection on this basis predicts similar relative utilization of GC and c-NHEJ in different settings and leaves no room for regulatory adaptations to optimize outcome based on DSB load. This view leaves unexplained why estimates of GC engagement in DSB processing fluctuate widely depending of the methodology employed: from 50% in I-SceI-based reporter assays (20), to few percent (21–23) or undetectable (24–26) for IR-induced DSBs. The results presented here offer for the first time plausible mechanistic explanations for these divergent estimates.
Pronounced suppression of GC with increasing DSB-load
Perhaps, the most striking result in our study, with direct relevance to DSB repair pathway selection, is the rapid loss of linearity in RAD51 foci formation with increasing IR dose. This response contrasts sharply that of γ-H2AX foci formation, which closely follows the known linear induction of DSBs with IR dose. Furthermore, while cellular responses to DSBs causing γ-H2AX foci formation have IR-dose-independent kinetics, peaking at ∼1 h after exposure to 0.5–20 Gy (Figure 1E), RAD51 foci formation follows kinetics with a strong IR-dose component (Figure 2C). Such time- and dose-dependent foci development makes full kinetics at each IR dose an absolute requirement for the accurate determination of the peak RAD51 foci numbers, and thus of the proportion of DSBs engaged in GC. This requirement may be a reason why functional dependencies of GC on time and dose such as those described here, were with one exception (40) missed in previous studies. This response of RAD51 foci formation and decay implies profound mechanistic adaptations in the engagement of GC with increasing IR dose.
Analysis of GC engagement as a function of IR dose (Figure 2E) uncovers for the first time a dramatic suppression of GC-engagement with increasing IR dose that builds a foundation for explaining the apparent contradictions noted above. Thus, at doses >10 Gy the contribution of GC is predicted to be very low as indeed reported (24–26). At intermediate doses a 10–20% GC engagement is detectable (21–23), and when only very few DSBs are present in the genome, as is the case in I-SceI based reporter systems (20), the GC contribution can approach 50%. The mechanism of GC suppression has two distinct components: one operating at DSB loads <50 DSBs per G2-cell (equivalent to 25 DSBs per G1-cell), and a second component operating at loads >50 DSBs per G2-cell. The mechanisms of this bimodal suppression of GC with increasing IR dose are expected to form a central pillar of the DNA damage response and remain to be elucidated.
A suppression of GC with increasing load of DSBs in the genome is also observed when mixing different types of DSBs, as demonstrated with HA-AsiSI-ER U2OS cells. Furthermore, the mechanisms of GC suppression are not dependent on lesions other than DSBs, which are induced in excess after exposure to IR. Suppression of GC with increasing DSB load is also detectable in functional reporter assays and demonstrated by exposing cells to IR shortly before or after transfection with I-SceI expressing plasmid (Figure 4E). We conclude that increased DSB loads suppress the overall function of GC.
The large contribution of GC to DSB processing at low DSB loads has important ramifications for DSB repair pathway choice. It shows that the only error-free DSB repair pathway available for the cell is contributing substantially to the maintenance of the genome in G2-phase cells. This demonstrates that in vertebrate cells, mechanisms have evolved that follow the logic of engaging error-free repair pathways to the maximum possible. It also shows that at exposure levels likely to occur naturally (less than 0.1 Gy and mostly as low dose-rate exposures), GC will be used to its full potential. In line with this rationale a well-known radiation phenomenon, the adaptive response, whereby pre-exposure of cells to a low ‘conditioning’ dose makes them resistant to a subsequent higher challenging IR dose, relies on the activation of GC (69,70).
Why about half of IR-induced DSBs may never be processed by GC and rely instead on c-NHEJ (or other processing options) remains to be elucidated. Vice-versa, it also remains unknown what cues make GC an option for only about half of IR induced DSBs.
But why is GC suppressed with increasing DSB load? Suppression may indeed be a mechanism ensuring the preservation of the genome and its function, when facing large numbers of DSBs, from acutely destabilizing enzymatic steps of GC, such as DNA end resection or DNA strand invasion. It is, however, also possible that cells have a limited capacity for GC repair factories (71–73) and that this limitation is reflected by the plateau reached in the dose-response curves for RAD51 foci formation. Increased utilization of GC at low DSB loads may also benefit from active suppression of c-NHEJ by c-NHEJ-suppressors, such as CYREN (74), or from a reprogramming of c-NHEJ that allows it to function as a facilitator of GC.
The dose-dependent regulation of GC in G2-phase has parallels with the regulation of checkpoint and resection (62). We recently reported that at the low IR-doses where GC dominates, ATM and ATR regulate epistatically the G2-checkpoint, with ATR at the output-node, interfacing with the cell cycle predominantly through CHK1. Notably, at low IR-doses, ATM and ATR epistatically regulate also resection. At high IR-doses, on the other hand, the tight ATM/ATR coupling relaxes and independent outputs to G2-checkpoint and resection occur. We hypothesize that these regulatory adaptations with IR dose of ATM/ATR function feed into the dose-dependent suppression of GC response described here and investigate therefore currently possible interconnections. But what mechanisms underpin the dose dependent suppression of GC?
GC is not suppressed by limited RAD51 availability
Protein levels can be determinants of the overall response of cells to stress, as indicated by the accelerated fork breakage observed after partial reduction of RPA levels and the fork protection observed under conditions of elevated RPA levels in ATR deficient cells (54). The results in Figure 3 demonstrate that only ∼20% of available RAD51 is functionally engaged at the maximum of RAD51 foci reached at ∼4 Gy. We conclude therefore that RAD51 exhaustion is an unlikely source for the observed suppression of GC.
Suppression of GC is not coupled to suppression of DNA-end resection
Inception of resection is a key step in DSB repair pathway selection (14). It was therefore important to examine how resection is modulated with increasing IR dose and to compare this response to that observed for GC. As resection increases with IR-dose up to 20 Gy (Figure 5F), a direct coupling to GC suppression with increasing IR dose is unlikely. Notably, while at low IR doses all DSBs that undergo resection are processed by GC, this proportion drops to <20% at doses >10 Gy (Figure 5E). When focusing on resection overall, the percentage of DSBs that undergoes resection decreases from ∼40% at low doses to 20% at 16 Gy. Suppression of GC in the absence of commensurate suppression of resection will initiate the engagement of other resection dependent DSB processing pathways, such as SSA and alt-EJ (75). However, it is relevant to mention that resection-dependent c-NHEJ has been demonstrated in G1-cells (76,77) and may also occur in G2-phase cells contributing thus to the overall processing measured here. How suppression of GC affects SSA and alt-EJ is discussed next.
Crosstalk between GC and SSA in the dose-dependent suppression of GC
I-SceI-based reporter assays show that GC is functionally suppressed with increasing DSB load (Figure 4D) and, equally importantly, that SSA is under these conditions substantially activated (Figure 4E). Thus, resected DSBs that cannot be processed by GC are likely to be shunted to SSA. Preferential shunting of resected DSBs to SSA, rather than alt-EJ, is supported by the observation that alt-EJ is markedly suppressed with increasing DSB load (Supplementary Figure S5D) (60,61).
A close interplay between GC and SSA is also suggested by the loss of SSA-dependence on DSB load following depletion of RAD51—at least in the tested reporter assay (Figure 4F). Also the observation that GC is enhanced rather than suppressed with increasing DSB load after depletion of RAD52 (Figure 4G) is in line with such crosstalk. Not surprisingly, therefore, depletion or inhibition of RAD52 (Figure 7) enhances GC engagement, defining thus RAD52 as a factor delimiting the field of GC operation.
RAD52, despite its prominent place in homology directed repair of DSBs in the yeast (78), has received only limited attention in vertebrates owing to the initial observation that its deletion was without phenotype in the mouse. Later work also demonstrated that several of the known mediator functions of RAD52 in the yeast are preferably carried out by BRCA1/BRCA2 in vertebrates (75,79). Recent work, however, has brought RAD52 in the forefront, not only as a backup mediator in cells with deficiencies in BRCA1/BRCA2, but also as a main player in several novel homology directed pathways of DSB processing (75,79). Our observations add to the functional importance of this protein in DSB repair pathway balance with increasing DSB load and emphasize the relevance of its mediator and annealing functions.
It may be relevant to point out, however, that at loads of DSBs generated by IR doses higher than 16 Gy, where the steady increase of resection with dose also ends (Figure 5F), SSA begins to be suppressed as well (Figure 4E). This suggests that DSB repair pathways are wired in a way allowing the suppression with increasing IR-dose of all resection-dependent processing, leaving c-NHEJ to reign—as indeed suggested by the results summarized in Supplementary Figure S1.
53BP1 delimits the dose dependent suppression of GC
53BP1 is a protein implicated in DSB-repair decisions (27). We found that in the absence of 53BP1 the engagement of GC increases markedly (Figure 6C). However, similar to RAD52, 53BP1 delimits but does not eliminate GC suppression with increasing IR dose—which still occurs but at a higher dose. We conclude that additional inputs, possibly from flanking chromatin, contribute to the regulation of the dose-dependent GC suppression.
The results of 53BP1 foci formation and decay at different IR doses uncover, however, additional interesting functional aspects of the protein that show similarities with those of RAD51. Thus, the kinetics of 53BP1 foci show dose-dependent times for maximum development (Figure 6F) and a plateau for this maximum at doses >4 Gy. Notably, while the proportion of RAD51 to 53BP1 foci remains relatively constant at ∼30% as a function of IR dose (Supplementary Figure S10F), the ratio of 53BP1 to γ-H2AX foci is about 1 only for doses up to 2 Gy, dropping precipitously at higher doses to values approaching 10% (Supplementary Figure S10G). This response is in line with a previous report demonstrating that the RNF168–53BP1 pathway operates in a narrow dynamic range generated by the rapid turnover of RNF168 that allows the efficient assembly of 53BP1 at only ∼20–40 DSBs (38,39). The authors proposed therefore that this pathway restrains without abolishing DSB resection to favor error-free RAD51-mediated GC over mutagenic RAD52-driven SSA (40). The results obtained here are in line with this model, but demonstrate a continuously increasing uncoupling of GC from resection at doses above 4 Gy.
Shifting but flexible contributions of different DSB repair pathways with increasing DSB load
In summary, the results presented define DSB load as a key parameter setting priorities for DSB repair pathway choice in vertebrates. Low DSB loads are divided almost equally between c-NHEJ and GC. In fact, GC is exclusively responsible for the subset of DSBs causing chromatid breakage. This maximal contribution of GC also defines the fraction of DSBs that will be resected in the low dose region. Although resection is also suppressed with increasing DSB load, its suppression is much less pronounced than that of GC. As a consequence many more DSBs are resected in the intermediate range of doses that must be processed by alt-EJ or SSA. Strikingly, alt-EJ and SSA are also suppressed at IR doses above 20 Gy allowing c-NHEJ to dominate DSB processing.
The transition between repair pathways is smooth without gaps in processing and flexible enough to allow one pathway to compensate defects of, or failed attempts from, another pathway. Strikingly, however, this flexibility appears restricted to intermediate doses, as c-NHEJ strongly dominates at extremely high doses and there is no option for alternative processing of chromatid breaks at low doses in GC deficient cells (Figure 8). The dose-dependent suppression of GC builds on crosstalk between GC and SSA and interruption of this crosstalk abrogates this dose dependence.
Overall, we uncovered a highly sophisticated mechanism of DSB processing involving continuous shifts between pathways with an astonishing capacity for increasing DSB loads. We propose that DSB load should be added to DSB complexity and chromatin environment as an essential determinant of repair pathway selection. The decision points for pathway engagement and the molecular determinants of the underlying switches that cause the observed shifts will be a focus of future research.
Supplementary Material
ACKNOWLEDGEMENTS
The authors are indebted to Drs J. Chen, D. Durocher, E. Hendrickson, G. Legube, M. Löbrich and J. Stark for cells and reagents.
Notes
Present address: Christian Staudt, Karlsruhe Institute of Technology (KIT), Hermann-von-Helmholtz Platz 1, 76344 Eggenstein-Leopoldshafen, Germany. Email: christian.staudt2@kit.edu
SUPPLEMENTARY DATA
Supplementary Data are available at NAR Online.
FUNDING
Bundesministerium für Bildung und Forschung, BMBF (Federal Ministry of Education and Research) [02S8254, 02S8467, 03NUK005C, 02NUK043B]; Deutsche Forschungsgemeinschaft, DFG [GRK1739, IL51-11-1]. Funding for open access charge: BMBF.
Conflict of interest statement. None declared.
REFERENCES
- 1. Schipler A., Iliakis G.. DNA double-strand-break complexity levels and their possible contributions to the probability for error-prone processing and repair pathway choice. Nucleic Acids Res. 2013; 41:7589–7605. [DOI] [PMC free article] [PubMed] [Google Scholar]
- 2. Jackson S.P., Bartek J.. The DNA-damage response in human biology and disease. Nature. 2009; 461:1071–1078. [DOI] [PMC free article] [PubMed] [Google Scholar]
- 3. Bunting S.F., Nussenzweig A.. End-joining, translocations and cancer. Nat. Rev. Cancer. 2013; 13:443–454. [DOI] [PMC free article] [PubMed] [Google Scholar]
- 4. Hustedt N., Durocher D.. The control of DNA repair by the cell cycle. Nat. Cell Biol. 2017; 19:1–9. [DOI] [PubMed] [Google Scholar]
- 5. Rehani M.M., Vano E.. Medical radiation protection in next decade. Radiat. Prot. Dosim. 2011; 147:52–53. [DOI] [PubMed] [Google Scholar]
- 6. Pilié P.G., Tang C., Mills G.B., Yap T.A.. State-of-the-art strategies for targeting the DNA damage response in cancer. Nat. Rev. Clin. Oncol. 2019; 16:81–104. [DOI] [PMC free article] [PubMed] [Google Scholar]
- 7. Goldstein M., Kastan M.B.. The DNA Damage response: Implications for tumor responses to radiation and chemotherapy. Annu. Rev. Med. 2015; 66:129–143. [DOI] [PubMed] [Google Scholar]
- 8. O’Connor M.J. Targeting the DNA damage response in cancer. Mol. Cell. 2015; 60:547–560. [DOI] [PubMed] [Google Scholar]
- 9. Haber J. Genome Satbilty. 2014; Garland Science, Taylor & Francis Group, LLC. [Google Scholar]
- 10. Mladenov E., Magin S., Soni A., Iliakis G.. DNA double-strand-break repair in higher eukaryotes and its role in genomic instability and cancer: cell cycle and proliferation-dependent regulation. Semin. Cancer Biol. 2016; 37-38:51–64. [DOI] [PubMed] [Google Scholar]
- 11. Mladenov E., Magin S., Soni A., Iliakis G.. DNA double-strand break repair as determinant of cellular radiosensitivity to killing and target in radiation therapy. Front. Oncol. 2013; 3:113. [DOI] [PMC free article] [PubMed] [Google Scholar]
- 12. Reid D.A., Keegan S., Leo-Macias A., Watanabe G., Strande N.T., Chang H.H., Oksuz B.A., Fenyo D., Lieber M.R., Ramsden D.A. et al.. Organization and dynamics of the nonhomologous end-joining machinery during DNA double-strand break repair. PNAS. 2015; 112:E2575–E2584. [DOI] [PMC free article] [PubMed] [Google Scholar]
- 13. Lieber M.R. The mechanism of Double-Strand DNA Break repair by the nonhomologous DNA End-Joining pathway. Annu. Rev. Biochem. 2010; 79:1.1–1.31. [DOI] [PMC free article] [PubMed] [Google Scholar]
- 14. Ceccaldi R., Rondinelli B., D’Andrea A.D.. Repair pathway choices and consequences at the Double-Strand break. Trends Cell Biol. 2016; 26:52–64. [DOI] [PMC free article] [PubMed] [Google Scholar]
- 15. Symington L.S. End resection at double-strand Breaks: mechanism and regulation. Cold Spring Harb. Perspect. Biol. 2014; 6:a016436. [DOI] [PMC free article] [PubMed] [Google Scholar]
- 16. Mehta A., Haber J.E.. Sources of DNA double-strand breaks and models of recombinational DNA repair. Cold Spring Harb. Perspect. Biol. 2014; 6:a016428. [DOI] [PMC free article] [PubMed] [Google Scholar]
- 17. Prakash R., Zhang Y., Feng W., Jasin M.. Homologous recombination and human health: The roles of BRCA1, BRCA2, and associated proteins. Cold Spring Harb. Perspect. Biol. 2015; 7:a016600. [DOI] [PMC free article] [PubMed] [Google Scholar]
- 18. Zhao W., Vaithiyalingam S., San Filippo J., Maranon D.G., Jimenez-Sainz J., Fontenay G.V., Kwon Y., Leung S.G., Lu L., Jensen R.B. et al.. Promotion of BRCA2-dependent homologous recombination by DSS1 via RPA targeting and DNA mimicry. Mol. Cell. 2015; 59:176–187. [DOI] [PMC free article] [PubMed] [Google Scholar]
- 19. Shrivastav M., Miller C.A., De Haro L.P., Durant S.T., Chen B.P.C., Chen D.J., Nickoloff J.A.. DNA-PKcs and ATM co-regulate DNA double-strand break repair. DNA Repair (Amst.). 2009; 8:920–929. [DOI] [PMC free article] [PubMed] [Google Scholar]
- 20. Richardson C., Jasin M.. Coupled homologous and nonhomologous repair of a double-strand break preserves genomic integrity in mammalian cells. Mol. Cell Biol. 2000; 20:9068–9075. [DOI] [PMC free article] [PubMed] [Google Scholar]
- 21. Shibata A., Conrad S., Birraux J., Geuting V., Barton O., Ismail A., Kakarougkas A., Meek K., Taucher-Scholz G., Lobrich M. et al.. Factors determining DNA double-strand break repair pathway choice in G2 phase. EMBO J. 2011; 30:1079–1092. [DOI] [PMC free article] [PubMed] [Google Scholar]
- 22. Jeggo P.A., Geuting V., Löbrich M.. The role of homologous recombination in radiation-induced double-strand break repair. Radiother. Oncol. 2011; 101:7–12. [DOI] [PubMed] [Google Scholar]
- 23. Beucher A., Birraux J., Tchouandong L., Barton O., Shibata A., Conrad S., Goodarzi A.A., Krempler A., Jeggo P.A., Lobrich M.. ATM and Artemis promote homologous recombination of radiation-induced DNA double-strand breaks in G2. EMBO J. 2009; 28:3413–3427. [DOI] [PMC free article] [PubMed] [Google Scholar]
- 24. Wang H., Zeng Z.-C., Bui T.-A., DiBiase S.J., Qin W., Xia F., Powell S.N., Iliakis G.. Nonhomologous end-joining of ionizing radiation-induced DNA double stranded breaks in human tumor cells deficient in BRCA1 or BRCA2. Cancer Res. 2001; 61:270–277. [PubMed] [Google Scholar]
- 25. Wu W., Wang M., Mussfeldt T., Iliakis G.. Enhanced use of backup pathways of NHEJ in G2 in Chinese hamster mutant cells with defects in the classical pathway of NHEJ. Radiat. Res. 2008; 170:512–520. [DOI] [PubMed] [Google Scholar]
- 26. Wu W., Wang M., Wu W., Singh S.K., Mussfeldt T., Iliakis G.. Repair of radiation induced DNA double strand breaks by backup NHEJ is enhanced in G2. DNA Repair (Amst.). 2008; 7:329–338. [DOI] [PubMed] [Google Scholar]
- 27. Chapman J.R., Taylor M.R.G., Boulton S.J.. Playing the end game: DNA double-strand break repair pathway choice. Mol. Cell. 2012; 47:497–510. [DOI] [PubMed] [Google Scholar]
- 28. Boersma V., Moatti N., Segura-Bayona S., Peuscher M.H., van der Torre J., Wevers B.A., Orthwein A., Durocher D., Jacobs J.J.L.. MAD2L2 controls DNA repair at telomeres and DNA breaks by inhibiting 5′ end resection. Nature. 2015; 521:537–540. [DOI] [PMC free article] [PubMed] [Google Scholar]
- 29. Bunting S.F., Callen E., Wong N., Chen H.T., Polato F., Gunn A., Bothmer A., Feldhahn N., Fernandez-Capetillo O., Cao L. et al.. 53BP1 inhibits homologous recombination in Brca1-deficient cells by blocking resection of DNA breaks. Cell. 2010; 141:243–254. [DOI] [PMC free article] [PubMed] [Google Scholar]
- 30. Callen E., Di Virgilio M., Kruhlak M.J., Nieto-Soler M., Wong N., Chen H.-T., Faryabi R.B., Polato F., Santos M., Starnes L.M. et al.. 53BP1 mediates productive and mutagenic DNA repair through distinct phosphoprotein interactions. Cell. 2013; 153:1266–1280. [DOI] [PMC free article] [PubMed] [Google Scholar]
- 31. Chapman J.R., Barral P., Vannier J.-B., Borel V., Steger M., Tomas-Loba A., Sartori A.A., Adams I.R., Batista F.D., Boulton S.J.. RIF1 is essential for 53BP1-dependent nonhomologous end joining and suppression of DNA double-strand break resection. Mol. Cell. 2013; 49:858–871. [DOI] [PMC free article] [PubMed] [Google Scholar]
- 32. Escribano-Diaz C., Orthwein A., Fradet-Turcotte A., Xing M., Young J.T., Tkac J., Cook M.A., Rosebrock A.P., Munro M., Canny M.D. et al.. A cell cycle-dependent regulatory circuit composed of 53BP1-RIF1 and BRCA1-CtIP controls DNA repair pathway choice. Mol. Cell. 2013; 49:872–883. [DOI] [PubMed] [Google Scholar]
- 33. Feng L., Fong K.-W., Wang J., Wang W., Chen J.. RIF1 counteracts BRCA1-mediated end resection during DNA repair. J. Biol. Chem. 2013; 288:11135–11143. [DOI] [PMC free article] [PubMed] [Google Scholar]
- 34. Wang J., Aroumougame A., Lobrich M., Li Y., Chen D., Chen J., Gong Z.. PTIP associates with Artemis to dictate DNA repair pathway choice. Genes Dev. 2014; 28:2693–2698. [DOI] [PMC free article] [PubMed] [Google Scholar]
- 35. Xu G., Chapman J.R., Brandsma I., Yuan J., Mistrik M., Bouwman P., Bartkova J., Gogola E., Warmerdam D., Barazas M. et al.. REV7 counteracts DNA double-strand break resection and affects PARP inhibition. Nature. 2015; 521:541–544. [DOI] [PMC free article] [PubMed] [Google Scholar]
- 36. Zimmermann M., Lottersberger F., Buonomo S.B., Sfeir A., de Lange T.. 53BP1 regulates DSB repair using Rif1 to control 5′ end resection. Science. 2013; 339:700–704. [DOI] [PMC free article] [PubMed] [Google Scholar]
- 37. Zimmermann M., de Lange T.. 53BP1: pro choice in DNA repair. Trends Cell Biol. 2014; 24:108–117. [DOI] [PMC free article] [PubMed] [Google Scholar]
- 38. Altmeyer M., Lukas J.. To spread or not to spread—chromatin modifications in response to DNA damage. Curr. Opin. Genet. Dev. 2013; 23:156–165. [DOI] [PubMed] [Google Scholar]
- 39. Gudjonsson T., Altmeyer M., Savic V., Toledo L., Dinant C., Grøfte M., Bartkova J., Poulsen M., Oka Y., Bekker-Jensen S. et al.. TRIP12 and UBR5 suppress spreading of chromatin ubiquitylation at damaged chromosomes. Cell. 2012; 150:697–709. [DOI] [PubMed] [Google Scholar]
- 40. Ochs F., Somyajit K., Altmeyer M., Rask M.-B., Lukas J., Lukas C.. 53BP1 fosters fidelity of homology-directed DNA repair. Nat. Struct. Mol. Biol. 2016; 23:714–721. [DOI] [PubMed] [Google Scholar]
- 41. Gunn A., Stark J.M.. I-SceI-based assays to examine distinct repair outcomes of mammalian chromosomal double strand breaks. Methods Mol. Biol. 2012; 920:379–391. [DOI] [PubMed] [Google Scholar]
- 42. Kenny M.K., Schlegel U., Furneaux H., Hurwitz J.. The role of human single-stranded DNA binding protein and its individual subunits in simian virus 40 DNA replication. J. Biol. Chem. 1990; 265:7693–7700. [PubMed] [Google Scholar]
- 43. Zhou Y., Caron P., Legube G., Paull T.T.. Quantitation of DNA double-strand break resection intermediates in human cells. Nucleic Acids Res. 2014; 42:e19. [DOI] [PMC free article] [PubMed] [Google Scholar]
- 44. Zhou Y., Paull T.T.. Direct measurement of single-stranded DNA intermediates in mammalian cells by quantitative polymerase chain reaction. Anal. Biochem. 2015; 479:48–50. [DOI] [PubMed] [Google Scholar]
- 45. Laemmli U.K. Cleavage of structural proteins during the assembly of the head of bacteriophage T4. Nature. 1970; 227:680–685. [DOI] [PubMed] [Google Scholar]
- 46. Bennardo N., Cheng A., Huang N., Stark J.M.. Alternative-NHEJ Is a mechanistically distinct pathway of mammalian chromosome break repair. PLoS Genet. 2008; 4:e1000110. [DOI] [PMC free article] [PubMed] [Google Scholar]
- 47. Wang H., Zeng Z.-C., Bui T.-A., Sonoda E., Takata M., Takeda S., Iliakis G.. Efficient rejoining of radiation-induced DNA double-strand breaks in vertebrate cells deficient in genes of the RAD52 epistasis group. Oncogene. 2001; 20:2212–2224. [DOI] [PubMed] [Google Scholar]
- 48. Buerstedde J.-M., Takeda S.. Increased ratio of targeted to random integration after transfection of chicken B cell lines. Cell. 1991; 67:179–188. [DOI] [PubMed] [Google Scholar]
- 49. Roberts S.A., Spreadborough A.R., Bulman B., Barber J.B.P., Evans D.G.R., Scott D.. Heritability of cellular radiosensitivity: a marker of low-penetrance predisposition genes in breast cancer. Am. J. Hum. Genet. 1999; 65:784–794. [DOI] [PMC free article] [PubMed] [Google Scholar]
- 50. Iliakis G.E., Cicilioni O., Metzger L.. Measurement of DNA double strand breaks in CHO cells at various stages of the cell cycle using pulsed field gel electrophoresis: Calibrations by means of 125I decay. Int. J. Radiat. Biol. 1991; 59:343–357. [DOI] [PubMed] [Google Scholar]
- 51. Haaf T., Golub E.I., Reggy G., Radding C.M., Ward D.C.. Nuclear foci of mammalian Rad51 recombination protein in somatic cells after DNA damage and its localization in synaptonemal complexes. PNAS. 1995; 92:2298–2302. [DOI] [PMC free article] [PubMed] [Google Scholar]
- 52. West S.C. Molecular views of recombination proteins and their control. Nat. Rev. Mol. Cell Biol. 2003; 4:435–445. [DOI] [PubMed] [Google Scholar]
- 53. Oh S., Wang Y., Zimbric J., Hendrickson E.A.. Human LIGIV is synthetically lethal with the loss of Rad54B-dependent recombination and is required for certain chromosome fusion events induced by telomere dysfunction. Nucleic Acids Res. 2013; 41:1734–1749. [DOI] [PMC free article] [PubMed] [Google Scholar]
- 54. Toledo L.I., Altmeyer M., Rask M.-B., Lukas C., Larsen D.H., Povlsen Lou K., Bekker-Jensen S., Mailand N., Bartek J., Lukas J.. ATR prohibits replication catastrophe by preventing global exhaustion of RPA. Cell. 2013; 155:1088–1103. [DOI] [PubMed] [Google Scholar]
- 55. Chung D.K.C., Chan J.N.Y., Strecker J., Zhang W., Ebrahimi-Ardebili S., Lu T., Abraham K.J., Durocher D., Mekhail K.. Perinuclear tethers license telomeric DSBs for a broad kinesin- and NPC-dependent DNA repair process. Nat. Commun. 2015; 6:7742. [DOI] [PubMed] [Google Scholar]
- 56. Barber L.J., Rosa Rosa J.M., Kozarewa I., Fenwick K., Assiotis I., Mitsopoulos C., Sims D., Hakas J., Zvelebil M., Lord C.J. et al.. Comprehensive genomic analysis of a BRCA2 deficient human pancreatic cancer. PLoS One. 2011; 6:e21639. [DOI] [PMC free article] [PubMed] [Google Scholar]
- 57. Su L.K., Wang S.C., Qi Y., Luo W., Hung M.C., Lin S.H.. Characterization of BRCA2: temperature sensitivity of detection and cell-cycle regulated expression. Oncogene. 1998; 17:2377–2381. [DOI] [PubMed] [Google Scholar]
- 58. Iacovoni J.S., Caron P., Lassadi I., Nicolas E., Massip L., Trouche D., Legube G.. High-resolution profiling of gammaH2AX around DNA double strand breaks in the mammalian genome. EMBO J. 2010; 29:1446–1457. [DOI] [PMC free article] [PubMed] [Google Scholar]
- 59. Mladenova V., Mladenov E., Iliakis G.. Novel biological approaches for testing the contributions of single DSBs and DSB Clusters to the biological effects of high LET Radiation. Front. Oncol. 2016; 6:163. [DOI] [PMC free article] [PubMed] [Google Scholar]
- 60. Iliakis G., Mehta R., Jackson M.. Level of DNA double-strand break rejoining in Chinese hamster xrs-5 cells is dose-dependent: implications for the mechanism of radiosensitivity. Int. J. Radiat. Biol. 1992; 61:315–321. [DOI] [PubMed] [Google Scholar]
- 61. Chang C., Biedermann K.A., Mezzina M., Brown J.M.. Characterization of the DNA double strand break repair defect in scid mice. Cancer Res. 1993; 53:1244–1248. [PubMed] [Google Scholar]
- 62. Mladenov E., Fan X., Dueva R., Soni A., Iliakis G.. Radiation-dose-dependent functional synergisms between ATM, ATR and DNA-PKcs in checkpoint control and resection in G2-phase. Sci. Rep. 2019; 9:8255. [DOI] [PMC free article] [PubMed] [Google Scholar]
- 63. Mladenov E., Fan X., Paul-Konietzko K., Soni A., Iliakis G.. DNA-PKcs and ATM epistatically suppress DNA end resection and hyperactivation of ATR-dependent G2-checkpoint in S-phase irradiated cells. Sci. Rep. 2019; 9:14597. [DOI] [PMC free article] [PubMed] [Google Scholar]
- 64. Ferretti L.P., Himmels S.F., Trenner A., Walker C., von Aesch C., Eggenschwiler A., Murina O., Enchev R.I., Peter M., Freire R. et al.. Cullin3-KLHL15 ubiquitin ligase mediates CtIP protein turnover to fine-tune DNA-end resection. Nat. Commun. 2016; 7:12628. [DOI] [PMC free article] [PubMed] [Google Scholar]
- 65. Orthwein A., Noordermeer S.M., Wilson M.D., Landry S., Enchev R.I., Sherker A., Munro M., Pinder J., Salsman J., Dellaire G. et al.. A mechanism for the suppression of homologous recombination in G1 cells. Nature. 2015; 528:422–426. [DOI] [PMC free article] [PubMed] [Google Scholar]
- 66. Chandramouly G., McDevitt S., Sullivan K., Kent T., Luz A., Glickman J.F., Andrake M., Skorski T., Pomerantz R.T.. Small-Molecule Disruption of RAD52 Rings as a mechanism for precision medicine in BRCA-Deficient cancers. Chem. Biol. 2015; 22:1491–1504. [DOI] [PMC free article] [PubMed] [Google Scholar]
- 67. Griffin C.S., Simpson P.J., Wilson C.R., Thacker J.. Mammalian recombination-repair genes XRCC2 and XRCC3 promote correct chromosome segregation. Nat. Cell Biol. 2000; 2:757–761. [DOI] [PubMed] [Google Scholar]
- 68. Iliakis G., Mladenov E., Mladenova V.. Necessities in the processing of DNA double strand breaks and their effects on genomic instability and cancer. Cancers. 2019; 11:1671. [DOI] [PMC free article] [PubMed] [Google Scholar]
- 69. Nakajima N.I., Hagiwara Y., Oike T., Okayasu R., Murakami T., Nakano T., Shibata A.. Pre-exposure to ionizing radiation stimulates DNA double strand break end resection, promoting the use of homologous recombination repair. PLoS One. 2015; 10:e0122582. [DOI] [PMC free article] [PubMed] [Google Scholar]
- 70. Yatagai F., Suzuki M., Ishioka N., Ohmori H., Honma M.. Repair of I-SceI induced DSB at a specific site of chromosome in human cells: influence of low-dose, low-dose-rate gamma-rays. Radiat. Environ. Biophys. 2008; 47:439–444. [DOI] [PubMed] [Google Scholar]
- 71. Lisby M., Antunez de Mayolo A., Mortensen U.H., Rothstein R.. Cell cycle-regulated centers of DNA double-strand break repair. Cell Cycle. 2003; 2:479–483. [PubMed] [Google Scholar]
- 72. Lisby M., Mortensen U.H., Rothstein R.. Colocalization of multiple DNA double-strand breaks at a single Rad52 repair centre. Nat. Cell Biol. 2003; 5:572–577. [DOI] [PubMed] [Google Scholar]
- 73. Lisby M., Rothstein R., Mortensen U.H.. Rad52 forms DNA repair and recombination centers during S phase. PNAS. 2001; 98:8276–8282. [DOI] [PMC free article] [PubMed] [Google Scholar]
- 74. Arnoult N., Correia A., Ma J., Merlo A., Garcia-Gomez S., Maric M., Tognetti M., Benner C.W., Boulton S.J., Saghatelian A. et al.. Regulation of DNA repair pathway choice in S and G2 phases by the NHEJ inhibitor CYREN. Nature. 2017; 549:548–552. [DOI] [PMC free article] [PubMed] [Google Scholar]
- 75. Bhargava R., Onyango D.O., Stark J.M.. Regulation of Single-Strand annealing and its role in genome maintenance. Trends Genet. 2016; 32:566–575. [DOI] [PMC free article] [PubMed] [Google Scholar]
- 76. Biehs R., Steinlage M., Barton O., Juhasz S., Kunzel J., Spies J., Shibata A., Jeggo P.A., Lobrich M.. DNA double-strand break resection occurs during non-homologous end joining in G1 but is distinct from resection during homologous recombination. Mol. Cell. 2017; 65:671–684. [DOI] [PMC free article] [PubMed] [Google Scholar]
- 77. Jeggo P.A., Lobrich M.. DNA non-homologous end-joining enters the resection arena. Oncotarget. 2017; 8:93317–93318. [DOI] [PMC free article] [PubMed] [Google Scholar]
- 78. Mortensen U.H., Lisby M., Rothstein R.. Rad52. Curr. Biol. 2009; 19:R676–R677. [DOI] [PubMed] [Google Scholar]
- 79. Jalan M., Olsen K.S., Powell S.N.. Emerging roles of RAD52 in genome maintenance. Cancers (Basel). 2019; 11:E1038. [DOI] [PMC free article] [PubMed] [Google Scholar]
Associated Data
This section collects any data citations, data availability statements, or supplementary materials included in this article.