


Abstract
In Saccharomyces cerevisiae, most ribosomal proteins are synthesized from duplicated genes, increasing the potential for ribosome heterogeneity. However, the contribution of these duplicated genes to ribosome production and the mechanism determining their relative expression remain unclear. Here we demonstrate that in most cases, one of the two gene copies generate the bulk of the active ribosomes under normal growth conditions, while the other copy is favored only under stress. To understand the origin of these differences in paralog expression and their contribution to ribosome heterogeneity we used RNA polymerase II ChIP-Seq, RNA-seq, polyribosome association and peptide-based mass-spectrometry to compare their transcription potential, splicing, mRNA abundance, translation potential, protein abundance and incorporation into ribosomes. In normal conditions a post-transcriptional expression hierarchy of the duplicated ribosomal protein genes is the product of the efficient splicing, high stability and efficient translation of the major paralog mRNA. Exposure of the cell to stress modifies the expression ratio of the paralogs by repressing the expression of the major paralog and thus increasing the number of ribosomes carrying the minor paralog. Together the data indicate that duplicated ribosomal protein genes underlie a modular network permitting the modification of ribosome composition in response to changing growth conditions.
INTRODUCTION
Ribosomes are ubiquitous ribonucleoprotein complexes required for protein synthesis (1). In eukaryotes, ribosomes are composed of two subunits, the 60S and 40S. The 60S subunit contains three rRNAs (28/25S, 5.8S and 5S) and ∼46 ribosomal proteins (RPs), while the 40S subunit is composed of a single rRNA (18S) and ∼33 RPs (2). Ribosome biogenesis is a major undertaking that requires coordinated expression and assembly of the different RNA and protein components (3). Generation of new ribosomes involves ∼150 rDNA repeats, 137 ribosomal protein genes (RPGs), 76 small nucleolar RNAs (snoRNAs) and >200 assembly factors (4). All these factors are coordinated in ways that meet the high demand for protein synthesis with minimum errors or wasted energy (5). As a result, changing the expression of any single component often alters the whole assembly pipeline and modifies the expression of the ensemble of genes involved in ribosome production (6–9). Recent work indicates that the ribosomes are not a homogenous population of static monolithic machines but rather they form a dynamic population of ribosomes with heterogeneous protein composition (10–13). In mammalian cells, it was shown that certain ribosomal proteins are expressed in a tissue specific manner and that ribosome with different composition may have different translation preference (14–16). However, the etiology of this difference in protein composition and the mechanism controlling it remains largely unclear.
In the yeast Saccharomyces cerevisiae, most RPs are produced from duplicated paralogous genes, known as ohnologs, resulting from interspecies hybridization (17). Indeed, all but 19 of the 137 ribosomal protein genes (RPGs) are duplicated in S. cerevisiae (18–20). These ohnologs or functional paralogs are believed to have evolved in their function after the hybridization events, either by mutation or by differences in expression pattern (19,21). Twenty-two out of the 59 duplicated RPGs in yeast produce identical proteins, while 37 differ by one or more than one amino acid (Figure 1A) (19,20). Single deletion of the majority of differentially expressed paralogs generate copy-specific phenotypic effects (22–24). Despite the high similarity between the duplicated RPGs, the majority of these genes differentially affect cell growth and display gene specific transcription and/or translation profiles. This suggests that duplicated RPGs may have evolved to serve different functions (19,20,25). For example, the deletion of RPL7A/uL30A, RPL12B/uL11B, RPL22A/eL22A and RPS18B/uS13B, and not their paralogs, affected the localized translation of Ash1 mRNA (25). Most paralogs are regulated at different stages of gene expression and have different localization and assembly patterns, suggesting that the expression of RPGs is functionally regulated in a copy-specific manner (20,25). Indeed, we demonstrated that the deletion of the minor, and not the major copy, of several duplicated RPGs affects growth under stress without major effects on the global amount of RP generated from these duplicated RPGs (19,20).
Figure 1.

Ribosome heterogeneity is generated by differential expression and incorporation of ribosomal protein paralogs. (A) Over half of the protein paralogs generated by non-identical duplicated RPGs were detected by mass-spectroscopy. The protein paralogs generated from duplicated genes with one or more amino acid difference were examined using Swath Multiple Reaction Monitoring (MRM) and those that were reproducibly detected in three independent replicas were retained, their RNA expression levels were determined using whole transcriptome sequencing and their translation efficiency compared as described in D. (B) Most yeast ribosomal protein is produced from one copy of the duplicated genes. The ratio of the protein paralogs generated by each pair of RPGs was calculated as described in A and plotted in the form of bar graph (left panel). The identity of the major (producing most proteins) and minor (producing the least amount of proteins) paralog of each pair is indicated on top. The blue and orange colors indicate the A and B paralog of each gene respectively. The error bars represent the standard deviation of two to three independent experiments. (C) Most duplicated RPG pairs are equally transcribed. The ratio of the levels of RNAPII association with the major and minor paralogs of each duplicated RPG, obtained from ChIP-seq assay (36), was plotted against the ratio of protein amounts of each paralog. Gene pairs that are equally transcribed or equally expressed as protein (log2 difference < 0.3) are shown in grey (neutral), while genes pairs with similar transcription and protein paralog ratios are shown in blue (positive regulation) and those showing opposite transcription and protein paralog ratios are shown in red (negative regulation). (D) Detection of duplicated RPG RNA abundance and translation index. Total pre-cleared cell extracts were used to extract total RNA for abundance measurements and RNA was then fractionated on polyribosome sucrose gradients. The association of each paralog mRNA with the heavy ribosome (more than two ribosomes) and light ribosome fractions (subunits and monosomes) were determined using qRT-PCR and RNAseq and the translation index calculated for each gene. (E) RNA abundance determines the ratio of the ribosomal protein paralogs. The relative abundance of the duplicated RPG mRNAs was determined using RNA-seq and plotted relative to the abundance of the protein paralogs. The color scheme is described in C. (F) Translation efficiency modulates the relative expression of a subset of duplicated RPGs. The translation index of the different gene pairs was determined as described in D and the ratio of the translation index of the major over the minor copy was plotted against the ratio of the protein paralogs. Genes that exhibit same-direction translation and protein ratios (positive translation regulation) are shown in blue while those showing altered translation ratio (negative translation regulation) in red and those equally (log2 difference < 0.3) translated or represented in protein (neutral) shown in gray. The data are an average of two biological replicas for the sequencing data and three biological replicas for the proteomic data. (G) Translation reinforces the expression hierarchy of the duplicated RPGs. The ratio of RNA abundance and translation index of each gene pair was determined as described in D and plotted relative to each other. The data are an average of two independent biological replicas. (H) The abundance of RP paralogs is induced through positive regulation of the major paralog. The number of paralogs where the protein paralog ratios correlate with the transcription (RNAPII association), RNA abundance or translation index ratio is indicated in the form of a bar graph. (I) The ratio of RP paralogs is established through differential regulation of major paralog expression. The number of RPGs that are regulated at one or more stages of gene expression is indicated in the form of bar graphs. Genes for which the protein paralog ratio matches the transcription ratio, but which have neutral translation are considered as transcriptionally regulated (transcriptional). Genes that are both differentially transcribed and translated (transcriptional + translational) or exhibit equal transcription level but different RNA abundance (RNA abundance) and or differential translation (RNA abundance + translation or RNA abundance - translation) are considered to be post-transcriptionally regulated. Genes exhibiting similar transcription, RNA abundance and translation but showing unequal protein levels are considered as post-translationally regulated. The names of the minority of genes that are not regulated through difference in RNA abundance and translation are indicated on top. The blue, red, grey and black colors indicate the magnitude and direction of duplicated RPG regulation. Genes regulated at only one stage of gene expression (i.e. transcription, translation or RNA abundance) are indicated in light gray; genes regulated at different levels in the same direction are shown in blue; genes regulated at two levels but in opposite directions are shown in red. Genes that are likely regulated posttranslationally are shown in dark gray. (J) Outline of the main regulatory events controlling the ratio of the ribosomal protein paralogs. The gene copy producing most of the ribosomal protein is shown in blue, while the copy producing the lowest amount of protein is indicated in red. The details of the different data points used in creating the different graphs are available in Supplementary Table S5.
Splicing plays an important role in defining the expression pattern of duplicated RPGs (20). In the majority of cases individual intron deletions differentially affect the expression of each paralog In half of the cases, introns induce the expression of the host genes, while the other half, introns inhibit host gene expression, indicating that introns may function as modular gene-specific regulators of gene expression (20,26). Deletion of RPG introns, affected not only the expression of the host gene (intragenic regulation) but also, altered the expression of its paralog in trans (intergenic regulation). This interplay between the two splicing events in each pair of duplicated RPGs provides a means to alter the specific ratio of similar but non-identical RPs, thus allowing modification of the constitution of ribosomes in certain growth conditions. Indeed, exposing cells to stress altered the expression ratio of the two duplicated RPGs in an intron-dependent manner (20).
Paralog-specific expression is not restricted to intron-containing genes but also was observed in intron-less genes, like RPL8/eL8, where the expression is regulated by differences in 3′ UTR length (19). Analysis of ribosomal proteins suggests that yeast cells contain a heterogeneous population of ribosomes that change composition under different conditions (27,28). However, the origin of this heterogeneity is unclear. It is also unclear if this represents random variation or a controlled program. To date, it is not clear either if, and how frequently, variation in paralog expression leads to changes in ribosome composition. In this study therefore, we systematically profiled the accumulation, incorporation and utilization of the RP paralogs generated by the different duplicated RPGs in yeast and investigated causation by transcription, RNA abundance and translation.
MATERIALS AND METHODS
Strains and cultures
The S. cerevisiae strain used in this study was JPY10H3 (MATa his3Δ200 leu2Δ0 lys2Δ0 ura3Δ0) that was generated in the BY background (29) by dissection of the JPY10I2 strain (30). Cultures were grown in yeast complete (YC) media (1.7 g/l yeast nitrogen base without amino acids and ammonium sulfate, 1 g/l sodium glutamate, 100 mg/l cysteine, 100 mg/l threonine, 85 mg/l tryptophan, 80 mg/l leucine, 60 mg/l lysine, 50 mg/l aspartic acid, 50 mg/l isoleucine, 50 mg/l methionine, 50 mg/l phenylalanine, 50 mg/l proline, 50 mg/l serine, 50 mg/l tyrosine, 50 mg/l uracil, 50 mg/l valine, 20 mg/l adenine, 20 mg/l arginine, 20 mg/l histidine, pH 6) with 2 g/l dextrose at 30°C. For hygromycin and NaCl treatment, cells were exposed to concentrations causing 50% growth-inhibition (IC50: 110 μg/ml for hygromycin and 0.9 M for NaCl) for 2.5 h before cell collection.
Cell extract and polysome preparation
The following modifications were made to the polysome preparation method described by (31,32). A single colony of freshly streaked cells was inoculated in 50 ml of yeast synthetic media (YC) and incubated overnight to attain 5.8–8.3 × 10⁷ cells/ml density. The overnight cultures were diluted in 400 ml of YC to a density of 9 × 10⁵ cells/ml. Drugs were added to IC50 when the cultures attained 3.3 × 10⁶ cells/ml and they were collected after 2.5 h at a density of 1.0–1.3 × 10⁷ cells/ml. Pre-cooled 400 ml plastic bottles containing cycloheximide, for a final concentration of 0.1 mg/ml, were used to collect the cultures. The cells were pelleted at 3000 g for 5 min at 4°C and washed twice in cell lysis buffer (20 mM Tris–HCl pH 8, 140 mM KCl, 1.5 mM MgCl2, 0.5 mM DTT, 0.1 mg/ml cycloheximide, 1% Triton X-100, 1 mg/ml heparin). 3 ml of lysis buffer and 500 μl of acid washed glass beads were added to the washed cells. The cells were vortexed 4 × 20 s at full speed on a vortex Genie 2 (VWR Scientific Products). The lysates were cleared by two centrifugation steps, first at 2600 g for 5 min at 4°C, then 9500 g for 5 min at 4°C. The cleared lysates were layered onto a 5–50% sucrose gradient prepared with 20 mM Tris–HCl pH 8, 140 mM KCl, 5 mM MgCl2, 0.5 mM DTT, 0.1 mg/ml cycloheximide, 1 mg/ml heparin on a Gradient Master 108 (Biocomp) at an angle of 60° for 5 minutes at 25 rpm and placed at 4°C for at least 10 hours. For protein quantification by mass spectrometry, heparin was omitted and neither added to lysis buffer nor to the sucrose gradient. The sucrose gradient tubes containing lysate were centrifuged at 34 000 g for 13 h in a Beckman SW28 rotor at 4°C. Extended exposure of lysates at 4°C creates experimental artifacts due to increased dissociation of polysomes into monosomes. Therefore, the duration between cell collection to loading on the sucrose gradients should be limited to 2.5 h. Sucrose gradient fractionation was carried out on a Teledyne Isco gradient collector with pump speed set at 2 ml/min and chart speed at 30 cm/h. Polypropylene round-bottom 13 ml tubes were used for fraction collection. Fractions collected were: 40S, 60S, monosome (80S), poly1 (2–3 ribosomes), poly2 (4–5 ribosomes) and poly3 (6+ ribosomes).
Protein preparation for mass-spectrometry
The proteins in total extracts or sucrose gradient fractions (monosome and poly2) were dialyzed using spectra (3500 Da, Spectrum laboratories) tubing against TSM buffer (10 mM Tris, 3 mM succinic acid, 10 mM MgCl2, pH 8) for 70 h at 4°C with continuous agitation and 6–8 changes of 5 l of buffer. The dialyzed samples were transferred to 50 ml Nalgene Oakridge centrifuge tubes (3118-0050) then frozen at –80°C and lyophilized at low atmospheric temperature (150–250 mTorr). Proteins were resuspended in 1 ml phosphate buffer (140 mM NaCl, 2.5 mM KCl, 4 mM Na2HPO4, 1.5 mM KH2PO4, pH 7.3). 0.4 volume of 1 M MgCl2 and 2 volumes of glacial acetic acid were added to re-suspended samples and mixed by slow agitation. Nucleic acids were pelleted by centrifugation at 20 000 g for 10 min at 4°C. The supernatant was re-dialyzed against 0.5% acetic acid over 70 h at 4°C with continuous agitation and 6–8 changes of 5 l of buffer, and lyophilized. Proteins were resuspended in ‘reagent 4’ (6 M urea, 2 M thiourea, 4% CHAPS in 50 mM Tris pH 8). Protein quantity was estimated by Pierce 660 protein assay. 40 μg of proteins were alkylated and reduced with DTT, followed by overnight precipitation with 1 volume of ice-cold methanol and 8 volumes of ice-cold acetone at –80°C. Pelleted proteins were washed three times with ice-cold methanol and briefly air-dried. Lysine C- followed by trypsin-digestions were carried out in 0.75 M urea and 50 mM Tris pH 8 for 4 h at 37°C using a 1:30 (w/w) ratio. The digestions were halted with 2% (v/v) formic acid. This was followed by peptide purification by solid-phase extraction on a polymeric reverse-phase cartridge (Phenomenex, Torrance, CA, USA). Ionization was performed with an ESI (Electron spray ionization) source in a 25 μm ESI probe using a microLC200 system equipped with a 150 mm × 300 μm HALO C18 2.7 μm column (all Eksigent). Samples were injected by overfilling a 5 μl injection loop. Chromatography was performed at 50°C in a gradient of water to ethanol both containing 0.2% formic acid and 3% DMSO. An LC–MS/MS TripleTOF 5600 mass spectrometer (ABSciex; Foster City, CA, USA), equipped with a DuoSpray source at PhenoSwitch Bioscience (Sherbrooke, Canada), was used for paralog-specific quantification or protein quantification. Data acquisition was performed using rolling collision energy and optimized SWATH windows in positive product ion mode with a mass range from 100 to 1800 m/z and in high sensitivity MS/MS mode.
RNA preparation for qRT-PCR
Two volumes of 8 M guanidine–HCl and 3 volumes of 100% ethanol were added to total extracts or collected sucrose gradient fractions (monosome, poly2, poly3) in 50 ml Nalgene Oakridge centrifuge tubes (3118-0050) and samples were precipitated overnight at –80°C. RNAs were pelleted by centrifugation at 20 000 g for 20 min at 4°C, washed with 85% ethanol and resuspended in 3 ml DEPC-treated water by vigorously vortexing for 4 × 20 s. The resuspended RNAs were precipitated with 300 μl of 3 M sodium acetate pH 5.3 and 2.5 volumes of 100% ethanol overnight at –80°C in 13 ml polypropylene round-bottom tubes, then centrifuged for 20 min at 20 000 g at 4°C. The pellets were washed with 3 ml 85% ethanol and resuspended in 1 ml DEPC-treated water. The samples were extracted once with phenol:chloroform and once by chloroform extraction, followed by RNA precipitation with 1 ml of 3 M LiCl overnight at –80°C and centrifugation at 13 000 g for 20 min at 4°C. The pellets were washed with 85% ethanol and resuspended in 350 μl of DEPC-treated water. The samples were precipitated again with 35 μl of 3 M sodium acetate pH 5.3 and 1155 μl of 100% ethanol overnight at –80°C to remove LiCl, washed with 75% ethanol and dried by SpeedVac at 40°C for 20 min. The final RNA resuspension was performed in 100 μl of DEPC-treated water and samples were stored at –20°C before qRT-qPCR analysis.
RT-qPCR
RNA samples (6–25 μg), extracted and purified from total extracts or from sucrose gradient fractions (monosome, poly2, poly3), were subjected to DNase treatment, for removal of contaminant DNA, using 33 units of Qiagen RNAse-free DNase (79254) on Qiagen RNeasy Minikit (74106) spin columns for 25 min at 37°C. Reverse transcription was carried out on the DNase-treated RNA (50 ng) using either RT Transcriptor from Roche, or random hexamers and Moloney Murine Leukemia Virus-RT (MMULV-RT). 1 ng of cDNA and 200 nM of primers, described in Supplementary Table S1, were used for 10 μl qPCR reactions in 384-well plates in a Biorad CFX384™ Real Time System thermocycler using the BioRad iTaq Universal SYBR Green Supermix. Relative mRNA quantification and translation index analysis were calculated using the formula: RQ = 2(CTReference –CTTest)Gene/2(CTReference – CTTest)Control, where CTs are the cycle threshold values determined by the Bio-Rad CFX Manager software; Reference and Test represent strain, conditions or fractions compared; and Gene and Control represent the quantified gene of interest and the normalization control gene. Act1 mRNA was used as the normalization control and the experiments were reproduced in three biological replicates and three technical replicates. For translation index, RQs were calculated for the monosome, poly2 and poly3 fractions relative to total RNA and the translation index = (RQpoly2 + RQpoly3)/RQmonosome.
Mass spectrometry analysis
Peak selection and integration for peptide quantification were performed with Skyline (MacCoss Lab) using unique peptides differentiating duplicated RPs (see Supplementary Table S2). Normalization across samples was performed using a pool of 47 peptides from 11 unique ribosomal proteins (see Supplementary Table S3). The experiments were performed using three biological replicates. The A/B paralog ratios were calculated for each duplicated RP pair in each sample, and uniformity of these ratios across samples was used as the peptide detection confidence criterion. Gene pairs with A/B ratios with coefficients-of-variation >30% in a given condition were examined manually and outlier samples were removed from the average.
Gene feature analysis
Gene data is summarized in Supplementary Table S4. UTR sequences were obtained from SGD (33). RNA half-life data was obtained from (34). Splicing efficiency data was obtained from (35). Intron deletion effect data was obtained from (20). For Kozak score calculation, the sequence conservation of six nucleotides upstream and three nucleotides downstream of the AUG was used. A maximum score of 3.992 was attributed to the conserved Kozak sequence (ACAAAA-AUG-GCU) of S. cerevisiae. The score would be 0 for a completely random sequence. Measurement of accessibility of the Kozak sequence for translation initiation was based on secondary structure analysis of the 50 nucleotides upstream and 30 nucleotides downstream of the AUG. The Kozak access value is the average of the accessibility for the 12 nucleotides of the Kozak sequence. A value of 1 was assigned for no secondary structures and a value of 0 was assigned for completely paired RNA. Post-cap stability values were determined by secondary structure analysis of the first 80 nucleotides of the transcript followed by the verification of the pairing of the first 25 nucleotides downstream of the 5′ cap. A value of 0 in this case indicates completely paired (less accessible) sequence while a value is 1 indicates no pairing (accessible for translation). The codons used for <30% of their corresponding amino acid codons in yeast were considered suboptimal and, as such, may reduce translation rate. The total number of suboptimal codons for each paralog was calculated and the number of paralog-specific suboptimal codons were compared in the genes that are differentially translated in a paralog dependent manner.
RESULTS
Duplicated ribosomal protein genes modify yeast ribosome composition
In S. cerevisiae there are 59 gene-pairs generating all but 19 ribosomal proteins. All duplicated RPGs are transcribed but it is not clear how many of these RNAs are translated into proteins that are incorporated into functional ribosomes. To understand how ribosome composition is defined, we evaluated the relative contribution to ribosome composition, of each member of each duplicated RPG pair. We first identified gene pairs with detectable differences in amino acid sequence and followed their expression pathway from gene to protein. All RT-qPCRs were generated using three biologically independent experiments and three technical duplicates and are presented as average values with standard deviation as described in the Materials and Methods section. Mass spectrometry data are the average of three biological replicates. RNAseq and ChIPseq data are averaged from two independent biological replicates. As indicated in Figure 1A, 37 out of 59 duplicated RPG pairs have one or more amino acid differences between the paralogs. Examining the mass-spectrometry profile of the proteins produced by these 37 non-identical RPG pairs, we identified 23 pairs producing proteins that could be unambiguously and reproducibly distinguished. Analysing the ratio of the non-identical peptides for each gene pair in total protein extracts from cells growing in complete media indicated that in most cases, the RPs are generated predominantly from one gene producing the ‘major’ protein paralog (Figure 1B). Only three duplicated RPG pairs (RPL34/eL34, RPL6/eL6, RPS29/uS14) generated similar amounts of duplicated proteins. The biggest difference in protein abundance was found in the case of small subunit genes RPS9/uS4 and RPS1/eS1, where >80% of the ribosomal protein was produced from the major copy. Note, the designation of the A and B paralog attached to the nomenclature of yeast ribosomal proteins had no bearing on the amount of protein produced (i.e. the major paralog could be produced from either the A or B genes). Thus, the naming of these yeast genes does not provide information about the contribution of the genes to ribosome production. Together the data indicate that while all duplicated RPGs may generate detectable proteins, most of the ribosomal protein is produced from a dominant copy, at least under normal growth conditions.
To understand the origin of the difference between the protein amounts produced by duplicated RPG paralogs, we first examined the transcriptional potential of each one. The RNAPII association profile of each paralog was obtained from our previous genome-wide ChIPseq study (36) and compared to our paralog specific protein abundance measurements. As indicated in Figure 1C and Supplementary Table S5, we found no correlation, in general, between RNAPII association of the paralogs and the amount of protein they produce; despite widespread differences in the amount of proteins produced, the gene copies mostly associated equally with RNAPII. Surprisingly, in four cases (RPL8/eL8, RPL9/uL6, RPS9/uS4 and RPS28/eS28) the transcription potential of the copy producing most of the proteins was actually lower than that of the copy generating the least protein. Only, 3 gene-pairs had correlated transcription and protein ratio indicating that in most cases the amount of protein is defined post-transcriptionally.
To determine if differences in the expression of duplicated RPGs is generated post-transcriptionally, we examined the relative RNA abundance, produced by each copy of the duplicated RPGs using RNAseq and compared it to the protein amount produced from the same gene pair (Figure 1D, top panel and). As indicated in Figure 1E, in most cases the ratio of the RNA generated from each gene pair correlated well with the ratio of the protein generated (i.e. the paralog that produces most RNA also produces most ribosomal proteins). Only three gene pairs (RPL6/eL6, RPL24/eL24, RPL34/eL34) did not have similar RNA and protein ratios, and only the RPL24/eL24 gene copies produced different protein amounts from RNA accumulating at similar levels. This indicates that in most cases the RNA abundance forms the basis of the expression hierarchy of duplicated RPGs.
To evaluate the contribution of translation to individual duplicated RPG paralog expression, we examined the relative association of each paralog's mRNA with polyribosomes. Total extracts obtained from exponentially growing culture in rich media were fractionated on sucrose gradients and the RNA associated with the different polysome fractions was sequenced or examined by qRT-PCR and the translation index [(mRNA associated with heavy fraction (polysomes containing 4+ ribosomes) / mRNA associated with light fraction (monosome and subunits)] was calculated for each paralog as indicator of the translation level of each mRNA (Figure 1D). Comparison between the translation rate and protein abundance generated from each gene pair indicated that approximately half of the gene pairs are equally translated and half of the pairs are differentially translated. In most cases of differential translation levels, the copy producing most protein was also the most efficiently translated, indicating a positive correlation between translation efficiency and protein abundance (Figure 1F).
Among the differentially translated gene pairs, only two pairs (RPL37/eL37 and RPS28/eS28) had opposite translation efficiency and protein abundance ratios. In these two cases the minor paralog (the one producing the least amount of the ribosomal protein encoded by the gene pair) was more efficiently translated than the major paralog (the one producing most of the ribosomal protein encoded by the gene pair). Comparison between translation and RNA abundance of the different gene pairs indicated that in the majority of cases mRNA abundance correlates with translation for the two gene copies (Figure 1G). Overall, RNA abundance agreed the most with the paralog protein abundance. In contrast the amount of protein produced agreed the least with the level of transcription (RNAPII association) (Figure 1H). This means that it is the RNA stability or processing and not the initial level of transcription that determine the hierarchy of dRPGs expression. Indeed, the ratio of all protein paralogs except three pairs was defined post-transcriptionally by differences in RNA abundance or translation or both (Figure 1I and J). We conclude that the expression hierarchy of duplicated RPGs is established both differences in both RNA abundance and translation.
The hierarchy of duplicated RPG expression is defined by differences in paralog splicing, stability and translation
The ratio of protein paralogs correlated with the paralogs’ RNA abundance and not with their RNAPII association (Figure 1C, E and I and Supplementary Tables S4 and S5). This indicated that differences in paralog expression are mediated at least in part through posttranscriptional events that modulate the relative abundance of the paralog RNAs. In most cases, these regulatory post-transcriptional events established the RNA abundance ratio. However, in two cases (RPS29/uS14 and RPL6/eL6) post-transcriptional events had a negative effect, reducing the abundance of the RNA being most associated with RNAPII (Figure 2A). To understand the nature of the basis of these post-transcriptionally induced differences in the expression levels of individual duplicated RPGs, we examined the features of the mRNAs coding for each paralog. As indicated in Figure 2B, for genes with introns, the difference in RNA amount could be explained by difference in splicing. Indeed, for 80% of these genes deleting the introns from either paralog altered the ratio of the mature RNA generated by the pair.
Figure 2.

The ratio of RP paralogs is defined by difference in features controlling the expression of the major protein paralog. (A) RNA abundance is mostly regulated post-transcriptionally. The duplicated RPGs whose RNA abundance does not correlate with RNAPII association were scored as post-transcriptionally regulated and their number is plotted in the bar graph. (B) Splicing efficiency and 3′ UTR length determine the relative abundance of paralog mRNA. Bar graph showing the correlation between RPG abundance and length of the 5′ and 3′ UTRs, mRNA half-life, splicing efficiency and effect of intron deletion. (C) Expression of the major protein paralog is mostly promoted by increased translation efficiency. The number of duplicated RPG pairs with similar translation indexes and protein ratios is indicated in the form of bar graph. (D) Difference in the 5′ UTR sequence, Kozak score and Kozak access promotes the translation of the major paralog. The Kozak score, Kozak access, 5′ UTR GC content, post-cap stability, 3′ UTR length and the number of suboptimal codons were determined for each gene pair and those with a correlation between the mRNA feature and protein paralog ratio are shown in the form of bar graph.
Strikingly, in 60% of cases the difference in the splicing efficiency of the major and minor paralog was also reproduced when the introns were embedded in a heterologous reporter (35). This indicates that in many cases the splicing rate of these mRNAs is inherently encoded within the intronic sequence, as was shown in case of RPS9/uS4, while in a minority of cases it could be context-dependent. In the case of non-intron containing genes, the RNA abundance correlated with 3′UTR length (Figure 2B). In general, intronless genes with long 3′ UTRs produced the least RNA. Together these data indicate that differences between the abundance of the paralog RNA are mainly driven by differences in splicing and 3′ end formation. The difference in the abundance of the major and minor protein paralogs was often also enforced by the increased translation efficiency of the major copy (Figure 2C). Overall, there was increased translation of the major paralog in 12 RPG pairs, and reduced translation of the major paralog in three pairs; in eight pairs there was no difference in translation between the paralogs.
Analysing the features of the duplicated RPG ORFs and their surrounding UTRs indicated that differences in translation is mostly related to difference in Kozak score and access (Figure 2D). In 67% of the cases, the most highly translated paralog had a better or a more accessible Kozak consensus sequence (Figure 2D). The number of suboptimal codons correlated with paralog translation efficiency of only 20% of differentially translated duplicated RPGs (Figure 2D). This indicates that differences in the abundance of RP paralogs can be driven, at least in part, by differences in their translation initiation and in few cases, by later translation steps like elongation, which depends on codon optimality. We conclude that the ratio of RP paralogs is mostly established through sequence features promoting the splicing, stability and translation of the major paralog.
Differences in the abundance of ribosomal protein paralogs determine the composition of yeast ribosomes
Changes in the abundance of duplicated ribosomal protein genes could represent either (i) random variations in gene expression that do not amount to changes in ribosome composition or (ii) form the basis of ribosome identity in the cell. To differentiate between these two possibilities, we compared the ratios of the protein paralogs incorporated into ribosome (monosome + tetrasomes + pentasome fractions) to their abundance in total protein from unfractionated lysate. As indicated in Figure 3A, in all cases the most abundant paralog was also the most frequently incorporated into ribosome, indicating that the relative abundance in each pair usually defines the composition of yeast ribosomes (e.g. the more abundant paralog generates the largest number of ribosomes). Eight of the duplicated RPs were differentially incorporated into ribosomes, either in the form of increased or reduced incorporation of the major paralog into ribosomes (Figure 3A, blue and red dots respectively). Indeed, this suggests that selective incorporation into ribosomes may serve in some cases as regulator of ribosome composition.
Figure 3.
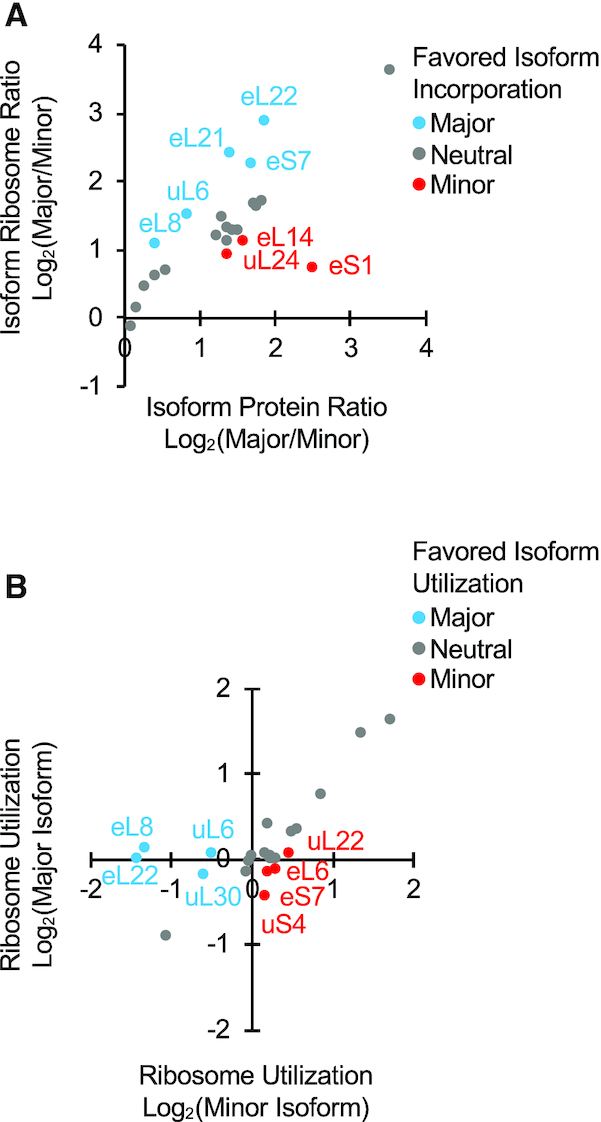
Differential incorporation of RP paralogs generally promotes the production of ribosomes containing the major protein paralog. (A) The abundance or proteins produced by each paralog determines the ribosome composition. The ratio of the major and minor protein paralogs incorporated into ribosomes (calculated as the sum of monosomes and polysomes containing 4–5 ribosomes) was determined using Swath Multiple Reaction Monitoring (MRM) and those that are reproducibly detected in three independent replicas were plotted against those detected in total protein fraction. Pairs where the major or minor paralogs are over-represented in the ribosome population, with respect to its total protein accumulation, are shown as blue and red dots respectively. Pairs where the ribosome population represents the total protein accumulation (log2 difference < 0.3) are shown as gray dots. (B) Differential incorporation of ribosomal protein paralogs into active ribosomes. The ribosome utilization for each protein paralog was determined by comparing its enrichment in active polysomes (fractions containing 4–5 ribosomes) versus monosome fractions and presented as a dot plot. The color scheme is as described in A. The identity of the different data points used in creating the graphs are available in Supplementary Table S5.
In most cases (15 gene pairs) the minor and major paralogs were incorporated in similar ratios into both non-translating (monosome) and translating (tetrasomes + pentasomes) ribosomes (Figure 3B). Therefore, under normal growth conditions, the specific protein paralog generated from most duplicated RPGs does not alter the reactivity (incorporation into polysomes) of yeast ribosomes. Surprisingly, in 8 cases, the minor (RPL7/uL30, RPL8/eL8, RPL9/uL6, RPL22/eL22) or the major (RPS7/eS7, RPL6/eL6, RPL17/uL22, RPS9/uS4) paralogs were under-represented in active ribosomes (Figure 3B, blue and red dots). For RPL8/eL8, RPL9/uL6 and RPL22/eL22, the paralog that was over-represented in active ribosomes was also differentially incorporated into the total ribosome population. Furthermore, both ribosome incorporation (association with both monosome and polysome fractions) and utilization (association with polyribosome fractions containing tetra and pentasomes) of the major paralog was usually the most abundant form. However, in the case RPS7/eS7 the major paralog was the least abundant form in the tetra and pentasome fractions representing actively translating ribosomes. This indicates, that at least in this one case, ribosomes with different isoform composition might have different translation potential. We conclude that with few exceptions the abundance of the proteins produced by each paralog determines the type of ribosomes used for translation.
Exposure to stress modifies the ratio of ribosomal protein paralogs
It is an open question whether the expression ratio between individual duplicated RPGs arises because (i) the cell needs the different paralogs in a given growth condition or whether (ii) the paralog ratio is static and simply reflects the accumulation of mutations in the minor copy that repress its expression. We thus asked whether changing growth conditions would modify the ratio of the RP paralogs. We have exposed the cells to two very different stress conditions. The first condition involved exposure to hygromycin, a translation inhibitor drug that blocks translocation (37), while the second condition involved increased concentration of NaCl to confer general cell wall and osmotic stress (38–40). As indicated in Figure 4A, exposing the cells to hygromycin or NaCl, modified the ratio of specific subsets of protein paralogs. The ratio of the proteins produced from 7 gene pairs was not altered in the presence of any drugs, while the ratio of 16 pairs changed at least in one condition. Mostly the paralog ratio was modified in only one stress condition. However, five pairs were sensitive to both stress conditions tested (Figure 4B). The changes took the form of either increasing or reducing the abundance of the major paralog in relation to the minor paralog (Figure 4C). The largest increase in protein abundance was observed in the presence of NaCl while the greatest decrease occurred in the presence of hygromycin. The minor paralogs tended to increase rather than decrease under stress. This suggests that exposure to stress induces the production and utilization of the minor paralogs by the ribosome. Therefore, it appears that the cells may modulate the expression of a dynamic network of proteins isoforms generated by the dRPGs to adapt to changes in growth conditions.
Figure 4.

Exposure to stress modifies the relative abundance of RP paralogs. (A) The ratio of protein paralogs generated by each duplicated RPG was compared in the presence or the absence of hygromycin (left panel) or NaCl (right panel) and shown in the form of a scatter plot. Changes in ratio that favor the major paralog (increase the abundance of the paralog produced by the major paralog or reduce the abundance of the minor paralog) are shown in blue. Changes in paralog ratio that favor the minor paralog (decrease in the abundance of the major paralog or increase in the minor paralog abundance) are indicated in yellow. Gray indicates no change (log2 difference < 0.3) in paralog ratio upon exposure to stress. The data are an average of two to three independent biological replicas. (B) The ratio of most RPs is modified in a condition-specific manner. The number of paralogs whose ratio is altered in one or both of the conditions tested are indicated in the form of a bar graph. (C) Stress modifies the ratio of RP paralogs by repressing the major paralog or inducing the expression the minor paralog. The number of genes showing an increase or decrease in protein abundance in the presence of hygromycin (left panel) or NaCl (right panel) is indicated in the form of a bar graph. Major and minor paralogs are indicated as black and white columns respectively. Paralogs producing equal amount of proteins in untreated growth conditions are indicated by the grey columns. Details of the different data points used in creating the graphs are available in Supplementary Table S5.
Stress modifies the ratio of RP paralogs by modifying both RNA abundance and translation
To understand how exposure to stress modifies the ratio of the protein paralogs generated by duplicated RPGs, we examined the impact of hygromycin and NaCl on the RNA abundance and translation of the different paralogous gene pairs. As indicated in Figure 5A, exposure to hygromycin mostly modified the duplicated RP levels through paralog-specific changes in translation, rather than through changes in RNA abundance. In addition, some of the paralog protein ratios were modified in the presence of hygromycin, with little or unrelated changes in the RNA and translation (association with polyribosome). This suggests that the protein ratios were modified post-translationally, i.e. by changes in protein stability. As expected from an inhibitor of eukaryotic protein synthesis, hygromycin inhibited translation in general. However, we found that translation of the major paralogs was more sensitive to hygromycin treatment than that of the minor paralog. This selective inhibition of major paralog translation was also observed, but to a lesser extent, after exposure to NaCl (Figure 5B). Exposure to NaCl had more effect on RNA than hygromycin. Overall, while under normal conditions the RNA and protein abundance are well correlated, exposure to stress may alter this correlation and modify the paralog ratio (Figure 5C). Together these data indicate that RNA levels underlie the RP paralog ratio, which is modified in response to stress, mostly through modification of translation.
Figure 5.

Stress modifies the ratio of ribosomal protein paralogs by altering the translation and / or RNA abundance. (A) Exposure to hygromycin modifies the translation of both major and minor paralogs. The number of major (black columns), minor (white) and equally (gray columns) expressed paralogs that are regulated through transcription, transcription and translation, translation or post-translationally, are shown in the form of a bar graph. (B) Exposure to NaCl modifies the ratio of protein paralogs by differentially inducing the expression of the minor paralog. The number of major (black columns), minor (white columns) and equally (gray columns) expressed paralogs that are regulated through transcription, transcription and translation, or translationally or post-translationally are shown in the form of a bar graph. (C) Comparison of the regulatory events controlling the protein paralog ratios in the presence or the absence of drugs. The number of RPG paralogs that are regulated through changes in an RNA-dependent or -independent manner, in the presence and the absence of drugs, is shown in the form of a bar graph.
Exposure to stress modifies the composition of yeast ribosomes and their incorporation into active polyribosomes
Comparing the ratio of the protein paralogs incorporated into ribosomes (monosome + polysomes containing four to five ribosomes fractions) in the presence and absence of hygromycin or NaCl indicated that in most cases, the ratio between major and minor paralog is decreased under stress (Figure 6A). Indeed, this narrowing of the gap between the major and minor paralog was observed for RPL22/eL22, RPL8/eL8, RPL9/uL6, RPS28/eS28 with hygromycin only and for RPL14/eL14, RPL4/uL4 with NaCl, while RPL21/eL21 and RPL7/eL30 were modified in both stress conditions. Interestingly, in one case (RPL34/eL34) the ratios of paralogs in response to hygromycin and NaCl and RPS1/eS1 paralogs in response to NaCl were inverted, showing a dramatic stress dependent change in paralog ratio. The major paralog was only induced by stress in the cases of RPS9/uS4 and RPL22/eL22. Comparison between the paralogs with altered incorporation into ribosomes in the presence or absence of stress indicated that, with the exception of RPL26/uL24 and RPS7/eS7, the incorporation of all genes that are differentially incorporated into ribosomes under normal conditions is altered by stress (Figure 6B). Therefore, exposure to stress may modify ribosome composition through selective incorporation of protein paralogs into ribosomes.
Figure 6.
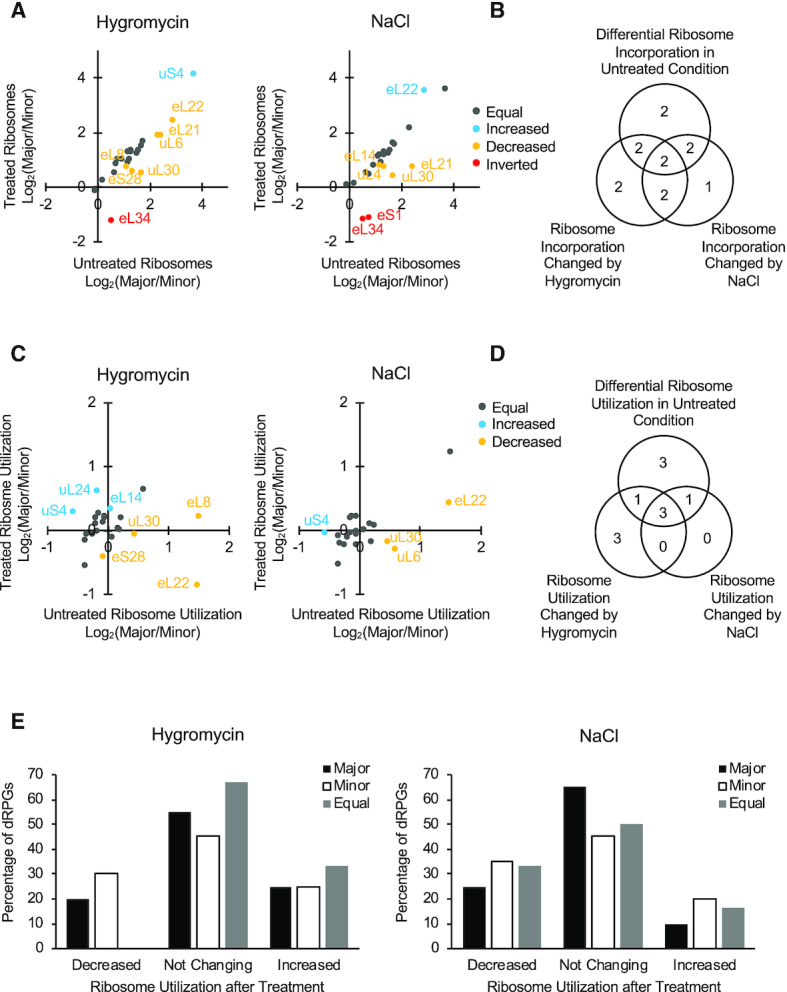
Exposure to stress modifies the composition of active ribosomes. (A) Impact of drugs on the incorporation of protein paralogs into ribosomes. The ratio of protein paralogs in all ribosomes including both monosome and polysome fractions was compared in the presence or the absence of hygromycin (left panel) or NaCl (right panel). Pairs with major/minor paralog not changing (log2 difference < 0.3) upon treatment are shown in gray. Pairs with major/minor ratio increased or decreased upon treatment are represented by blue and yellow dots respectively. Pairs with inverted major/minor ratios after treatment are shown by red dots. (B) Stress modifies ribosome composition. The overlap between dRPGs that are differentially regulated in the presence or the absence of drugs is shown as a Venn diagram. (C) Ribosome utilization is changed in a stress-dependent manner. The abundance of each paralog was measured in the active (fractions containing polyribosomes with four or five ribosomes) and monosome fractions and their ratios compared between untreated condition and hygromycin (left panel) or NaCl (right panel) treatments. Pairs with major/minor ratio increased or decreased upon treatment are represented by blue and yellow dots respectively. Pairs with no major change in ratio are shown in gray. (D) Stress modifies the utilization in active ribosomes of most duplicated RPGs. The overlap between the gene pairs that are differentially detected in actively translating ribosome (tetra and penatsome fractions) under normal conditions and upon exposure to stress are shown in the form of Venn diagram. (E) The number of genes showing a change in ribosome utilization in the presence of hygromycin (left panel) or NaCl (right panel) is indicated in the form of a bar graph. Major and minor paralogs are indicated as black and white columns. Paralogs producing equal amount of proteins in untreated condition are indicated by gray columns. The data are averages of two to three independent biological replicas.
Comparing the ratio of RP paralogs incorporated into active ribosomes (polyribosomes containing four to five ribosomes/monosome fractions) in the presence and the absence of hygromycin or NaCl indicated that exposure to stress can also modify the composition of ribosomes engaged in translation (Figure 6C). In three cases (RPL14/eL14, RPL26/uL24, RPS9/uS4), more ribosomes carrying the major paralogs were selected for translation under at least one stress condition while in five cases (RPL22/eL22, RPL7/uL30, RPL8/eL8, RPL9/uL6, RPS28/eS28) the major paralog was less represented in the ribosomes engaged in translation. Four out of the seven pairs whose incorporation into active ribosomes was modified under stress reacted to just one of the stress conditions. This indicates that ribosomes are selected for translation in a growth condition-specific manner. Differential incorporation of paralogs into active or translating ribosomes under normal conditions did not always result in changes of paralog ratio under stress (Figure 6D). Most of the changes in protein paralogs incorporated into active ribosomes took the form of increasing or decreasing the amount of the minor paralog (Figure 6E). This is consistent with the minor paralog being more relevant for response to stress.
To determine the impact of stress on the expression of duplicated RPGs, we compared the changes observed in each paralogous protein after exposure to hygromycin or NaCl, and duplicated RPs that changed with absolute log2 fold change >0.3 were considered changed. As indicated in Figure 7, most genes changed specifically at one mode of expression or another. Comparison of the effect of hygromycin and NaCl on the different modes of gene expression controlling the ratio of protein paralogs generated from duplicated RPGs revealed a clear stress condition-specific program for the modification of paralog ratios (Figure 7). The repression of translation by hygromycin resulted mostly in induction of the RNA of the minor paralog and repression of the translation of the major paralog (left panel). In contrast, exposure to NaCl resulted mostly in reduced RNA abundance with selective induction of the RNA of a few minor paralogs. NaCl inhibited the translation of major and minor paralogs equally. In terms of protein levels, more minor paralogs were induced by NaCl than by hygromycin. Similarly, while no minor paralog was more associated with ribosomes upon exposure to hygromycin, two showed increased incorporation in response to NaCl. Both conditions resulted in similar increases in the association of the minor paralogs with active ribosomes. Remarkably, in most cases the changes in expression were gene copy-specific and only rarely were changes observed in the same direction (both genes up or both genes down regulated). In fact, only two gene pair paralogs increased or decreased in protein amount similarly upon exposure to NaCl. This indicates that gene copies are independently regulated. Overall, the results indicate that the modification of the ribosome population in response to stress is caused by independent modification of each gene copy.
Figure 7.

Impact of drug exposure on different modes of gene expression for each gene pair. The RNA abundance (RA), translation index (TR), protein abundance (PR), ribosome association (AS) and ribosome activity (AC) change after treatment with hygromycin or NaCl for each duplicated RP was compared and color-coded according to log2 fold change relative to untreated condition. Pairs of RPGs are ordered according to the effect of the condition on translation of the major paralog (MJP) versus the minor paralog (MIP). Data used in creating the graphs are available in Supplementary Table S5.
DISCUSSION
In this study, we present a systematic analysis of yeast duplicated ribosomal protein genes (RPGs) that differ in their amino acid sequences. All the tested gene pairs generate functional proteins that are incorporated into active ribosomes, validating gene duplication as a source of ribosome heterogeneity. However, in most cases the steady-state ribosome population was dominated by ribosomes incorporating the protein paralog generated by only one of the two gene copies. Therefore, under normal conditions, translation is mostly performed by ribosomes carrying the protein generated by the ‘major’ paralog. The difference in paralog expression is manifested post-transcriptionally, for the most part, by inherent differences, in splicing or 3′-end formation, that alter mRNA abundance. Translation plays an auxiliary role in adjusting the ratio of protein paralogs, primarily by enhancing the translation of the RNA of the major paralog. When cells are exposed to stress, the ratio between the duplicated RPG proteins is mostly adjusted through differential repression of translation of the major paralog. Together, the data indicate that ribosome heterogeneity is generated by a multilevel regulatory network that adjusts the dose of each paralog in a growth condition-dependent manner.
Comparing protein abundances found here and those in an earlier study of duplicated RPG deletions generally indicate that the genes producing the most protein in yeast ribosomes are also those on which growth depends most under normal conditions. For example, RPS1B/eS1B, RPL4A/uL4A and RPL9A/uL6A, which produce the major protein paralog that participates in the majority of ribosome in yeast, also had the most effect on cell growth when deleted (19). However, there is one exception, namely RPS28B/eS28B, which produces the least amount of RNA and proteins, was more required for growth under normal conditions (19). In most, but not all, cases the paralog-specific effect on cell growth under normal conditions is correlated with the amount of ribosomal protein produced, and hence of ribosomes, produced from this gene (i.e. the gene producing most of the ribosome has the biggest effect on growth when deleted). Paralogs that produce the least amount of ribosomal protein were previously shown to be required for growth under stress, explaining the increase in their expression during stress. For example, genes producing the minor protein paralogs RPL8A/eL8A, RPS9A/uS4A, RPL7B/uL30B were all found to respond and cause sensitivity to drugs (19).
The duplicated RPGs that are most differentially affected by stress have also been previously shown to have paralog-specific regulation and / or function. For example, RPS9/uS4, which is the most differentially affected by both exposure to hygromycin and NaCl, was previously shown to be expressed and spliced in a paralog-specific manner (Figure 7) (26,41,42). Tampering with the splicing of these paralogs, by mutation or deletion of introns, also modified cellular drug-resistance (20). RPS9/uS4 is located near the entrance tunnel of the mRNA and is known to affect decoding accuracy (42). Accordingly, modifying the expression of RPS9/uS4 ratio might impact mRNA selection or translation. Similarly, RPL22/eL22 duplicated RPGs are differentially expressed and autoregulated through splicing (20,43). Deletion of these paralogs has different effects on cell growth and genes expression (20,43). In mammalian cells, eL22 was implicated in cell differentiation and in p53 activation upon stress (44,45). This observation is consistent with a paralog-specific effect of RPL22/eL22 and may explain the modification of paralog ratio in response to stress at least in the case of this gene pair.
Splicing and 3′ end formation are the major regulators of ribosome composition (19,20,26). Earlier studies have shown that most if not all duplicated RPGs are differentially spliced or accumulate at different levels due to differences in the intron sequence (19,20,26). In most cases, the impact of these variations on ribosome production was not studied. Here, we have shown that in almost all the cases with very few exceptions these changes in RNA amount translate into differences in both ribosomal protein and ribosome amount. In general, genes producing the most efficiently spliced RNA produced most of the ribosomes in the cells. However, not all intron-containing genes have a strict correlation between protein abundance and splicing efficiency. This is likely due to in-context regulation of splicing (Figure 2B) (26).
As indicated in the model illustrated in Figure 8, most duplicated RPGs are equally transcribed, or at least equally associated with RNAPII. However, and despite this apparent similar rates of transcription, the majority of the paralog gene pairs generate different amounts of RNA, mostly through differences in splicing and 3′ end formation. Differential expression of the major paralog is often enforced by enhanced translation, based on the optimality of the Kozak sequence (Figure 2D). Genes producing more RNA are in general also more highly translated. Differences in the number of ribosomes containing either the major or minor paralog appears to be a deeply rooted expression program of each pair. When cells are exposed to stress, repression of major paralog translation reduces the difference between the two paralogs and increases the population of ribosomes carrying the otherwise minor paralog. However, there are exceptions to this general pattern of regulation. In a few cases, like RPL37/eL37 and RPS28/eS28, the total amount of proteins is generated through opposing effects of RNA abundance and translation (Figure 1I). In very few cases paralogs were differentially incorporated into ribosome (Figure 3A). This difference in incorporation might reflect the timing of gene expression, import to the nucleolus or affinity to rRNA. In any case, it is now clear that the stoichiometry of the different ribosome populations in yeast is changed through multilevel copy-specific regulation of individual duplicated RPGs in response to changes in growth conditions.
Figure 8.
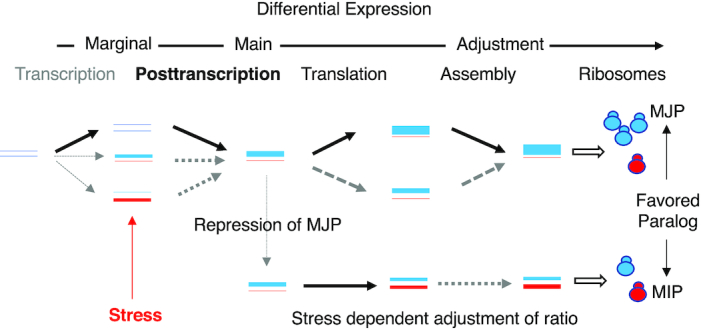
Schematic representation of duplicated RPG expression pathways in stressed and non-stressed conditions. The arrows indicate the different modes of gene regulation including transcription (relative association of RNAPII with each paralog chromatin), post-transcription (RNA stability and splicing modulation of the RNA of each paralog), translation (association of the paralog mRNA with polyribosomes) and assembly (incorporation of the paralog proteins into ribosomes). Ribosomes (circles), RNA and proteins (lines) representing the major and minor ribosomal protein paralog are shown in blue and red, respectively. MJP: major paralog, MIP: minor paralog. The line thickness indicates the RNA and protein produced at each step of gene expression.
DATA AVAVAILABILITY
RNAseq data used in this study is available through the NCBI Gene Expression Omnibus (GEO; https://www.ncbi.nlm.nih.gov/geo) under the accession number GSE133457. The proteomic data presented in this study has been submitted to the Peptide Atlas (http://www.peptideatlas.org/) under the accession number PASS01436.
Supplementary Material
ACKNOWLEDGEMENTS
We thank Mélodie Berthoumieux for the RNAPII ChIPseq data and Jules Gagnon for the computational analysis of gene features. We also thank PhenoSwitch Bioscience for help with the mass spec data.
SUPPLEMENTARY DATA
Supplementary Data are available at NAR Online.
FUNDING
Natural Sciences and Engineering Research Council of Canada (NSERC); Canada Research Chair in RNA Biology and Cancer Genomics (to S.A.). Funding for open access charge: NSERC.
Conflict of interest statement. None declared.
REFERENCES
- 1. Opron K., Burton Z.F.. Ribosome structure, function, and early evolution. Int. J. Mol. Sci. 2018; 20:40. [DOI] [PMC free article] [PubMed] [Google Scholar]
- 2. Pena C., Hurt E., Panse V.G.. Eukaryotic ribosome assembly, transport and quality control. Nat. Struct. Mol. Biol. 2017; 24:689–699. [DOI] [PubMed] [Google Scholar]
- 3. Bassler J., Hurt E.. Eukaryotic ribosome assembly. Annu. Rev. Biochem. 2018; 88:281–306. [DOI] [PubMed] [Google Scholar]
- 4. Kressler D., Hurt E., Bassler J.. Driving ribosome assembly. Biochim. Biophys. Acta. 2010; 1803:673–683. [DOI] [PubMed] [Google Scholar]
- 5. Warner J.R. The economics of ribosome biosynthesis in yeast. Trends Biochem. Sci. 1999; 24:437–440. [DOI] [PubMed] [Google Scholar]
- 6. Albert B., Kos-Braun I.C., Henras A.K., Dez C., Rueda M.P., Zhang X., Gadal O., Kos M., Shore D.. A ribosome assembly stress response regulates transcription to maintain proteome homeostasis. Elife. 2019; 8:e45002. [DOI] [PMC free article] [PubMed] [Google Scholar]
- 7. Xiao L., Grove A.. Coordination of ribosomal protein and ribosomal RNA gene expression in response to TOR signaling. Curr. Genomics. 2009; 10:198–205. [DOI] [PMC free article] [PubMed] [Google Scholar]
- 8. Levy S., Ihmels J., Carmi M., Weinberger A., Friedlander G., Barkai N.. Strategy of transcription regulation in the budding yeast. PLoS One. 2007; 2:e250. [DOI] [PMC free article] [PubMed] [Google Scholar]
- 9. Kopp K., Gasiorowski J.Z., Chen D., Gilmore R., Norton J.T., Wang C., Leary D.J., Chan E.K., Dean D.A., Huang S.. Pol I transcription and pre-rRNA processing are coordinated in a transcription-dependent manner in mammalian cells. Mol. Biol. Cell. 2007; 18:394–403. [DOI] [PMC free article] [PubMed] [Google Scholar]
- 10. Ferretti M.B., Karbstein K.. Does functional specialization of ribosomes really exist. RNA. 2019; 25:521–538. [DOI] [PMC free article] [PubMed] [Google Scholar]
- 11. Genuth N.R., Barna M.. The discovery of ribosome heterogeneity and its implications for gene regulation and organismal life. Mol. Cell. 2018; 71:364–374. [DOI] [PMC free article] [PubMed] [Google Scholar]
- 12. Sugihara Y., Honda H., Iida T., Morinaga T., Hino S., Okajima T., Matsuda T., Nadano D.. Proteomic analysis of rodent ribosomes revealed heterogeneity including ribosomal proteins L10-like, L22-like 1, and L39-like. J Proteome Res. 2010; 9:1351–1366. [DOI] [PubMed] [Google Scholar]
- 13. Xue S., Barna M.. Specialized ribosomes: a new frontier in gene regulation and organismal biology. Nat. Rev. Mol. Cell Biol. 2012; 13:355–369. [DOI] [PMC free article] [PubMed] [Google Scholar]
- 14. Kondrashov N., Pusic A., Stumpf C.R., Shimizu K., Hsieh A.C., Ishijima J., Shiroishi T., Barna M.. Ribosome-mediated specificity in Hox mRNA translation and vertebrate tissue patterning. Cell. 2011; 145:383–397. [DOI] [PMC free article] [PubMed] [Google Scholar]
- 15. Xue S., Tian S., Fujii K., Kladwang W., Das R., Barna M.. RNA regulons in Hox 5′ UTRs confer ribosome specificity to gene regulation. Nature. 2015; 517:33–38. [DOI] [PMC free article] [PubMed] [Google Scholar]
- 16. Fujii K., Susanto T.T., Saurabh S., Barna M.. Decoding the function of expansion segments in ribosomes. Mol. Cell. 2018; 72:1013–1020. [DOI] [PMC free article] [PubMed] [Google Scholar]
- 17. Marcet-Houben M., Gabaldon T.. Beyond the whole-genome duplication: phylogenetic evidence for an ancient interspecies hybridization in the baker's yeast lineage. PLoS Biol. 2015; 13:e1002220. [DOI] [PMC free article] [PubMed] [Google Scholar]
- 18. Wapinski I., Pfiffner J., French C., Socha A., Thompson D.A., Regev A.. Gene duplication and the evolution of ribosomal protein gene regulation in yeast. Proc. Natl. Acad. Sci. U.S.A. 2010; 107:5505–5510. [DOI] [PMC free article] [PubMed] [Google Scholar]
- 19. Parenteau J., Lavoie M., Catala M., Malik-Ghulam M., Gagnon J., Abou Elela S.. Preservation of gene duplication increases the regulatory spectrum of ribosomal protein genes and enhances growth under stress. Cell Rep. 2015; 13:2516–2526. [DOI] [PubMed] [Google Scholar]
- 20. Parenteau J., Durand M., Morin G., Gagnon J., Lucier J.F., Wellinger R.J., Chabot B., Elela S.A.. Introns within ribosomal protein genes regulate the production and function of yeast ribosomes. Cell. 2011; 147:320–331. [DOI] [PubMed] [Google Scholar]
- 21. Lynch M., Force A.. The probability of duplicate gene preservation by subfunctionalization. Genetics. 2000; 154:459–473. [DOI] [PMC free article] [PubMed] [Google Scholar]
- 22. Cheng Z., Mugler C.F., Keskin A., Hodapp S., Chan L.Y., Weis K., Mertins P., Regev A., Jovanovic M., Brar G.A.. Small and large ribosomal subunit deficiencies lead to distinct gene expression signatures that reflect cellular growth rate. Mol. Cell. 2019; 73:36–47. [DOI] [PMC free article] [PubMed] [Google Scholar]
- 23. Lucioli A., Presutti C., Ciafre S., Caffarelli E., Fragapane P., Bozzoni I.. Gene dosage alteration of L2 ribosomal protein genes in Saccharomyces cerevisiae: effects on ribosome synthesis. Mol. Cell Biol. 1988; 8:4792–4798. [DOI] [PMC free article] [PubMed] [Google Scholar]
- 24. Carroll K., Wickner R.B.. Translation and M1 double-stranded RNA propagation: MAK18 = RPL41B and cycloheximide curing. J. Bacteriol. 1995; 177:2887–2891. [DOI] [PMC free article] [PubMed] [Google Scholar]
- 25. Komili S., Farny N.G., Roth F.P., Silver P.A.. Functional specificity among ribosomal proteins regulates gene expression. Cell. 2007; 131:557–571. [DOI] [PMC free article] [PubMed] [Google Scholar]
- 26. Petibon C., Parenteau J., Catala M., Elela S.A.. Introns regulate the production of ribosomal proteins by modulating splicing of duplicated ribosomal protein genes. Nucleic Acids Res. 2016; 44:3878–3891. [DOI] [PMC free article] [PubMed] [Google Scholar]
- 27. Samir P., Browne C.M., Rahul Sun M., Shen B., Li W., Frank J., Link A.J.. Identification of changing ribosome protein compositions using mass spectrometry. Proteomics. 2018; 18:e1800217. [DOI] [PMC free article] [PubMed] [Google Scholar]
- 28. Slavov N., Semrau S., Airoldi E., Budnik B., van Oudenaarden A.. Differential stoichiometry among core ribosomal proteins. Cell Rep. 2015; 13:865–873. [DOI] [PMC free article] [PubMed] [Google Scholar]
- 29. Brachmann C.B., Davies A., Cost G.J., Caputo E., Li J., Hieter P., Boeke J.D.. Designer deletion strains derived from Saccharomyces cerevisiae S288C: a useful set of strains and plasmids for PCR-mediated gene disruption and other applications. Yeast. 1998; 14:115–132. [DOI] [PubMed] [Google Scholar]
- 30. Parenteau J., Durand M., Veronneau S., Lacombe A.A., Morin G., Guerin V., Cecez B., Gervais-Bird J., Koh C.S., Brunelle D. et al.. Deletion of many yeast introns reveals a minority of genes that require splicing for function. Mol. Biol. Cell. 2008; 19:1932–1941. [DOI] [PMC free article] [PubMed] [Google Scholar]
- 31. Preiss T., Baron-Benhamou J., Ansorge W., Hentze M.W.. Homodirectional changes in transcriptome composition and mRNA translation induced by rapamycin and heat shock. Nat. Struct. Biol. 2003; 10:1039–1047. [DOI] [PubMed] [Google Scholar]
- 32. Warner J.R., Knopf P.M., Rich A.. A multiple ribosomal structure in protein synthesis. Proc. Natl. Acad. Sci. U.S.A. 1963; 49:122–129. [DOI] [PMC free article] [PubMed] [Google Scholar]
- 33. Yassour M., Kaplan T., Fraser H.B., Levin J.Z., Pfiffner J., Adiconis X., Schroth G., Luo S., Khrebtukova I., Gnirke A. et al.. Ab initio construction of a eukaryotic transcriptome by massively parallel mRNA sequencing. Proc. Natl. Acad. Sci. U.S.A. 2009; 106:3264–3269. [DOI] [PMC free article] [PubMed] [Google Scholar]
- 34. Chan L.Y., Mugler C.F., Heinrich S., Vallotton P., Weis K.. Non-invasive measurement of mRNA decay reveals translation initiation as the major determinant of mRNA stability. Elife. 2018; 7:e32536. [DOI] [PMC free article] [PubMed] [Google Scholar]
- 35. Yofe I., Zafrir Z., Blau R., Schuldiner M., Tuller T., Shapiro E., Ben-Yehezkel T.. Accurate, model-based tuning of synthetic gene expression using introns in S. cerevisiae. PLoS Genet. 2014; 10:e1004407. [DOI] [PMC free article] [PubMed] [Google Scholar]
- 36. Berthoumieux M. Étude pangénomique des sites de liaison de la protéine Rnt1p et de son rôle dans la maturation des snoARN chez Saccharomyces cerevisiae. 2018; M.Sc. thesisSherbrooke: Universite de Sherbrooke. [Google Scholar]
- 37. Gonzalez A., Jimenez A., Vazquez D., Davies J.E., Schindler D.. Studies on the mode of action of hygromycin B, an inhibitor of translocation in eukaryotes. Biochim. Biophys. Acta. 1978; 521:459–469. [DOI] [PubMed] [Google Scholar]
- 38. Khaware R.K., Koul A., Prasad R.. High membrane fluidity is related to NaCl stress in Candida membrane faciens. Biochem. Mol. Biol. Int. 1995; 35:875–880. [PubMed] [Google Scholar]
- 39. Schoch C.L., Br-uning A.R., Entian K.D., Pretorius G.H., Prior B.A.. A Saccharomyces cerevisiae mutant defective in the kinesin-like protein Kar3 is sensitive to NaCl-stress. Curr. Genet. 1997; 32:315–322. [DOI] [PubMed] [Google Scholar]
- 40. Breierova E. Yeast exoglycoproteins produced under NaCl-stress conditions as efficient cryoprotective agents. Biol. Proced. Online. 1998; 1:10–16. [DOI] [PMC free article] [PubMed] [Google Scholar]
- 41. Plocik A.M., Guthrie C.. Diverse forms of RPS9 splicing are part of an evolving autoregulatory circuit. PLoS Genet. 2012; 8:e1002620. [DOI] [PMC free article] [PubMed] [Google Scholar]
- 42. Pnueli L., Arava Y.. Genome-wide polysomal analysis of a yeast strain with mutated ribosomal protein S9. BMC Genomics. 2007; 8:285. [DOI] [PMC free article] [PubMed] [Google Scholar]
- 43. Abrhamova K., Nemcko F., Libus J., Prevorovsky M., Halova M., Puta F., Folk P.. Introns provide a platform for intergenic regulatory feedback of RPL22 paralogs in yeast. PLoS One. 2018; 13:e0190685. [DOI] [PMC free article] [PubMed] [Google Scholar]
- 44. Dai M.S., Shi D., Jin Y., Sun X.X., Zhang Y., Grossman S.R., Lu H.. Regulation of the MDM2-p53 pathway by ribosomal protein L11 involves a post-ubiquitination mechanism. J. Biol. Chem. 2006; 281:24304–24313. [DOI] [PMC free article] [PubMed] [Google Scholar]
- 45. Cao B., Fang Z., Liao P., Zhou X., Xiong J., Zeng S., Lu H.. Cancer-mutated ribosome protein L22 (RPL22/eL22) suppresses cancer cell survival by blocking p53-MDM2 circuit. Oncotarget. 2017; 8:90651–90661. [DOI] [PMC free article] [PubMed] [Google Scholar]
Associated Data
This section collects any data citations, data availability statements, or supplementary materials included in this article.