

Abstract
Although the role of shoe constructions on running injury and performance has been widely investigated, systematic reviews on the shoe construction effects on running biomechanics were rarely reported. Therefore, this review focuses on the relevant research studies examining the biomechanical effect of running shoe constructions on reducing running-related injury and optimising performance. Searches of five databases and Footwear Science from January 1994 to September 2018 for related biomechanical studies which investigated running footwear constructions yielded a total of 1260 articles. After duplications were removed and exclusion criteria applied to the titles, abstracts and full text, 63 studies remained and categorised into following constructions: (a) shoe lace, (b) midsole, (c) heel flare, (d) heel-toe drop, (e) minimalist shoes, (f) Masai Barefoot Technologies, (g) heel cup, (h) upper, and (i) bending stiffness. Some running shoe constructions positively affect athletic performance-related and injury-related variables: 1) increasing the stiffness of running shoes at the optimal range can benefit performance-related variables; 2) softer midsoles can reduce impact forces and loading rates; 3) thicker midsoles can provide better cushioning effects and attenuate shock during impacts but may also decrease plantar sensations of a foot; 4) minimalist shoes can improve running economy and increase the cross-sectional area and stiffness of Achilles tendon but it would increase the metatarsophalangeal and ankle joint loading compared to the conventional shoes. While shoe constructions can effectively influence running biomechanics, research on some constructions including shoe lace, heel flare, heel-toe drop, Masai Barefoot Technologies, heel cup, and upper requires further investigation before a viable scientific guideline can be made. Future research is also needed to develop standard testing protocols to determine the optimal stiffness, thickness, and heel–toe drop of running shoes to optimise performance-related variables and prevent running-related injuries.
Key points.
Increasing the forefoot bending stiffness of running at the optimal range can benefit performance-related variables.
Softer or thicker midsoles can provide remarkable cushioning effects but may decrease plantar sensations at touchdown.
Minimalist shoes can improve running economy and build the cross-sectional area and stiffness of Achilles tendon but also induce greater loading of the ankle and metatarsophalangeal joint.
Key words: Running shoes, cushioning, bending stiffness, impact force, comfort perception
Introduction
Over the past 50 years, running shoes have experienced tremendous changes. That is, from very minimal to highly supportive and cushioned shoes, and then to very minimal and finally back to highly cushioned shoes (Krabak et al., 2017). Shoes with various functionality were released because of technological advancements (e.g., structural and material engineering) used in running shoe development, such as cushioned, stability and minimalist running shoes. Although cushioned midsoles can theoretically reduce the impact forces by influencing the stiffness of one’s impact attenuation system and reducing the body’s deceleration (Shorten and Mientjes, 2011), the reported injury rate and performance of running have not remarkably improved over the years (Nigg, 2001). Therefore, reducing injuries and improving performances by using running shoes have become a focus in both sport industries and academia.
Running shoes are designated to improve shoe comfort, enhance running-related performance and reduce the injury potentially. To identify the appropriate functionality of running shoes, previous research has examined different shoe constructions, which included shoelaces (Hong et al., 2011), midsole (TenBroek et al., 2014), heel flare (Stacoff et al., 2001), heel-toe drop (Malisoux et al., 2017), minimalist shoes (Fuller et al., 2015), Massai Barefoot Technology (MBT) ((Boyer and Andriacchi, 2009), heel cup (Li et al., 2018), shoe upper (Onodera et al., 2015), and bending stiffness (Stefanyshyn and Wannop, 2016). For one example, shoelace regulate the tightness of the shoe opening to allow a geometrical match between the foot and the shoe based on the individual’s preference. Good fit is considered a prerequisite for shoe comfort (Ameersing et al., 2003). A shoelace system, heel counter or any other systems that can secure the foot within the footbed should be integrated in running shoes.
For another example, the midsole is an important shoe component for cushioning and shock absorption of running impacts. Midsole thickness is considered important to influence plantar sensations and alter foot strike pattern for shod and minimalist shoes running (Chambon et al., 2014). A wide range of heel-toe drops used in running shoes (e.g., 0 mm to 12 mm) has been shown to influence foot strike pattern and injury risk (Malisoux et al., 2016). Technically, minimalist shoe is defined as the footwear with high flexibility and low shoe mass, stack height and heel-toe drop (Esculier et al., 2015). The minimalist shoe index is the combined scores of shoe quality, sole height, heel-toe drop, motion control, and stabilisation techniques, flexibility, longitudinal flexibility and torsional flexibility (Esculier et al., 2015). Recently, forefoot bending stiffness has received more attention because it has the potential to influence both running-related injury and performance (Stefanyshyn and Wannop, 2016). Softer and thicker running shoes (Sterzing et al., 2013; Teoh et al., 2013) were claimed that reduced impact in order to reduce impact-related injuries. However, Theisen et al., (2014) found that there was no difference in running-related injury between softer and harder shoes. Such a relationship between biomechanics and injury not well established in the literature.
While different shoe constructions showed the remarkable changes in running biomechanical and performance-related variables, no consistent findings on running biomechanics can be found for most shoe constructions. For example, shoe cushioning properties are interplayed with multiple footwear constructions including midsole hardness, midsole thickness, heel-toe drop, and crash-pad. The efficacy of isolated footwear constructions on running performance requires further investigation. Furthermore, analysing the development trend of running shoes can provide valuable guidelines to understand the roles of various footwear constructions in lower extremity biomechanics. Therefore, the current review aimed to examine the effect of different footwear constructions on running biomechanics and review the development status of running shoes related to injury, performance and applied research.
Methods
Systematic review process
We followed the Preferred Reporting Items for Systematic Reviews and Meta-Analyses (PRISMA) guidelines for this systematic review (Alessandro et al., 2009). A standardised electronic literature search strategy was performed using the following keyword combinations: “running shoes” OR “running footwear” AND (“upper” OR “shoe lace” OR “midsole” OR “minimal shoes” OR “minimalist” OR “stiffness” OR “bending stiffness” OR “heel flare” OR “heel cup” OR “friction” OR “traction” OR “Masai Barefoot Technologies” OR “MBT”) AND PUBYEAR from 1994 to September 2018 via the five databases (Elsevier, Ebsco, WoS, SAGE Knowledge e-book database, and PubMed Central) and Footwear Science. WKL and WJF agreed on the use of the search terms. Figure 1 summarises the search and selection processes. All articles were input into Endnote to eliminate duplicates. Then, the original research articles in peer-reviewed journals that investigated the effect of shoe constructions on biomechanical changes during running were included. The exclusion criteria included duplicates, orthotics, non-biomechanical related (i.e., only physiological-, biochemical-, and medical-related), non-running shoe related, non-English or non-full text articles.
Figure 1.
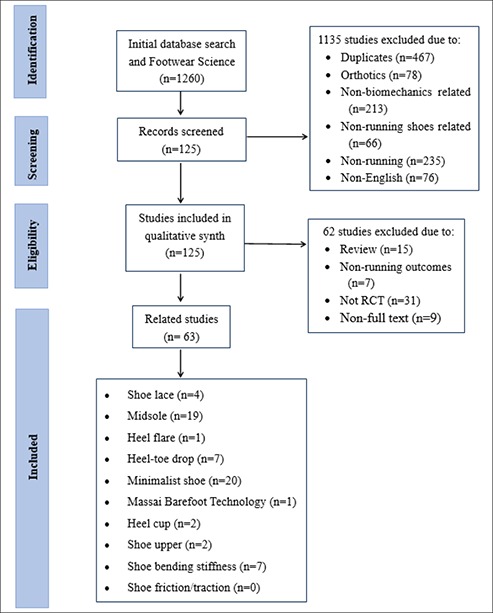
Search and screening procedure.
This systematic review included mainly laboratory-based biomechanical studies, a Physiotherapy Evidence Database (PEDro) scale (Macedo et al., 2010) was used to assess the quality of each included study. Studies with a PEDro score of less than 6 were deemed as low quality and were not included in the review. Two independent raters (authors XLS and XNZ) performed each step of the search and the PEDro quality assessment. When the steps or the quality scores differed between the raters, it would be discussed and consulted with the third rater (author WJF) to reach a final consensus.
The effects of different running shoe constructions on athletic performance-related and injuries variables were shown in Tables 1 to 9, respectively. The injury-related variables included cushioning, motion control, reduce sprain, lower pronation, lower plantar pressure in the braking phase. Meanwhile, the performance-related variables included energy consumption, running efficiency, kinematics, GRF, and plantar pressure in the propulsion phase (Wing et al., 2019).
Table 1.
Summary of the studies on shoelace effect (n = 4).
| Reference | Shoe Conditions |
Tested running Speed (m/s) |
Subject Info (Numbers, Sex, Age, Landing type) |
Testing Protocol |
Outcome | PEDro Score | |
|---|---|---|---|---|---|---|---|
| Performance related |
Injury related |
||||||
| Hong et al., (2011) | 1. Laced running shoes (LS); 2. Elastic-covered running shoes (ES) |
3.8 | 15, M, 20.3, rearfoot striker |
Treadmill running |
LS ↑ perceived forefoot cushioning, heel cup fitting, shoe heel width, shoe forefoot width & shoe length; LS ↓ max. rearfoot pronation; ES ↑ PP on 3rd, 4th & 5th MTH; → PP on other foot regions; → contact area for all regions. |
NA | 6 |
| Hagen and Hennig, (2009) |
1. REG6 (6 eyelets-regular lacing) 2. WEAK6 (6 eyelets-very weak lacing) 3. TIGHT6 (6 eyelets-very tight lacing) 4. EYE12 (eyelets 1 and 2) 5. EYE135(eyelets 1,3,5) 6. ALL7 (all 7 eyelets) |
3.3 | 20, M, 32, rearfoot striker | Overground running | Low lacing ↓ vGRF impact, PP on 3rd & 5th MTH than high lacing; → maximum pronation. |
EYE12↓ the peak vertical forces than REG6 and TIGHT6; TIGH 6, ALL7 and REGULA 6↓ loading rate & pronation velocities than EYE12, EYE135, and WEAK6; High lacing ↓ heel & lateral midfoot PP than tighter lacing; REG 6 ↑ loading rate & heel PP than ALL7. |
6 |
| Hagen et al., (2010) | 1. All 7 eyelet (ALL) 2. 6 eyelets-tight lacing (TIGHT6) 3. 6 eyelets-regular lacing (REG6) 4. Skipping the 6th eyelet (A57) |
3.3 | 14, M, 24, rearfoot striker |
Overground running | TIGHT6, ALL & A57 ↑ perceived stability than REG6; A57, REG6 ↑ comfort than other; TIGHT6 is the most uncomfortable. |
TIGHT6 ↑ PP on medial foot dorsum than other; ALL, A57 ↓ PP on tarsal bones. |
6 |
| Hagen et al., (2011) | 1. All 7 eyelets (ALL) 2. 6 eyelets-tight lacing (TIGHT6) 3. 6 eyelets-regular lacing (REG6) 4. Skipping the 6th eyelet (A57) |
Self-selected Speed | High level (21, M, NA, rearfoot striker); Low level (20, M, NA, rearfoot striker) |
Overground running | Low level: A57 ↑ perceived stability & comfort than REG6; High level: A57 ↓ perceived comfort than other. |
NA | 6 |
Max = maximum, PP = peak pressure, vGRF = vertical ground reaction force, MTH = metatarsal head, NA = Not available
Table 9.
Summary of the studies on bending stiffness effect (n = 7).
| Reference | Shoe Conditions |
Tested running Speed (m/s) |
Subject Info (Numbers, Sex, Age, Landing type) |
Testing Protocol |
Outcome | PEDro Score | |
|---|---|---|---|---|---|---|---|
| Performance related |
Injury related |
||||||
| Hoogkamer et al., (2018) | 1. New prototype shoe (NP) 2. Nike racing shoe (Nike) 3. Adidas racing shoe (Adidas) |
3.89, 4.44 & 5.0 | 18, M, 23.7, rearfoot striker |
Overground running | NP ↓ energetic cost than other two shoes |
NA | 6 |
| Madden et al., (2015) | 1. Control shoe (Control) 2. 185% Stiffer shoe (Stiff) |
Began at 2.2 m/s, with Speed increasing by 0.2 m/s every two min |
18, M, 28.0, rearfoot striker |
200 m indoor track running |
Stiff ↓ peak MTP bending & peak plantarflexion velocity; → running economy; 10 of 18 athletes improved their running economy across bending stiffness |
NA | 6 |
| Oh & Park, (2017) | 1. Stiffness 1.5 2. Stiffness 10 3. Stiffness 24.5 4. Stiffness 32.1 5. Stiffness 42.1 |
Under the anaerobic threshold |
19, NA, 24.7, rearfoot striker | Treadmill running |
Stiffer ↑ stance time & push-off time; Stiffer↓ MTP flexion but ↑ GRP moment arm from ankle; Stiffer↓ mean MTPJ angular impulse. |
NA | 6 |
| Roy & Stefanyshyn, (2006) | Bending stiffness: 1.18 N•mm (Control) 2.38 N•mm (Stiff) 3.45N•mm (Stiffest) |
Submaximal running speed | 13, NA, 27.0, rearfoot striker | Treadmill running |
Stiff ↓ max & rate of VO2 than Control; Stiffest ↑ peak ankle moments than Stiff & Control; Stiffest ↑ mean energy absorbed at ankle joint than Control; Stiff ↓ 1% metabolic energy than Control; → MTP, knee & hip moments, & EMG RMS. |
NA | 6 |
| Stefanyshyn & Fusco, (2004) | 1.Standard shoe (Control) 2.Stiffness 42 (S42) 3.Stiffness 90 (S90) 4.Stiffness 120 (S120) |
Maximal effort | 34, M =30, F= 4, AGE, rearfoot striker |
20m sprint | Stiffer shoes (S42, S90, S120) ↓ sprint times than Control. | NA | 6 |
| Stefanyshyn & Nigg, (2000) | 1.Stiffness 0.04 (Control) 2.Stiffness 0.25 (Medium) 3.Stiffness 0.38 (Stiff)-1 |
4.0±0.4 | 5, M, 32.0, rearfoot striker | Overground running | Stiff shoe ↓energy lost at MTP than Medium & Control; Medium & Stiff ↓ energy absorbed at MTP than Control; → energy generation & absorption at ankle, knee & hip. |
NA | 6 |
| Willwacher et al., (2013) |
1.Shoe 0.65-0.76 (Control) 2.Shoe 5.29-7.11 (Medium-S) 3.Shoe 16.16-17.10 (High-S) |
3.5 m/s ± 5%. | 19, M, 25.3, rearfoot striker | Overground running |
Medium-S & High-S ↑ GRF lever arms for all joints than Control; Medium-S ↓ mean ankle joint moments than Control & High-S; High-S ↓ MTP negative work but ↑ positive work than Control and Medium-S; Medium-S & High-S ↑ stance time & push-off time than Control; Control ↑ MTP RoM & maximum dorsiflexion than Medium-S & High-S. |
NA | 6 |
Min = Minute, MTP = metatarsophalangeal, VO2 = oxygen consumption, EMG = electromyography, RMS = root mean square, RoM = range of motion, NA = Not available.
Results
Overview of review data
The full search yielded 1260 articles (Figure 1). After excluding the articles which were duplicates, irrelevant and low PEDro scores (i.e., less than 6), a total of 63 articles were included into subsequent analysis.
Effects of shoelace
Four included articles (Table 1) investigated the effects of shoelace on running biomechanics. Three articles compared the effect of different shoelace patterns (6 eyelets-regular lacing, 6 eyelets-tight lacing, all 7 eyelets) on the biomechanics during overground running (Hagen and Feiler, 2011; Hagen and Hennig, 2009; Hagen et al., 2010). One article investigated different running mechanics between laced and elastic-covered running shoes (Hong et al., 2011). As shown in Table 1, 6 eyelets-regular lacing was the most unstable than other patterns, and showed higher loading rate and heel peak pressure than all 7 eyelets patterns (Hagen and Hennig, 2009; Hagen et al., 2010). Additionally, 6 eyelets-tight lacing was considered as the most uncomfortable (Hagen et al., 2010).
Effects of shoe midsole
Nineteen included articles investigated the hardness (n = 13), thickness (n = 2), and material properties (n = 4) of the midsoles, which would influence lower extremity biomechanics that is related to injury or athletic performance (Table 2). The PEDro score was “8” for only one, all of the other articles were equal to “6. 4”. Out of 13 studies (Stefanyshyn and Nigg, 2000; Willwacher et al., 2014; Maclean et al., 2009; Hardin et al., 2004) demonstrated that the increase in the stiffness/hardness of midsoles from Asker C40 to Asker C70 would be related to running performance as indicated by the reduced energy lost at metatarsophalangeal and maximum rearfoot eversion velocity, and increased positive work at metatarsophalangeal and peak ankle dorsiflexion velocity in running. However, 4 out of 13 studies (Hardin and Hamill, 2002; Nigg and Gerin-Lajoie, 2011; Teoh et al., 2013; Wakeling et al., 2002) showed no significant effects on peak tibial acceleration, running velocity, stride duration and all frequency spectral or time domain parameters of gastrocnemius medialis, biceps femoris and vastus medialis variables. Among the related studies, two included studies (Sterzing et al., 2013; Teoh et al., 2013) demonstrated soft midsoles could reduce impact forces and loading rates, thereby minimising the risk of impact-related injuries.
Table 2.
Summary of the studies on midsole effect (n = 19).
| Reference | Shoe Conditions |
Tested running Speed (m/s) |
Subject Info (Numbers, Sex, Age, Landing type) |
Testing Protocol |
Outcome | PEDro Score | |
|---|---|---|---|---|---|---|---|
| Performance related |
Injury related |
||||||
| Baltich et al. (2015) | 1. Asker C40 (Soft) 2. Asker C52 (Medium) 3. Asker C65 (Hard) |
3.33 ± 0.15 | 93, M=47, F=46, rearfoot striker Group1:16-20yr Group2:21-35yr Group3:36-60yr Group4:61-75 yr |
30-m overground running |
Soft ↑ ankle stiffness than Medium & Hard; Female Soft ↑ knee stiffness than Medium&Hard; Male Soft ↑ knee stiffness than Medium |
Soft ↑ vGRF impact peak than Medium & Hard |
6 |
| Chambon et al. (2014) | 1. Barefoot (BF) 2. 0-mm midsole (MT0) 3. 2-mm midsole (MT2) 4. 4-mm midsole (MT4) 5. 8-mm midsole (MT8) 6. 16-mm midsole (MT16) |
3.3 | 15, M, 23.9, rearfoot striker | Overground running | BF & MT0 ↓ stance-phase duration than MT16; BF ↑ initial plantarflexion than shoe condition; BF ↑ strike index than shoe condition; BF ↑ ankle dorsiflexion but ↓ knee flexion during stance; BF ↓ max knee joint moments than MT0 & MT4; → hip & knee flexion angles at TD. |
→ peak GRF impact, peak tibial acceleration. |
6 |
| Dixon et al., (2015) |
1. A neutral shoe with an average hardness of 52 Asker C (CON); 2. Medially-52 Asker C lateral -60 Asker C (LAT1); 3. Medially-52 Asker C lateral -70 Asker C (LAT2); |
3 | 10, F, >50 years, NA | Overground running | LAT1 ↓adduction movement than CON |
LAT2↑ max 1st loading rate & eversion movement than CON; → peak knee abductor moment and peak rearfoot eversion. |
6 |
| Hardin & Hamill, (2002) | 1. Shore A40 (Soft) 2. Shore A55 midsole (Medium) 3. Shore A70 midsole (Hard) |
3.4 | 24, M, NA, rearfoot striker | Treadmill downhill running | → peak tibial acceleration. | NA | 6 |
| Hardin et al., (2004) | 1. Shore A40 midsole (Soft) 2. Shore A70 midsole (Hard) |
3.4 | 12, M, NA, rearfoot striker | Treadmill running | Hard midsole ↑ peak ankle dorsiflexion velocity. |
NA | 6 |
| Law et al. (2018) | 1.1-mm midsole thickness (MT1) 2.5-mm midsole thickness (MT5) 3.9-mm midsole thickness (MT9) 4.21-mm midsole thickness (MT21) 5.25-mm midsole thickness (MT25) 29-mm midsole thickness (MT29); |
Self-paced | 15, M, 31.4, rearfoot striker | Treadmill running | Thinner midsole (MT1 & MT5) ↓ contact time than MT25 & MT29; → footstrike angle, cadence & stride length. |
Thinner midsole (MT1 & MT5) ↑ vertical loading rates than (MT25 & MT29). |
6 |
| Maclean, Davis, & Hamill, (2009) | 1.Asker C70 midsole (Hard) 2.Asker C55 midsole (Medium) 3.Asker C40 (Soft) |
4.0 ± 5% | 12, F, 19-35, Rearfoot striker with iliotibial band or patellofemoral pain syndrome | Overground running | Hard shoe ↓ Max rearfoot eversion velocity. |
NA | 6 |
| Nigg et al., (2011) | 1.Asker C40 (Soft) 2.Asker C52 (Medium) 3.Asker C65 (Hard) |
3.33 ± 0.17 | 54, M=36, F=18, 33.9, rearfoot striker | 30-m overground running |
→ all frequency spectral or time domain parameters of gastrocnemius medialis, biceps femoris and vastus medialis. |
NA | 6 |
| Oriwol et al., (2011) |
7 dual-density shoe condition: Medial dual density midsole elements with 62 Asker C 1. M1 is the neutral shoe. 2. M2 – 36 mm 3. M3 – 52 mm 4. M4 – 58 mm 5. M5 – 79 mm 6. M6 – 89 mm 7. M7 – 104 mm |
3.5 ± 0.1 | 16, M, 29.4, rearfoot striker |
Overground running | → all rearfoot motion variables. |
NA | 6 |
| Sterzing et al., (2013) | All shoe with Asker C50 MF 1.Soft-RF/Soft-FF (SS) 2.Medium-RF/Medium- FF (MM) 3.Hard-RF/Hard-FF (HH) 4.Soft-RF/Hard-FF (SH) 5.Hard-RF/Soft-FF (HS) |
3.3 ± 0.1 | 28, M, 23.8, rearfoot striker |
13-m overground running |
Softer ↓ max plantarflexion & pronation velocity than stiffer shoes; MM ↓ sagittal footstrike angle than SH & HS; → Contact time |
SH, SS, & MM ↓ max 1st loading rate than HH, HS; SH ↓ max 2nd loading rate than MM, HH & HS; SS ↓ max 2nd loading rate than HH & HS; MM ↓ max 2nd loading rate than HH. |
6 |
| Sterzing et al. (2015) | 1. Soft medial/Hard Lateral (SMH) 2.Medium medial/Medium lateral (MMM) 3.Hard medial/Soft lateral (HMS) 4.Very Hard medial/Very Soft lateral (VHMVS) |
3.3 ±10% | 24, M, 21.8, rearfoot striker |
Overground running | SMH ↑ perceived softer at medial midsole than HMS; MMM ↑ perceived softer at medial midsole than HMS & VHMVS; SMH ↑ ground contact time than HMS & VHMVS; SMH ↑ max 1st loading rate MMM & VHMVS; VHMVS ↓ maximum inversion at touchdown than all other shoe condition; →Cushioning, stability & propulsion during push-off |
VHMVS ↑ PP at medial region than SMH & MMM; VHMVS ↑ force-time integral at rearfoot than HMS & SMH; VHMVSC force-time integral at medical region than all other shoes; SMH ↓ force-time integral at centre than MMM & VHMVS; SMH ↑ force-time integral at lateral region than all other shoes |
6 |
| Stefanyshyn et al., (2000) | 1.Control shoe 2. Stiff midsole shoe (Stiff) 3.Very stiff midsole shoe (Very stiff) |
4.0 ± 0.4 | 5, M, 32, rearfoot striker | Overground running | Stiff ↓ energy lost at MTP; → energy generation & absorption at ankle, knee & hip; → energy stored & reused at MTP. |
NA | 6 |
| Teoh et al., (2013) |
1. medial stiffness 1C, lateral stiffness 1.6C (VSS) 2. same medial & lateral stiffness 1C (CS ) |
self- selected speeds |
M=16, F=14, 22.6, | Overground running | →running speed |
VSS ↓ the peak EKAM than CS; VSS ↓ the maximum medial GRF than CS ↑ in anterior GRF than CS. |
6 |
| Theisen et al., (2014) |
1.Soft midsole shoe (Soft) 2.Hard midsole shoe (Hard) |
2.61-2.69 | 247, M=136, F=111, 41.8, leisure-time distance runners |
Overground running | NA | → running-related injury. → Injury location, type, severity or category. |
8 |
| Willwacher et al. (2014) |
1.Control (Control) 2.Medium stiffness (Medium) 3.High stiffness (High) |
3.5 ±5% | 19, M, 25.3, rearfoot striker |
25m overground running |
Medium & High ↑ overall Stance time & push-off time than Control; High ↓ Negative work & ↑ positive work at MTP than Control & Medium. →Effective contact time & braking time. |
NA | 6 |
| Wakeling, & Nigg, (2002) | 1.Shore C61 midsole (Hard) 2.Shore C41 midsole (Soft) |
2.5-4.2 | 3, M, 26, NA 3, F, 23.3, NA |
Overground running | →EMG intensities varied in different shoe condition; → running velocity, stride duration |
NA | 6 |
| Wang et al. (2012) | 1.Ethylene Vinyl Acetate (EVA) 2.Polyurethane -1 (PU1) 3.Polyurethane -2 (PU2) |
NA | 15, M, 21.2, rearfoot striker | Overground outdoor running | EVA & PU-1 ↓ peak forces than PU2 at all running distance; PU-1 ↓ peak forces at 200-300 km than 0 km; EVA ↑ energy return performance than PU1&PU2 |
NA | 6 |
| Wunsch et al., (2016) |
1.Leaf spring-structured midsole (Leaf) 2.Standard foam (Foam) |
2 mmol/l blood lactate speed |
10, M, 33.1, long-distance rearfoot striker | Overground running | Leaf ↑ stride length but ↓ stride rate & oxygen consumption than foam; → strike pattern |
NA | 6 |
| Wunsch et al., (2017) |
1.Leaf spring-structured midsole (Leaf) 2.Standard foam (Foam) |
3.0 ± 0.2 | 9, M, 32.9, long-distance rearfoot striker | Indoor track | LEAF↓ energy absorption at hip joint as well as energy generation at ankle joint; LEAF↓ muscle forces of the soleus, gastrocnemius lateralis & gastrocnemius medialis |
NA | 6 |
Yr = year, vGRF = vertical ground reaction force, MF = midfoot, RF = rearfoot, FF = forefoot, Max = maximum, MTP = metatarsophalangeal, VO2 = oxygen consumption, EMG = electromyography, RMS = root mean square, RoM = range of motion, NA = Not available, TD= Touch down.
Two out of 19 articles found that thicker midsoles can provide better cushioning effects and attenuate shock during impacts but may also decrease plantar sensations of a foot (Robbins and Gouw, 1991).
Effects of heel flare
Only one included article (Table 3, Figure 2) investigated the effects of heel flare construction (lateral heel flare of 25°, no lateral heel flare 0°, rounded heel) on running biomechanics. However, there were no significant differences in tibiocalcaneal and ankle kinematics (initial inversion, maximal eversion velocity) among heel flare conditions (Stacoff et al., 2001).
Table 3.
Summary of the studies on heel flare effect (n = 1.)
| Reference | Shoe Conditions |
Tested running Speed (m/s) |
Subject Info (Numbers, Sex, Age, Landing type) |
Testing Protocol |
Outcome | PEDro Score | |
|---|---|---|---|---|---|---|---|
| Performance related |
Injury related |
||||||
| Stacoff et al., (2001) | 1. Lateral heel flare of 25° (Flared) 2. No lateral heel flare 0° (Straight) 3. Rounded heel (Round). |
2.5–3 | 5, M, 28.6, rearfoot striker | Overground running | → Tibiocalcaneal rotations & shoe eversion; → Initial inversion, max eversion velocity, max & total eversion on bone, & total internal tibial rotation. |
NA | 6 |
NA = Not available
Figure 2.
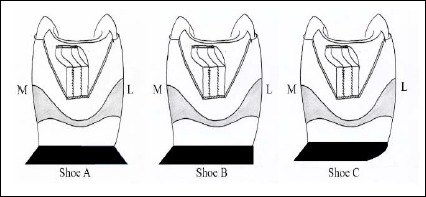
Three different heel flares.
Effects of heel–toe drop
Seven included articles (Table 4) investigated the effects of heel-toe drop on running. The PEDro scores of 5 articles were 6 and the other two were 7. As shown in Table 4, all these studies investigated different performance-related variables. Shoes with higher drops were found to be related to increase knee adduction (Malisoux et al., 2016), knee excursion, knee flexion at midstance, stance time (TenBroek et al., 2014) and reduce tibial acceleration, initial ankle plantarflexion, initial knee extension angle (TenBroek et al., 2014). For running mechanics, shoes with higher drops would increase net knee flexion moment in the push-off, but reduced net joint ankle flexion moment during braking phase (Besson et al., 2017). In a randomized controlled study (Malisoux et al., 2016), cox proportional hazards regression was used to compute the hazard rates in the exposure groups, using first-time injury as the primary outcome and concluded that there was no significant difference of overall injury risk among different heel-toe drops.
Table 4.
Summary of the studies on heel-toe drop effect (n = 7).
| Reference | Shoe Conditions |
Tested running Speed (m/s) |
Subject Info (Numbers, Sex, Age, Landing type) |
Testing Protocol |
Outcome | PEDro Score | |
|---|---|---|---|---|---|---|---|
| Performance related |
Injury related |
||||||
| Besson et al., (2017) | 1. Heel–toe drop 10 mm (D10) 2. Heel–toe drop 6 mm (D6) 3. Heel–toe drop 0 mm (D0) |
Preferred speed |
14, F, 21.4, rearfoot striker |
Overground running | D0 ↓ Foot ground angle, ankle dorsiflexion at initial & last 40% stance phase than D6 & D10; D0 ↑ AP GRF during first part of stance phase than D6 & D10; D0 ↑ push-of time but ↓ braking time than D6 & D10; D0 ↑ net joint ankle flexion moment during braking phase ↓ net knee flexion moment in the push-of phase compared to D6 & D10; → knee & hip angles, & stance phase duration. |
NA | 6 |
| Chambon et al. (2015) | 1. Heel–toe drop 0 mm (D0) 2. Heel–toe drop 4 mm (D4) 3. Heel–toe drop 8 mm (D8) 4. Barefoot (BF) |
Preferred Speed |
12, M, 21.8, rearfoot striker |
Treadmill & overground running | NA | Overground: D0 ↓ foot ground angle at touchdown than D8; BF↑ loading rate than D8; Treadmill: BF & D0 ↓ foot ground angles than D8; BF & D0 ↑ ankle flexion during stance phase than D8; BF ↓ knee flexion RoM than D4 & D8; BF ↓ peak & loading rate of vGRF than D8; → initial ankle angle |
6 |
| Malisoux et al., (2017) | 1. Heel–toe drop 10 mm (D10) 2. Heel–toe drop 6 mm (D6) 3. Heel–toe drop 0 mm (D0) |
Preferred speed |
59, M=42, F=17, rearfoot striker | Treadmill running | D6 & D10 ↑ knee adduction than D0; → contact time, flight time, stride frequency, stride length, hip vertical displacement |
NA | 7 |
| Malisoux et al. (2016) | 1. Heel–toe drop 10 mm (D10) 2. Heel–toe drop 6 mm (D6) 3. Heel–toe drop 0 mm (D0) |
2.64 | 553, M&F, D10=176; D6=190; D0=187; 38; rearfoot striker (occasional & regular) |
Outdoor overground running |
NA | D6 & D0 ↓ injury risk in occasional runners but ↑ injury risk in regular runners; → overall injury risk for all participant |
7 |
| Mits et al. (2015) | 1. Heel–toe drop 12 mm (D12) 2. Heel–toe drop 8 mm (D8) 3. Heel–toe drop 4 mm (D4) 4. Heel–toe drop 0 mm (D0) |
0.97±10% | 14, M, 27, rearfoot striker |
Overground running | D8, & D12 ↑ max AP CoP excursion than D4; D8 ↑ range of AP CoP than D0; → ML CoP variables. |
NA | 6 |
| TenBroek et al. (2014) | Forefoot–rearfoot offset: 1.3–3 mm offset (Thin) 2.9–14 mm offset (Medium) 3.12–24 mm offset (Thick) |
3.0 | 10, M, 18-55, rearfoot striker | Treadmill running | Thin & Medium ↑ initial ankle plantarflexion than other; Thin↑ initial knee extension angle than other; Thick ↑ knee flexion at midstance than Medium; Thick ↑ knee excursion than Thin & Medium; Thick ↑ stance time than Thin & Medium. |
NA | 6 |
| TenBroek et al., (2012) | Forefoot–rearfoot offset: 1. 3–3 mm offset (Thin) 2. 9–14 mm offset (Medium) 3. 12–24 mm offset (Thick) 4. Barefoot (BF) |
3.0 | 10, M, 18-55, rearfoot striker |
Treadmill running |
Barefoot & Thin ↓ initial dorsiflexion than Medium & Thick; BF & Thin ↑ leg segment vertical at TD than Thick; Medium & Thick↑ knee flexion excursion than Thin & BF; Thin ↑ knee excursion than BF; Thin ↑eversion excursion than all other conditions; Thin ↑ stance time than Medium & Thick Barefoot & Thin ↑ peak tibial acceleration than other condition; Medium ↑ peak tibial acceleration than Thick |
NA | 6 |
Max = maximum, RoM = range of motion, GRF = ground reaction force, AP = anterior-posterior direction, ML = medio-lateral direction, CoP = centre of pressure, NA = Not available.
Effects of minimalist shoe
Twenty included articles (Table 5) investigated the effects of minimalist shoe on running. The PEDro scores of 18 articles were 6 and the other two were 7. Three included studies showed that minimalist shoes would improve running economy (Fuller et al., 2017b; Michael et al., 2014; Warne et al., 2014) and other three included studies indicated that minimalist shoes would increase the cross-sectional area, stiffness and impulse of Achilles tendon compared with the conventional shoes (Histen et al., 2017; Joseph et al., 2017; Sinclair and Sant, 2016). Furthermore, participants wearing minimalist shoes promote midfoot and/or forefoot running, with smaller footstrike angles (Fuller et al., 2016; Moore et al., 2014), more anteriorly shift of center of pressure (Bergstra et al., 2015), greater metatarsophalangeal and ankle loading but smaller knee loading (Firminger and Edwards, 2016), compared to conventional shoes.
Table 5.
Summary of the studies on minimalist shoe effect (n = 20).
| Reference | Shoe Conditions |
Tested running Speed (m/s) |
Subject Info (Numbers, Sex, Age, Landing type) |
Testing Protocol |
Outcome | PEDro Score | |
|---|---|---|---|---|---|---|---|
| Performance related |
Injury related |
||||||
| Bergstra et al., (2015) |
1. Minimalist shoe (MS) 2. Standard running shoes (SS) |
MS=3.38; SS=3.41 |
18, F, AGE, rearfoot striker | Overground running | MS ↓ stance time than Control; → shoe comfort & landing strategy |
MS ↑ peak & mean pressure in medial, central & lateral forefoot during the entire contact phase than SS |
6 |
| Bonacci et al., (2013) |
1. Barefoot (BF); 2. Minimalist shoe (MS); 3. Racing flat shoe (Race); 4. Athlete’s regular shoe (RS) |
4.48 ±5% | 22, M=8, F=14, 29.2, highly trained runners | Overground running | BF ↓ knee flexion during midstance, peak internal knee extension, knee abduction moments negative work done, & initial dorsiflexion than shod condition; BF ↑ peak ankle power generation & positive work done than MS & Race |
NA | 6 |
| Campitelli et al., (2016) | 1. Vibram minimalist shoe (MS) 2. Conventional shoe (CS) |
NA | 25-M; 16-F; 20-33, rearfoot striker |
24-week training programme |
MS ↑ thickness of abductor hallucis muscle; → thickness of abductor hallucis muscle. |
NA | 7 |
| Firminger & Edwards, (2016) |
1. Minimalist shoe (MS) 2. Control shoe (Control) |
Preferred speed | 15, M, 26.2, rearfoot striker |
Overground running | MS ↑ MTP eccentric work but ↓ MTP concentric work; MS ↑ peak plantarflexion moment, angular impulse, cumulative impulse & eccentric work; MS ↓ peak knee moment, angular impulse & cumulative impulse; → peak MTP moment, angular impulse & cumulative impulse; → knee concentric & eccentric work; → concentric work at ankle |
MS ↑ MTP & ankle loading; MS ↓ knee loading |
6 |
| Fredericks et al., (2015) | 1. Barefoot (BF) 2. Minimalist shoe (MS) 3. Personal shoe (PS) 4. Standard shoe (CS) |
2.5 3.0 3.5 4.0 |
26, M=13, F=13, 26.5, | Treadmill running | For rearfoot strike BF ↑ plantarflexion at toe-off than all other shoes; MS ↑ plantarflexion at toe-off than CS; For non-rearfoot strike MS & BF ↑ plantarflexion toe-off than PS; For all foot strike type PS ↑ step length than BF & MS; →foot strike knee angle or toe-off knee angle. |
NA | 6 |
| Fuller et al., (2017) | 1. Conventional shoe (CS) 2. Minimalist shoe (MS) |
NA | 61, M, 27, rearfoot strikers |
Gradually increased shoe wearing time over 26-week running |
NA | 11 of 30 runners sustained an injury in CS; 16 of 31 runners in MS; MS ↑ knee & calf pain than CS |
7 |
| Fuller et a., (2016) | 1. Conventional shoe (CS) 2. Minimalist shoe (MS) |
5.0 | 26, M, 30.0, rearfoot striker with no experience of minimalist shoes |
Overground running |
MS ↓ initial ankle angle but ↑ strike index; MS ↑ negative & positive work at ankle; MS ↓ negative & positive work at knee; → foot strike pattern |
NA | 6 |
| Goss et al., (2013) | 1. Minimalist shoe (MS) 2. Traditional training shoe (TTS) 3. Not training shoe (Control) |
NA | 47, F, 24, rearfoot striker |
Athletic training | MS & TTS ↑ MPJ moments in 0°MPJ dorsal flexion than Control; MS ↑ toe flexor muscles strength in 25° MPJ dorsal flexion than TTS |
NA | 6 |
| Histen et al., (2017) | 1. Minimalist shoe (MS) 2. Conventional shoe (CS) |
NA | 23, M (11 traditional runners, 12 minimalist) 8, F (6 traditional runner, 2 minimalist runner); traditional runner: rearfoot striker Minimalist runner: forefoot/midfoot strike |
NA | Minimalist ↑cross sectional area of AT, stiffness, Young’s modulus, ATs stress during MVIC of plantar flexor muscles |
NA | 6 |
| Joseph et al., (2017) | Minimalist shoe | NA | F =15; M=7; AGE, traditionally shod runner |
Transitioned to minimalist shoe running- 12 weeks |
Male ↑ force, cross sectional area, stiffness & Young’s modulus of AT than women; Male ↓ elongation of AT than women |
NA | 6 |
| Kahle et al., (2016) | 1. Conventional shoe (CS) 2. Minimalist shoe (MS) |
Ran at 70% VO2max |
12, M, NA, recreational rearfoot striker |
Treadmill running |
→VO2, heart rate, VE, EMG of gastrocnemius & tibialis anterior |
NA | 6 |
| MaxRobert et al., (2013) | 1. Minimalist shoe (MS) 2. Barefoot (BF) 3. Neutral running shoe (NS) |
3.3 ± 5% | 14, M, AGE, 7 Rearfoot & 7 Forefoot striker |
Overground running |
BF & MS ↑ peak propulsive GRF than NS; BF& MS ↓ peak ankle dorsiflexion, peak knee flexion, knee flexion RoM than NS; MS ↑ plantar flexor moment than BF & NS; MS ↓ peak ankle power than BF & NS; BF & MS ↓ peak knee extension moment than NS; BF & MS ↓ initial peak eccentric knee power than NS |
BF & MS ↑ loading rates than NS in Rearfoot group |
6 |
| Mccallion et al., (2014) |
1. Barefoot (BF) 2. Minimalist shoe (MS) 3. Conventional shoe (CS) |
3.61 ± 0.28; 4.47 ± 0.36 |
14, M, 25, rearfoot striker |
Treadmill running | MS ↑ stride duration & flight time than BF; CS ↑ contact time than BF & MS; BF ↑ stride frequency than CS &MS. |
NA | 6 |
| Moody et al., (2018) | 1. Mizuno Wave Rider (Mizuno) 2. Saucony Kinvara (Saucony) 3. Altra The One (Altra) 4. Vibram El-X/Entrada (Vibram) 5. Barefoot running (Barefoot) |
3.3 | F=4; 25.2; rearfoot striker M=6; 26.8, rearfoot striker |
Treadmill running | Mizuno ↑ ground time & vertical oscillation but ↓ stride rate than Barefoot; → max knee flexion during stance and swing, hip flexion & extension, ankle angle at touchdown & toe-off |
NA | 6 |
| Moore et al., (2014) | 1. Barefoot (BF) 2. Minimalist shoe (MS) 3. Conventional shoe (CS) |
3.8 | 10, M=9, F=1, 21.0, rearfoot striker | Overground running; 7-week minimalist footwear transition |
CS ↑ number of rearfoot strike trials than other condition; MS ↑ number of midfoot & forefoot strike trials than other shoes; CS↑ latest occurrence of peak impact force; BF ↓ ground contact time than others. |
BF & MS ↑ loading rate than CS; → magnitude of peak impact force |
6 |
| Sinclair et al., (2016) | 1. Barefoot (BF) 2. Crossfit shoe (Cross) 3. Minimalist shoe (MS) 4. Conventional shoe (CS) |
4.0 ± 5% | 13, M, 27.81, rearfoot striker |
Overground running | BF & MS ↑ peak Achilles tendon force than CS; BF & MS ↑ Achilles tendon impulse than CS; BF & MS ↑ Time to peak Achilles tendon force than CS; BF, Cross & MS ↑Achilles tendon load rate than CS. |
NA | 6 |
| Sinclair et al., (2016) |
1. Minimalist (MS) 2. Maximalist (Max) 3. Conventional shoe (CS) |
4.0 ± 5% | 20, M, 24.24, rearfoot striker |
Overground running | CS & Max ↑ peak knee flexion; knee RoM, peak contact loading (force, pressure, average & instantaneous loading rates, impulse, force per mile) & step length than MS; MS ↑ initial plantarflexion & number of steps per mile. |
CS & Max ↑ peak patellofemoral force & pressure than MS; |
6 |
| Sinclair et al., (2016) | 1. Barefoot (BF) 2. Minimalist shoe (MS), 3. Conventional shoe (CS) 4. Cross-fit (CF) |
4.0 ± 5% | 12, M, 23.1, rearfoot striker |
Overground running | BF ↓ time to peak AT force than CF |
BF & MS ↑ peak AT force, the time to peak AT load than CS; CS ↓ average load rate, instantaneous AT load rate of AT than all other conditions; BF & MS ↑ AT impulse than CS; |
6 |
| Willy & Davis, (2014) | 1. Minimalist shoe (MS) 2. Conventional shoe (CS) |
3.35 | 14, M, 24.8, rearfoot striker |
Treadmill running | → Step length, step rate; MS↑ knee flexion, dorsiflexion angle at footstrike |
MS ↑ Vertical impact peak & average vertical loading rate |
6 |
| Warne et al., (2014) | 1. Conventional shoe (CS) 2. Minimalist shoe (MS) |
3.06 | 10, F, 21, rearfoot striker |
Treadmill running; 4-week minimalist footwear transition |
NA | MS ↑ max force & pressure than CS. |
6 |
AT = Achilles tendons, MVIC = maximal voluntary isometric contraction, VE = pulmonary ventilation, EMG = electromyography, VO2 = oxygen consumption, RoM = range of motion, MTP = metatarsophalangeal, NA = not available.
Massai Barefoot Technology (MBT)
Only one included article (Table 6) investigated the effects of MBT on running kinematics and kinetics with a PEDro score of 6. Specifically, running in MBT shoes was related to larger dorsiflexion at initial contact and mid-stance, reduced peak ankle moments and power, and smaller medial and anterior GRF peak than the conventional shoes (Boyer and Andriacchi, 2009).
Table 6.
Summary of the studies on Massai Barefoot Technology (MBT) effect (n = 1).
| Reference | Shoe Conditions |
Tested running Speed (m/s) |
Subject Info (Numbers, Sex, Age, Landing type) |
Testing Protocol |
Outcome | PEDro Score | |
|---|---|---|---|---|---|---|---|
| Performance related |
Injury related |
||||||
| Boyer & Andriacchi, (2009) | 1.Conventional flat shoe (CS) 2.Rounded sole MBT (MBT) |
Preferred Speed |
11=F, 28.9, NA 8=M,32.6, NA |
Overground running | MBT ↑ ankle dorsi-flexion at heel-strike & mid-stance than CS; MBT ↓ peak ankle plantar & dorsi-flexion moments, peak ankle joint power than CS. |
MBT ↓ 1st medial & anterior GRF peaks than CS. | 6 |
GRF = ground reaction force
Effects of heel cup
Two included articles (Table 7) investigated the effects of heel cup on running tasks. Both PEDro scores were 6. Li and colleagues (2018) investigated the effect of 3D printed and customised heel cup on plantar pressure, stress, and pain score variables. Their results showed that heel cup reduced peak plantar pressure, stress on plantar fascia and calcaneus bone and self-reported pain significantly after wearing heel cups for 4 weeks. Another article reported that plastic heel cup increased heel pad thickness than rubber heel cup and that rubber and plastic heel cup increased shock absorption of heel than no heel cup condition (Wang et al., 1994).
Table 7.
Summary of the studies on heel cup effect (n = 2).
| Reference | Shoe Conditions |
Tested running Speed (m/s) |
Subject Info (Numbers, Sex, Age, Landing type) |
Testing Protocol |
Outcome | PEDro Score | |
|---|---|---|---|---|---|---|---|
| Performance related |
Injury related |
||||||
| Li et al., (2018) | 1. Heel cup (HC) 2. Non-heel cup (N-HC) |
NA | 16, F=6, M=10, NA | jogging | HC ↓ load on plantar fascia & calcaneus bone after wearing heel cups for 4 weeks | HC ↓ self-reported pain than N-HC. | 6 |
| Wang et al., (1994) | 1. Rubber heel cup 1 (Rub-1) 2. Rubber heel cup 2 (Rub-2) 3. Plastic heel cup (Plastic) 4. No-heel cup |
2.78 | 16, NA, AGE, volunteers without heel pain & 6 with heel pain |
Treadmill | Plastic ↑ heel pad thickness than rubber heel cup; Rubber & Plastic ↑ shock absorption of heel than no heel cups |
NA | 6 |
NA = not available
Effects of shoe upper
Two included articles (Table 8) investigated the effects of shoe upper on running biomechanics. Both PEDro scores were equal to 6. These articles investigated the influence of different shoe upper constructions on the plantar pressure distribution (Onodera et al., 2015), joint angle in sagittal, frontal, and transversal planes, and ground reaction force (Onodera et al., 2017). Structured shoe upper increased contact time and peak pressure at midsole than minimalistic shoe upper (Onodera et al., 2015).
Table 8.
Summary of the studies on shoe upper effect (n=2).
| Reference | Shoe Conditions |
Tested running Speed (m/s) |
Subject Info (Numbers, Sex, Age, Landing type) |
Testing Protocol |
Outcome | PEDro Score | |
|---|---|---|---|---|---|---|---|
| Performance related |
Injury related |
||||||
| Onodera et al., (2015) | 1. Structured upper (Structure) 2. Minimalistic upper (Minimal) |
2.64-2.91 | 20, M, 33.3, rearfoot striker |
Overground running | Structure ↑ contact time for total midfoot & lateral forefoot than Minimal; → contact area |
Minimal ↑ PP in total area, rearfoot & medial forefoot than Structure; Minimal ↓ PP at midfoot than Structure |
6 |
| Onodera et al., (2017) | 1. Structured upper (Structure). 2. Minimalist upper (Minimal). 3. Low Resilience cushioning material (Low) 4. High Resilience cushioning material (High) |
2.64-2.92 | 27, M, 36.0, Rearfoot striker | Overground running | Accuracy higher than 85% was achieved by considering only 25 variables to differentiate upper structures; a mean accuracy of 93.4% with 25 variables, & 95.6% with 150 variables. |
NA | 6 |
NA = not available
Effects of shoe bending stiffness
Seven included articles (Table 9) investigated shoe bending stiffness on running. All the PEDro scores were equal to 6. In performance perspective, 5 out of the 7 included studies (Hoogkamer et al., 2018; Stefanyshyn and Nigg, 2000; Roy and Stefanyshyn, 2006; Stefanyshyn and Fusco, 2004; Madden et al., 2015) showed that increasing bending stiffness could improve running performance and economy, as indicated by the reduction of energetic cost, maximum VO2, energy lost at metatarsophalangeal joint, and sprint time in stiffer shoes. One of the included studies (Madden et al., 2015) found that there was no difference in running economy among tested shoe conditions. The other two studies (Oh and Park, 2017; Willwacher et al., 2013) showed that stiffer shoes reduced stance time, negative work and flexion of metatarsophalangeal joint, and increased GRF lever arms for all joints.
Discussion
This study summarised the effect of various footwear constructions on running biomechanics that is related to performance and injury potentials. The main results were: 1) increasing the stiffness of running shoes at the optimal range can benefit performance. Some included studies showed stiffer shoe would reduce energetic cost (Hoogkamer et al., 2018), maximum VO2, energy lost at metatarsophalangeal joint (Roy and Stefanyshyn, 2006; Stefanyshyn and Nigg, 2000), and sprint time (Stefanyshyn and Fusco, 2004); 2) softer midsoles can reduce the impact forces and loading rates (Sterzing et al., 2013; Teoh et al., 2013); 3) thicker midsoles could provide better cushioning effects and attenuate shock during impacts but might also decrease plantar sensations of a foot (Robbins and Gouw, 1991); 4) minimalist shoes can improve running economy (Fuller et al., 2017b; Michael et al., 2014; Warne et al., 2014; Ridge et al., 2013), increase the cross-sectional area and stiffness of Achilles tendon but it would increase the metatarsophalangeal and ankle joint loading compared to the conventional shoes (Histen et al., 2017; Joseph et al., 2017; Sinclair and Sant, 2016); 5) the shoe constructions included shoe lace, heel flare, heel-toe drop, Masai Barefoot Technologies, heel cup, and shoe upper did not show clear influence on biomechanics (Hong et al., 2011; Stacoff et al., 2001; Malisoux et al., 2017; Boyer and Andriacchi, 2009; Li et al., 2018; Onodera et al., 2015).
Effects of shoelace
Amongst the included articles, Hagen and Hennig (2009) typically examined the influence of the number of laced eyelets used (e.g. 1, 2, 3, 6 and 7) and lacing tightness (e.g. weak, regular and strong) on foot biomechanics in running. The tightest (strong) and highest lacing (i.e., seven-eyelet) conditions reduced loading rates and pronation velocities of rearfoot motion. The lowest peak pressures at the heel and lateral midfoot regions were observed in the high lacing pattern than in the lower lacing patterns. They (Hagen et al., 2010) also found that the shoe comfort and stability perception scores were related to the runners’ level and experience. In contrast with the regular six-eyelet lacing pattern (REG 6), low-level runners perceived A57 (the laces were pulled from the outside from the fifth to the seventh eyelet) with better stability and comfort perception. However, high-level runners demonstrated poor comfort perception in A57 condition. Future studies should investigate the practicability of various shoe lacings (Figure 3) in runners with different arch height, muscle level (Lieber, 2018), and running experience (Clermont et al., 2019).
Figure 3.
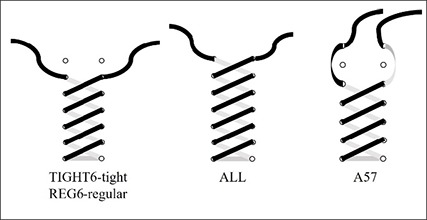
Three different shoe lacing patterns.
Effects of shoe midsole
For midsole hardness, the increase of midsole hardness from Asker C40 to Asker C70 would reduce the impact peak (Baltich et al., 2015), minimize energy loss (Stefanyshyn and Nigg, 2000) and increase the contact time (Willwacher et al., 2013); whereas other studies found that the impact peak increased (Chambon et al., 2014) while contact time did not change (Sterzing et al., 2013) across different midsole hardness. These inconsistent results may be due to the different tested speeds (3.3 ± 0.1 m/s vs. 3.5 ± 0.18 m/s) (Willwacher et al., 2013), hardness (0.6-17.10 N/mm vs. 40-65 Asker C vs. 47.1-62.8 Asker C) (Baltich et al., 2015) across the included studies.
Only a few longitudinal studies examined the relationship between midsole and running injuries. Theisen et al. (2014) randomly assigned soft (Asker 64C) and hard (Asker 57C) midsole shoes to 247 runners to wear for five months. The same injury rates were found between soft and hard midsole shoes used in training. However, Dixon et al. (2015) found that shoes with hard lateral stiffness (Asker 70C) had larger peak knee abduction moment and peak loading rates than softer midsoles (i.e., 52 and 60 Asker) during running, suggesting the increase the risk of running-related injuries (Dixon et al., 2015).
With regard to the material used, EVA and PU were widely used in footwear industry and related studies (Brückner et al., 2010). PU material exhibited lower relative changes of damping parameters than EVA and thus recommended as the alternative use of midsole material in running, even though PU material showed better durability than EVA (Brückner et al., 2010). From the running economy perspective, Wang et al. (2012) found that EVA shoes had higher capability of energy return than PU shoes at all running distances (e.g. 50 km, between 200 to 300 km and 500 km). A larger percentage of energy return could be related to improved running economy (Thomson et al., 2010). Future studies should investigate whether the varying hardness of the midsole would be related to the risk of injuries to provide sports scientists, coaches, and footwear manufacturers an insight into running shoe developments for injury prevention.
Effects of minimalist shoe
Minimalist shoes were suggested to improve running economy by changing a runner's strike and performance-related variables (Fuller et al., 2015). Most included studies have found that minimalist shoes showed remarkable differences in lower extremity biomechanics when compared with traditional running shoes (Table 5). In addition, the effect of minimalist shoes on the changes and adaptations in Achilles tendon became a popular research topic. One included article reported that participants who wore minimalist shoes developed greater cross-sectional area, stiffness and Young's modulus of Achilles tendon than those who used the conventional running shoes (Joseph et al., 2017). A consensus has been reached on running with minimalist shoes can improve running economy. For example, Warne et al., (2014) found that four-week habituation to simulated barefoot running would improve running economy (VO2max) compared with shod running. Similarly, Fuller et al. (2017a) randomly assigned 61 runners gradually increased the amount of running when wearing either minimalist (n=31) or conventional (n=30) shoes during a six-week training program and found that minimalist shoes during training improved running economy compared to training in conventional shoes.
Although the concept and functionality of running shoes have dramatically evolved in recent years, the injury rate remains high and is still the focus in running research. A prospective cohort study demonstrated that running in minimalist footwear appears to increase the likelihood of experiencing pain and injury at the shin and calf (Michael et al., 2014).
Increased forefoot plantar pressure in minimalist shoes with minimal cushioning is one of the main causes of forefoot stress fracture. Bergstra et al.’s study (2015) minimalist shoes induced higher peak pressures on the medial, middle and lateral sides of the forefoot and maximum mean pressures, which were associated with metatarsophalangeal joints fractures than traditional running shoes. Another study (Ridge et al., 2013) examined the stress fracture injury risks by measuring the presence of bone marrow edema in the foot after runners transitioned to minimalist shoes (i.e., Vibram FiveFinger) throughout a 10-wk transition period. Their results indicated the Vibram group experienced a significantly greater incidence of bone marrow edema after the training period than the traditional shoes. From these studies, it confirmed that minimalist shoes may increase the injury risk. For runners with habitual conventional shoes, transition to minimalist shoes should progressively take time and training process.
Effects of shoe upper
To date, only a few included articles investigated the effect of shoe upper on performance-related and injuries-related variables (Table 8). The reason may be due to the large variety of upper materials used, the lack of mainstream upper materials and the difficulty of experimental control. Shoe upper has stronger influence over fit and comfort, which would alter the kinematic and kinetic strategies of runners. It was demonstrated that firmer foot contact within a shoe would result in lower loading rates due to a better coupling of foot-footwear (Hagen and Hennig, 2009). For example, Onodera et al. (2015) found that participants who wore shoes with minimalist upper would experience higher peak pressures in total area, rearfoot and medial forefoot regions but lower peak pressure at midfoot region; whereas those who wore shoes with structured upper demonstrated longer contact time for total area midfoot and lateral forefoot regions (Onodera et al., 2015). It is argued that the structured upper shoes would provide greater maneuverability and robustness, resulting in a uniformly distributed foot pressure and reduced foot plantar loading (Onodera et al., 2015). From the anthropometry perspective, better shoe upper fit and/or comfort can make the runner’s foot coupled better with the sole (Onodera et al., 2017). Furthermore, various running speeds may have different requirements for the tightness of the shoe upper. However, the effects of shoe upper on comfort and running biomechanics included plantar pressures would require further investigation.
Effects of shoe bending stiffness
A review study summarized that shoe bending stiffness was related to changes in lower limb joint kinematics and kinetics as well as athletic performance (Stefanyshyn and Wannop, 2016). Forefoot bending stiffness of a shoe can be increased by inserting a forefoot plate (Madden et al., 2015) or using harder midsole (Willwacher et al., 2014). This has the potential to enhance sports performance in forward acceleration, jumping and agility tasks (Wannop and Stefanyshyn, 2016). Increasing the bending stiffness within a certain range could benefit runners. However, excessively increased bending stiffness may induce discomfort or hinder the performance benefits (Roy and Stefanyshyn, 2006). Furthermore, some included articles suggested that the reduction in metatarsophalangeal flexion would minimise the magnitude of negative joint power generation, which was beneficial to athletic performance (Stefanyshyn and Fusco, 2004). 5 out of the 7 included studies (Hoogkamer et al., 2018; Stefanyshyn and Nigg, 2000; Roy and Stefanyshyn, 2006; Stefanyshyn and Fusco, 2004; Madden et al., 2015) in Table 10 showed that increasing bending stiffness improved running performance and economy. Specifically, stiffer shoes would reduce energetic cost (Hoogkamer et al., 2018), maximum VO2 (Roy and Stefanyshyn, 2006), energy lost at metatarsophalangeal joint (Stefanyshyn and Nigg, 2000), and sprint time (Stefanyshyn and Fusco, 2004).
In injury-related perspective, no longitudinal injury studies have been reported for the relationship between bending stiffness and running injury. The optimal bending stiffness of a shoe is currently unknown due to different stiffness measurement across studies, future research should develop standard testing protocols to identify the optimal ranges of forefoot stiffness used in various running level (elite, intermediate and novice), type of foot strikes (rearfoot, midfoot and forefoot) and running conditions (10k, half-marathon and full marathon).
Effects of heel flare, heel-toe drop, Massai Barefoot Technology (MBT), and heel cup
The outcomes related to heel flare, heel-toe drop, MBT, and heel cup were associated with insufficient studies to make strong conclusions and therefore require further investigation. Besides, the findings for heel cup appear to be the most promising across. In general, heel cups can serve as an effective treatment for heel pain because it can provide external support to the heel fat pad, maintain the heel pad thickness, and reduce the heel peak pressure and pain (Li et al., 2018).
Conclusion
Over the past decades, most of the included articles focused on midsole and minimalist constructions. Studies with running shoe constructions confirmed the beneficial effects on athletic performance and running injury: 1) increasing the forefoot bending stiffness of running at the optimal range can benefit performance-related variables; 2) softer midsoles can reduce impact forces and loading rates; 3) thicker midsoles can provide remarkable cushioning effects and attenuate shock during impacts but may decrease plantar sensations at touchdown; 4) minimalist shoes would improve running performance-related including economy and build the cross-sectional area and stiffness of Achilles tendon, but also induce greater loading of the ankle, metatarsophalangeal joint and Achilles tendon compared with the conventional shoes. Notably, progressive training and adaptation seems necessary and recommended when using minimalist shoes. Although research on heel flare, shoelace and heel cup were limited, these constructions showed some potentials to influence running stability. The role and interaction of these shoe constructions would require further investigations. Future research should also develop standard testing protocols to help to establish the scientific guidelines of optimal stiffness, thickness and heel-toe drop across various running shoe studies in the future.
Acknowledgements
This work was supported by the National Natural Science Foundation of China (11772201); Talent Development Fund of Shanghai Municipal (2018107); the National Key Technology Research and Development Program of the Ministry of Science and Technology of China (2019YFF0302100, 2018YFF0300500); the “Dawn” Program of Shanghai Education Commission (19SG47). The experiments comply with the current laws of the country in which they were performed. The authors have no conflict of interest to declare.
Biographies
Xiaole SUN
Employment
PhD Candidate
Degree
Master of Science (Kinesiology)
Research interests
Sport science, footwear biomechanics
E-mail: 15800898687@163.com
Wing-Kai LAM
Employment
Senior Researcher
Degree
PhD
Research interests
Sport science, footwear biomechanics
E-mail: gilbertlam@li-ning.com.cn
Xini ZHANG
Employment
PhD Candidate
Degree
Master of Science (Kinesiology)
Research interests
Sport science, footwear biomechanics
E-mail: zhangxini1129@163.com
Junqing WANG
Employment
Graduate Student
Degree
Master of Science (Kinesiology)
Research interests
Sport science, footwear biomechanics
E-mail: 1973573709@qq.com
Weijie FU
Employment
Associate Professor
Degree
PhD
Research interests
Musculoskeletal functions of the foot and ankle, and human performance (e.g., running, jumping, and landing) mechanisms
E-mail: fuweijie@sus.edu.cn
References
- Alessandro L., Altman D.G., Jennifer T., Cynthia M., Tzsche P.C., Ioannidis J.P.A., Mike C., Devereaux P.J., Jos K., David M.J.E.B., Health P. (2009) The PRISMA statement for reporting systematic reviews and meta-analyses of studies that evaluate health care interventions: explanation and elaboration. Journal of Clinical Epidemiology. 1-34. [DOI] [PubMed] [Google Scholar]
- Ameersing L., Goonetilleke R.S., Tsui K.L. (2003) Foot landmarking for footwear customization. Ergonomics 46, 364-383. [DOI] [PubMed] [Google Scholar]
- Baltich J., Maurer C., Nigg B.M. (2015) Increased vertical impact forces and altered running mechanics with softer midsole shoes. Plos one 10, e0125196. [DOI] [PMC free article] [PubMed] [Google Scholar]
- Bergstra S.A., Kluitenberg B., Dekker R., Bredeweg S.W., Postema K., Van den Heuvel E.R., Hijmans J.M., Sobhani S. (2015) Running with a minimalist shoe increases plantar pressure in the forefoot region of healthy female runners. Journal of Science Medicine in Sport 18, 463-468. [DOI] [PubMed] [Google Scholar]
- Besson T., Morio C., Rossi J. (2017) Effects of shoe drop on running mechanics in women. Computer Methods Biomechanics and Biomedical Engineering 20, 19-20. [DOI] [PubMed] [Google Scholar]
- Bonacci J., Saunders P.U., Hicks A., Rantalainen T., Vicenzino B.G., Spratford W. (2013) Running in a minimalist and lightweight shoe is not the same as running barefoot: a biomechanical study. British Journal of Sports Medicine 47, 387-392. [DOI] [PubMed] [Google Scholar]
- Boyer K.A., Andriacchi T.P. (2009) Changes in running kinematics and kinetics in response to a rockered shoe intervention. Clinical Biomechanics 24, 872-876. [DOI] [PubMed] [Google Scholar]
- Brückner K., Odenwald S., Schwanitz S., Heidenfelder J., Milani T. (2010) Polyurethane-foam midsoles in running shoes - impact energy and damping. Procedia Engineering 2, 2789-2793. [Google Scholar]
- Campitelli N.A., Spencer S.A., Bernhard K., Heard K., Kidon A. (2016) Effect of vibram fivefingers minimalist shoes on the abductor hallucis muscle. Journal of the American Podiatric Medical Association 106, 344-351. [DOI] [PubMed] [Google Scholar]
- Chambon N., Delattre N., Guéguen N., Berton E., Rao G. (2014) Is midsole thickness a key parameter for the running pattern? Gait Posture 40, 58-63. [DOI] [PubMed] [Google Scholar]
- Chambon N., Delattre N., Guéguen N., Berton E., Rao G. (2015) Shoe drop has opposite influence on running pattern when running overground or on a treadmill. European Journal of Applied Physiology 115, 911-918. [DOI] [PubMed] [Google Scholar]
- Chan Z.Y.S., Au I.P.H. Lau F.O.Y. Ching E.C.K. Zhang J.H. Cheung R.T. (2018) Does maximalist footwear lower impact loading during level ground and downhill running? European Journal of Sport Science 18, 1-7. [DOI] [PubMed] [Google Scholar]
- Clermont C.A., Phinyomark A., Osis S.T., Ferber R. (2019) Classification of higher- and lower-mileage runners based on running kinematics. Journal of Sport and Health Science 8, 249–57. [DOI] [PMC free article] [PubMed] [Google Scholar]
- Davis I.S., Bowser B.J., Mullineaux D.R. (2016) Greater vertical impact loading in female runners with medically diagnosed injuries: a prospective investigation. British Journal of Sports Medicine 50, 887-892. [DOI] [PubMed] [Google Scholar]
- Dixon S., Nunns M., Tenbroek T. (2015) Influence of increased shoe lateral stiffness on running biomechanics in older females. Footwear Science 7, 163-164. [Google Scholar]
- Oriwol D., Sterzing T., Milani T. (2011) The position of medial dual density midsole elements in running shoes does not influence biomechanical variables. Footwear Science 3, 107-116. [Google Scholar]
- Esculier J.F., Dubois B., Dionne C.E., Leblond J., Roy J.S. (2015) A consensus definition and rating scale for minimalist shoes. Journal of Foot and Ankle Research 8, 42. [DOI] [PMC free article] [PubMed] [Google Scholar]
- Fiedler K.E., Stuijfzand W.J., Harlaar J., Dekker J., Beckerman H. (2011) The effect of shoe lacing on plantar pressure distribution and in-shoe displacement of the foot in healthy participants. Gait Posture 33, 396-400. [DOI] [PubMed] [Google Scholar]
- Firminger C.R., Edwards W.B. (2016) The influence of minimalist footwear and stride length reduction on lower-extremity running mechanics and cumulative loading. Journal of Science Medicine in Sport 19, 975-979. [DOI] [PubMed] [Google Scholar]
- Fredericks W., Swank S., Teisberg M., Hampton B., Ridpath L., Hanna J.B. (2015) Lower extremity biomechanical relationships with different speeds in traditional, minimalist, and barefoot footwear. Journal of Sports Science and Medicine 14, 276-283. [PMC free article] [PubMed] [Google Scholar]
- Fuller J.T., Bellenger C.R., Thewlis D., Tsiros M.D., Buckley J.D. (2015) The effect of footwear on running performance and running economy in distance runners. Sports Medicine 45, 411-422. [DOI] [PubMed] [Google Scholar]
- Fuller J.T., Buckley J.D., Tsiros M.D., Brown N.A., Thewlis D. (2016) Redistribution of mechanical work at the knee and ankle joints during fast running in minimalist shoes. Journal of Athletic Training 51, 806-812. [DOI] [PMC free article] [PubMed] [Google Scholar]
- Fuller J.T., Thewlis D., Buckley J.D., Brown N.A., Hamill J., Tsiros M.D. (2017a) Body mass and weekly training distance influence the pain and injuries experienced by runners using minimalist shoes: a randomized controlled trial. American Journal of Sports Medicine 45, 1162-1170. [DOI] [PubMed] [Google Scholar]
- Fuller J.T., Thewlis D., Tsiros M.D., Nat B., Buckley J.D. (2017b) Six-week transition to minimalist shoes improves running economy and time-trial performance. Journal of Science and Medicine in sport 20, 1117-1122. [DOI] [PubMed] [Google Scholar]
- Goss D.L., Lewek M., Yu B., Ware W.B., Teyhen D.S., Gross M.T. (2015) Lower extremity biomechanics and self-reported foot-strike patterns among runners in traditional and minimalist shoes. Journal of Athletic Training 50, 603-611. [DOI] [PMC free article] [PubMed] [Google Scholar]
- Hagen M., Hennig E.M. (2009) Effects of different shoe-lacing patterns on the biomechanics of running shoes. Journal of Sports Science 27, 267-275. [DOI] [PubMed] [Google Scholar]
- Hagen M., Homme A.K., Umlauf T., Hennig E.M. (2010) Effects of different shoe-lacing patterns on dorsal pressure distribution during running and perceived comfort. Research in Sports Medicine 18, 176-187. [DOI] [PubMed] [Google Scholar]
- Hagen M., Feiler M. (2011). Comfort and stability ratings of different shoe lacing patterns depend on the runners’ level of performance. Footwear Science 3, 64-66. [Google Scholar]
- Hardin E.C., Hamill J. (2002) The influence of midsole cushioning on mechanical and hematological responses during a prolonged downhill run. Research Quarterly for Exercise and Sport 73, 125-133. [DOI] [PubMed] [Google Scholar]
- Hardin E.C., van den Bogert A.J., Hamill J. (2004) Kinematic adaptations during running: effects of footwear, surface, and duration. Medicine and Science of Sports and Exercise 36, 838-844. [DOI] [PubMed] [Google Scholar]
- Histen K., Arntsen J., L'Hereux L., Heeren J., Wicki B., Saint S., Aerni G., Denegar C.R., Joseph M.F. (2017) Achilles Tendon properties of minimalist and traditionally shod runners. Journal of Sport Rehabilitation 26, 159-164. [DOI] [PubMed] [Google Scholar]
- Hong Y., Wang L., Li J.X., Zhou J.H. (2011) Changes in running mechanics using conventional shoelace versus elastic shoe cover. Journal of Sports Science 29, 373-379. [DOI] [PubMed] [Google Scholar]
- Hoogkamer W., Kipp S., Frank J.H., Farina E.M., Luo G., Kram R. (2018) A comparison of the energetic cost of running in marathon racing shoes. Sports Medicine 48, 1009-1019. [DOI] [PMC free article] [PubMed] [Google Scholar]
- Joseph M.F., Histen K., Arntsen J., L'Hereux L., Defeo C., Lockwood D., Scheer T., Denegar C.R. (2017) Achilles Tendon adaptation during transition to a minimalist running style. Journal of Sport Rehabilitation 26, 165-170. [DOI] [PubMed] [Google Scholar]
- Kahle A., Brown G.A., Shaw I., Shaw B.S. (2016) Mechanical and physiological analysis of minimalist versus traditionally-shod running. Journal of Sports Medicine and Physical Fitness 56, 974-979. [PubMed] [Google Scholar]
- Knapik J.J., Orr R., Pope R., Grier T. (2016) Injuries and footwear (part 2): minimalist running shoes. Journal of Special Operations Medicine 16, 89-96. [PubMed] [Google Scholar]
- Krabak B., Lipman G.S., Waite B. (2017) The long distance runner's guide to injury prevention and treatment : how to avoid common problems and deal with them when they happen. New York, NY: Skyhorse Publishing. [Google Scholar]
- Law M.H.C., Choi E.M.F., Law S.H.Y., Chan S.S.C., Wong S.M.S., Ching E.C.K., Chan Z.Y.S., Zhang J.H., Lam W.K., Lau F.O.Y., Cheung R.T.H. (2018) Effects of footwear midsole thickness on running biomechanics. Journal of Sports Science, 1-7. [DOI] [PubMed] [Google Scholar]
- Li L., Yang L., Yu F., Shi J., Zhu L., Yang X., Teng H., Wang X., Jiang Q. (2018) 3D printing individualized heel cup for improving the self-reported pain of plantar fasciitis. Journal of Translational Medicine 16, 167. [DOI] [PMC free article] [PubMed] [Google Scholar]
- Lieber R.L. (2018) Biomechanical response of skeletal muscle to eccentric contractions. Journal of Sport and Health Science 7, 294-309. [DOI] [PMC free article] [PubMed] [Google Scholar]
- Macedo L.G., Elkins M.R., Maher C.G., Moseley A.M., Herbert R.D., Sherrington C.E. (2010) There was evidence of convergent and construct validity of Physiotherapy Evidence Database quality scale for physiotherapy trials. Journal of Clinical Epidemiology 63, 920-925. [DOI] [PubMed] [Google Scholar]
- Maclean C.L., Davis I.S., Hamill J. (2009) Influence of running shoe midsole composition and custom foot orthotic intervention on lower extremity dynamics during running. Journal of Applied Biomechanics 25, 54-63. [DOI] [PubMed] [Google Scholar]
- Madden R., Sakaguchi M., Tomaras E.K., Wannop J.W., Stefanyshyn D. (2015) Forefoot bending stiffness, running economy and kinematics during overground running. Footwear Science 8, 91-98. [Google Scholar]
- Malisoux L., Chambon N., Urhausen A., Theisen D. (2016) Influence of the heel-to-toe drop of standard cushioned running shoes on injury risk in leisure-time runners: a randomized controlled trial with 6-month follow-up. American Journal of Sports Medicine 44, 2933-2940. [DOI] [PubMed] [Google Scholar]
- Malisoux L., Gette P., Chambon N., Urhausen A., Theisen D. (2017) Adaptation of running pattern to the drop of standard cushioned shoes: A randomised controlled trial with a 6-month follow-up. Journal of Science Medicine in Sport 20, 734-739. [DOI] [PubMed] [Google Scholar]
- Paquette M.R., Zhang S.N., Baumgartner L.D. (2013) Acute effects of barefoot, minimal shoes and running shoes on lower limb mechanics in rear and forefoot strike runners. Footwear Science 5, 9-18. [Google Scholar]
- Mccallion C., Donne B., Fleming N., Blanksby B. (2014) Acute Differences in Foot Strike and Spatiotemporal Variables for Shod, Barefoot or Minimalist Male Runners. Journal of Sports Science and Medicine 13, 280. [PMC free article] [PubMed] [Google Scholar]
- Mccormick J.J., Anderson R.B.J.F., Clinics A. (2009) The great toe: failed turf toe, chronic turf toe, and complicated sesamoid injuries. 14, 135-150. [DOI] [PubMed] [Google Scholar]
- Michael R., Maha E., Richard N.W., Jack T.J. (2014) Examining injury risk and pain perception in runners using minimalist footwear. British Journal of Sports Medicine 48, 1257-1265. [DOI] [PubMed] [Google Scholar]
- Mits S.D., Palmans T., Desaever K., Deschamps K. (2015) Influence of heel drop height on COP trajectory. Footwear Science 7, S114-S115. [Google Scholar]
- Moody D.C., Hunter I., Myrer W.J. (2018) Comparison of varying heel to toe differences and cushion to barefoot running in novice minimalist runners. International Journal of Exercise Science 11, 13-19. [DOI] [PMC free article] [PubMed] [Google Scholar]
- Moore I.S., Pitt W., Nunns M., Dixon S. (2014) Effects of a seven-week minimalist footwear transition programme on footstrike modality, pressure variables and loading rates. Footwear Science 7, 17-29. [Google Scholar]
- Nigg B.M. (2001) The role of impact forces and foot pronation: a new paradigm. Clinical Journal of Sport Medicine 11, 2-9. [DOI] [PubMed] [Google Scholar]
- Nigg B.M., Gerin-Lajoie M. (2011) Gender, age and midsole hardness effects on lower extremity muscle activity during running. Footwear Science 3, 3-12. [Google Scholar]
- O'Leary K., Vorpahl K.A., Heiderscheit B. (2008) Effect of cushioned insoles on impact forces during running. Journal of American Podiatric Medical Association 98, 36-41. [DOI] [PubMed] [Google Scholar]
- Oh K., Park S. (2017) The bending stiffness of shoes is beneficial to running energetics if it does not disturb the natural MTP joint flexion. Journal of Biomechanics 53, 127. [DOI] [PubMed] [Google Scholar]
- Onodera A.N., Gaviao Neto W.P., Roveri M.I., Oliveira W.R., Sacco I.C. (2017) Immediate effects of EVA midsole resilience and upper shoe structure on running biomechanics: a machine learning approach. Peer J ournal 5, e3026. [DOI] [PMC free article] [PubMed] [Google Scholar]
- Onodera A.N., Roveri M.I., Oliveira W.R., Sacco I.C.N. (2015) The influence of shoe upper construction on the plantar pressure distribution during running. Footwear Science 7, 81-82. [Google Scholar]
- Ridge S.T., Johnson A.W., Mitchell U.H. (2013) Foot bone marrow edema after a 10-week transition to minimalist running shoes. Medicine and Science in Sports and Exercise 45, 1363–1368. [DOI] [PubMed] [Google Scholar]
- Ridge S.T., Standifird T., Rivera J. (2015) The effect of training in minimalist running shoes on running economy. Journal of Sports Science and Medicine 14, 643-647. [PMC free article] [PubMed] [Google Scholar]
- Rixe J.A., Gallo R.A., Silvis M.L. (2012) The barefoot debate: can minimalist shoes reduce running-related injuries? Current Sports Medicine Reports 11, 160-165. [DOI] [PubMed] [Google Scholar]
- Robbins S.E., Gouw G.J. (1991) Athletic footwear: unsafe due to perceptual illusions. Medicine and Science of Sports and Exercise 23, 217-224. [PubMed] [Google Scholar]
- Roy J.P., Stefanyshyn D.J. (2006) Shoe midsole longitudinal bending stiffness and running economy, joint energy, and EMG. Medicine and Science of Sports and Exercise 38, 562-569. [DOI] [PubMed] [Google Scholar]
- Salzler M.J., Bluman E.M., Noonan S., Chiodo C.P., de Asla R.J. (2012) Injuries observed in minimalist runners. Foot and Ankle International 33, 262-266. [DOI] [PubMed] [Google Scholar]
- Sinclair J., Fau-Goodwin J., Richards J., Shore H. (2016a) The influence of minimalist and maximalist footwear on the kinetics and kinematics of running. Footwear Science 8, 33-39. [DOI] [PubMed] [Google Scholar]
- Sinclair J., Richards J., Selfe J., Fau-Goodwin J., Shore H. (2016b) The influence of minimalist and maximalist footwear on patellofemoral kinetics during running. Journal of Applied Biomechanics 32, 359-364. [DOI] [PubMed] [Google Scholar]
- Sinclair J., Sant B. (2016) The effects of Cross-Fit and minimalist footwear on Achilles tendon kinetics during running. Foot & Ankle Online Journal 9, 2. [Google Scholar]
- Shorten M., Mientjes MIV. (2011) The ‘heel impact’ force peak during running is neither ‘heel’ nor ‘impact’ and does not quantify shoe cushioning effects. Footwear Science 3, 41-58. [Google Scholar]
- Squadrone R., Rodano R., Hamill J., Preatoni E.J. (2015) Acute effect of different minimalist shoes on foot strike pattern and kinematics in rearfoot strikers during running. Journal of Sports Sciences 33, 1196-1204. [DOI] [PubMed] [Google Scholar]
- Stacoff A., Reinschmidt C., Nigg B.M., Van A.D.B., Lundberg A., Denoth J., Stüssi E. (2001) Effects of shoe sole construction on skeletal motion during running. Medicine & Science in Sports & Exercise 33, 311. [DOI] [PubMed] [Google Scholar]
- Stefanyshyn D., Fusco C. (2004) Increased shoe bending stiffness increases sprint performance. Sports Biomechanics 3, 55-66. [DOI] [PubMed] [Google Scholar]
- Stefanyshyn D.J., Nigg B.M. (2000) Influence of midsole bending stiffness on joint energy and jump height performance. Medicine and Science of Sports and Exercise 32, 471-476. [DOI] [PubMed] [Google Scholar]
- Stefanyshyn D.J., Wannop J.W. (2016) The influence of forefoot bending stiffness of footwear on athletic injury and performance. Footwear Science 8, 51-63. [Google Scholar]
- Sterzing T., Schweigera V., Ding R., Cheung J.T.M., Brauner T. (2013) Influence of rearfoot and forefoot midsole hardness on biomechanical and perception variables during heel-toe running. Footwear Science 5, 71-79. [Google Scholar]
- Sterzing T., Custoza G., Ding R., Cheung J.T.M. (2015) Segmented midsole hardness in the midfoot to forefoot region of running shoes alters subjective perception and biomechanics during heel-toe running revealing potential to enhance footwear. Footwear Science 7, 63-79. [Google Scholar]
- Tenbroek T., Rodrigues P., Frederick E., Hamill J. (2013) Effects of unknown footwear midsole thickness on running kinematics within the initial six minutes of running. Footwear Science 5, 27-37. [Google Scholar]
- TenBroek T.M., Rodrigues P.A., Frederick E.C., Hamill J. (2014) Midsole thickness affects running patterns in habitual rearfoot strikers during a sustained run. Journal of Applied Biomechanics 30, 521-528. [DOI] [PubMed] [Google Scholar]
- Teoh J.C., Jin H.L., Ying B.L., Shim P.W., Park J., Park S.B., Sang J.P., Lee T.J. (2013) Investigation of the biomechanical effect of variable stiffness shoe on external knee adduction moment in various dynamic exercises. Journal of Foot and Ankle Research 6, 39. [DOI] [PMC free article] [PubMed] [Google Scholar]
- Theisen D., Malisoux L., Genin J., Delattre N., Seil R., Urhausen A. (2014) Influence of midsole hardness of standard cushioned shoes on running-related injury risk. British Journal of Sports Medicine 48, 371-376. [DOI] [PubMed] [Google Scholar]
- Thomson R.D., Birkbeck A.E., Tan W.L., McCafferty L.F., Grant S., Wilson J. (2010) The modelling and performance of training shoe cushioning systems. Sports engineering 2, 109-120. [Google Scholar]
- Sterzing T., Schweiger V., Ding R., Cheung J.T. (2013) Influence of rearfoot and forefoot midsole hardness on biomechanical and perception variables during heel-toe running. Footwear Science 5, 71-79. [Google Scholar]
- Wakeling J.M., Pascual S.A., Nigg B.M. (2002) Altering muscle activity in the lower extremities by running with different shoes. Medicine and Science of Sports and Exercise 34, 1529-1532. [DOI] [PubMed] [Google Scholar]
- Wang C.L., Cheng C.K., Tsuang Y.H., Hang Y.S., Liu T.K. (1994) Cushioning effect of heel cups. Clinical Biomechanics (Bristol, Avon) 9, 297-302. [DOI] [PubMed] [Google Scholar]
- Wang L., Hong Y., Li J.X. (2012) Durability of running shoes with ethylene vinyl acetate or polyurethane midsoles. Journal of Sports Science 30, 1787-1792. [DOI] [PubMed] [Google Scholar]
- Wannop J.W., Stefanyshyn D.J. (2016) Special issue: Bending stiffness: performance and injury effects. Footwear Science 8, 49-50. [Google Scholar]
- Warne J.P., Kilduff S.M., Gregan B.C., Nevill A.M., Moran K.A., Warrington G.D. (2014) A 4-week instructed minimalist running transition and gait-retraining changes plantar pressure and force. Scandinavian Journal of Medicine & Science in Sports 24, 964-973. [DOI] [PubMed] [Google Scholar]
- Warne J.P., Warrington G.D. (2014) Four-week habituation to simulated barefoot running improves running economy when compared with shod running. Scandinavian Journal of Medicine and Science in Sports 24, 563-568. [DOI] [PubMed] [Google Scholar]
- Willwacher S., Konig M., Braunstein B., Goldmann J.P., Bruggemann G.P. (2014) The gearing function of running shoe longitudinal bending stiffness. Gait Posture 40, 386-390. [DOI] [PubMed] [Google Scholar]
- Willwacher S., Konig M., Potthast W., Bruggemann G.P. (2013) Does specific footwear facilitate energy storage and return at the metatarsophalangeal joint in running? Journal of Applied Biomechanics 29, 583-592. [DOI] [PubMed] [Google Scholar]
- Willy R.W., Davis I.S. (2014) Kinematic and kinetic comparison of running in standard and minimalist shoes. Medicine and Science of Sports and Exercise 46, 318-323. [DOI] [PubMed] [Google Scholar]
- Wing K.L., Wei H.K., Jingyi S.C., Pui W.K. (2019) Effect of shoe constructions on biomechanical changes in basketball: system review. Sports Biomechanics. Published online. [Google Scholar]
- Wunsch T., Alexander N., Kroll J., Stoggl T., Schwameder H. (2017) Effects of a leaf spring structured midsole on joint mechanics and lower limb muscle forces in running. Plos one 12, e0172287. [DOI] [PMC free article] [PubMed] [Google Scholar]
- Wunsch T., Kroll J., Stoggl T., Schwameder H. (2016) Effects of a structured midsole on spatio-temporal variables and running economy in overground running. European Journal of Sport Science 17, 303-309. [DOI] [PubMed] [Google Scholar]