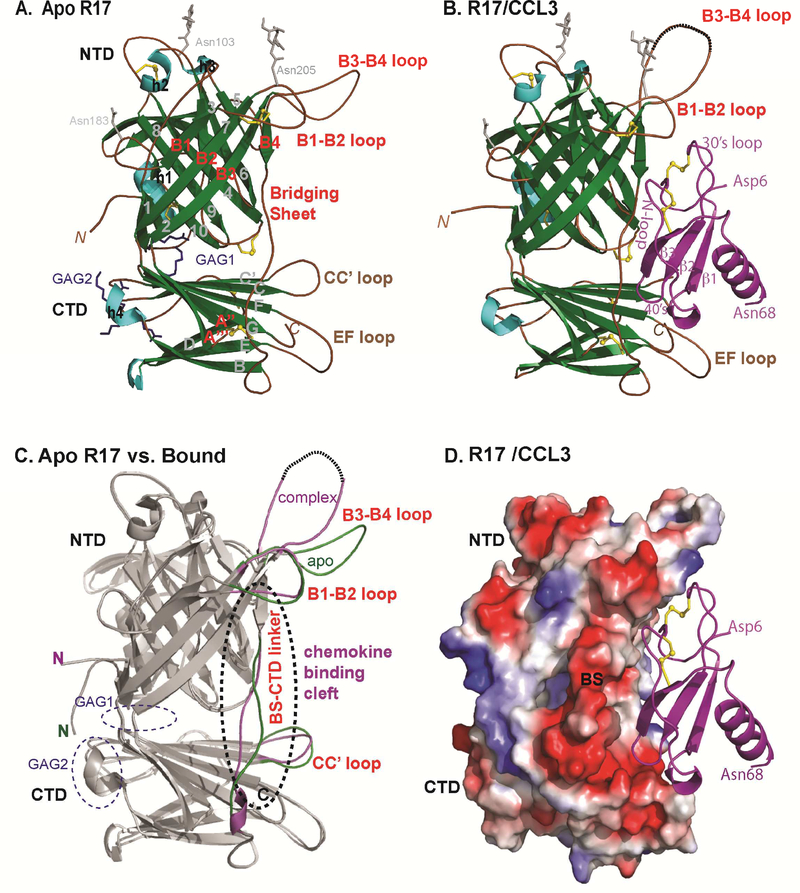
Figure 1: Crystal structure of RHVP R17 alone and in complex with murine CCL3.
(A) Ribbon diagram of apo R17. The N terminal domain (NTD), bridging sheet (BS) and C-terminal domain (CTD) are colored based on secondary structure: β-strands are depicted in green, α helices in cyan and connecting loops in brown. β-strands of the NTD are labeled 1–10, BS is labeled B1-B4 and β-strands of the CTD are labeled A-I. During purification, R17 was treated with EndoH to remove complex carbohydrates. Of the three predicted N-linked glycosylation sites, electron density was visible for the N-glycan linked to Asn 205. N-acetyl glucosamine (NAG) followed by a mannose ring is shown in stick representation. Disulfide bonds are shown in stick and colored yellow. (B) Crystal structure of the R17GAG2 in complex with murine CCL3 (D26A) at 3.0Å resolution. R17 is colored as in (A) while the chemokine is colored magenta and labeled according to accepted chemokine convention. Two NAGs linked to Asn 103 and Asn 205 are in ball and stick representation. (C) Displayed in white cartoon are superimposed free and ligated R17 structures. Conformational changes in the loops around chemokine binding cleft are colored green (free R17) and magenta (chemokine bound R17). Two GAG binding sites on R17 are located on the opposite surface from chemokine binding and are circled with blue dashed lines. (D) Electrostatic complementarity between R17 and CCL3. The molecular surface is colored as calculated by APBS ( <−1kT in red, 0kt in white and >+1kT in blue). See also Figure S1.

