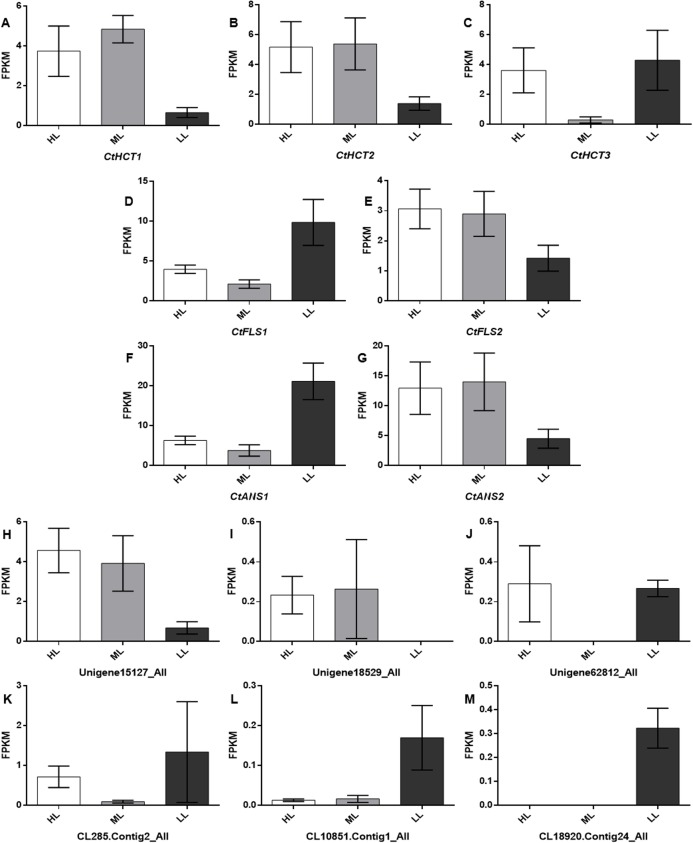
Figure 5. Expression levels of the DEGs related to flavonoid biosynthesis.
A total of 13 selected differential expressed genes related to flavonoid biosynthesis from the transcriptome and average FKPM values for biological replicates are shown. (A–M) CtHCT1, CtHCT2, CtHCT3, CtFLS1, CtFLS2, CtANS1, CtANS2, Unigene15127_All, Unigene18529_All, Unigene62812_All, CL285.Contig2_All, CL10851.Contig1_All and CL18920.Contig24_All, respectively. HL, ML and LL presented high light intensity, middle light intensity and low light intensity respectively.

