Greenan et al. use electron cryotomography on intact motile cilia to elucidate how basal bodies template the formation of motile axonemes.
Abstract
Cells use motile cilia to generate force in the extracellular space. The structure of a cilium can be classified into three subdomains: the intracellular basal body (BB) that templates cilium formation, the extracellular axoneme that generates force, and the transition zone (TZ) that bridges them. While the BB is composed of triplet microtubules (TMTs), the axoneme is composed of doublet microtubules (DMTs), meaning the cilium must convert between different microtubule geometries. Here, we performed electron cryotomography to define this conversion, and our reconstructions reveal identifying structural features of the BB, TZ, and axoneme. Each region is distinct in terms of microtubule number and geometry, microtubule inner proteins, and microtubule linkers. TMT to DMT conversion occurs within the BB, and microtubule geometry changes to axonemal by the end of the TZ, followed by the addition of axoneme-specific components essential for cilium motility. Our results provide the highest-resolution images of the motile cilium to date and reveal how BBs template axonemes.
Introduction
Cilia are cellular compartments with specialized functions that extend from the surface of most animal cells. There are two types of cilia: motile cilia that generate force in the extracellular space, and immotile/primary cilia that detect and relay extracellular signals to the cell body (Malicki and Johnson, 2017; Satir and Christensen, 2007; Satir et al., 2010). Motile cilia play critical roles during development to define left-right asymmetry, empower sperm motility, help transport oocytes through the fallopian tubes, and coat the respiratory tract to expel mucus and contaminants from the lungs. This latter activity requires the coordinated beating of hundreds of cilia on billions of epithelial cells. Conversely, primary cilia do not generate force and are present in just one copy on the surface of a cell. Primary cilia serve a signaling function for many cell types: for example, retinal cells that detect light, nephrons that detect extracellular flow and ions, and nasal cells involved in olfactory perception. Extracellular signals detected by primary cilia are then transmitted to the cell body, where they integrate with intracellular cues to regulate cell growth and division.
Regardless of their type or function, the formation and core structure of motile and primary cilia are quite similar (Fisch and Dupuis-Williams, 2011; Ishikawa, 2017; Reiter et al., 2012). During the process of cilium formation (ciliogenesis), the centriole migrates to and docks with the plasma membrane via a set of structures called distal appendages (Reiter et al., 2012). This docking event is a key step in the cellular commitment to ciliogenesis, and the centriole is subsequently referred to as a basal body (BB). After docking, the microtubules of the distal BB polymerize to form the axoneme, the core structural unit of the cilium. The axoneme elongates and protrudes from the cell surface, covered in membrane, forming a unique cellular compartment with a distinct protein and lipid content.
While motile and primary cilia have many structural similarities, it is their molecular differences that give rise to their functional differences. The doublet microtubules (DMTs) of the motile axoneme are bridged by inner dynein arms (IDAs), outer dynein arms (ODAs), and nexin-dynein regulatory complex (nexin-DRC), whose coordinated action confers motility to the whole cilium (Heuser et al., 2009; Satir et al., 2014). Sensory cilia lack these components and are unable to generate force. Instead, primary cilia have receptors in the ciliary membrane that sense extracellular signals and transduce them into the cell body. For example, the ciliary membrane of some primary cilia is enriched for the receptor Patched, allowing it to sense the signaling molecule Hedgehog, unlike the surrounding plasma membrane (Rohatgi et al., 2007).
Mutations that affect the initiation of ciliogenesis, cilium structure, motility, or compartment integrity result in a group of diseases called ciliopathies (Reiter and Leroux, 2017). Many ciliopathy-associated mutations map to a poorly defined ciliary subdomain that lies between the BB and the axoneme, called the transition zone (TZ; Gonçalves and Pelletier, 2017; Reiter and Leroux, 2017; Yang et al., 2015). Collectively, the region that encompasses the distal end of the BB and the TZ is referred to as the ciliary base. The TZ is thought to form a selectivity barrier at the ciliary base that separates the ciliary compartment from the cytosol (Reiter et al., 2012). This separation is proposed to be achieved by Y-shaped structures that bridge the microtubules and the plasma membrane at the ciliary base (Gilula and Satir, 1972). Studies on the flagellum of Chlamydomonas show a barrel-shaped body and wedge-shaped structures within the cilium lumen of the TZ region (Craige et al., 2010). However, there is little structural data on the TZ of mammalian motile cilia, or how it fits within the BB to axoneme transition.
Previous structural studies describe three major differences between the BB and the motile axoneme. First, the BB is characterized by nine triplet microtubules (TMTs), whereas nine DMTs make up the axoneme (Guichard et al., 2012; Li et al., 2012; Sui and Downing, 2006). Furthermore, the angled geometry of the BB TMTs is markedly different from the inline geometry of the axonemal DMTs (Paintrand et al., 1992; Sui and Downing, 2006; Vaughan and Gull, 2016). Finally, while the BB TMTs are linked and stabilized via structures such as the A-C linker (Greenan et al., 2018; Guichard et al., 2012; Li et al., 2012), the axoneme DMTs are linked via axonemal dyneins and nexin-DRC necessary for ciliary motility (Heuser et al., 2009; Ishikawa, 2017). Although many of these components have been studied at different resolutions using a combination of light and electron microscopy, the basic process by which the BB transitions to the axoneme is unknown. For example, it is unclear where the TMTs of the BB give way to the DMTs of the TZ/axoneme and where the geometry of the axoneme is established. One reason for the lack of structural information on the TZ is the difficulty in imaging it in context, in a sample that encompasses the BB, the TZ, and the axoneme.
In this work, we used electron cryotomography (cryoET) to study the structure of the motile cilium and determined how a BB templates an axoneme. The ciliated epithelium of the cow trachea allowed us to obtain sufficient material to perform cryoET of the ciliary base, followed by cryoET imaging and subvolume averaging. This has provided a structural description of the complete ciliary base and how the mammalian TZ contributes to the overall geometry of the cilium. Our data show that microtubule inner proteins (MIPs) are a defining feature of the ciliary base, with specific MIP patterns defining the BB, TZ, and axoneme. The data show that the transition from TMT to DMT axonemal geometry is a gradual process that happens throughout the BB and TZ domains and is defined before axonemal components are detected. Together, our data suggest an axoneme-generating model whereby the TMT to DMT transition occurs first, closely followed by axoneme-geometry setting, and finally the addition of axonemal components such as dyneins and radial spokes (RS) to generate the axoneme.
Results
Motile cilium overview
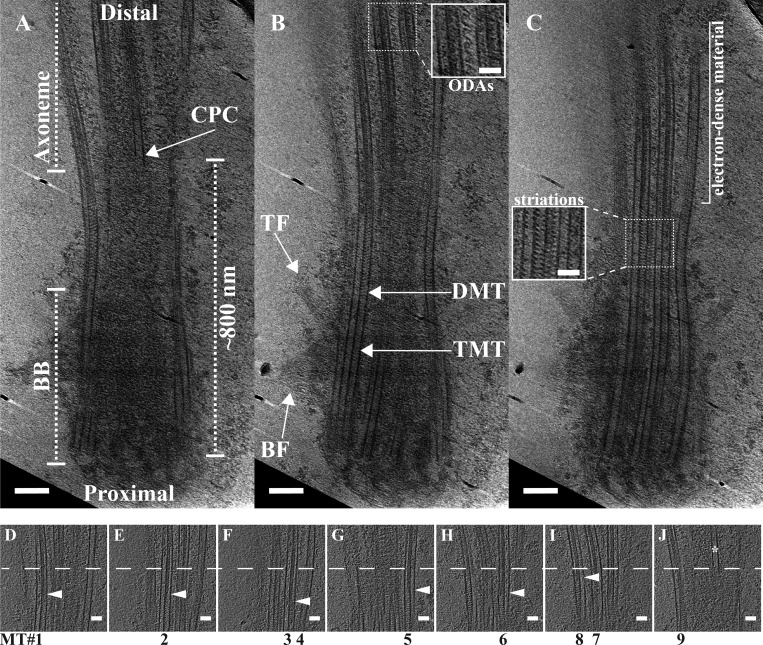
We purified motile cilia from the respiratory epithelium of bovine tracheae and imaged them by cryoET to generate feature-rich tomograms (n = 21 cilia). Imaging focused on a region of ∼1 µm, extending from the proximal BB through the TZ and into the axoneme (Fig. 1). Overall, this region was shaped like an hourglass, with a constriction point ∼500 nm from the proximal end (Fig. 1 A). Previous EM studies have identified features of the BB and the axoneme, which we also observed in our raw tomograms (Anderson, 1972; Fisch and Dupuis-Williams, 2011; Li et al., 2012). Close to the proximal end of the cilium, we observed both the basal foot and the transition fibers binding to the TMTs of the BB (Fig. 1 B). Distal to that, in a region composed of DMTs, we observed characteristic axonemal features, including the central pair complex (CPC; Fig. 1 A) and ODAs (Fig. 1 B, inset). The TZ has been broadly defined as the region between the BB and axoneme (Reiter et al., 2012). In our data, this region had striations at 8-nm intervals, both inside the DMTs and between adjacent DMTs (Fig. 1 C, inset). Distal to this striated region, the microtubules appeared to contain electron-dense material (Fig. 1 C) that persisted within the microtubules for the entire field that was imaged (Fig. 1 B, inset). Together, these observations revealed distinct microtubule domains along the cilium based on microtubule number and MIPs.
Figure 1.
Slices through a motile cilium from respiratory epithelia. Slices at different z-heights were extracted from a tomogram to illustrate ciliary features. (A and B) Overall, the cilium base had an hourglass shape, with the TMTs of the proximal cilium giving way to DMTs (B). The basal foot (BF) and transition fibers (TF) were identified binding approximately to the TMT-containing region (B). In the DMT region, the CPC (A) and ODAs became apparent (B and insert in B). (C) The lumen of the microtubules changed along the cilium axis, from empty to striated (inset in C) to filled with electron-dense material. (D–J) We also examined the relationship between the electron-dense material inside the A-tubule and the appearance of the CPC. The dashed line in D–J denotes the start of the CPC (* in J). The CPC microtubule did not appear to be capped by a gTuRC, nor did it have any obvious attachments to the DMTs. For six of nine DMTs, we could identify the boundary between the striations and the electron-dense material (arrowheads), and in each case it was abrupt and occurred before the appearance of the CPC. Scale bars are 100 nm (A and B); 50 nm (insets and D–J).
We proceeded to more closely examine the transition between the striated MIPs and the electron-dense material within the DMTs of the distal ciliary base. By taking several z-slices through the cilium at this region, we could determine the boundary between the MIP patterns in seven of nine DMTs (Fig. 1, D–J, white arrowheads). In two of nine, the viewing angles did not allow this determination. While the boundary was not coincident across all seven of the nine DMTs, the MIP change occurred with an ∼100-nm window for all microtubules. This change in MIP pattern preceded the appearance of the first CPC microtubule (Fig. 1 J, asterisk). The CPC microtubule had an uncapped appearance, and it did not appear to make any connections with the surrounding DMTs. Furthermore, the lumenal region preceding the CPC showed no evidence for the barrel-shaped body that has been previously observed in Chlamydomonas flagella (Craige et al., 2010). This initial analysis showed many unique features of the ciliary base that we wanted to study in greater detail.
From BB to axonemal geometry
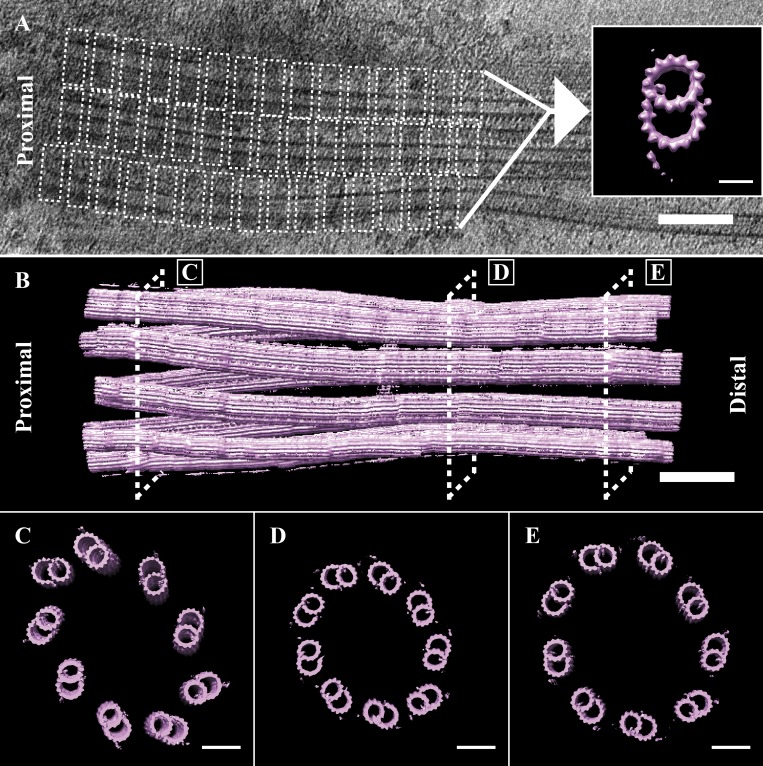
Our analysis thus far had focused on the unaveraged tomograms. To view more subtle features of our data, we needed to determine the structure of the cilium at higher resolution. To accomplish this, we used subvolume averaging to combine and enhance the signal from many structurally similar units to reveal the structure at higher resolution (Bharat et al., 2015; Briggs, 2013). Disk-shaped subvolumes, 3-tubulin heterodimers (∼24 nm) in height, were extracted along the first 800 nm of the proximal cilium, a region that contained both TMTs and DMTs (Fig. 2 A, dashed boxes). These subvolumes (n = 9,450) were then aligned to a common reference and averaged using RELION to generate a map representative of the entire microtubule population (Bharat et al., 2015). This average (EMBL-EBI accession number EMD-20675) showed robust signal for the A- and B-tubules, while most other features including the C-tubule were at <100% occupancy (Fig. 2 A, inset; and see Fig. 4, A and B).
Figure 2.
The transition from BB to axonemal geometry. (A) Subvolumes of the proximal 800 nm of the cilium, containing both TMTs and DMTs. DMTs were extracted (dashed boxes), aligned, and averaged to generate a global microtubule map of a DMT (inset). (B) The map was then refitted back into a tomogram to rebuild a whole cilium. (C–E) From this refit, we took cross sections (dashed boxes) that showed the geometry changes that occur along the proximal–distal axis. (C) The MTs at the proximal cilium were not parallel, but rather angled out with respect to each other. (D) By the constriction point at ∼500 nm in, the MTs had adopted a more in-line geometry, and adjacent DMTs were closer together. (E). The diameter then expanded such that by ∼800 nm in, the geometry of the cilium was axonemal. Scale bars are 100 nm (A and B); 50 nm (C–E).
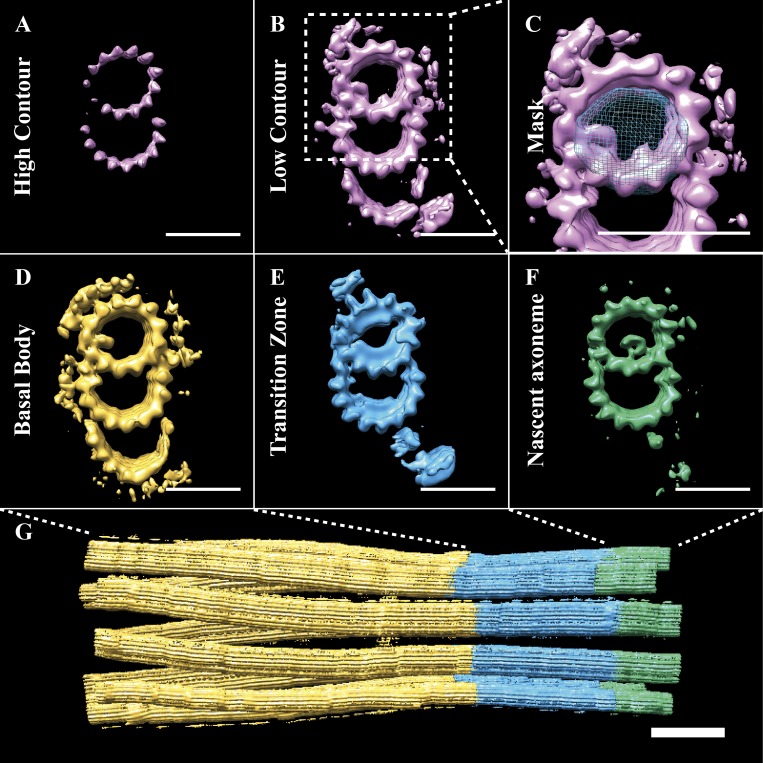
Figure 4.
A-tubule MIPs divide the cilium base into three subdomains. (A and B) At high contour (A), the whole-population map showed density for the A- and B-tubules, while at lower contour (B), the map also showed density for the C-tubule and many microtubule binding proteins. Classification of the subvolume population based on A-tubule MIPs (C; mask in blue) gave three major classes (D, E, and F) accounting for >90% of the data. (D) The largest class (∼61%) was composed of a TMT, with a characteristic bilobed MIP within the A-tubule. We defined this class as the BB. (E) The second most populous class (∼21%) showed a DMT, with extensive MIPs within the A-tubule, which we defined as the TZ. (F) The smallest class (∼10% of data) was a DMT, with a tube-like density inside the A-tubule. Its position relative to the appearance of the central pair MTs in the raw tomograms suggested that this was the nascent axoneme. (G) The extent of the BB, TZ, and axoneme subdomains. Scale bars are 25 nm (A–F); 100 nm (G).
To determine how the overall geometry changed from the BB through the axoneme, we rebuilt a whole cilium. We did this by repeatedly fitting the global average (3-tubulin heterodimers in length) back into a tomogram, to each location from which we had extracted a raw subvolume (also 3-tubulin heterodimers in length). As expected from the unaveraged tomograms (Fig. 1 A), this whole-cilium refit had the shape of an hourglass (Fig. 2 B). We then examined the pseudo-ninefold symmetry at key positions along the proximal–distal axis by taking cross sections (Fig. 2, C–E). Comparing these cross sections showed that the cilium was somewhat flattened and not perfectly cylindrical in shape (Fig. 2, C–E). This flattening was parallel to the plane of the ice sheet (Fig. S5) and more pronounced in the BB and TZ sections than the axoneme. One possibility is that the BB shows more flattening than the axoneme because it has additional structures, such as the basal foot and transition fibers, binding to the outside and increasing its overall diameter within the ice sheet. An additional possibility is that the axonemal dyneins provide strong mechanical forces that prevent compression of the axoneme.
Figure S5.
Ice thickness. (A) We overlaid the cilium refit and the vitreous ice in which it was suspended, and then took a cross section of ∼300 nm from the proximal end of the cilium. (B) The ice sheet is represented by a dashed box and is ∼370 nm thick. The cilium shows flattening parallel to the plane of the ice sheet. Scale bars are 200 nm.
A closer examination of the cilium cross sections showed significant changes in geometry along the ciliary base. The MTs of the proximal cilium had the characteristic angled-out appearance of BBs and centrioles (Fig. 2 C). By the constriction point ∼500 nm from the BB, this had changed to a more inline geometry, reminiscent of an axoneme (Fig. 2 D). Distal to the TZ, the diameter of the cilium expanded, such that by ∼800 nm from the BB proximal end, the diameter of the cilium was ∼220 nm, matching that of published axonemal structures (Fig. 2 E; Nicastro et al., 2005).
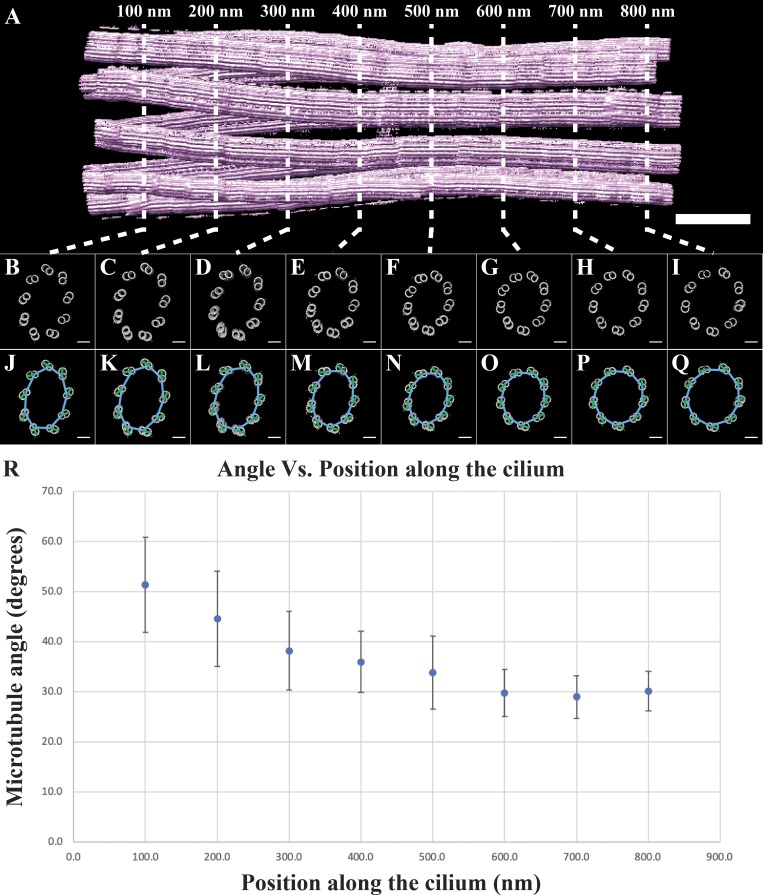
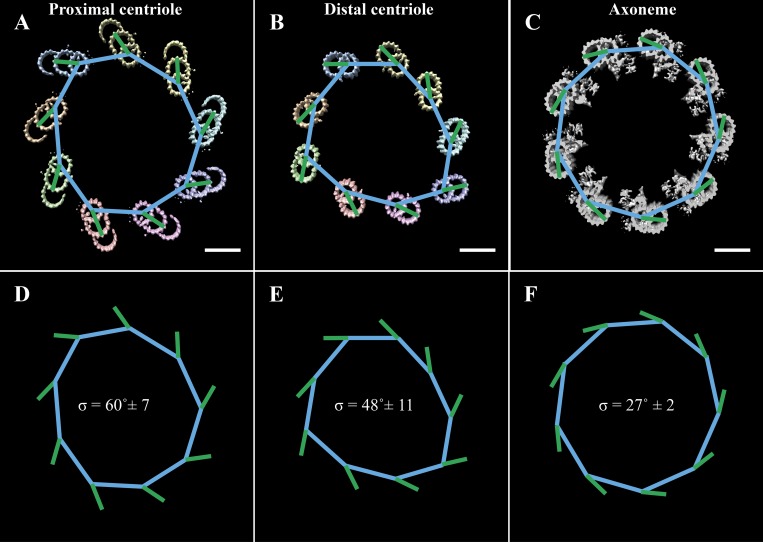
Previous studies have also shown that the angle of the microtubules changes along the proximal–distal axis of the centriole and BB (Li et al., 2012; Paintrand et al., 1992; Vaughan and Gull, 2016). We next wanted to quantitate these changes to geometry. To do this, we took cross sections through the cilium at 100-nm intervals (Fig. 3, A–I), fitted a nonagon through the nine A-tubules of each cross section (Fig. 3, J–Q, blue lines), and then determined the angle between each side of the nonagon and its closest DMT/TMT (Fig. 3, J–Q, green lines). The angle between the nonagon (blue) and microtubule (green) vectors was then measured and averaged for a given cross section and plotted as a function of position along the cilium axis (Fig. 3 R). This analysis showed that the angle of the microtubules changed along the proximal cilium, starting at ∼50° in the proximal BB and stabilizing at ∼30° in the nascent axoneme. An identical analysis in the intact axoneme (Fig. S1) gave an angle of ∼27°, suggesting that the necessary microtubule–microtubule angle changes have occurred by the nascent axoneme stage. Together, these angular changes along the rebuilt cilium indicated that axonemal geometry is set gradually, facilitated by changes to the microtubule–microtubule angles and the diameter of the cilium.
Figure 3.
Microtubule angle changes along the early cilium. (A) Cross sections were taken through the early cilium (0–800 nm) at 100-nm intervals. (B–I) It was obvious from these cross sections that there was a change to the microtubule geometry within the proximal cilium. (J–Q) To quantify these changes, we fitted a nonagon through the centers of the A-tubules (blue lines), determined the angle of the microtubules (A-tubule center to protofilament B06, green lines), and then measured the angle between the microtubule and the closest nonagon side. (R) The angles at each section are presented as a function of distance along the cilium axis. Scale bars are 100 nm (A); 50 nm (B–Q).
Figure S1.
Microtubule angle quantification in the centriole and axoneme. (A and B) Cross sections were taken through a CHO centriole, ∼50 and ∼400 nm from the proximal end. (C) A cross section was also taken through an axoneme from bovine tracheae. A nonagon was then fitted to the ninefold geometry of these cross sections. The sides of the nonagon were determined by drawing lines between the centers of adjacent DMTs (blue lines). The vector of the DMTs was defined by a line from the A-tubule center through protofilament B06 of the B-tubule (green lines). (D–F) The angles between a nonagon side and the microtubule were then measured and averaged for a given geometry. Scale bars are 50 nm.
Microtubule internal proteins distinguish three domains along the cilium length
We next wanted to see how the microtubule structure changed over the length of the cilium. From our initial global average, the only features present in all subvolumes were the A- and B-tubules (Fig. 4, A and B). To better understand the differences within our subvolume population, we used a technique called 3D classification to provide an unbiased grouping of subvolumes with common structural features (Bharat et al., 2015). Numerous classification regions were explored, with the most informative classification scheme focused on A-tubule MIPs (mask in Fig. 4 C). This strategy grouped the majority of subvolumes into three classes, corresponding to (a) the BB (first ∼500 nm of the cilium, EMD-20676); (b) the TZ (∼200-nm striated region, EMD-20679); and (c) the axoneme (portion of the cilium distal to the striated region where the CPC arose; EMD-20680; Fig. 4, D–F). Thus, differences in A-tubule MIPs uniquely defined the boundaries corresponding to the BB, the axoneme, and the TZ between them (Fig. 4 G).
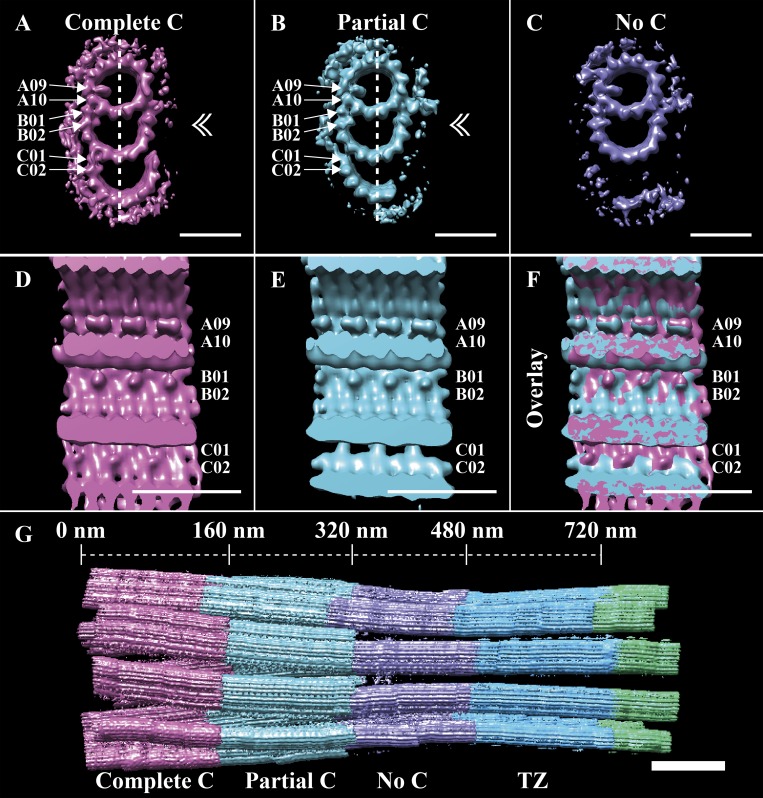
Using these classifications, we next sought to understand how the TMT structure of the BB converted to that of the DMT axoneme. In the TZ class, the C-tubule was absent (Fig. 4 E), indicating that TMT to DMT conversion likely happened within the BB. To determine if this was the case, we classified all BB-class subvolumes based on the completeness of their C-tubules. This classification gave three roughly equally sized classes: one containing TMTs with a complete C-tubule (EMD-20681), one containing TMTs with a partial C-tubule (EMB-20683), and one containing only DMTs (EMB-20684; Fig. 5, A–C). In the class containing partial C-tubules (Fig. 5 B), the C01 density was discontinuous (Fig. 5 E), with 8-nm periodicity rather than the pseudo-4-nm repeat expected for α/β-tubulins within a microtubule. The C02 MIP was also absent in the partial C-tubule class. This 8-nm repeating pattern at the C01 position contrasted with the continuous density at the C01 position in the complete C-tubule class (Fig. 5, compare D and E and overlay in F). These data revealed that the TMT to DMT conversion occurred within the BB (Fig. 5 G) via a partial TMT intermediate, correlating with changes to the outer BC junction and with the presence or absence of a C02 MIP. The end result is that changes along the length of the BB give rise to a distal BB comprising DMTs that are contiguous with the DMTs of the TZ.
Figure 5.
TMT-to-DMT conversion happens within the BB and correlates with changes to the outer BC junction. Subvolumes of the BB class were further classified based on their C-tubules, resulting in three major classes. (A) In one class (∼23%), the C-tubule was complete and had an MIP bound to protofilament C02. (B) A second class (∼24%) containing a partial C-tubule was also observed, but this class lacked the C02-bound MIP. (C) The final class (∼25%) contained no detectable C-tubule density. (D and E) When viewed from inside (plane of view defined by the dashed lines and double arrowheads in A and B), the C01 position was continuous in the TMT class (D) but periodic (8 nm) in the partial TMT class (E). (F) The differences at the outer BC junction, and the similarities in the A- and B-tubule MIPs, can be appreciated in the overlay. (G) A refit of the three BB classes back into the whole cilium shows the transition from TMTs to DMTs. Scale bars are 25 nm (A–F); 100 nm (G).
Structural identifiers of the TZ
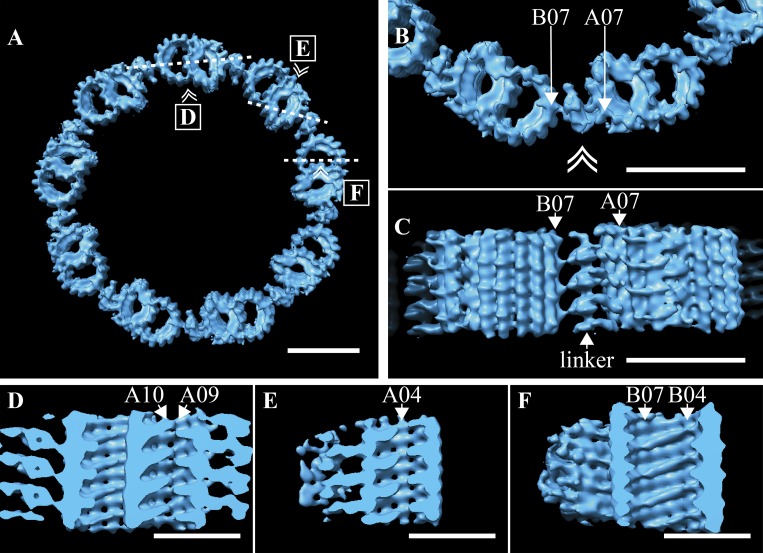
The TZ is implicated in endowing the cilium with specialized functions but is poorly characterized at the structural level (Reiter et al., 2012). Our initial classification based on MIPs broadly defined the TZ as a DMT-containing region distal to the BB, with extensive MIPs within the A- and B-tubules (Fig. 4 E). This class contained a potential DMT-DMT linker, though at <100% occupancy. We enriched for a subpopulation of TZ subvolumes in which this linker was at higher occupancy using subvolume classification (EMD-20685). We then used the subsequent average to regenerate the TZ symmetry and saw a linker connecting protofilament B07 of one DMT to A06/A07 of the next DMT (Fig. 6 A). This linker was specific to the TZ, so we named it the TZ-linker. The shape and connectivity of the TZ-linker could best be appreciated in the higher-magnification views (Fig. 6 B). When viewed from the side (double arrowhead in Fig. 6 B denotes viewpoint), the TZ-linker was seen to consist of a continuous central density that contacts protofilaments B07 and A07 with 8-nm periodicity (Fig. 6 C). The structure and position of the TZ-linker corresponded to the striations observed between the DMTs in the unaveraged tomograms (Fig. 1 C, inset). In summary, these data identify a novel structure, the TZ-linker, that spans adjacent DMTs along the ∼200-nm TZ region of the cilium.
Figure 6.
Defining features of the TZ. (A) The TZ average was used to regenerate the idealized symmetry of the TZ, where adjacent DMTs were connected via the TZ-linker. (B) A zoom-in view of two adjacent DMT shows how the TZ-linker spans adjacent DMTs, with the major contacts between A07 and B07, with B06 also contributing. (C) When viewed from the side (double arrowhead in B denotes viewing perspective in C), the 8-nm periodicity of the TZ-linker was apparent. (D and E) Shelf-shaped MIPs within the A-tubule formed a discontinuous helix that followed the internal lattice of the microtubule. The MIP helix was broken at the microtubule seam between protofilaments A09/A10 (D) and at protofilament A04 (E). (F) Within the B-tubule, similar shelf-shaped MIPs also straddled several protofilaments, from B04 to B07. Insets in A show the slice (dashed line) through the average and the viewing angle (double arrowhead) for D–F. Scale bars are 50 nm (A–C); 25 nm (D–F).
Within the TZ average, we also observed MIPs specific to the TZ microtubules (Fig. 6 B). These MIPs formed shelf-like structures within both the A- and B-tubules that tracked the lattice of the microtubule (Fig. 6, D–F). Within the A-tubule, the MIPs formed a discontinuous 3-start helix that was interrupted at the microtubule seam (A09–A10; Fig. 6 D) and at protofilament A04 (Fig. 6 E). Similarly shaped MIPs within the B-tubule also showed a 3-start helical pattern (Fig. 6 F). In both the A- and B-tubules, the distance between “shelves” was 8 nm, indicating that the MIPs bind to one specific microtubule interface and then track it around. The helical nature of these MIPs gave rise to the striations inside the DMTs of the unaveraged tomograms (Fig. 1 C, inset). Together, our data show that the TZ has unique helical patterns of MIPs inside the DMTs and unique connections between DMTs through the TZ-linker.
Structural identifiers of the axoneme
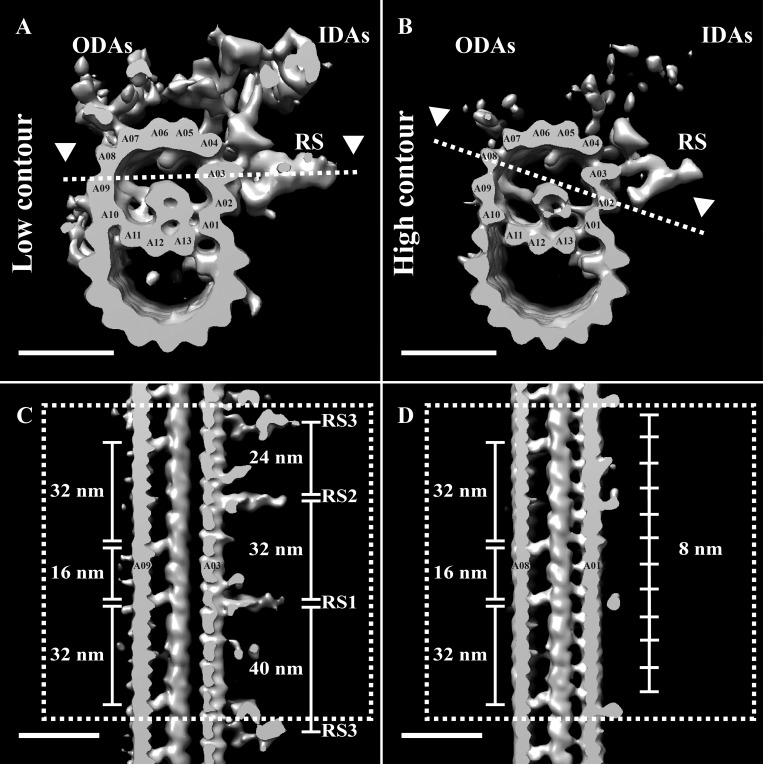
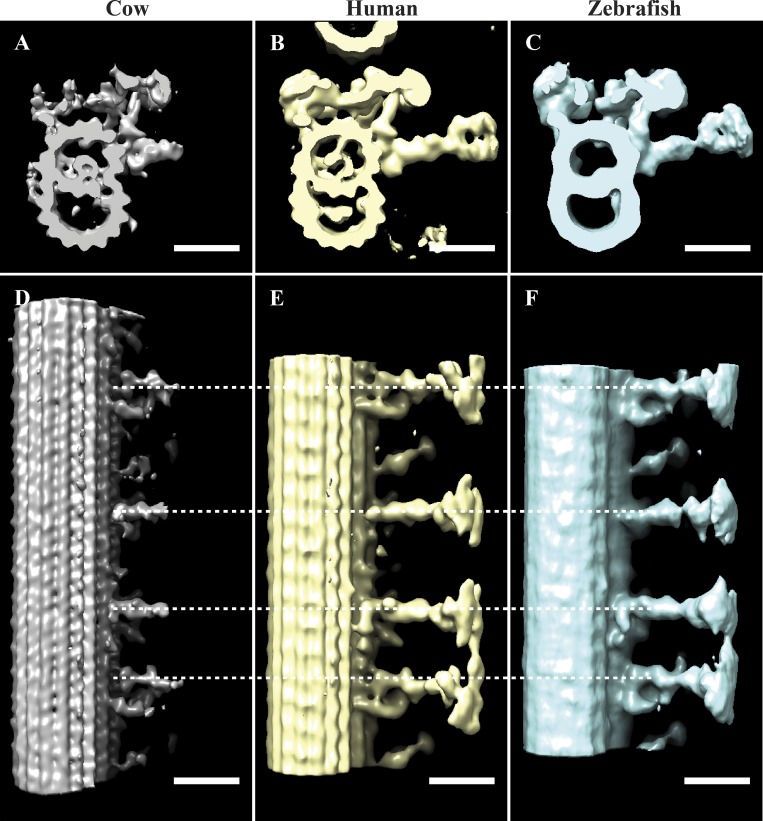
We next focused on the post-TZ region to determine where axonemal identity arose along the ciliary axis. Axonemes have been extensively studied by cryoEM, resulting in averages from different species (Ichikawa et al., 2017; Lin et al., 2014; Pigino et al., 2011; Yamaguchi et al., 2018). All axoneme structures thus far determined are composed of a 96-nm repeat that propagates along the length of the cilium. We wanted to determine the structure of the axonemal repeat in our motile cilia and see how it fit within the overall cilium architecture. To do this, we extracted 96-nm-long microtubule subvolumes in the region immediately distal to the TZ, the region where we first observed the electron-dense material within the A-tubule (Fig. 1 C). Subsequent subvolume alignment and averaging gave an average composed of a DMT with density for RS, IDAs, and ODAs (EMD-20674; Fig. 7 A). Thus, the defining features of the axoneme (RS, ODAs, and IDAs) were observed in the region following the TZ, and their shapes were indistinguishable from published mammalian structures (Fig. S3; Lin et al., 2014; Yamaguchi et al., 2018).
Figure 7.
Axoneme-specific components bind the DMT after the TZ. Subvolumes were extracted from a 600-nm stretch of the cilium distal to the TZ, aligned to a common reference, and averaged together (EMD-20674). (A) The average showed a DMT, and inside the A-tubule was a cylinder-shaped density connected to several protofilaments. The previously characterized MIP1 bound to protofilament A05 with 16-nm periodicity, and the outside of the A-tubule was decorated with density for RS, ODAs, and IDAs. (B) Differential contouring of the average showed that the RS, ODAs, and IDAs were at <100% occupancy compared with the DMT and a subset of MIPs. Slices through the A-tubule (dashed lines in A and B) allowed examination of the RS and MIPs. (C) The structure and spacing of the RS were identical to that of published axoneme structures (see Fig. S3). (D) The MIPs contributing to the cylinder-shaped density had a distinct periodicity, with the A09 MIPs having an alternating 32-/16-nm repeat, and the A01 MIPs an 8-nm repeat. Scale bars are 25 nm.
Figure S3.
Comparing axoneme structures. (A–C) We compared the structural features from our bovine axoneme average (EMD-20674; A) to those of published axonemes from human (EMD-5950, Lin et al., 2014; B) and zebrafish (EMD-6954, Yamaguchi et al., 2018; C). The shape and position of the ODAs, IDAs, and RS are consistent between maps. The cylinder-shaped density that we identified within the lumen of the A-tubule (A) is also observed in the human map (B) but is not obvious in the zebrafish map (C). (D–F) When viewed from the side, the periodicities and shapes of the RS are the same for all maps, although our average lacks the RS heads. Scale bars are 25 nm.
Strikingly, our axonemal average exhibited a cylinder-shaped structure inside the A-tubule that appeared to be formed by the coalescence of MIPs emanating from protofilaments A09–A13, A01, and A02 (Fig. 7 A). This structure filled approximately half the A-tubule, and its location was coincident with the electron-dense material observed within the A-tubules in the unaveraged tomograms (Fig. 1 C). This cylinder-shaped density likely corresponds to the “pentagon” structure observed in the flagella of human spermatozoa (Afzelius et al., 1995). A similar structure can be seen in the lumen of DMTs of human nasal cilia (Lin et al., 2014; Fig. S3), but not in the DMTs of Tetrahymena (Ichikawa et al., 2017). Taken together, these data suggest that this cylinder-shaped density within the A-tubule is conserved in vertebrate motile cilia.
We next examined a high-contour view of the axoneme average to identify the core components common to all axoneme subvolumes (Fig. 7 B). This view indicated that compared with the DMT, the IDAs and ODAs were at much less than 100% occupancy within our average. The high-contour average also allowed us to determine that the major contributors to the cylinder-shaped density within the A-tubule came from MIPs emanating from protofilaments A09 and A01 (Fig. 7 B). A previously described MIP, MIP1 (Nicastro et al., 2006), was also present on protofilament A05 at high occupancy, but did not interact with or contribute to the cylinder-shaped structure (Fig. 7, A and B). This partial occupancy of the dyneins was suggestive of how the axonemal components might assemble.
To more closely examine the structure and periodicity of the RS, a longitudinal slice was taken through the axoneme average (dashed line in Fig. 7 A; arrowheads indicate viewpoint). Consistent with previously published axoneme structures (Fig. S3), each 96-nm repeat in our average had three spokes, RS1–RS3, with spacings of 32, 24, and 40 nm, respectively (Fig. 7 C). While we detected no density for the RS heads, the shapes of the three RS themselves were identical to those of published human and zebrafish axonemes (Fig. S3; Lin et al., 2014; Yamaguchi et al., 2018). The similarity between the RS structure and spacing in this study and those of published structures not only showed how conserved the RS are through evolution, but also validated the general applicability of our cilium data to vertebrate cilia.
We next examined the periodicities of the MIPs contributing to the cylinder-shaped density within the A-tubule. A longitudinal slice through the A-tubule enabled us to observe both the A09 and A01 MIPs along an entire 96-nm unit (dashed line in Fig. 7 B; arrowheads indicate viewpoint). The MIPs that extended from protofilament A09 alternated between a 16-nm and a 32-nm gap, in a pattern that showed no overlap with the RS spacings (Fig. 7, C and D). When we compared the MIPs extending from protofilament A01, they had an apparent 8-nm periodicity, suggesting that they bound exclusively to either α- or β-tubulin (Fig. 7 D). That multiple MIPs bind across several protofilaments with different periodicities, yet all appear to coalesce into a larger ensemble structure, is fascinating but functionally unclear.
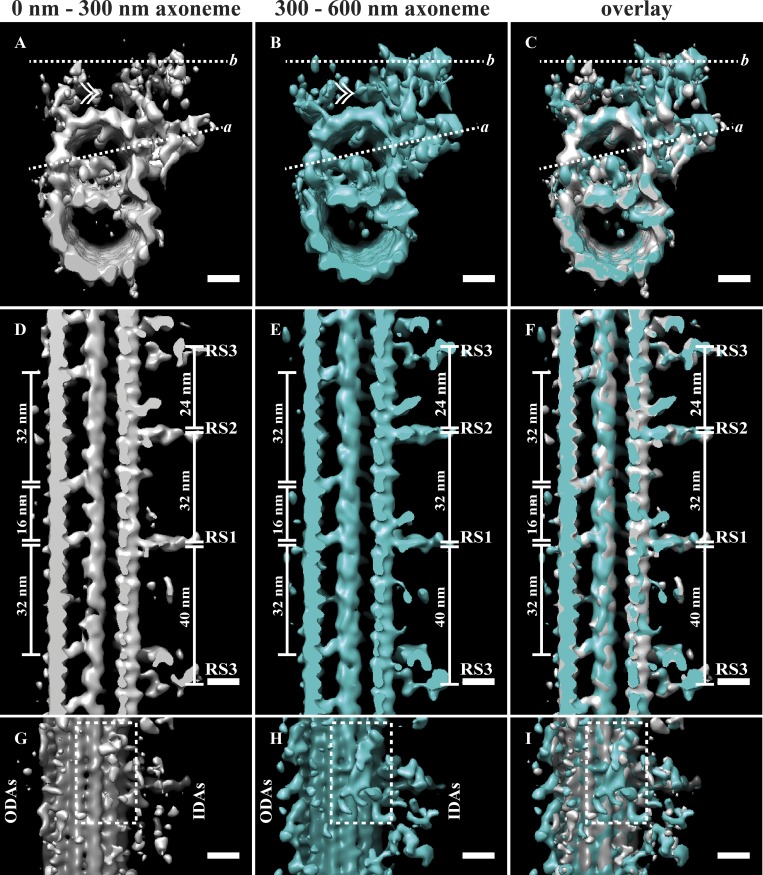
As we alluded to earlier, the different occupancy levels within our axoneme average suggested that we might be able to tease apart an order of addition of axonemal components. It has previously been shown that dyneins are missing at the proximal region of the Chlamydomonas axoneme (Bui et al., 2012). We tried classification on the axoneme dataset, with the aim of grouping together subvolumes on the basis of ODAs, IDAs, and RS. This strategy did not work, presumably because of the relatively small number of subvolumes. Thus, we decided to group subvolumes on the basis of position along the cilium. We split the axoneme population into two groups: 0–300 and 300–600 nm of the nascent axoneme (Fig. 8, A–C). Comparing longitudinal sections of these averages revealed little difference in terms of the DMTs, MIPs, and RS (Fig. 8, D–F). However, when we compared top-down views (Fig. 8, G–I), we saw differences in dynein occupancy. The 300–600-nm average showed a more robust signal for both the IDAs and ODAs than the 0–300-nm map (Fig. 8, G–I). Furthermore, while the nexin-DRC density was strong in the 300–600-nm average (Fig. 8 H), we saw little evidence for it in the 0–300-nm average. Together, these data suggest that the addition or incorporation of the MIPs and RS happens in the proximal-most region of the axoneme, while the dyneins and nexin-DRC that link adjacent DMT occurs more distally.
Figure 8.
Order of appearance of axoneme components. (A–C) We split the axoneme data into two halves corresponding to the first 300 nm (A) and the second 300 nm (B) of the nascent axoneme and generated two independent averages (overlay in C). Dashed line a is the view seen in D–F, and dashed line b is the view in G–I. (D–F) The MIPs and RS were of comparable occupancy in both averages (compare D and E and overlay in F). (G–I) When we compared the b views between the averages, the ODAs, DRC, and IDAs were at higher occupancy in the 300–600-nm average, and the DRC-nexin density (dashed box) was absent in the 0–300-nm average. Scale bars are 10 nm.
Discussion
In this study, we have gained a comprehensive understanding of the architecture of the motile cilium. Centrioles/BBs and axonemes are relatively straightforward to purify and have been the subject of previous cryoET studies (Greenan et al., 2018; Guichard et al., 2012; Ichikawa et al., 2017; Li et al., 2012; Paintrand et al., 1992). However, purifying the entire structure of the BB through the axoneme, allowing an analysis of the TZ, has been challenging. Here, we purified complete cilia from cow tracheae and combined cryoET with subvolume averaging to generate a detailed analysis of the ciliary base, a region that contains the BB, the TZ, and the proximal axoneme. This revealed structural features that define the TZ and have provided a new understanding of the structural transitions necessary to make an axoneme from a BB. In particular, this higher-resolution view revealed that the larger-scale ultrastructural changes previously described correlate with highly localized changes in the patterns of specific MIPs and microtubule linkages.
The triplet to doublet transition
Mammalian BBs are composed of TMTs, while axonemes are composed of DMTs. This reduction in microtubule number is necessary for the formation of a motile cilium in which dynein motors docking to one DMT generate movement along an adjacent DMT. However, it has been unclear where and how this TMT to DMT transition happens.
Our data show that the TMT to DMT change happens not within the TZ, but via a well-defined, discrete intermediate within the BB (Fig. 5). The proximal BB is composed of TMTs, transitioning to a partial C-tubule ∼160 nm from the proximal end, which in turn transitions to a DMT. The conversion to DMTs is complete by ∼320 nm (Fig. 5 G), a point corresponding with the beginning of the ciliary constriction. This transition from TMTs to DMTs is consistent with data from Chlamydomonas, where the C-tubule also terminates within the proximal 400 nm of the BB (Li et al., 2012). Our cilia data also show that MIPs within the A- and B-tubules seem unperturbed throughout the TMT–DMT transition and provide a good definition for the extent of the BB (Fig. 5, A–C). We had previously observed a similar behavior in centrioles, where the disappearance of the distal C-tubule goes through stages of disappearance (Greenan et al., 2018). The end result is a region at the distal BB that is composed of DMTs but still contains the A09/A10 MIP, which is characteristic of the BB. Together, these data show that the TMT to DMT transition occurs within the BB.
Classification of the BB data based on the C-tubule further suggested how the disappearance of the C-tubule is mediated. Within the BB, the outer BC junction shows three different structural patterns at position C01: continuous along the BB axis (likely a 4-nm or pseudo-4-nm repeat), discontinuous (with an 8-nm repeat), and empty (Fig. 5, D–F). These three modes correlate with the complete, partial, and absent C-tubules, respectively. We propose that the composition of the outer BC junction is determined by two distinct length-setting mechanisms that determine the emergence and persistence of the partial C-tubule. From our centriole studies, it is apparent that the conversion from TMTs to DMTs must begin well before the centriole docks at the membrane to form a BB. While the function of a partial C-tubule is unclear, it may play a role in demarcating the boundaries and positions of the basal foot and transition fibers. Consistent with this, observations from our unaveraged tomograms suggest that the basal foot ends and the transition fibers emerge in the region where the C-tubule disappears. That the C-tubule changes first occur in the centriole suggests that the attachment of the basal foot and transition fibers is in response to changes in the underlying architecture and not causative.
Geometry
One outstanding question in the field is how the axoneme geometry is set by the BB. Although both the BB and axoneme are microtubule-based, ninefold quasi-symmetric structures, their geometries differ significantly. Our data reveal, for the first time, how the geometry of the whole ninefold structure changes between the BB and the axoneme (Fig. 3).
Overall, the ciliary base has an hourglass shape, with the BB tapering inward to a restriction point at the proximal TZ, and then spreading outward along the TZ. We previously observed a tapering along the proximal–distal axis of the mammalian centriole (Greenan et al., 2018). A reexamination of our centriole data allowed us to determine the geometry at the extreme distal end of a centriole (Fig. S1 B). This geometry is not the same as that of the ciliary TZ, in which the TZ DMTs show a much more pronounced inline geometry (Fig. 3, F and G). Together, these data suggest that while the disappearance of the C-tubule happens in the BB, the actual DMT geometry of the TZ is not seen in the distal centriole and must therefore be dictated by structures unique to the TZ. The most likely candidate is the TZ-linker, suggesting that the inward tapering along the BB brings the DMTs of the distal BB close enough together to allow the TZ-linker to bridge DMTs.
How the TZ subsequently expands and eventually gives rise to the axonemal diameter is not immediately obvious from our data. One possibility is that polymerization of the TZ-linker drives expansion of the cilium diameter. The TZ-linker is hinge-like in shape and would have the capacity to lengthen, increasing the gaps between adjacent DMTs as it polymerizes. The maximum capacity of the TZ-linker to lengthen would restrict its range along the cilium axis, presenting an inherent length-setting mechanism. Once the TZ-linker is no longer bound to protofilament A07, this would allow access for the ODAs that also bind to A07. Another possibility is that the dynein arms are the driving force for setting the final geometry, and the TZ-linker provides sufficient flexibility to accommodate the conversion to an axonemal geometry. Identification and characterization of the TZ-linker and MIPs will shed light on their contribution to the BB–axoneme transition.
MIPs
While we tried many alternative 3D classification strategies during our data analysis, grouping microtubule subvolumes together based on their A-tubule MIPs resulted in cohesive groups corresponding to the BB, the TZ, and the axoneme (Fig. 4). The BB was characterized by a bilobed-shaped MIP straddling the A09/A10 protofilaments, the site of the microtubule seam (Ichikawa et al., 2017). In our previous work on mammalian and fly centrioles, we observed the same MIP and suggested it as a centriole marker (Greenan et al., 2018). The position and structure of this MIP are highly conserved between centrioles and BBs in this study, and we speculate that it could play a role in the stability or functionalization of the microtubule seam, or in limiting the extent of microtubule depolymerization during cilium resorption.
A structurally unrelated MIP pattern is the defining feature of the TZ. The MIPs in the TZ form shelf-like protrusions within the lumen of the A- and B-tubules (Fig. 6). Within the A-tubule, these shelf-like MIPs form a discontinuous 3-start helix that appears to track the lattice of the microtubule. Similarly, the more limited B-tubule MIPs of the TZ also track the microtubule lattice. A similar helix was previously described binding to the inside of the distal microtubules of human sperm (Zabeo et al., 2018). Defining the function of these helical MIPs is an important direction for future work; possible roles could be as structural struts, helping to define TZ geometry, or inducing conformational changes in the microtubule that functionalize the outer surface of the microtubule lattice.
From both the unaveraged data and our subvolume averages, the TZ MIPs terminate abruptly, giving rise to a third MIP domain that characterizes the axoneme (Fig. 1 C). We observed an elaborate structure in which MIPs extending from multiple protofilaments appear to coalesce to form a cylinder-shaped density within the A-tubule (Fig. 7). Such a structure has previously been described as a pentagon within the A-tubule of human spermatozoa (Afzelius et al., 1995). In light of our current findings, a reexamination of published cryoET maps is consistent with such a structure in human-respiratory axonemes (Fig. S3; Lin et al., 2014). Previous published axonemal structures of comparable and better resolution have not revealed this structure (Ishikawa, 2017; Yamaguchi et al., 2018), suggesting that the cylinder-shaped density may be specific to motile, mammalian axonemes. While we do not know the function of the cylinder-shaped density, given its protofilament-bridging nature, we postulate that it acts as a structural brace.
Defining the TZ
One feature that is often used to define the TZ are the Y-links, structures that bridge the gap between the DMTs and the membrane (Gilula and Satir, 1972). These Y-links have been observed in thin sections of embedded cilia and appear distal to the transition fibers, which would place them in the distal BB or proximal TZ. However, we see no evidence for Y-links in either the unaveraged tomograms or subvolume averages of these regions, perhaps due to detergent removal of membrane in our cilium preparations.
From our motile cilia data, the unifying feature of TZ microtubules is the shelf-like MIPs that decorate the lumen of the A-tubule. A second feature are the TZ-linkers (Fig. 6 B). These are distinct linkages that connect adjacent TZ DMTs and produce the striated pattern observed in the raw data. These linkers were not at 100% occupancy in the overall TZ average, suggesting either structural flexibility or that they do not persist throughout the entire TZ. Upon enriching for the linker by subvolume 3D classification, we can see that the TZ-linker bridges adjacent DMTs, providing a novel linkage between the A07 and B06/B07 protofilaments (Fig. 6 B). The position of this TZ-linker is different from the position of the A-C linker seen in centrioles (protofilament A09), indicating yet another novel lineage that can link DMTs (see Fig. S2 for comparison). One function of the TZ-linker would appear to be to hold the DMTs together. In addition, the TZ-linker may play a role in defining the geometry of the axoneme, since the appearance of the TZ-linker is coincident with the expansion in diameter of the axoneme. Further work identifying the components of the TZ-linker will provide a foundation for addressing these questions.
Figure S2.
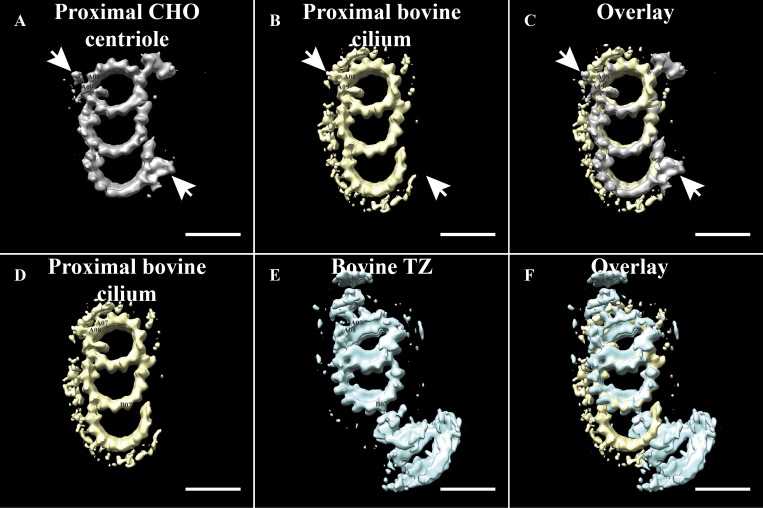
Comparing microtubule linkers. We compared the linkers of the proximal centriole with the proximal BB (top panels) and the proximal BB with the TZ (bottom panels). (A) Average of the proximal CHO centriole (EMD-7776; Greenan et al., 2018), with arrows indicating the location of the A-C linker. (B) In the proximal bovine cilium (EMD-20681), a canonical A-C linker is not seen, but densities are observed binding in the A08/A09 area. (C) In the overlay, the common features between the centriole and BB can be appreciated. Note in particular the absence of the A-C linker attaching to protofilaments of the C-tubule in the bovine BB, suggesting a different type of linker. (D) The major densities binding to the outside of the A tubule of the proximal BB (EMD-20681) bind to protofilaments A07 and A08. (E) In the TZ (EMD-20685), the TZ-linker binds predominantly to protofilament A07, with additional contacts with protofilament A06 also seen at a different contour level. Scale bar is 25 nm.
Outlook
Integrating our current data with that from previous studies on centrioles, BBs, and axonemes has allowed us to speculate what roles the nonmicrotubule densities play in microtubule functionalization and stabilization, and in the process of ciliogenesis more broadly. Following docking of a centriole to the plasma membrane via its distal appendages, the ciliary compartment is established and is distinct from the cytoplasm (Fig. 9 A). In this newly established compartment, the DMTs of the distal BB elongate and are bound by the TZ-linker and the shelf-like TZ MIPs that characterize the TZ (Fig. 9 B). The diameter of the cilium expands along the length of the TZ, resulting in axoneme-like geometry. Well-characterized proteins of the axoneme such as the RS, IDAs, and ODAs are then able to bind to the DMTs (Fig. 9 C). Within the DMTs of the axoneme, MIPs coalesce to form a cylinder-like density, presumably providing structural support to the axonemal microtubules, perhaps even providing positional cues to other microtubule-associated proteins such as the RS (Fig. 9 C). Once established, the axoneme elongates to form a functional motile cilium several micrometers in length.
Figure 9.
Subdomains of the ciliary base during cilium formation. (A) The distal end of the centriole docks to the plasma membrane via its distal appendages and becomes the BB. (B) The DMTs of the distal BB then extend to form the TZ. Adjacent DMTs of the TZ are linked to each other via the TZ-linker and decorated internally with helical MIPs. (C) The axoneme then grows distally, becoming decorated with RS and dyneins to form a motile axoneme.
Our cryoET imaging of cilia followed by subvolume averaging allowed us to visualize the numerous densities decorating both the internal and external surfaces of the ciliary microtubules. The work of assigning identities to the nonmicrotubule densities throughout the cilium, and assessing their contribution to a functional cilium, are now critical directions for future research. Furthermore, the major limitation of this current study was our inability to identify how the microtubules interact with the plasma and ciliary membranes. Interactions between the distal appendages and the plasma membrane, and the ciliary membrane and microtubules of the TZ, are central to cilium formation and function. Understanding these interactions requires imaging cilia in situ, the next big challenge for the field.
Materials and methods
Sample preparation
Fresh bovine tracheae were collected from the slaughterhouse and immediately placed in ice-cold PBS. Transport to the laboratory took ∼90 min, and all subsequent steps were performed in the cold room at 4°C. The purification of intact cilia was based on published work (Anderson, 1974), with several adaptations. The tracheae were left as an intact unit for the preparation and not cut into pieces as previously described. Large surgical clamps were used to close one end of the trachea. The trachea was then washed with PBS and saline by filling it up (∼500 ml) and then pouring it out completely. After the washes, ∼100 ml extraction medium (0.25 M sucrose, 0.001 M EDTA, 0.025 M KCl, 0.02 M Hepes buffer, pH 7.5, and 0.05% Triton X-100) was added, the second end was closed with surgical clamps, and the trachea was vigorously shaken for 2 min. This was performed for approximately five trachea, the lysates were pooled, and the cell cortices were sedimented at 600 g for 10 min. Using a dissecting microscope, entire apical cortices containing hundreds of cilia were seen. We then used a needle and syringe to break them apart to make smaller assemblies for cryoET imaging. Subsequent imaging showed that the BB and axoneme remained intact as one structure, indicating that this was an excellent purification scheme for studying the BB-to-axoneme transition. Purification of axonemes with intact membranes was essentially the same, except that the Triton X-100 was removed from the extraction buffer, resulting in intact axonemes after vigorous shaking of the clamped trachea. The resulting axonemes were then concentrated by centrifugation.
Grid preparation
EM grids (Quantifoil R 2/2 Cu 200 mesh) were glow discharged for 25 s. A grid was picked up with tweezers and loaded into the chamber of an FEI Vitrobot Mark III, preequilibrated to 100% relative humidity and 4°C. Then 3 µl of a cilia/axoneme solution (diluted cilia in 1× BRB80 and a dilute 10-nm fiducial-gold solution) was placed on each grid, and the sample was allowed to attach to the grid for ∼1 min. The grids were blotted for 10–30 s and then plunge frozen in liquid ethane.
Image acquisition and data processing
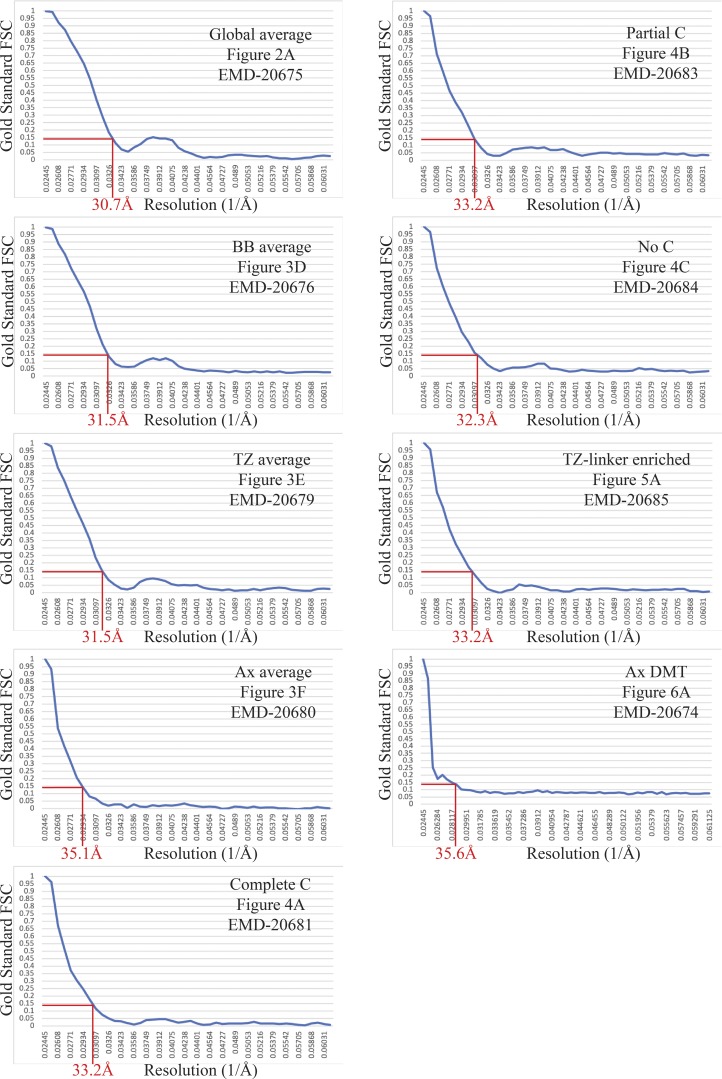
Imaging was performed on an FEI Tecnai Polara microscope operating at 300 kV, controlled using UCSF Tomography software. Images were acquired after a Gatan GIF Quantum Energy Filter on a Gatan K2 camera. Image dose rate was ∼8 electrons/px/s for a total dose of ∼80 e/Å2. For each cilium, a tilt series was acquired from 60° to −60° with 1° angular sampling. The defocus range was from −3.8 µm to 4.7 µm. Tilt series were aligned using gold-bead alignment in IMOD (Kremer et al., 1996), and tomograms were generated using the EWBP method in Priism (Chen et al., 1996). Tilts more than −50° were excluded from the final tomograms. Subsequent subvolume alignment, averaging, and classification were performed using RELION (Bharat et al., 2015). For our initial reference, we used a TMT average of the proximal CHO centriole (EMD-7776). Manual curation of the data was performed to check for consistency of angles and translations along and between rods of a given centriole. For the BB and TZ, 3-heterodimer-long subvolumes were aligned to a reference model to determine the periodicities of the microtubule-binding densities. For the axoneme average, 96-nm-long subvolumes were extracted and used for averaging. Pixel size was 8.09 Å, and the resolution of our averages ranged from 30 to 35 Å (see Fig. S4 for individual resolution). The gold standard Fourier shell correlation (0.14 cutoff) was used for resolution determination and was determined using Refine3D in RELION 3.0. For 3D classification, masks were generated in RELION around the region of interest (i.e., the lumen of the A-tubule in Fig. 3 C), and 50 rounds of classification were performed without alignment to generate stable classes. For angle quantification, we fitted a nonagon through the center of the A-tubules for each geometry (Fig. S1). We then measured the angle between each microtubule blade and its closest nonagon side. We did this for several geometries and present the work in Fig. S1. UCSF Chimera (Pettersen et al., 2004), ImageJ (National Institutes of Health), and Adobe Creative Cloud were used for data analysis and figure preparation.
Figure S4.
Resolution determination. The gold-standard Fourier shell correlation data from RELION 3.0 output files were used (0.14 cutoff) to determine resolution, indicated in red on each plot.
Data availability
The following maps are available in the Electron Microscopy Data Bank: EMD-20674, nascent axoneme from bovine respiratory epithelial cells; EMD-20675, whole-population average of the first 800 nm of the bovine respiratory epithelium; EMD-20676, average of the BB from bovine respiratory cilia; EMD-20679, average of the TZ from bovine respiratory cilia; EMD-20680, average of the proximal axoneme from bovine respiratory cilia; EMD-20681, average of the proximal BB from bovine respiratory cilia; EMD-20683, average of the mid BB from bovine respiratory cilia; EMD-20684, average of the distal BB from bovine respiratory cilia; and EMD-20685, average of the TZ-linker from bovine respiratory cilia.
Online supplemental material
Fig. S1 shows the quantification of microtubule angles in the mammalian centriole and axoneme. Fig. S2 compares microtubule–microtubule linkers between centrioles and the motile cilium. Fig. S3 compares axoneme structures from previously published studies to axonemes with our current average. Fig. S4 shows the resolution determination of each of our averages using the gold standard Fourier shell correlation in RELION. Fig. S5 shows that the ice thickness in our tomograms is thicker than the axoneme, but flattening is along the plane of the ice sheet.
Acknowledgments
We thank members of the Agard and Vale laboratories for providing a unique scientific environment in which to perform these experiments. In particular, we thank Nan Zhang, Stefan Niekamp, Gira Bhabha, and Iris Grossmann for help with the trachea preps. CryoET imaging and analysis were done with the help and support of the amazing EM facility at the University of California, San Francisco (Michael Braunfeld and David Bulkley), and the Wynton computing cluster at the University of California, San Francisco. Special thanks to Matt Harrington and Eric Branlund for help and advice on computing issues and Kara McKinley for discussions and feedback on manuscript preparation.
This work was made possible by generous funding from National Institutes of Health grants GM031627 (D.A. Agard), GM118099 (D.A. Agard), and GM118106 (R.D. Vale), National Institutes of Health S10 equipment grants (S10OD020054 and S10OD021741), and funding from the Howard Hughes Medical Institute (D.A. Agard and R.D. Vale).
The authors declare no competing financial interests.
Author contributions: G.A. Greenan, R.D. Vale, and D.A. Agard conceived the study and designed the experiments. G.A. Greenan performed the biochemistry, data acquisition, and structure refinement. G.A. Greenan, R.D. Vale, and D.A. Agard together analyzed the data and prepared the manuscript for publication.
References
- Afzelius B.A., Dallai R., Lanzavecchia S., and Bellon P.L.. 1995. Flagellar structure in normal human spermatozoa and in spermatozoa that lack dynein arms. Tissue Cell. 27:241–247. 10.1016/S0040-8166(95)80044-1 [DOI] [PubMed] [Google Scholar]
- Anderson R.G. 1972. The three-dimensional structure of the basal body from the rhesus monkey oviduct. J. Cell Biol. 54:246–265. 10.1083/jcb.54.2.246 [DOI] [PMC free article] [PubMed] [Google Scholar]
- Anderson R.G. 1974. Isolation of ciliated or unciliated basal bodies from the rabbit oviduct. J. Cell Biol. 60:393–404. 10.1083/jcb.60.2.393 [DOI] [PMC free article] [PubMed] [Google Scholar]
- Bharat T.A.M., Russo C.J., Löwe J., Passmore L.A., and Scheres S.H.W.. 2015. Advances in Single-Particle Electron Cryomicroscopy Structure Determination applied to Sub-tomogram Averaging. Structure. 23:1743–1753. 10.1016/j.str.2015.06.026 [DOI] [PMC free article] [PubMed] [Google Scholar]
- Briggs J.A. 2013. Structural biology in situ--the potential of subtomogram averaging. Curr. Opin. Struct. Biol. 23:261–267. 10.1016/j.sbi.2013.02.003 [DOI] [PubMed] [Google Scholar]
- Bui K.H., Yagi T., Yamamoto R., Kamiya R., and Ishikawa T.. 2012. Polarity and asymmetry in the arrangement of dynein and related structures in the Chlamydomonas axoneme. J. Cell Biol. 198:913–925. 10.1083/jcb.201201120 [DOI] [PMC free article] [PubMed] [Google Scholar]
- Chen H., Hughes D.D., Chan T.A., Sedat J.W., and Agard D.A.. 1996. IVE (Image Visualization Environment): a software platform for all three-dimensional microscopy applications. J. Struct. Biol. 116:56–60. 10.1006/jsbi.1996.0010 [DOI] [PubMed] [Google Scholar]
- Craige B., Tsao C.C., Diener D.R., Hou Y., Lechtreck K.F., Rosenbaum J.L., and Witman G.B.. 2010. CEP290 tethers flagellar transition zone microtubules to the membrane and regulates flagellar protein content. J. Cell Biol. 190:927–940. 10.1083/jcb.201006105 [DOI] [PMC free article] [PubMed] [Google Scholar]
- Fisch C., and Dupuis-Williams P.. 2011. Ultrastructure of cilia and flagella - back to the future! Biol. Cell. 103:249–270. 10.1042/BC20100139 [DOI] [PubMed] [Google Scholar]
- Gilula N.B., and Satir P.. 1972. The ciliary necklace. A ciliary membrane specialization. J. Cell Biol. 53:494–509. 10.1083/jcb.53.2.494 [DOI] [PMC free article] [PubMed] [Google Scholar]
- Gonçalves J., and Pelletier L.. 2017. The Ciliary Transition Zone: Finding the Pieces and Assembling the Gate. Mol. Cells. 40:243–253. 10.14348/molcells.2017.0054 [DOI] [PMC free article] [PubMed] [Google Scholar]
- Greenan G.A., Keszthelyi B., Vale R.D., and Agard D.A.. 2018. Insights into centriole geometry revealed by cryotomography of doublet and triplet centrioles. eLife. 7:e36851 10.7554/eLife.36851 [DOI] [PMC free article] [PubMed] [Google Scholar]
- Guichard P., Desfosses A., Maheshwari A., Hachet V., Dietrich C., Brune A., Ishikawa T., Sachse C., and Gönczy P.. 2012. Cartwheel architecture of Trichonympha basal body. Science. 337:553 10.1126/science.1222789 [DOI] [PubMed] [Google Scholar]
- Heuser T., Raytchev M., Krell J., Porter M.E., and Nicastro D.. 2009. The dynein regulatory complex is the nexin link and a major regulatory node in cilia and flagella. J. Cell Biol. 187:921–933. 10.1083/jcb.200908067 [DOI] [PMC free article] [PubMed] [Google Scholar]
- Ichikawa M., Liu D., Kastritis P.L., Basu K., Hsu T.C., Yang S., and Bui K.H.. 2017. Subnanometre-resolution structure of the doublet microtubule reveals new classes of microtubule-associated proteins. Nat. Commun. 8:15035 10.1038/ncomms15035 [DOI] [PMC free article] [PubMed] [Google Scholar]
- Ishikawa T. 2017. Axoneme Structure from Motile Cilia. Cold Spring Harb. Perspect. Biol. 9:a028076 10.1101/cshperspect.a028076 [DOI] [PMC free article] [PubMed] [Google Scholar]
- Kremer J.R., Mastronarde D.N., and McIntosh J.R.. 1996. Computer visualization of three-dimensional image data using IMOD. J. Struct. Biol. 116:71–76. 10.1006/jsbi.1996.0013 [DOI] [PubMed] [Google Scholar]
- Li S., Fernandez J.J., Marshall W.F., and Agard D.A.. 2012. Three-dimensional structure of basal body triplet revealed by electron cryo-tomography. EMBO J. 31:552–562. 10.1038/emboj.2011.460 [DOI] [PMC free article] [PubMed] [Google Scholar]
- Lin J., Yin W., Smith M.C., Song K., Leigh M.W., Zariwala M.A., Knowles M.R., Ostrowski L.E., and Nicastro D.. 2014. Cryo-electron tomography reveals ciliary defects underlying human RSPH1 primary ciliary dyskinesia. Nat. Commun. 5:5727 10.1038/ncomms6727 [DOI] [PMC free article] [PubMed] [Google Scholar]
- Malicki J.J., and Johnson C.A.. 2017. The Cilium: Cellular Antenna and Central Processing Unit. Trends Cell Biol. 27:126–140. 10.1016/j.tcb.2016.08.002 [DOI] [PMC free article] [PubMed] [Google Scholar]
- Nicastro D., McIntosh J.R., and Baumeister W.. 2005. 3D structure of eukaryotic flagella in a quiescent state revealed by cryo-electron tomography. Proc. Natl. Acad. Sci. USA. 102:15889–15894. 10.1073/pnas.0508274102 [DOI] [PMC free article] [PubMed] [Google Scholar]
- Nicastro D., Schwartz C., Pierson J., Gaudette R., Porter M.E., and McIntosh J.R.. 2006. The molecular architecture of axonemes revealed by cryoelectron tomography. Science. 313:944–948. 10.1126/science.1128618 [DOI] [PubMed] [Google Scholar]
- Paintrand M., Moudjou M., Delacroix H., and Bornens M.. 1992. Centrosome organization and centriole architecture: their sensitivity to divalent cations. J. Struct. Biol. 108:107–128. 10.1016/1047-8477(92)90011-X [DOI] [PubMed] [Google Scholar]
- Pettersen E.F., Goddard T.D., Huang C.C., Couch G.S., Greenblatt D.M., Meng E.C., and Ferrin T.E.. 2004. UCSF Chimera--a visualization system for exploratory research and analysis. J. Comput. Chem. 25:1605–1612. 10.1002/jcc.20084 [DOI] [PubMed] [Google Scholar]
- Pigino G., Bui K.H., Maheshwari A., Lupetti P., Diener D., and Ishikawa T.. 2011. Cryoelectron tomography of radial spokes in cilia and flagella. J. Cell Biol. 195:673–687. 10.1083/jcb.201106125 [DOI] [PMC free article] [PubMed] [Google Scholar]
- Reiter J.F., and Leroux M.R.. 2017. Genes and molecular pathways underpinning ciliopathies. Nat. Rev. Mol. Cell Biol. 18:533–547. 10.1038/nrm.2017.60 [DOI] [PMC free article] [PubMed] [Google Scholar]
- Reiter J.F., Blacque O.E., and Leroux M.R.. 2012. The base of the cilium: roles for transition fibres and the transition zone in ciliary formation, maintenance and compartmentalization. EMBO Rep. 13:608–618. 10.1038/embor.2012.73 [DOI] [PMC free article] [PubMed] [Google Scholar]
- Rohatgi R., Milenkovic L., and Scott M.P.. 2007. Patched1 regulates hedgehog signaling at the primary cilium. Science. 317:372–376. 10.1126/science.1139740 [DOI] [PubMed] [Google Scholar]
- Satir P., and Christensen S.T.. 2007. Overview of structure and function of mammalian cilia. Annu. Rev. Physiol. 69:377–400. 10.1146/annurev.physiol.69.040705.141236 [DOI] [PubMed] [Google Scholar]
- Satir P., Heuser T., and Sale W.S.. 2014. A Structural Basis for How Motile Cilia Beat. Bioscience. 64:1073–1083. 10.1093/biosci/biu180 [DOI] [PMC free article] [PubMed] [Google Scholar]
- Satir P., Pedersen L.B., and Christensen S.T.. 2010. The primary cilium at a glance. J. Cell Sci. 123:499–503. 10.1242/jcs.050377 [DOI] [PMC free article] [PubMed] [Google Scholar]
- Sui H., and Downing K.H.. 2006. Molecular architecture of axonemal microtubule doublets revealed by cryo-electron tomography. Nature. 442:475–478. 10.1038/nature04816 [DOI] [PubMed] [Google Scholar]
- Vaughan S., and Gull K.. 2016. Basal body structure and cell cycle-dependent biogenesis in Trypanosoma brucei. Cilia. 5:5 10.1186/s13630-016-0023-7 [DOI] [PMC free article] [PubMed] [Google Scholar]
- Yamaguchi H., Oda T., Kikkawa M., and Takeda H.. 2018. Systematic studies of all PIH proteins in zebrafish reveal their distinct roles in axonemal dynein assembly. eLife. 7:e36979 10.7554/eLife.36979 [DOI] [PMC free article] [PubMed] [Google Scholar]
- Yang T.T., Su J., Wang W.J., Craige B., Witman G.B., Tsou M.F., and Liao J.C.. 2015. Superresolution Pattern Recognition Reveals the Architectural Map of the Ciliary Transition Zone. Sci. Rep. 5:14096 10.1038/srep14096 [DOI] [PMC free article] [PubMed] [Google Scholar]
- Zabeo D., Heumann J.M., Schwartz C.L., Suzuki-Shinjo A., Morgan G., Widlund P.O., and Höög J.L.. 2018. A lumenal interrupted helix in human sperm tail microtubules. Sci. Rep. 8:2727 10.1038/s41598-018-21165-8 [DOI] [PMC free article] [PubMed] [Google Scholar]
Associated Data
This section collects any data citations, data availability statements, or supplementary materials included in this article.
Data Availability Statement
The following maps are available in the Electron Microscopy Data Bank: EMD-20674, nascent axoneme from bovine respiratory epithelial cells; EMD-20675, whole-population average of the first 800 nm of the bovine respiratory epithelium; EMD-20676, average of the BB from bovine respiratory cilia; EMD-20679, average of the TZ from bovine respiratory cilia; EMD-20680, average of the proximal axoneme from bovine respiratory cilia; EMD-20681, average of the proximal BB from bovine respiratory cilia; EMD-20683, average of the mid BB from bovine respiratory cilia; EMD-20684, average of the distal BB from bovine respiratory cilia; and EMD-20685, average of the TZ-linker from bovine respiratory cilia.


