

Abstract
We present a survey of variable stars detected in K2 Campaign 13 within the massive intermediate-age (~1 Gyr) open cluster NGC 1817. We identify a complete sample of 44 red clump stars in the cluster, and have measured asteroseismic quantities (νmax and/or Δν) for 29 of them. Five stars showed suppressed dipole modes, and the occurrence rates indicate that mode suppression is unaffected by evolution through core helium burning. A subset of the giants in NGC 1817 (and in the similarly aged cluster NGC 6811) have νmax and Δν values at or near the maximum observed for core helium–burning stars, indicating they have core masses near the minimum for fully nondegenerate helium ignition. Further asteroseismic study of these stars can constrain the minimum helium core mass in red clump stars and the physics that determines this limit. Two giant stars show photometric variations on timescales similar to previously measured spectroscopic orbits. Thirteen systems in the field show eclipses, but only five are probable cluster members. We identify 32 δ Sct pulsators, 27 γ Dor candidates, and 7 hybrids that are probable cluster members, with most being new detections. We used the ensemble properties of the δ Sct stars to identify stars with possible radial pulsation modes. Among the oddities we have uncovered are: an eccentric orbit for a short-period binary containing a δ Sct pulsating star; a rare subgiant within the Hertzsprung gap showing δ Sct pulsations; and two hot γ Dor pulsating star candidates.
1. Introduction
Galactic star clusters continue to be studied for insights into the evolution of stars, and selecting a cluster for study based on its age allows us to target stars of specific mass when they are in an interesting stage of their evolution. One major reason for such targeting is that we can have the opportunity to examine the consequences of particular physics processes in order to gain a better theoretical understanding for modeling purposes. However, it is often the case that the observable characteristics of stars are most sensitive to the physics when the stars are evolving most rapidly, at the end of the main sequence and beyond. A consequence of this is that stars in a state of rapid evolution and short duration will necessarily be rare, and to maximize the likelihood of catching stars in such short stages, we must study large (and if possible, uniform) samples of stars.
For these reasons, we present results from Kepler K2 Campaign 13 observations of the massive open cluster NGC 1817. NGC 1817 is about a billion years old, meaning that stars of near 2M⊙ are leaving the main sequence and reaching the red giant clump. These stars turn out to be special in at least a couple of respects. First, these stars inhabit the main-sequence portion of the pulsational instability strip, where δ Sct and γ Dor variables are found. Because these stars typically excite many modes of oscillation, they promise to reveal information about the stellar interior by encoding it in the pulsation spectrum. Second, 2M⊙ is a transitional mass for stars, where they transition from nondegenerate ignition of core He in intermediate-mass stars to degenerate ignition in a He flash event for low-mass stars. The character of this transition is dependent on physics of the stellar core during H burning, including the details of core convection.
The cluster NGC 6811 in the main Kepler field has a nearly identical age (Sandquist et al. 2016), and there are other nearby clusters of similar age that could also be studied to access stars near 2M⊙. We will discuss these other clusters as part of this paper, but the major advantage of observing NGC 1817 is its large total mass. A simple comparison of NGC 6811 with NGC 1817 reveals that NGC 1817 has approximately five times as many stars in equivalent evolutionary phases. This stellar sample provides the chance to examine the details of the post-main-sequence evolution with finer resolution.
The main drawback to the present study of NGC 1817 was that the cluster was observed for only one K2 campaign of about 75 days, while the main Kepler field (and NGC 6811) was observed for about 4 yr. This limits the frequency resolution of our power spectra of variable stars below, and prevents the detection of other variables (like long-period eclipsing binaries or low-amplitude pulsators). In addition, NGC 1817 has a higher reddening and a distance modulus that is about a magnitude larger than that of NGC 6811. However, as we show below, there was plenty to discover.
Before proceeding, we summarize some of the known characteristics of the cluster. The reddening has been measured only a few times, with relatively large uncertainties, and better determinations would be helpful. Harris & Harris (1977) measured the reddening of NGC 1817 using UBV two-color diagrams, and found E(B − V) = 0.28 ± 0.03 for main-sequence stars, and 0.23 ± 0.03 for red giant stars. Balaguer-Núñez et al. (2004a) presented Strömgren photometry of the cluster, and estimated the reddening to be E(b−y) = 0.19 ± 0.05 [E(B − V) = 0.27 ± 0.07] from main-sequence stars.
For chemical composition, Overbeek et al. (2016) found a mean [Fe/H] = −0.05 ± 0.02, but this is probably systematically high, based on comparisons to other literature values. Jacobson et al. (2009) found a mean [Fe/H] = −0.07 ± 0.04 from two giants, Jacobson et al. (2011) found [Fe/H] = −0.16 ± 0.03 from 28 stars, while Reddy et al. (2012) found a mean [Fe/H] = −0.11 ± 0.05 from three giants. Netopil et al. (2016) undertook a study to homogenize previous literature abundance measurements, and found −0.11 ± 0.03 from four stars with high-quality spectroscopic determinations and −0.16 ± 0.03 from 28 stars with lower-quality spectroscopic determinations. Casamiquela et al. (2017) found [Fe/H] = −0.08 ± 0.02 and −0.11 ± 0.03 from equivalent width and synthetic spectrum analysis of five giant stars. Carrera et al. (2019) find [Fe/H] = −0.09 ± 0.01 for one giant star from the APOGEE project.
2. Observational Material and Data Reduction
2.1. K2 Photometry
NGC 1817 was observed during Campaign 13 of the K2 mission through guest observer program GO 13053 (PI: Sandquist), although there were overlaps with several exoplanet search programs. Nine-hundred and twenty-four of the brightest cluster stars were identified from ground-based proper motion membership information (Balaguer-Núñez et al. 2004b) and from color–magnitude diagram position (Balaguer-Núñez et al. 2004a). Most targets were observed with long cadence (29.43 minute integration), with a handful of previously known variables observed with short cadence (0.98 minute integration).
Because of the incomplete gyroscopic stabilization during the K2 mission, systematic effects on the light curve are substantial. The primary source of the light curves we used in this investigation is the K2SFF pipeline (Vanderburg & Johnson 2014; Vanderburg et al. 2016) that involves stationary aperture photometry along with correction for correlations between the telescope pointing and the measured flux. The K2SFF light curves typically still had modest long-term trends, and for most of our scientific purposes, these trends were removed by fitting the points with a low-order polynomial and subtracting the fit. When an eclipsing binary was involved, only points outside of eclipse were fitted. For giant stars with variations on the longest timescales, we divided by the output of a sliding median filter covering 71 observations for most stars. For nine stars, the filter used a larger number of points (101, 121, or 161), with a single AGB star requiring a much larger number (1001) in order to avoid erasing the photometric variations.
For the asteroseismic analysis of red clump stars below, we used EVEREST light curves (Luger et al. 2016). EVEREST uses pixel level decorrelation to eliminate instrumental signals (ones that do not recur) in pixels within the stellar aperture. We found that EVEREST curves allowed us to reduce instrumental noise to a greater degree than the K2SFF curves.
2.2. Spectral Energy Distributions (SEDs)
For a small number of objects below, we compiled SEDs from photometry in the literature and used calibrations to put them on an absolute flux scale. In producing the SEDs, we collected photometry from the following sources: ultraviolet photometry from the Galaxy Evolution Explorer (GALEX; Martin et al. 2005), Strömgren photometry from Balaguer-Núñez et al. (2004a), BVIC data from Donati et al. (2014), PSF magnitudes from Data Release 14 of the Sloan Digital Sky Survey (SDSS; York et al. 2000), mean PSF magnitudes from the Pan-STARRS1 survey (Kaiser et al. 2010), the APASS survey (Henden et al. 2015), Data Release 2 (DR2) of the Gaia archive (Gaia Collaboration et al. 2018b), Two-Micron All-Sky Survey (2MASS; Skrutskie et al. 2006) photometry from the All-Sky Point Source Catalog, and from the Wide-field Infrared Survey Explorer (WISE; Wright et al. 2010) survey.
3. Analysis
3.1. Cluster Membership
Balaguer-Núñez et al. (2004b) presented proper motion membership determinations for stars with V < 15, and Krone-Martins et al. (2010) also studied the cluster’s proper motion membership as part of a larger survey of clusters. However, DR2 from the Gaia spacecraft currently provides the most precise proper motions and parallaxes to gauge cluster membership. This is a particularly important point for the NGC 1817 cluster, because the proper motions of its stars fall near the center of the field star distribution, and proper motions alone are an imperfect measure of membership. Cantat-Gaudin et al. (2018) have produced membership probabilities for NGC 1817 and other clusters using Gaia DR2, and we have used their values for NGC 1817’s proper motion vector and average parallax. For the purposes of this paper, we employed relatively simple criteria for membership: a star is a likely member if its proper motion vector is within 0.35 mas yr−1 of μα cos δ = 0.485 mas yr−1 and μδ = −0.890 mas yr−1, and a parallax within 0.2 mas of of mas. The proper motion and parallax ranges were selected to extend well beyond the extremes of the distributions for stars most obviously associated with the cluster.
For some of the stars (particularly giants), radial velocities provide a strong additional constraint on cluster membership. Mermilliod et al. (2003), Jacobson et al. (2011), and Soubiran et al. (2018) measured radial velocities for nearly all of the cluster giants. Surveys agree on a cluster mean velocity near 66 km s−1, with the largest survey of stars (Soubiran et al. 2018) finding an average radial velocity of 66.02 km s−1 with a dispersion of 1.22 km s−1 from 40 stars. We have eliminated stars with well-measured average velocities more than 5 km s−1 from this mean value.
3.2. Cluster Giants and Asteroseismic Analysis
Star clusters with ages near 1 Gyr (like NGC 1817) produce red clump stars through the nondegenerate ignition of helium in the cores of the stars. These stars form the so-called “secondary red clump” (RC2), as opposed to the primary red clump (RC1) that is composed of stars that undergo a helium flash when they ignite core helium in degenerate cores of red giants. RC2 stars are often fainter than RC1 stars, due to a lower helium-burning luminosity that results from a lower-mass He core at ignition (Girardi 2016), and minima in luminosity and radius are expected at the transition between nondegenerate and degenerate ignition. Observationally, open clusters of around 1.5 Gyr old show a combination of RC1 and RC2 stars, and the transitional mass is thought to be around 2.0–2.3M⊙ (Girardi et al. 2000). RC2 stars are the progeny of less common, more massive stars than the giants in older clusters, and large uniform samples of those stars for study can be hard to come by.
Because NGC 1817 is a much more massive cluster than NGC 6811 (a cluster of similar age in the original Kepler field), it offers the possibility of examining a much larger, uniform sample of clump stars with masses greater than 2M⊙. A total of eight clump stars were identified as members of NGC 6811 (Sandquist et al. 2016), with little chance of any additional discoveries. All eight of these stars were observed during the main Kepler mission, and their asteroseismic oscillation patterns were discussed by Arentoft et al. (2017). In NGC 1817, we identified 44 likely giant members with nine of these not observed during the K2 campaign. The sample in NGC 1817 is presented in Table 1. Candidate members were identified using Gaia parallaxes and proper motions. Gaia radial velocities were also used for membership identification, but were not available for every star. In other cases (mainly spectroscopic binaries), measurements from Mermilliod et al. (2003, 2007) and Jacobson et al. (2011) were used to identify the mean radial velocity. We believe this sample for NGC 1817 is complete (or nearly complete), based on a search out to about 2° from the cluster center.
Table 1.
NGC 1817 Giants and Asteroseismology
| EPIC ID | WEBDA | BN04a | Ma | G | (GBP − GRP) | Class | Membership | Notesb | vmax | σ(vmax) | Δv | σ(Δv) | ||
|---|---|---|---|---|---|---|---|---|---|---|---|---|---|---|
| RV | μ | (μHz) | (μHz) | |||||||||||
| 246894008 | 1574 | 18 | 11.818 | 1.351 | RC2 | M | M | M | ||||||
| 246867463 | 1209 | 936 | 12.152 | 1.306 | fRC2 | M | M | M | Gaia | |||||
| 246868367 | 1208 | 935 | 57 | 12.003 | 1.347 | RC2? | M | M | M | SB | ||||
| 246868636 | 673 | 686 | 3 | 12.359 | 1.332 | fRC2 | M | M | M | |||||
| 246871255 | 1456 | 26 | 1 | 11.027 | 1.471 | ? | M | M | M | SB | ||||
| 246871689 | 1152 | 934 | 54 | 11.786 | 1.385 | RC2 | M | M | M | 57.91 | 0.95 | 5.25 | 0.06 | |
| 246872204 | 1459 | 27 | 9 | 11.592 | 1.347 | RC2 | M | M | M | |||||
| 246876234 | 1408 | 4891 | 8 | 12.459 | 1.354 | fRC2 | M | M | M | |||||
| 246879891 | 1412 | 4890 | 7 | 12.332 | 1.410 | RC2 | M | M | M | |||||
| 246882666 | 286 | 158 | 12.325 | 1.315 | fRC2 | M | M | M | ||||||
| 246883940 | 73 | 7131 | C73 | 11.737 | 1.425 | AGB? | M | M | M | supp. | 40.07 | 0.92 | 4.24 | 0.03 |
| 246884115 | 71 | 7132 | C71 | 12.586 | 1.337 | fRC2 | M | M | M | |||||
| 246884141 | 72 | 7133 | C72 | 11.801 | 1.330 | RGB? | M | M | M | SB; supp. | 61.65 | 1.64 | 6.35 | 0.08 |
| 246885313 | 164 | 7751 | C164 | 11.526 | 1.121 | ? | M | M | M | SBO | ||||
| 246885840 | 212 | 152 | C212 | 12.053 | 1.409 | RC2 | M | M | M | 51.8 | 5.65 | 0.50 | ||
| 246887834 | 40 | 7153 | C40 | 12.399 | 1.337 | fRC2 | M | M | M | 105.07 | 4.65 | |||
| 246888025 | 81 | 7207 | C81 | 11.880 | 1.365 | RC2 | M | M | M | supp. | 62.54 | 1.35 | 5.70 | 0.07 |
| 246888508 | 79 | 7209 | C79 | 12.164 | 1.347 | RC2 | M | M | M | 81.19 | 1.76 | 7.03 | 0.15 | |
| 246888894 | 44 | 7156 | C44 | 10.830 | 1.381 | RC2? | M | M | M | SBO | ||||
| 246889824 | 1420 | 3669 | 13 | 12.275 | 1.305 | fRC2 | M | M | M | SB | ||||
| 246889908 | 211 | 149 | C211 | 12.005 | 1.357 | RC2 | M | M | M | 66.47 | 1.93 | |||
| 246890962 | 30 | 153 | C30 | 12.159 | 1.344 | RC2 | M | M | M | 78.39 | 1.60 | |||
| 246891310 | 1135 | 522 | 47 | 12.145 | 1.373 | RC2 | M | M | M | 82.68 | 1.33 | 6.78 | 0.17 | |
| 246892343 | 244 | 523 | C244 | 12.209 | 1.401 | RC2 | M | M | M | SBO | 84.45 | |||
| 246892429 | 8 | 7081 | C8 | 11.772 | 1.367 | RC2 | M | M | M | 56.55 | 1.78 | |||
| 246892465 | 127 | 148 | C127 | 11.935 | 1.385 | RC2 | M | M | M | 64.52 | 2.10 | |||
| 246893162 | 206 | 145 | 11 | 11.493 | 1.505 | RGB? | M | M | M | 28.40 | 1.20 | 3.51 | 0.12 | |
| 246894024 | 12 | 7200 | C12 | 12.298 | 1.288 | fRC2 | M | M | M | SB | 98.02 | 5.77 | 8.36 | 0.30 |
| 246895092 | 22 | 151 | C22 | 12.043 | 1.365 | RC2 | M | M? | M | SB | 71.91 | 2.32 | 6.65 | 0.87 |
| 246896978 | 19 | 147 | C19 | 11.911 | 1.347 | RC2 | M | M | M | SB | 67.93 | 1.30 | 5.43 | 0.43 |
| 246897011 | 1433 | 3667 | 15 | 11.878 | 1.358 | RC2 | M | M | M | 64.67 | 1.76 | |||
| 246897327 | 64 | 146 | C64 | 11.797 | 1.396 | RC2 | M | M | M | 57.94 | 1.11 | 5.26 | 0.26 | |
| 246897919 | 121 | 161 | C121 | 12.426 | 1.333 | fRC2 | M | M | M | 102.82 | 2.75 | 7.86 | 0.76 | |
| 246899172 | 177 | 7361 | C177 | 12.050 | 1.377 | RC2 | M | M | M | 74.41 | 2.42 | 6.55 | 0.25 | |
| 246901772 | 56 | 7635 | C56 | 10.969 | 1.577 | RGB? | M | M? | M | SBO | 14.90 | 0.59 | ||
| 246903276 | 1114 | 48 | 12.439 | 1.388 | fRC2? | M | M | M | supp. | 95.00 | 3.45 | 7.97 | 0.14 | |
| 246907326 | 185 | 7683 | 30 | 12.509 | 1.357 | fRC2 | M | M | M | 100.33 | 5.82 | 8.50 | 0.19 | |
| 246907540 | 677 | 7686 | 20 | 12.231 | 1.372 | RC2 | M | M | M | 79.33 | 2.03 | |||
| 246909519 | 1117 | 7429 | 42 | 12.102 | 1.375 | RC2 | M | M | M | 76.47 | 1.81 | 6.59 | 0.11 | |
| 246915802 | 1292 | 31 | 11.945 | 1.367 | RC2 | M | M | M | supp. | 67.56 | 1.10 | 5.92 | 0.06 | |
| 246923982 | 10.290 | 1.605 | AGB? | M | M | M | Gaia | |||||||
| 246924226 | 1297 | 33 | 12.301 | 1.317 | fRC2? | M | M | M | Gaia | 81.9 | 8.07 | 0.59 | ||
| 246939662 | 1265 | 34 | 12.157 | 1.285 | fRC2? | M | M | M | 87.88 | 2.82 | 7.20 | 0.65 | ||
| 246984210 | 12.527 | 1.431 | fRC2? | M | M | M | Gaia | |||||||
| Marginal Nonmembers | ||||||||||||||
| 246852586 | 1502 | 1127 | 12.346 | 1.430 | M | NM | M? | |||||||
| 246853701 | 1476 | 2953 | 9.971 | 2.266 | NM | M | M? | |||||||
| 246865268 | 555 | 688 | 12.704 | 1.451 | NM | M | M | |||||||
| 246887966 | 12.736 | 1.395 | NM | M | M | |||||||||
Notes.
SB: spectroscopic binary. SBO: spectroscopic binary with orbit determination. Gaia: Candidate identified in Gaia Data Release 2. supp.: suppressed dipole modes.
An examination of the high-precision Gaia color–magnitude diagram (Figure 1) gives an impression that a fainter subpopulation of the secondary red clump might be distinguishable, with a division at G ≈ 12.3. Because of the potential importance of core He–burning stars near the transition to degenerate ignition, we have labeled the fainter stars in Table 1 as faint secondary clump stars (fRC2). In Figure 2, we show the photometric SEDs of all of the stars labeled RC2 or fRC2, to emphasize that the two groups are more clearly separated in magnitude within infrared bands (especially for λ > 1 μm) because the photometry is less sensitive to temperature differences there. Other properties of this group of stars will be discussed more below.
Figure 1.

Gaia color–magnitude diagram of NGC 1817, with giants (red), giants with asteroseismic measurements (black) and suppressed dipole modes (black circles), giants with single-lined spectroscopic binary orbits (green), pulsating stars (cyan), and eclipsing binaries (magenta) shown. EPIC IDs are given for selected eclipsing binaries. Inset: zoom on the red clump, with a dotted line indicating the apparent gap between faint and bright clump stars.
Figure 2.

Top panel: photometric spectral energy distributions for stars identified as RC2 (red points) or fRC2 (blue points). Bottom panel: fractional difference in flux for each star compared to the median for each filter, in order to flatten the SEDs.
Asteroseismic studies have identified quantities that can be measured in the oscillation frequencies of giant stars that connect to fundamental properties of the stars. Most commonly, the frequency separation of overtone modes Δν and the frequency of maximum power νmax reflect the average density (Kjeldsen & Bedding 1995) and surface gravity (Brown et al. 1991) of the stars, respectively, and when algebraically combined, these return the mass and radius, with some dependence on the effective temperature (Kallinger et al. 2010). Comparisons with the results of binary star mass analyses has indicated there is a systematic overestimate of red giant masses calculated from asteroseismic relations without corrections (e.g., Brogaard et al. 2016, 2018; Gaulme et al. 2016), although corrections have been calculated to reduce the disagreements (e.g., Sharma et al. 2016).
A major benefit of cluster giant samples is that the ensemble of stars has nearly identical age and chemical composition, and as a result, the stars should have similar masses. For RC2 stars, though, there is generally a larger variation in stellar mass than there is for the first-ascent giants seen in older clusters.
We derived asteroseismic observables from the power spectra (Fourier transforms of the K2 light curves) using two different pipelines. The first followed the K2 processing procedure described in Stello et al. (2015), based on the method described in Huber et al. (2009). This involved the use of a high-pass filter on the light curves to reduce noise levels by decreasing spectral leakage of low-frequency power into higher frequencies in the power spectrum, along with filling of small data gaps (of no more than three sequential points) in order to remove frequency peaks related to satellite repositioning. Our targets in NGC 1817 are all of moderate luminosity compared to giants in older star clusters, and because the peak power occurs at relatively high frequency, there are no issues with the high-pass filter’s cutoff frequency. The νmax frequencies we report are the central values of a Gaussian envelope fit to the power spectrum of the solar-like oscillations. The large frequency spacings Δν are derived from autocorrelation of the power spectrum, followed by a Gaussian function fit to the one of the five highest peaks that is closest to the value expected from correlations between νmax and Δν. Three examples of power spectra and the identified asteroseismic parameters are shown in Figure 3. The second pipeline used the KASOC filter (Handberg & Lund 2014) to prepare the light curves for asteroseismic analysis, followed by a two-component fit to the power spectrum (with the asteroseismic contribution again fitted with a Gaussian envelope; see Handberg et al. 2017). This second pipeline was mainly used for validation purposes, and when there was substantial disagreement between the pipelines, we rejected stars from our final sample as unreliably measured. Because of the shorter period of observation in the K2 campaign, the frequency resolution is somewhat degraded relative to the main Kepler field. In addition, the NGC 1817 stars are somewhat fainter than the analogous stars in NGC 6811 in the Kepler field. As a result, only 29 of the stars had measurable νmax values, and Δν could be reliably measured for 20 of the stars. This is still larger than the entire sample for NGC 6811, however. On the other hand, Arentoft et al. (2017) was able to measure the period spacing ΔP for mixed modes for four of the NGC 6811 stars, which was not possible in the short observations of NGC 1817. There is only one other cluster of similar age where asteroseismology has been done, and that is NGC 6633, where three stars were observed using the CoRoT spacecraft cluster by Poretti et al. (2015).
Figure 3.

Left panels: power spectra of red clump star examples, with the smoothed spectrum shown in red, and the frequency of maximum power νmax indicated. Right panels: power spectra zoomed on the solar-like excess power, with the large frequency separation Δν indicated. In the top panel, an example of a detected ℓ = 1 mode is shown.
A comparison of the asteroseismic νmax and Δν for the stars in the three clusters is shown in Figure 4. While the parameter correlations are consistent for the clusters, different subgroups can be identified along the line.
Four asteroseismically measured stars in NGC 1817 appear to be in evolutionary states other than the secondary clump, based on their low values. Although EPIC 246883940 falls close to the bright end of the red clump, its asteroseismic parameters indicate that it has probably started to evolve toward the asymptotic giant branch (AGB). EPIC 246884141 has asteroseismic measures that are in the same range as most RC2 stars, but when νmax and Δν are considered together, the star falls on the correlation line for first-ascent red giants (e.g., Stello et al. 2009). The star is found toward the blue side of the red clump. In addition, it is in a spectroscopic binary and is observed to have suppressed dipole modes (see Section 3.2.2), so this star deserves more attention. The asteroseismic data for EPIC 246893162 does not allow a clear determination of its evolutionary state, but its red color may indicate that it is a first-ascent red giant branch star (RGB) rather than an AGB star. Both EPIC 246884141 and 246893162 have unusually low asteroseismic masses that we are unable to explain at this time. EPIC 246901772 has the smallest νmax observed in NGC 1817 (and NGC 6811 as well). Of the three measured stars in NGC 6633, two are also probably evolved: HD 170174 is in the last stages of its core helium burning, and HD 170053 appears to be an AGB star with very low asteroseismic parameters (putting it off the edge of Figure 4).
The majority of the stars in NGC 1817 fall in an intermediate range (νmax between 50 and 85 μHz, and Δν between 4.5 and 7 μHz) that corresponds to common secondary clump stars. One of the measured NGC 6633 stars (HD 170231) is in this category of RC2 stars, as are the two brightest stars in NGC 6811. In NGC 6811, asteroseismic analysis of asymptotic period spacings of mixed modes in four of the clump stars with the lowest Δν values supports the idea that the brightest stars are RC2 stars or are evolving toward the AGB with some core helium remaining (Arentoft et al. 2017).
The last group is probably the most interesting, however. Six of eight stars measured in NGC 6811 are consistent with the four measured examples of the faint population of clump stars in NGC 1817 (which we labeled “fRC2”). The clearest asteroseismic faint clump stars are EPIC 246894024, 246897919, 246903276, and 246907326, although EPIC 246887834 has a νmax value that puts it among the fRC2 stars also. EPIC 246939662 is an additional borderline case. There is the appearance of a distinction between the bright and the faint RC2 stars in the two clusters, but there is not a clear division in the field star sample tabulated by Yu et al. (2018), as shown in Figure 4.
In clusters, there is an observed lower limit to the luminosity of red clump stars, and the stars near this limit should define an upper limit for the asteroseismic parameters of clump stars as a consequence of higher average density. According to our observations and those of Arentoft et al. (2017), this appears to be about 108 μHz for νmax and 8.5 μHz for Δν. For a large sample of red clump stars identified with the help of period spacings among mixed modes in Kepler samples, the maximum observed value of Δν was 8.73 μHz in Mosser et al. (2014), and 8.65 μHz in Stello et al. (2013). From the larger Yu et al. (2018) catalog of measurements from Kepler data, we find maximum values of around 114–117 μHz in νmax and around 8.9 μHz in Δν, after discounting a small number of probable misidentified RGB stars (see Figure 4).
Figure 4.

Correlation of the asteroseismic measurables νmax and Δν for stars in NGC 1817 (dark blue), NGC 6633 (magenta), and NGC 6811 (cyan), along with a dotted line separating the faint clump stars from brighter clump stars. Stars with suppressed dipole modes have open symbols, and stars having only νmax measurements are shown with vertical line markers. EPIC IDs for selected NGC 1817 stars are shown. Core helium–burning stars from the Kepler sample of Yu et al. (2018) are shown as gray points. The Stello et al. (2009) relation for solar-like oscillations is shown with a dashed line for reference.
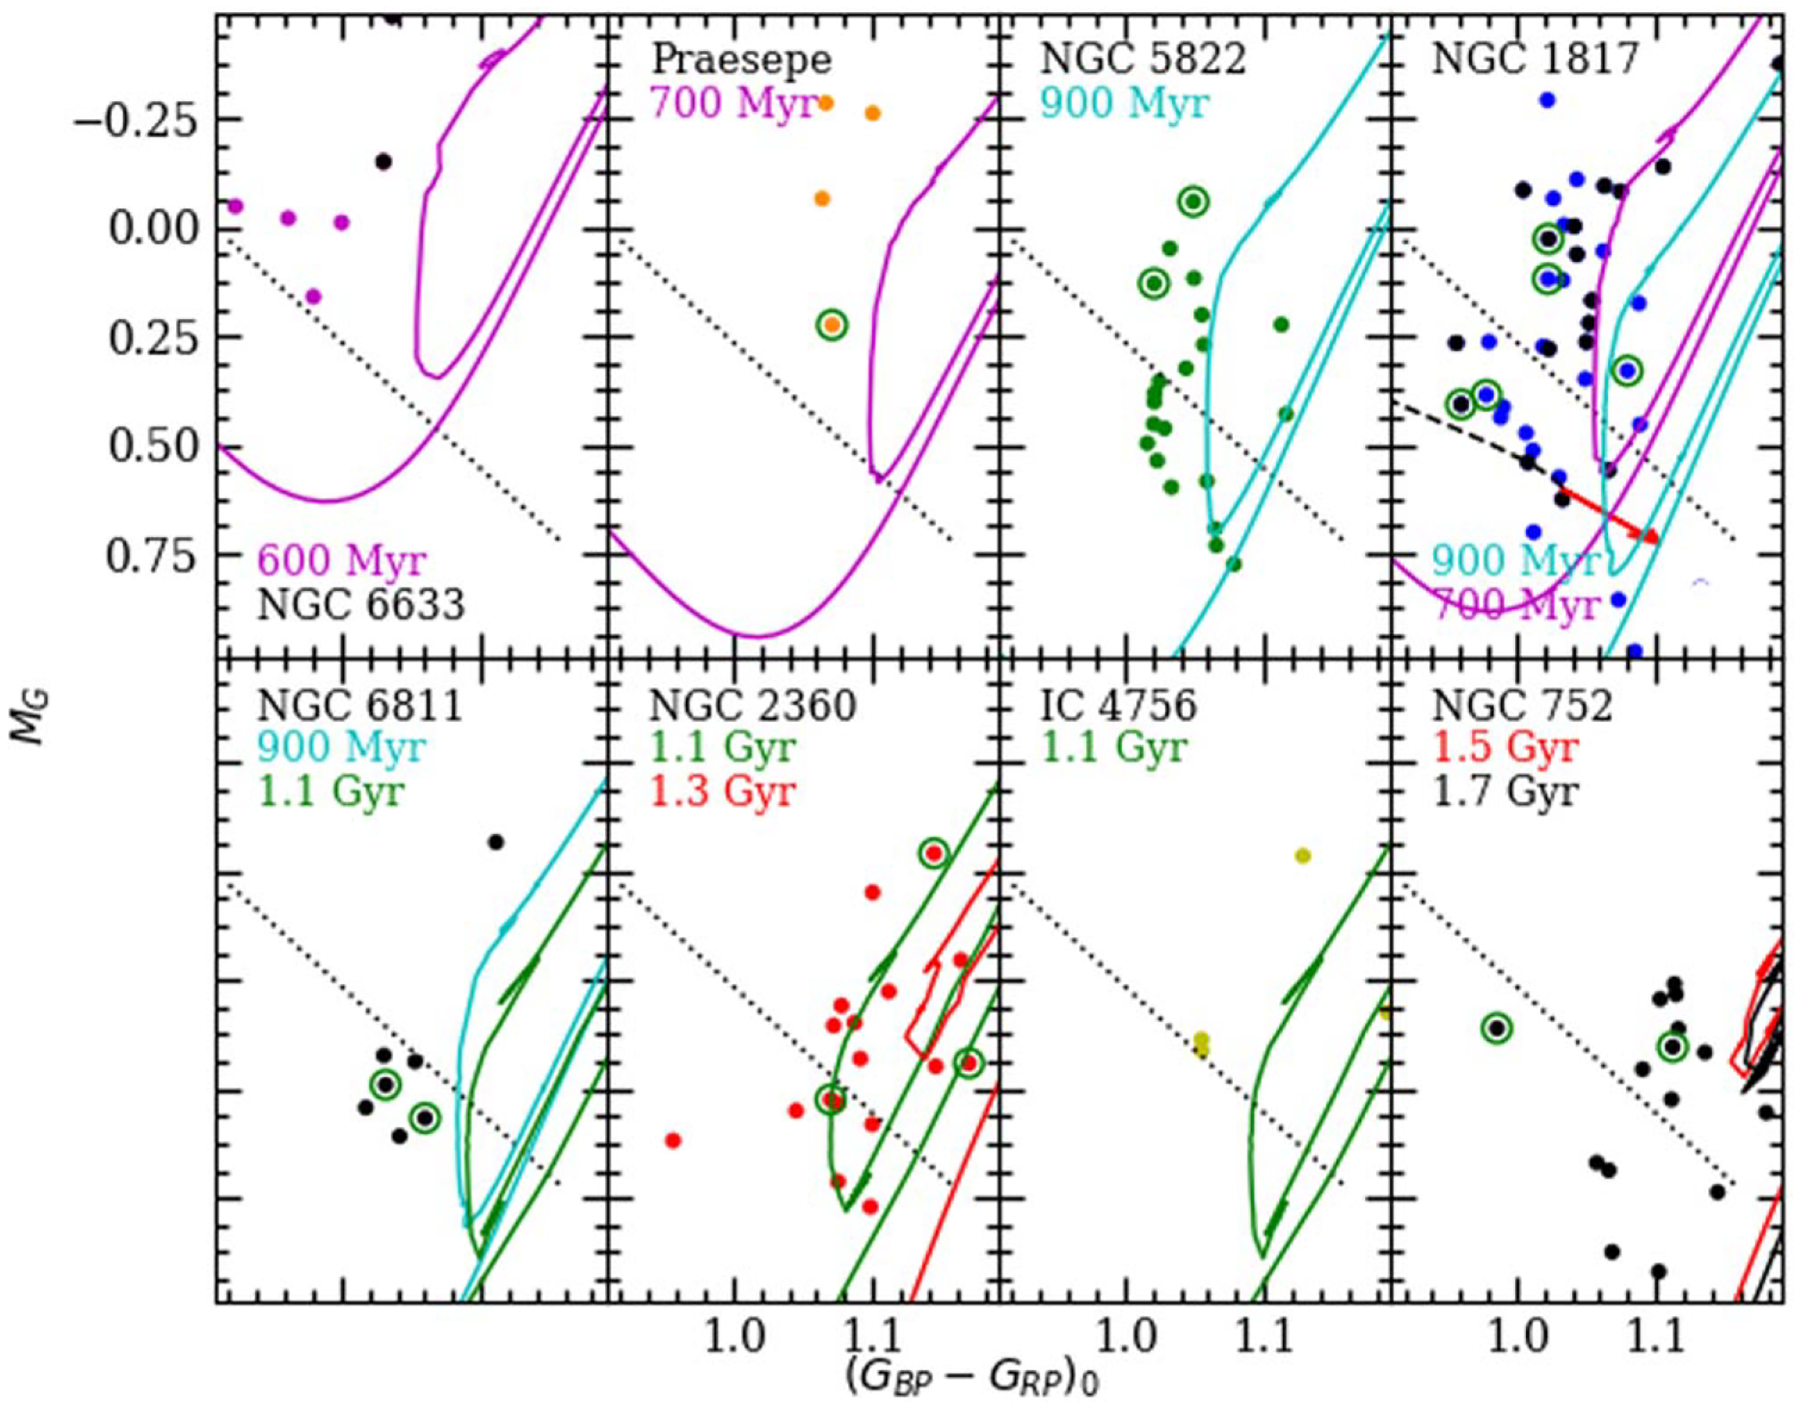
We can attempt to connect the available asteroseismic measurements with the stellar properties in Gaia color–absolute magnitude diagrams: both asteroseismic parameters are inversely proportional to powers of the stellar radius, and radius is connected to CMD position. In Figure 5, we plot the Gaia CMDs of eight open clusters with ages similar to NGC 1817 and well-determined mean parallaxes. Important characteristics of the clusters are given in Table 2. Cluster members were selected using simple cuts on proper motion and parallax, and the CMD was calculated using mean parallax values from Cantat-Gaudin et al. (2018) and reddening values from the literature. The main sequences align quite well, and the ordering of the main-sequence turnoffs gives an indication of the relative ages (see Figure 6): NGC 6633 and Praesepe appear slightly younger than—and IC 4756 and NGC 2360 slightly older than—the intermediate group composed of NGC 1817, NGC 6811, and NGC 5822. NGC 752 is significantly older than the rest of the clusters. Most or all of these clusters show significant color dispersion at the turnoff, which somewhat complicates the relative age determination.
Figure 5.

Gaia dereddened color–absolute magnitude diagram for Milky Way open clusters with ages near 1 Gyr.
Table 2.
Open Clusters with Ages Near 1 Gyr
| NGC 6633 | Praesepe | NGC 1817 | NGC 6811 | NGC 5822 | IC 4756 | NGC 2360 | NGC 752 | |
|---|---|---|---|---|---|---|---|---|
| R.A. (deg) | 276.845 | 130.10 | 78.139 | 294.340 | 226.051 | 279.649 | 109.445 | 29.223 |
| Decl. (deg) | 6.615 | 19.67 | 16.696 | 46.378 | −54.366 | 5.435 | −15.632 | 37.794 |
| μα cos δ (mas yr−1) | 1.198 | −36.047 | 0.485 | −3.399 | −7.422 | 1.260 | 0.385 | 9.810 |
| μδ (mas yr−1) | −1.811 | −12.917 | −0.890 | −8.812 | −5.534 | −4.927 | 5.589 | −11.713 |
| (mas) | 2.525 | 5.371 | 0.551 | 0.870 | 1.187 | 2.093 | 0.902 | 2.239 |
| [Fe/H] | −0.10 | 0.12 | −0.10 | 0.02 | −0.09 | −0.02 | −0.07 | −0.02 |
| E(B − V) | 0.19 | 0.027 | 0.23 | 0.07 | 0.15 | 0.13 | 0.09 | 0.044 |
Note. References for [Fe/H]: NGC 6633: (Jeffries et al. 2002); Praesepe: Boesgaard et al. (2013); NGC 1817: literature re-evaluation in introduction; NGC 6811: Sandquist et al. (2016); NGC 5822: Peña Suárez et al. (2018); IC 4756: Bagdonas et al. (2018); NGC 2360, NGC 752: Reddy et al. (2012). References for E(B − V): NGC 6633: Peña et al. (2017); Praesepe: Taylor (2006); NGC 1817: Harris & Harris (1977); NGC 6811: Sandquist et al. (2016); NGC 5822: Twarog et al. (1993); IC 4756, NGC 2360: Gaia Collaboration et al. (2018a); NGC 752: Taylor (2007).
Figure 6.

Gaia dereddened color–magnitude diagrams, focused on the turnoff. MIST isochrones (Choi et al. 2016) with convective overshooting and the labeled ages are shown. Isochrone [Fe/H] values are −0.08 for NGC 6633, NGC 5822, NGC 1817, and NGC 2360; 0.00 for NGC 6811, IC 4756, and NGC 752; and +0.06 for Praesepe.
3.2.1. Model Comparisons
Figure 6 shows the approximate matches between MIST isochrones and the turnoffs of the eight clusters we are examining here. Although we have plotted MIST models for comparison, BaSTI-IAC models are very similar near the cluster turnoff. The purpose here is simply to obtain a rough idea of the age from the turnoff in order to see if age indications from the red clump are consistent. In a few cases, we have plotted isochrones of other ages because they fit parts of the red clump better.
Looking at the clump stars, five of the eight clusters shown (NGC 1817, NGC 6811, NGC 5822, NGC 2360, and NGC 752) appear to have stars that fall in the faint secondary clump group (see Figures 7–9). All of the faint clump stars that also have asteroseismic measurements to date could have been identified using νmax or Δν as well. Models (Girardi 1999) indicate that these stars are likely to be made with He core masses near the minimum allowable—less massive stars produce degenerate He cores that require substantially larger core masses to ignite in He flash events, while more massive stars simply generate larger convective cores on the main sequence due to more powerful energy release. There is a similar change in He core–burning lifetime, with a maximum being reached when the He core mass hits its minimum. This effect can allow minimum He core stars to be observed in clusters at the faint end of the clump for a significant range of ages. Figure 10 illustrates the effects on the radius and lifetime of core helium–burning stars near the minimum core mass. To interpret the characteristics of the clump populations of these clusters and what they might say about the stellar interior physics, we will break the clusters into subgroups in the next subsection.
Figure 7.

Same as Figure 5, but zoomed on the red clump. The dotted line shows our tentative dividing line between bright secondary red clump stars (RC2) and faint ones (fRC2).
Figure 9.
Gaia dereddened color–magnitude diagrams, focused on the red clump, as in Figure 8. MIST isochrones (Choi et al. 2016) with the labeled ages are shown.
Figure 10.

Models of core He–burning stars with core masses near the minimum from BaSTI-IAC (Hidalgo et al. 2018) and MIST (Choi et al. 2016). Stable core He burning starts at the bottom of first steep section.
The youngest clusters in our sample (NGC 6633 and Praesepe, but the Hyades could also be included), have ages in the range of 600–700 Myr based on their main-sequence turnoffs. For those ages, the clump stars should all have ignited core helium burning in nondegenerate gas. Models predict that the minimum luminosity (and radius) for core He–burning stars should be decreasing as the masses of the stars reaching the clump are decreasing; see models on the left side of Figure 10, or the synthetic CMDs in Figure 3 of Girardi et al. (2000). Thus, these clusters are probably too young to produce any of the faintest secondary clump stars. However, these clusters only have eleven clump stars in total between them, so it is hard to say that this is conclusive observational proof. Of the stars in the three clusters, only three giant stars in NGC 6633 have been studied asteroseismically, and their masses place them comfortably in the realm of nondegenerate core He ignition. The four faintest clump stars in the cluster have not been analyzed, however. Four of Praesepe’s giants have been observed with K2, and we predict that their asteroseismic parameters will all fall comfortably within the secondary clump.
The next-oldest group of clusters (NGC 1817, NGC 6811, and NGC 5822) have ages near 900 Myr, using a turnoff-based age. Each of these clusters has a substantial group of faint RC2 stars, but there is a lot of variation in the percentage of clump stars the fRC2 stars compose: from about 75% in NGC 6811 down to 57% for NGC 5822 to about 25% for NGC 1817. The simple expectation from models is that there should be a range of ages in which clump stars with core masses near the minimum allowable are produced and persist. These clusters are most likely ones in which secondary clump stars are being produced in significant numbers, but older clump stars (with more massive non-degenerate cores) have not died off yet. We will return to discuss the distribution of the clump stars in the CMD below.
The oldest clusters (closer to 1.5 Gyr, like NGC 752 and NGC 7789; see Girardi et al. 2000) are probably the oldest systems that can produce faint secondary clump stars. The faint RC2 stars would be among the longest residents of the clump, but some lower-mass stars would have recently gone through a helium flash. It has previously been shown that the distribution of stars in the CMD for clusters of this age depends on the details of the transition between nondegenerate and degenerate ignition of core He and the resulting rapid change in the mass of the He core. A transition that occurs in a small range of masses could allow significant numbers of stars of both kinds (RC1 and RC2) to coexist in a cluster with significant differences in radius (and luminosity), as can be seen in the MIST models in Figure 10 for ages between about 1.1 and 1.3 Gyr. The BaSTI-IAC models do not show a clear separation in the properties of the stars in the same range of ages, and we believe this shows that the changes in He core mass do not occur rapidly enough in these models. Such a scenario may still require effects (such as stellar rotation) that introduce a spread in evolutionary outcomes for stars at a given mass (Girardi et al. 2000). Further characterization of the faintest secondary clump stars may help address the issues of dispersion among the clump stars, but also may reveal details of the convection that occurs within them on the main sequence.
Returning to the CMD distribution of clump stars for the ~900 Myr old clusters, there are some problems in constructing a cohesive explanation. NGC 5822 appears to be youngest according to the turnoff, and the clump star positions are in crude agreement with the vertical portion of the isochrone. The faint clump stars in NGC 6811 form a tight group that can perhaps be qualitatively explained as resulting almost exclusively from stars that had He core masses near the minimum possible.
The distribution of the clump stars in NGC 1817 is hard to reconcile with models, however. The large group of brighter clump stars are in reasonable agreement with a young 700 Myr isochrone in terms of their magnitude extent and colors, but an isochrone of that age does not fit the turnoff. The superposition of bright and faint clump stars with something resembling a gap between could imply a substantial drop in radius over a small mass range, in analogy to what models predict for older clusters like NGC 752. A clear gap is not seen in NGC 5822, though. The extension of the faint clump stars in color is also not predicted by models. Unresolved binaries may be a contributor (see Figure 8), but would require a large fraction of the faint clump stars to be affected. NGC 1817 also has the largest reddening of any of the clusters we have discussed, so a contribution to the color scatter by differential reddening is possible. The reddening vector approximately parallels the extension of the faint RC2 stars (again, see Figure 8), although Harris & Harris (1977) and Donati et al. (2014) did not find evidence of differential reddening in the cluster from their ground-based studies.
Figure 8.

Gaia dereddened color–magnitude diagrams, focused on the red clump. Black points in the NGC 6633, NGC 1817, and NGC 6811 diagrams show stars with measured asteroseismic parameters. BaSTI-IAC isochrones (Hidalgo et al. 2018) with convective overshooting and the labeled ages are shown, and [Fe/H] values are the same as in Figure 6. Open circles show stars with likely binaries with measured radial velocity variation. Dotted lines show the possible separator between bright and faint RC2 stars. In the NGC 1817 plot, a dashed line shows where photometric combinations of a faint clump star and a main-sequence star would be, and a red arrow shows the reddening vector.
As a practical matter, the observation that there are maximum values of the parameters vmax and Δν in a vetted sample of secondary clump stars can help to put limits on some of the physics, and specifically effects on the minimum mass of the He core in the red clump. Figure 11 shows He core mass and maximum values of the asteroseismic parameters during helium core fusion as a function of total mass for MIST models (Choi et al. 2016). The maximum asteroseismic measurements clearly correlate strongly with helium core mass. Overall, we find that there is fairly good agreement between the observed maximum values of vmax and Δν and the MIST model predictions. The clump stars that have been measured using Kepler and CoRoT data in the field (Stello et al. 2013; Mosser et al. 2014; Yu et al. 2018), and in intermediate-age clusters they comprise a large sample. We can be reasonably assured that these stars sufficiently sample the faint secondary clump and its asteroseismic values.
Figure 11.

Dependence of helium core mass and maximum asteroseismic parameters for helium core–burning stars of differing total mass for MIST evolutionary tracks (Choi et al. 2016).
The characterization of clump stars that have He cores near the minimum allowed mass can lead to a better understanding of the physics involved in the important transition between nondegenerate He ignition and degenerate He flash. Models show that the amount of convective core overshoot during the main sequence strongly affects the stellar mass that produces a minimum-mass helium core, with stronger overshoot making the mass smaller (e.g., Girardi et al. 2000). However, the overshoot does not strongly affect what the mass of that helium core is (e.g., Sweigart et al. 1990; Figure 12 of Arentoft et al. 2017). If the masses of these faint clump stars can be determined precisely, the observations will put strong constraints on the main sequence stars that later produce minimum-mass helium cores. For the Kepler field-star sample, Yu et al. (2018) used the asteroseismic scaling relations with red clump star corrections to Δν (Sharma et al. 2016) to calculate stellar masses and radii. These are shown in Figure 12, and the radii show several expected features like the sharp primary/secondary clump (RC1/RC2) transition near 2.05M⊙ and the minimum radius among the RC2 stars around 8R⊙. Typical uncertainties of around 0.16M⊙ are present in the individual field star measurements.
Figure 12.

Asteroseismic mass and radius measurements from scaling relations for clusters NGC 1817 (blue), NGC 6811 (cyan), and NGC 6633 (magenta), as well as field stars with Kepler data from Yu et al. (2018) (gray). Known binaries are identified with a green ring. Results for helium-burning stars with minimum radius from MIST models are shown with a solid line.
Following the same procedure for the cluster stars, we find that the faintest NGC 6811 clump stars have masses between 2.11 and 2.33M⊙, and the faintest NGC 1817 clump stars fall in the range 1.87–1.97M⊙. Temperatures were computed from (b−y) colors for NGC 1817 stars, and were taken from Arentoft et al. (2017) for NGC 6811. The NGC 6811 stars generally have smaller measurement uncertainties, and have masses that agree well with the low-mass edge of the field star distribution. As a check that the temperatures do not change our main conclusions, we plot combinations of the asteroseismic parameters that are proportional to mass and radius separately (see Figure 13), but do not correct for the minor dependences on the temperature:
The mass-like combinations for the NGC 1817 giants are consistent with those of NGC 6811, with a couple of exceptions, and the faint RC2 stars in the two clusters have fairly consistent radius-like combinations as well.
Figure 13.

Mass-like (top panel) and radius-like (bottom panel) combinations of asteroseismic parameters for clusters NGC 1817 (blue), NGC 6811 (cyan), and NGC 6633 (magenta), as well as field stars with Kepler data from Yu et al. (2018) (gray). EPIC IDs for selected NGC 1817 stars are shown.
To summarize, both the asteroseismic and photometric evidence suggest that we can identify substantial populations of stars in ~1 Gyr old open clusters that have He core masses at or near the minimum possible, luminosities near a minimum, and average densities near a maximum. Regardless of whether these faint red clump stars form a distinct class or not, models indicate that they are produced in a limited range of masses, and further study will help us learn about their internal physics. They are at a kind of phase transition in stars, resulting from the change between nondegenerate and degenerate He fusion ignition. MIST models approximately match the mass of the transition between primary and secondary red clumps and the rapidity of the transition as a function of stellar mass, but higher-precision mass measurements would put stronger restrictions on the details of convective core overshooting. The models also predict a sharper rise of radius versus mass among the RC2 stars than is seen in the field stars. There are currently large statistical uncertainties and the possibility of significant systematic uncertainties in the asteroseismic masses, however, and the systematic uncertainties in particular directly affect inferences about model physics like convective overshooting. (Overestimation of asteroseismic masses would lead to a need for greater overshooting in models.) However, further study of the lowest mass RC2 stars can realistically lead to improved understanding of their cores.
3.2.2. Suppressed Oscillation Modes
Recently, Arentoft et al. (2017) found that the red clump stars of NGC 6811 could be split into two groups based on whether the stars had strong dipole l = 1 modes. The stars without strong dipole modes are said to have “suppressed modes,” and in the case of the NGC 6811 sample, the stars with suppressed modes were all found to be the faintest (and possibly least evolved) of the clump stars. Cantiello et al. (2016) discussed the possibility that strong magnetic fields in the cores of stars (including red clump stars) can affect the propagation of mixed modes and prevent wave energy from escaping the core. Dipole modes are especially susceptible to magnetic fields due to strong coupling between the core (g mode oscillation) and envelope (p mode oscillation). Their models assumed that the magnetic fields were generated by a dynamo in the convective core of the star during the main sequence, and the timescale for diffusion of the field out of the core is far too long for significant reduction. The field is thus expected to persist through the first-ascent giant phase, but they admitted it was not clear what would happen when convection started again during core helium burning.
Although we are unable to completely survey the stars in NGC 1817, we were able to identify five stars with suppressed modes. We did this by folding the power spectrum using the large frequency separation Δν, and looking for peaks consistently spaced relative to the l = 0 radial modes. The power spectrum of one of the suppressed-power stars (EPIC 246903276) is depicted in Figure 3. The stars in NGC 1817 argue that suppressed modes are not restricted to any one evolutionary state. One suppressed star is found among the four faint red clump stars with asteroseismic measurements, three are found among the ten bright RC2 stars with asteroseismic measurements, and one is found among the two stars brighter than the clump that have asteroseismology. These numbers are consistent with the results of Stello et al. (2016a), who found that the occurrence rate of suppressed modes among first-ascent giants of similar mass (1.6–2.0M⊙) was at least 50%. This appears to indicate that the mode suppression continues unabated through helium burning in the core and the convection that occurs there, or it appears the same fraction of the time in stars in all of these evolutionary phases.
3.2.3. Other Giant Variability
Several of the giants are known to be single-lined spectroscopic binaries from radial velocities, and four had orbits determined by Mermilliod et al. (2003, 2007), with additional measurements in Mermilliod et al. (2008). Two of these had periods short enough that the K2 observations cover an entire orbit (see Table 3). Although none of the binary systems showed eclipses, two show signs of variations that phase—or nearly phase—with the orbit.
Table 3.
Orbital Elements of Giants in Spectroscopic Binaries
| EPIC ID | 246888894 | 246885313 | 246892343 |
|---|---|---|---|
| WEBDA ID | 44 | 164 | 244 |
| P (day) | 68.0293 ± 0.058 | 165.760 ± 0.021 | 43.2485 ± 0.0071 |
| t-2400,000 | 49979.24 ± 0.11 | 49771 ± 10 | 45117.1 ± 1.1 |
| e | 0.000 | 0.020 ± 0.007 | 0.000 |
| ω (deg) | 235 ± 22 | ||
| γ (km s−1) | 65.69 ± 0.16 | 64.69 ± 0.14 | 65.79 ± 0.13 |
| K (km s−1) | 21.00 ± 0.22 | 26.09 ± 0.20 | 4.61 ± 0.18 |
| Nobs | 24 | 26 | 11 |
| Orbit Ref.a | M03 | M03 | M07 |
Notes.
M03: Mermilliod et al. (2003). M07: Mermilliod et al. (2007).
For EPIC 246888894, the velocity variations of the giant (K = 21.00 ± 0.22 km s−1) are fairly substantial, but we see no signs of an eclipse. We do, however, find photometric variations that phase approximately with the radial velocity orbit (P = 68.0293 days; see Figure 14), with minimum light occurring when the brighter giant star was closest to us. Qualitatively, this is consistent with the reflection effect, where the light of the companion star significantly illuminates the side of the giant that is facing it. This binary is one of the brightest cluster members, and it shows clear signs of the companion in its SED, particularly in the ultraviolet in both GALEX NUV and FUV bands (see Figure 15). However, the light curve does not repeat particularly well during the phases of overlap, and this might indicate that the variation is at least partly due to spots. Further analysis of the light curve will be postponed until additional photometric monitoring is done or the K2 light curve can be detrended more reliably. However, the indications are that the companion might be detectable in spectra, and that additional information on the system might be obtained from the photometric variations.
Figure 14.

K2 light curve (top) and radial velocity curve (bottom; Mermilliod et al. 2003) for the red clump star binary EPIC 246888894, phased to the ephemeris of Mermilliod et al. Solid lines show a preliminary model fit to both curves.
Figure 15.

Top panel: spectral energy distribution for the star 24688894 from photometry (orange points), compared with an ATLAS9 model with Teff = 5000 K, log g = 3.0, and E(B − V) = 0.23 (with integrated fluxes in the filter bands showed with green points). Horizontal bars show the approximate wavelength range of each filter used. Bottom panel: fractional flux residual between the observations and the model fit.
EPIC 246892343 was identified as a spectroscopic binary by Mermilliod et al. (2003), but the orbital parameters were finally measured by Mermilliod et al. (2007). In this case, we used the K2 Pre-Search Data Conditioning pipeline light curve, with a 20 point median filter used to smooth some of the instrumental artifacts. The K2 light curve shows photometric variations, and these have been phased to the spectroscopic orbit (P = 43.2485 day) in Figure 16. Where the parts of the light curve overlap in orbital phase, there is only mediocre agreement, and a photometric period near 53 days would produce better agreement. It is not clear, however, how much the detrending of the light curve affects this conclusion. Based on the spectroscopic period, the two observed brightness maxima are separated by roughly 0.5 in phase, and the light curve has its strongest minimum at phase ϕ ≈ 0.65. Future space-based photometric observations might help clarify what part of the light curve comes from binary star effects like reflection and ellipsoidal variations (e.g., Faigler & Mazeh 2011), and what part comes from spots that are out of synchronism with the orbit. We were able to detect solar-like oscillations for this binary as well, although only vmax was measurable. Shorter-period giant star binaries appear to have suppressed oscillations (e.g., Gaulme et al. 2016), so it is interesting that this clump star binary does show oscillations. The clump star would have already gone through its red giant phase with a maximum radius near 25R⊙, which is still less than half the likely orbital separation with the companion object (~66R⊙). It is possible the clump star has not lost significant mass, so further seismic observation could still settle the star’s mass and radius.
Figure 16.

K2 light curve (top) and radial velocity curve (bottom; Mermilliod et al. 2003) for the red clump star binary EPIC 246892343, phased to the spectroscopic circular orbit fit (solid line) of Mermilliod et al. (2007).
The period of a third giant-star binary (EPIC 246885313) is more than twice the duration of the K2 observations, so we could only get a partial sampling of potential variations with timescales similar to the orbit period. The long-term instrumental variations in K2 are consistent with those of other nearby stars and large enough that we do not feel that there is a reliable detection of variations that phase to the orbit.
3.3. Eclipsing Binary Stars
Three eclipsing binary star members were discovered by Arentoft et al. (2005), and the K2 data set has allowed us to determine the ephemerides for all three stars (labeled V4, V16, and V18) and produce complete light curves. In addition, we have discovered seven new detached eclipsing binaries (types EA and EB8), including two with periods longer than the K2 observing campaign, and three additional contact or near-contact binaries (type EW). The data for these stars are given in Table 4, and the light curves are shown in Figures 17–19.
Table 4.
Eclipsing Stars
| EPIC ID | BN04 | G | (GBP − GRP) | P (day) | t0-2450,000 | μ | Notes | ||
|---|---|---|---|---|---|---|---|---|---|
| 246887733 | 390 | 12.010 | 0.789 | 8.042 | 7826.97 | M | M | EW? above TO | |
| 246849982 | 1126 | 12.461 | 0.251 | > 70 | 7894.17 | NM | NM | EA; 0.1% variations out of eclipse | |
| V4 | 246899376 | 7615 | 12.484 | 0.684 | 2.208595 | 2639.61 | M | M | EA; eccentric; SB2 |
| 246903724 | 7376 | 12.965 | 0.571 | 2.182 | 7822.81 | M | M | EW? | |
| 246906509 | 7679 | 13.507 | 0.570 | 2.3185 | 7826.71 | M | M | EB | |
| V18 | 246886747 | 7145 | 14.087 | 0.739 | 7.78275 | 2638.2 | M | M | EA |
| 246865365 | 4915 | 14.894 | 0.934 | 3.3858 | 7860.4720 | NM? | exoplanet | ||
| 246899433 | 230 | 15.551 | 1.144 | 13.1076 | 7834.15 | NM | EA | ||
| 246898423 | 3737 | 15.725 | 0.971 | 7.1277 | 7822.94 | NM | M | EA; no secondary eclipse? or 2P? | |
| 246860261 | 16.307 | 0.820 | 13.107 | 7900.1 | NM | NM? | EA; eccentric; EPIC 246860357 aperture | ||
| 246846293 | 1818 | 16.289 | 1.121 | 8.577 | 7821.74 | NM | NM | EA, weak 2nd eclipse | |
| 246896535 | 17.691 | 0.993 | 46.238 | 7858.853 | M | NM? | EA; CMD nm; EPIC 246896312 aperture | ||
| V16 | 246901174 | 18.722 | 1.421 | 0.2764053 | 2633.355 | NM | EW |
Figure 17.

Phased K2 light curves for detached eclipsing binaries in the field of NGC 1817.
Figure 19.

K2 light curve for EPIC 246849982 with a single detected eclipse.
V1178 Tau (also known as V4; see Figure 17) is a detached double-lined spectroscopic binary that contains at least one pulsating star, and its analysis will be the subject of a separate paper (A. Hedlund et al. 2019, in preparation). For the moment, we report that the orbital period is quite short (2.208595 day), and despite the strong tidal effects and orbital circularization that should result from that, the secondary eclipse does not fall at an orbital phase of 0.5. Further discussion of the origins of the binary is delayed to the future paper, but we briefly discuss its pulsations in Section 3.4.
One of the new long-period detections (EPIC 246849982; see Figure 19) has an eclipse of long duration (about 1.2 days) centered on BJD 2457894.17. The large drop in flux (about 25%) and hint of a period of totality is encouragement for follow-up observations. However, all indications are that it is not a cluster member: the system photometry puts it significantly bluer than the cluster turnoff (see Figure 1), and Gaia proper motions and parallax are well outside the ranges inhabited by cluster stars.
Two objects showed shallow eclipses of exoplanet-like depths. EPIC 246865365 (see Figure 17) is a short-period system (3.3858 day) with eclipses of 0.5% depth. Rampalli et al. (2019) recently discussed this system and identified it as harboring a Saturn-size exoplanet. Gaia measurements of this object have large uncertainties in Data Release 2, but according to the proper motion membership studies (Balaguer-Núñez et al. 2004b; Krone-Martins et al. 2010), the star was identified as a cluster member. The photometry of the system is also consistent with being within the binary star sequence in the cluster CMD. Rampalli et al., however, find that the proper motion and radial velocity of EPIC 246865365 deviates substantially from the cluster mean, and the star does not show variations consistent with having a stellar companion. Their conclusion is that it is a foreground object. A couple of small transit-like events were seen in the light curve of EPIC 246896312, but these were traced to a fainter eclipsing binary (EPIC 246896535) in the aperture. This appears to be a field star based on Gaia parallax and CMD position.
EPIC 246887733 (see Figure 18) is a bright system above the cluster turnoff that has a relatively long period (~8 day) for the continual light curve variations that it shows. The object is likely to contain a subgiant star in weak thermal contact with its companion based on the difference in eclipse depths. The system has also been detected in the FUV and NUV bands by GALEX (Bianchi et al. 2017). Further observations would be necessary to determine the degree to which the low amplitude of the light curve comes from a weakly ellipsoidal star or a nearly face-on orbit.
Figure 18.

Phased K2 light curves for near-contact binaries in the field of NGC 1817.
3.4. Pulsating Stars in the Instability Strip
Prior to Campaign 13, Frandsen & Arentoft (1998), Arentoft et al. (2005), and Andersen et al. (2009) identified 23 main-sequence pulsating variables in the field of NGC 1817. The age of NGC 1817 is such that the cluster turnoff falls completely in the instability strip, similar to NGC 6811 in the main Kepler field (Sandquist et al. 2016). As a result, pulsating variables are among the brightest stars in the cluster, and their oscillation spectra may reveal information about the internal changes that result from their evolution away from the main sequence.
The fields surveyed by previous ground-based studies were considerably smaller than the field observed by K2, and the precision of the K2 photometry is considerably better, so we expected a large group of new detections. The identification of frequencies was challenging in the ground-based data sets due to the complicated structure of the window function for the observations. In addition, the ground-based studies put their light curves through a high-pass filter that may have selected against some modes of oscillation, like g modes, that are observed in many main-sequence pulsating stars. For the purposes of this paper, we will focus on pulsating stars that are members of the NGC 1817 cluster. In part, this is because the original target lists were selected using ground-based proper motion information that has since been superseded by Gaia data. After Gaia DR2, we identified all targets observed in K2 Campaign 13 that had high membership probability based on proper motions and parallaxes. Thus, it is quite possible that there are additional pulsating variables in the field, but the list of pulsating cluster members that we have compiled is not likely to be complete, due to the selection process.
Strongly outlying data points in the time series photometry were removed before any analysis was conducted. We used Period04 software (Lenz & Breger 2005) to compute the pulsation spectra of observed cluster members with G < 15 for frequencies less than the Nyquist frequency (f ≈ 24.5 day−1 or 283 μHz) in the long-cadence data. In some cases (especially among the fainter δ Sct stars), there are probably oscillation modes above the Nyquist frequency, due to the higher stellar densities. We prewhitened the spectrum by successively fitting and subtracting sine waves having the frequency with the highest power remaining in the spectrum. Table 5 contains the frequency and amplitude of the two strongest frequencies in the spectrum of each star. We generally identified stars as δ Sct or γ Dor stars based on whether the strongest frequencies were found above or below 5 day−1, which is generally identified as a high-frequency limit for g modes. Some stars showed frequencies of similar amplitude on both sides of this boundary, and we classified these as hybrid stars. In total, we identify 32 δ Sct pulsators (20 of them new), 27 γ Dor candidates (all but 2 new), and 7 hybrids (4 new).
Table 5.
Main-sequence Pulsating Stars
| EPIC ID | BN04 | G | (GBP − GRP) |
f1 (day−1) |
A1 (mmag) |
f2 (day−1) |
A2 (mmag) |
Membership | Notes | ||
|---|---|---|---|---|---|---|---|---|---|---|---|
| μ | |||||||||||
| V1 | 246893961 | 167 | 13.413 | 0.625 | 19.9255 | 1.875 | 11.2399 | 1.386 | M | M | δ Sct; SB |
| V2 | 246894443 | 154 | 12.776 | 0.669 | 0.6082 | 1.259 | 18.9008 | 0.640 | M | M | hybrid |
| V3 | 246895317 | 184 | 14.263 | 0.735 | 18.4952 | 0.216 | 18.8231 | 0.212 | M | M | δ Sct |
| V4 | 246899376 | 7615 | 12.484 | 0.684 | 11.1044 | 2.180 | 1.4887 | 2.087 | M | M | hybrid?/eclipsing binary |
| V5 | 246888761 | 155 | 12.803 | 0.690 | 14.9202 | 2.377 | 10.9488 | 0.764 | M | M | δ Sct |
| V6 | 246894145 | 156 | 12.813 | 0.709 | 18.0807 | 0.691 | 15.7912 | 0.449 | M | M | δ Sct |
| V7 | 246901593 | 7632 | 13.620 | 0.619 | 14.6041 | 1.316 | 9.4671 | 1.313 | M | M | δ Sct |
| V8 | 246896788 | 423 | 14.205 | 0.743 | 20.1215 | 0.612 | 20.4607 | 0.589 | M | M | δ Sct |
| V9 | 246897103 | 7294 | 13.074 | 0.785 | 8.8691 | 0.601 | 10.0776 | 0.469 | M | M | δ Sct; triplet; f3 = 7.7095 |
| V10 | 246888938 | 240 | 16.455 | 0.796 | NM | NM | δ Sct; below MS | ||||
| V11 | 246893551 | 7097 | 14.192 | 0.705 | 20.5668 | 0.624 | 16.8276 | 0.167 | M | M | δ Sct; dominant freq |
| V12 | 246891220 | 7105 | 14.533 | 0.799 | 2.5487 | 4.011 | 2.4949 | 3.878 | M? | M | γ Dor |
| V13 | 246895148 | 192 | 14.559 | 0.782 | 18.8236 | 0.659 | 18.4952 | 0.585 | M | M | hybrid; Gaussian packet |
| V19 | 246882381 | 162 | 13.243 | 0.578 | 11.4611 | 1.121 | 10.6118 | 1.042 | NM | M | δ Sct; two strongest freqs. |
| V20 | 246882504 | 181 | 14.225 | 0.690 | 24.0070 | 0.330 | 18.9431 | 0.126 | M | M | δ Sct |
| V21 | 246889963 | 7214 | 14.308 | 0.707 | 19.6082 | 0.936 | 9.6786 | 0.672 | M | M | δ Sct; prob. super-Nyquist freqs. |
| V22 | 246905680 | 7332 | 13.854 | 0.703 | 14.1882 | 3.126 | 16.4024 | 0.332 | M | M | δ Sct; dominant freq. |
| V23 | 246887060 | 7148 | 14.560 | 0.746 | 1.6020 | 10.431 | 1.6415 | 7.948 | M | M | γ Dor |
| V26 | 246895228 | 7469 | 16.278 | 1.066 | M | M | not variable | ||||
| V1177 | 246897707 | 7298 | 14.017 | 0.636 | M | M | not variable | ||||
| 246851341 | 1180 | 15.342 | 1.021 | 0.7658 | 0.593 | 0.7427 | 0.278 | M? | M | γ Dor? | |
| 246855623 | 13.405 | 0.677 | 17.9151 | 3.337 | 15.7139 | 0.796 | M | M | δ Sct; dominant freq. | ||
| 246857175 | 1084 | 14.390 | 0.759 | 19.5160 | 1.451 | 19.0023 | 0.949 | M | M | hybrid | |
| 246860219 | 12.440 | 0.766 | 0.7946 | 0.197 | 0.8329 | 0.047 | M | M | rotational? | ||
| 246861917 | 781 | 13.962 | 0.714 | 13.6109 | 2.461 | 15.6916 | 1.177 | M | M | δ Sct | |
| 246866279 | 4909 | 14.709 | 0.817 | 2.0092 | 2.175 | 2.1707 | 1.761 | M | M? | γ Dor; 2 freq. groups | |
| 246871279 | 775 | 13.083 | 0.706 | 1.3957 | 0.130 | 1.4799 | 0.063 | M | M | rotational? | |
| 246874980 | 4907 | 14.592 | 0.773 | 1.5549 | 3.370 | 1.8342 | 2.250 | M | M | γ Dor | |
| 246878285 | 51 | 14.766 | 0.895 | 0.9422 | 0.192 | 0.9617 | 0.131 | M | M | γ Dor? near single freq. | |
| 246888228 | 7085 | 15.430 | 0.916 | 0.7688 | 0.104 | 3.8347 | 0.076 | M | M | γ Dor? | |
| 246883000 | 160 | 13.024 | 0.610 | 1.2971 | 0.326 | 1.2110 | 0.153 | M | M | hot γ Dor? | |
| 246884149 | 7746 | 12.198 | 0.696 | 0.8203 | 0.048 | M | M | rotational? | |||
| 246884792 | 889 | 14.109 | 0.717 | 18.4841 | 1.110 | 1.3012 | 1.110 | M? | M | δ Sct | |
| 246886811 | 7753 | 14.685 | 0.789 | 1.5471 | 1.536 | 1.5378 | 0.491 | M | M | γ Dor | |
| 246887076 | 7768 | 13.043 | 0.745 | 6.3433 | 2.171 | 9.4438 | 0.292 | M | M | δ Sct; dominant freq. | |
| 246887105 | 525 | 14.287 | 0.711 | 0.6796 | 0.423 | 20.0530 | 0.392 | M | M | hybrid; weak; Gaussian structure | |
| 246888602 | 7154 | 13.092 | 0.573 | 11.3395 | 0.321 | M | M | δ Sct; dominant freq | |||
| 246888903 | 3683 | 13.913 | 0.649 | 17.5103 | 0.456 | 21.7653 | 0.307 | M | M | δ Sct; prob hits Nyquist | |
| 246889429 | 6660 | 14.122 | 0.636 | 22.8715 | 2.597 | 22.6384 | 1.798 | M? | M? | δ Sct; beats; prob hits Nyquist | |
| 246890269 | 3698 | 14.571 | 0.756 | 1.8021 | 2.011 | 1.9146 | 1.576 | M | M | γ Dor | |
| 246890414 | 163 | 13.203 | 0.681 | 15.2372 | 0.189 | 15.9872 | 0.161 | M | M | δ Sct | |
| 246891489 | 7078 | 13.776 | 0.648 | 15.8220 | 0.549 | M | M | δ Sct; dominant freq. | |||
| 246892400 | 7079 | 12.754 | 0.763 | 9.5211 | 0.371 | 8.4558 | 0.357 | M | M | δ Sct; beats | |
| 246892423 | 7225 | 14.468 | 0.783 | 2.2597 | 1.016 | 1.3459 | 0.975 | M | M | γ Dor | |
| 246892620 | 3671 | 13.134 | 0.548 | 22.1865 | 0.319 | 22.2267 | 0.298 | M | M | δ Sct | |
| 246892892 | 150 | 12.691 | 0.646 | 2.5376 | 0.120 | 1.3084 | 0.108 | M | M | hot γ Dor? | |
| 246893663 | 196 | 14.662 | 0.870 | 0.9843 | 11.434 | 0.8780 | 9.558 | M? | M? | γ Dor | |
| 246895037 | 202 | 14.799 | 0.816 | 1.9089 | 0.133 | 1.9403 | 0.114 | M | M | γ Dor | |
| 246895872 | 3674 | 13.343 | 0.749 | 14.8691 | 0.314 | 23.6892 | 0.128 | M | M | δ Sct; dominant freq. | |
| 246895958 | 195 | 14.625 | 0.792 | 2.9783 | 1.561 | 2.7832 | 1.396 | M | M | γ Dor | |
| 246896275 | 7467 | 12.900 | 0.312 | 1.5452 | 0.107 | 1.8216 | 0.096 | M | M | rotational? | |
| 246897854 | 3670 | 12.953 | 0.617 | 1.1061 | 0.183 | 3.8177 | 0.170 | M | M | hybrid? | |
| 246898842 | 6684 | 15.199 | 0.886 | 0.9064 | 0.306 | M | M | γ Dor? | |||
| 246899036 | 171 | 13.639 | 0.640 | 2.2323 | 0.186 | 12.9797 | 0.114 | M? | M? | hybrid | |
| 246899163 | 7362 | 13.712 | 0.645 | 14.9972 | 0.132 | 13.4081 | 0.113 | M | M | δ Sct | |
| 246899781 | 6669 | 14.341 | 0.784 | 4.9691 | 1.905 | 4.9150 | 1.358 | M | M | γ Dor; strong oscill. | |
| 246899840 | 186 | 14.165 | 0.833 | 1.3541 | 2.808 | 1.3869 | 1.655 | M | M | γ Dor | |
| 246902309 | 7308 | 13.006 | 0.729 | 9.4269 | 0.531 | 13.0180 | 0.381 | M | M | δ Sct | |
| 246902508 | 7641 | 13.133 | 0.645 | 14.4388 | 0.366 | 17.3904 | 0.367 | M | M | δ Sct | |
| 246904294 | 7311 | 14.328 | 0.729 | 7.4606 | 1.731 | 2.1215 | 0.998 | M | M | hybrid; three rich packets | |
| 246905414 | 14.496 | 0.686 | 2.0456 | 3.268 | 1.8529 | 1.500 | M | M | γ Dor; beats | ||
| 246912283 | 13.037 | 0.585 | 18.5666 | 0.766 | 17.9832 | 0.546 | M | M | δ Sct | ||
| 246912694 | 13.721 | 0.605 | 14.0664 | 0.647 | 19.0229 | 0.326 | M | M | δ Sct | ||
| 246914712 | 13.440 | 0.620 | 9.6573 | 0.240 | 13.5149 | 0.194 | M | M | δ Sct | ||
| 246916477 | 12.935 | 0.627 | 15.6072 | 4.272 | 17.4394 | 4.046 | M | M | δ Sct; beats | ||
| 246919500 | 14.438 | 0.685 | 1.9357 | 5.592 | 1.7059 | 3.351 | M | M | γ Dor | ||
| 246919843 | 11.950 | 0.956 | 15.8546 | 0.218 | 17.4526 | 0.129 | M | M | δ Sct; subgiant? | ||
| 246920074 | 14.428 | 0.727 | 2.4856 | 2.871 | 2.6321 | 1.997 | M | M | γ Dor, beats | ||
| 246922458 | 14.558 | 0.746 | 1.6315 | 3.631 | 1.0517 | 2.849 | M | M | γ Dor | ||
Figure 1 shows the CMD positions of the detected pulsating stars. It is clear that many of the brighter stars have evolved away from the main sequence, and are likely to have lower average densities than the fainter objects on the main sequence. We expect this to affect the fundamental mode of oscillation, and generally speaking, the average frequency of oscillations that are excited. However, even among stars with a single dominant mode peak (see Figure 20), there is not a clearly visible relationship between the frequency and the luminosity of the star (which should relate to its average density). This is just one example of the difficulty of identifying the mode of oscillation in main-sequence pulsating stars, and we will discuss this more below.
Figure 20.

Amplitude spectra for main-sequence pulsating stars with a single high-amplitude mode in NGC 1817.
3.4.1. Ensemble Identification of Pulsation Modes
Arentoft et al. (2005) looked at the strongest modes of oscillation as a function of magnitude for the ensemble of δ Sct stars they detected in NGC 1817. They did this in the hope that the relative magnitudes of the stars could be related to differences in their average densities, which should affect the frequency of a particular mode in a predictable way, allowing modes to be identified. In practice, mode frequencies can be shifted by complicating factors like rotation and binarity, and in the case of NGC 1817, the evolutionary state of different stars. In an examination of a cluster of similar age (NGC 6811), Sandquist et al. (2016) found evidence of a period–luminosity relation among the largest-amplitude modes observed in the δ Sct stars. Ziaali et al. (2019) recently found similar evidence among δ Sct stars observed with Kepler and with luminosities derived from Gaia DR2 parallaxes. The radial fundamental mode of oscillation is likely to be among the few modes at the low-frequency end of the spectrum, and this feature may help set up a P–L relation for these stars.
Figure 21 shows the zoomed color–magnitude diagram of the pulsators, and a diagram of G magnitude versus frequency for the strongest modes. When we shift the period–luminosity relation (McNamara et al. 2007) for the fundamental mode oscillations of high-amplitude δ Sct stars with Hipparcos parallaxes (solid curve in the right panel) using a distance modulus based on the Gaia mean parallax and an extinction AG based on the reddening E(B − V) = 0.28, we find excellent agreement with the low-frequency envelope of the strongest observed modes. This envelope is set by a handful of stars: EPIC 246887076 (a star having a single dominant frequency), EPIC 246901593/V7, and possibly EPIC 246861917 and EPIC 246889963/V21. Arentoft et al. (2005) identified three stars in their ground-based data that had strongly excited modes near the fundamental, but only one of these (V7) is in our list above. We find that the other two (V1 and V9) have frequencies close to the low-frequency envelope, but significantly above. V9 is discussed in Section 3.4.3. Figure 22 shows the spectra of the most likely fundamental mode pulsators.
Figure 21.
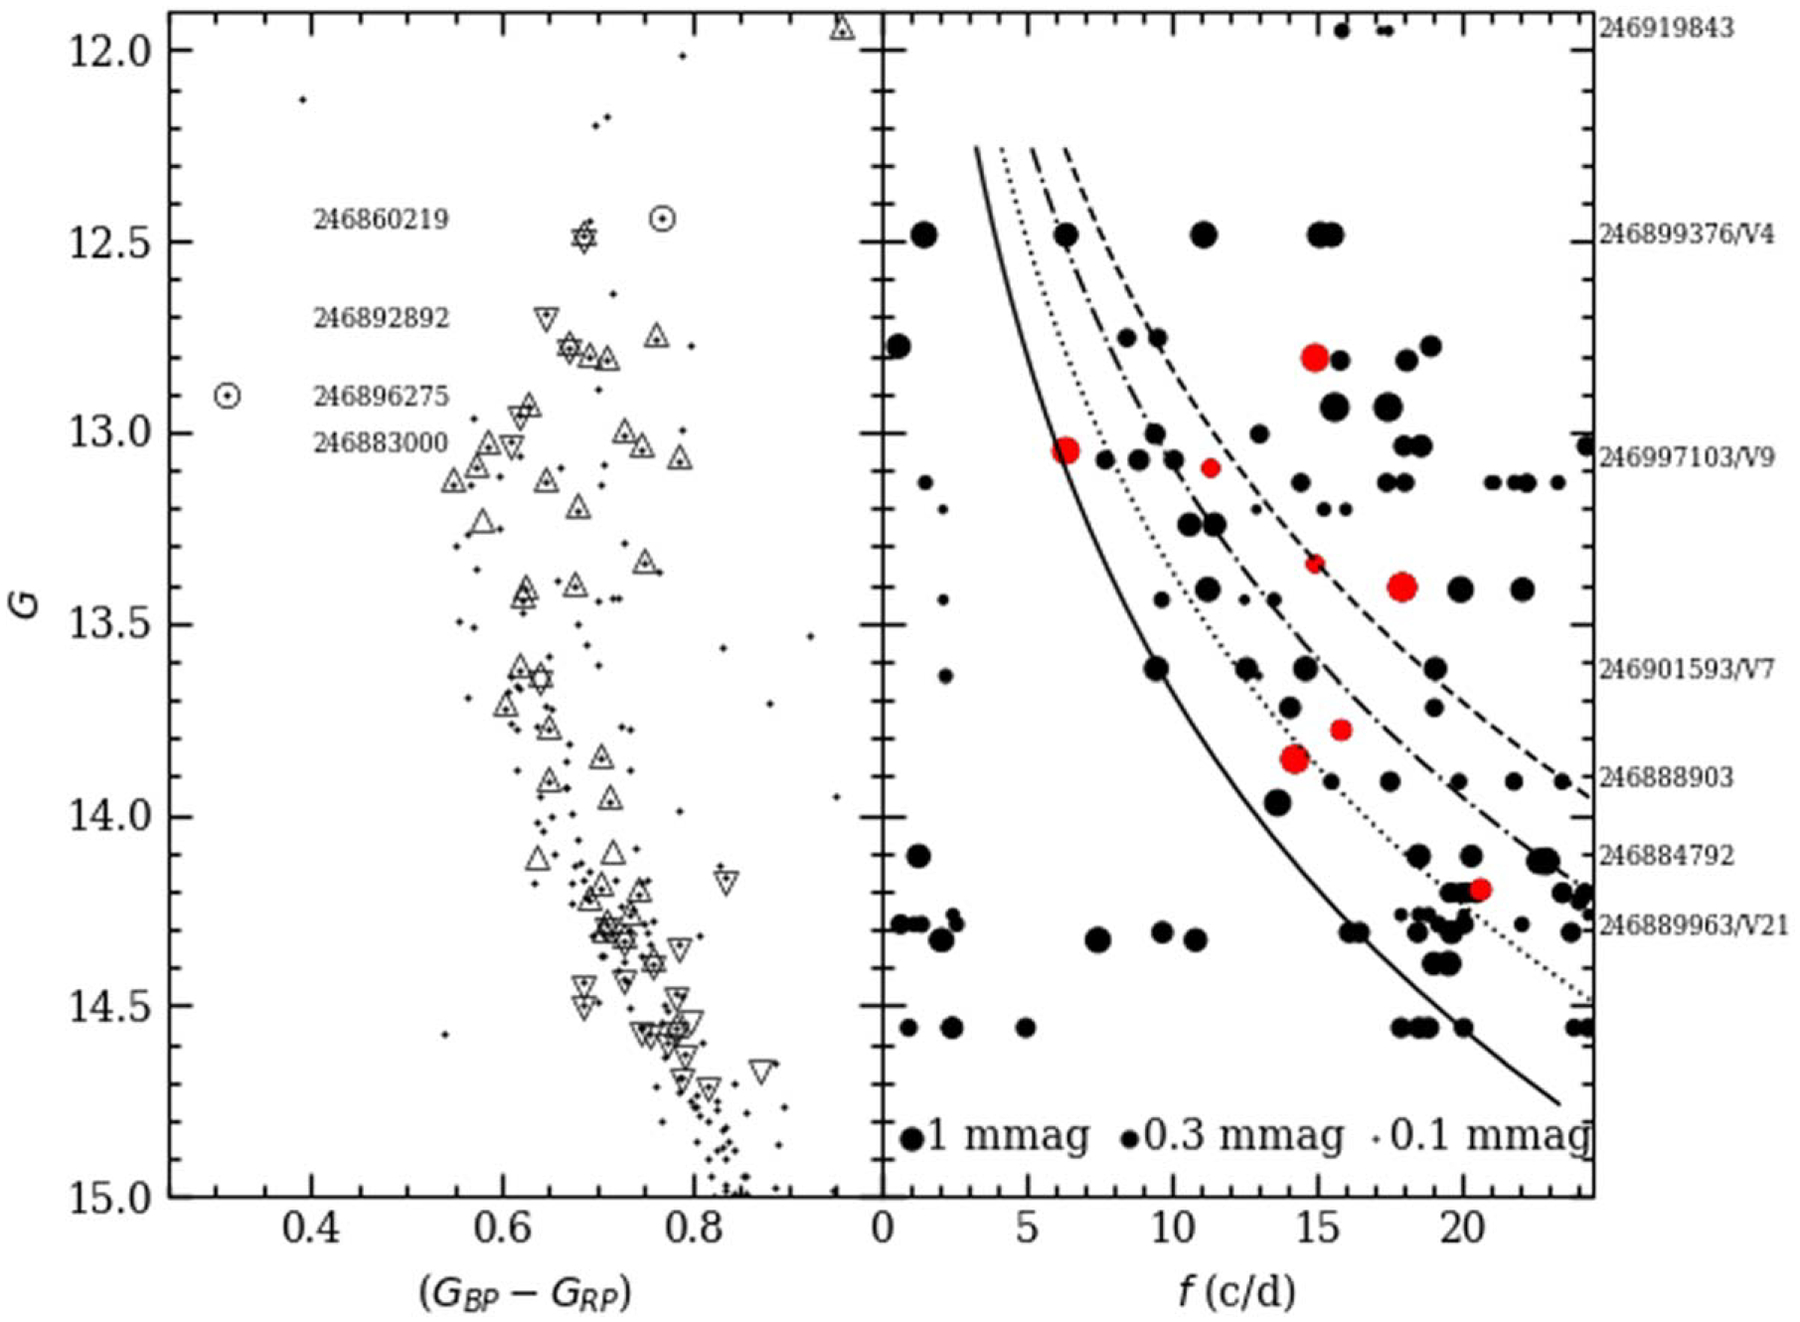
Left: Gaia color–magnitude diagram positions for main sequence pulsators in NGC 1817. δ Sct stars are shown with Δ, γ Dor stars with ∇, hybrid stars with a star symbol, and possible rotating variables with ◯. EPIC IDs for the bright low-frequency variables are shown at the same magnitude level. Right: strongest frequencies (any mode with amplitude greater than half that of the one with largest amplitude) vs. magnitude for stars with high-frequency pressure modes of oscillation (δ Sct or hybrid pulsators). Symbol size is related to the amplitude of the mode, and red symbols show stars with a single dominant mode of pulsation. Lines (from left to right) show predicted positions of the radial fundamental mode and first through third overtones using the McNamara et al. (2007) P–L relation and Stellingwerf (1979) period ratios, along with a cluster distance modulus (m − M)G = 12.06. EPIC IDs of selected variables are shown at the magnitude level of the star’s oscillation modes.
Figure 22.

Amplitude spectra for stars with possible strong radial fundamental mode (cyan marks; left panels and bottom right panel) and first overtone (magenta marks; top two right panels) pulsation in NGC 1817.
Theoretical models indicate that period ratios for radial pulsation modes are stable (Stellingwerf 1979), so if we have reliably identified the frequency of the fundamental mode as a function of magnitude, we should be able to predict the frequencies of overtones. The dotted and dashed curves in Figure 21 show predicted values for first through third overtones, using theoretical period ratios. Once again, rotation, binarity, and evolutionary effects shift frequencies. These factors will complicate identification for most stars, but we looked for ones with the strongest cases. The variable V7 may be the most interesting of the stars, because its fourth-strongest frequency agrees well with the predicted frequency of the first overtone if its second-strongest frequency is indeed the fundamental mode. In addition, the strongest mode falls near the predicted second overtone, and the third-strongest mode falls near the third overtone.
There are a few stars that have patterns in their frequency spectra that may identify a radial overtone mode. EPIC 246888903 (see Figure 22) shows five strong frequencies that appear to be a good match for the first, second, and third radial overtones, along with two other modes that sit approximately halfway between the overtones. EPIC 246884792 shows a strong mode that matches the approximate frequency predicted for the first radial overtone.
Other stars may be fundamental mode pulsators, but binary companions could affect their magnitudes and shift them vertically away from the low-frequency envelope. An example of this is the bright pulsating star EPIC 246899376 (V4/V1178 Tau), which contains two stars of nearly equal brightness, and is discussed below.
3.4.2. The Eclipsing System V1178 Tau
V1178 Tau (EPIC 246899376) was first identified as an eclipsing binary star in Arentoft et al. (2005). They gave the star the identifier V4, and they detected four δ Sct pulsation frequencies. Molenda-Żakowicz et al. (2009) found that the binary is double-lined.
We derived a clean pulsation spectrum by subtracting an optimized model eclipsing light curve using the program ELC (Orosz & Hauschildt 2000). For our purposes in this paper, we are only interested in the pulsation spectrum, and so we will not discuss the parameters used in the fit. The spectrum derived from Period04 is shown in Figure 23. There are five frequencies with amplitudes of more than 1 mmag in the K2 data set. Three of the detected frequencies roughly correspond to the detections by Arentoft et al., but our second-highest amplitude detection is in the low-frequency g mode range at 1.488 day−1. This mode is the main reason we label the system a possible hybrid. In addition, we do not see any sign of a mode at 8.32 day−1 as reported by Arentoft et al.
Figure 23.

Amplitude spectra for pulsating stars of extra interest in NGC 1817.
High-resolution spectra show lines of both stars, and for spectra of stars with similar temperatures, broadening function (Rucinski 2002) areas can be used as proxies for luminosity. Therefore, we conducted a preliminary analysis of HARPS spectra to derive broadening functions for the two stars. After fitting the broadening functions with Gaussians, we derived an area ratio of 0.85. If this represents the luminosity ratio properly, the pulsating star should be between 0.67 and 0.84 mag below the magnitude of the binary. If this is taken into consideration, the fifth-strongest detected mode with frequency 6.368 day−1 falls near the radial fundamental mode line in Figure 21. This possibility makes the system worth additional study. In a binary with a relatively short orbital period of around 2.2 days, the orbit should have circularized and the stellar rotation should have synchronized with the orbit for an age near 1 Gyr. However, the orbit has significant eccentricity based on the eclipse spacings in phase (see Section 3.3), which is a clue that the system might have been involved in dynamical interactions after the cluster’s formation. Another consequence of this is that the rotation of the stars may still be slowing down or may be pseudo-synchronized with the orbital motion at periastron. Preliminary measurements of vsini from the broadening functions indicate speeds near 70 km s−1, which is much slower than typical main-sequence A stars. The rotations of both stars are faster than they would be if synchronized (~50 km s−1) with the orbital motion, but the primary star may be pseudo-synchronized (using e ≈ 0.13 and R1 ≈ 2.2R⊙; Hut 1981). While there are large samples of eclipsing binaries with δ Sct pulsators now known (Liakos & Niarchos 2017; Kahraman Aliçavuş et al. 2017; Gaulme & Guzik 2019), short-period binaries with eccentric orbits are rare. We find three detached systems that are identified as eccentric in the tabulation of Liakos & Niarchos, but in all cases, the eccentricity is marginal. Because V1178 Tau is a member of the NGC 1817 cluster, the age may provide some interesting constraints on the dynamics of the system for future studies.
3.4.3. A Mode Triplet?
EPIC 246897103 (V9) was identified by Arentoft et al. (2005) as a δ Sct star from the ground-based observations, and they identified three pulsation frequencies. In the amplitude spectrum of the K2 light curve, we find four strong modes, but only one is a match to the three in Arentoft et al., probably due to the complex window function for the ground-based observations. The star is of interest because the three strongest frequencies (8.869, 10.077, and 7.710 day−1) resemble a mode triplet that may be related to strong rotation (see Figure 23). The star is the reddest pulsating star at the extended cluster turnoff, consistent with the idea that strong stellar rotation may be responsible for the color spread in intermediate-age clusters like NGC 1817 and NGC 5822 (Sun et al. 2019). Molenda-Żakowicz et al. (2009) made a low-resolution spectroscopic measurement of the rotational velocity, and found vsini = 220 km s−1. We can estimate the rotational frequency as vrot = vrot/2πR ≈ 2 day−1, assuming a stellar radius of about 2.2R⊙, similar to the primary star of V1178 Tau. Because the rotational frequency spacing is likely a multiple of Ωrot = 2πνrot and more than a factor of 10 larger than the frequency spacing of the modes above, rotation may not be a good explanation unless there is a serious error in one of the measurements. Effects due to a highly inclined spin axis are not plausible here, due to the large measured rotational velocity. Alternately, we note that the second- and third-strongest frequencies fall near the predicted frequencies of the second and first radial overtones, respectively (see Figure 21).
3.4.4. A Subgiant Candidate
Weak variability is detectable in the bright star EPIC 246919843. Because it sits in a very sparsely populated part of the cluster’s CMD between the main-sequence turnoff and the red clump, the star’s membership should be validated. However, all of the information available (including its Gaia parallax and radial velocity) indicates that it is a high-probability cluster member. The CMD position of the object gives it a chance of being either a binary composed of a faint giant star and a bright main-sequence star, or a single subgiant star. If the object is a binary, both stars could potentially be variable (an asteroseismic giant and a pulsating main-sequence star, for example), so we looked at the SED first (see Section 2.2).
For comparison, we used theoretical models from ATLAS9 (Castelli & Kurucz 2004), with adjustment of the model to account for an interstellar reddening of E(B − V) = 0.23 using the Cardelli et al. (1989) extinction curve. Model photometry was calculated using the IRAF routine sbands. The SED is well-fit with a temperature of about 6250 K (see Figure 24), appropriate for a star between the main sequence and red clump. For comparison, a sample of NGC 1817 δ Sct stars were found by Molenda-Żakowicz et al. (2009) to have effective temperatures between about 6900 and 8100 K.
Figure 24.

Top panel: spectral energy distribution for the star 246919843 from photometry (orange points), compared with an ATLAS9 model with Teff = 6250 K, log g = 4.0, and E(B − V) = 0.23. Horizontal bars show the approximate wavelength range of each filter used. Bottom panel: fractional flux residual between the observations and the model fit.
The relatively large amplitude and high frequency of the variations argue against the possibility of a binary containing a red clump star—the detected frequencies are centered at around 16 day−1 or 184 μHz, larger than any of the giants detected in NGC 1817 or the similar cluster NGC 6811 (see Figure 23). Similarly, while the oscillation frequencies lie in the range populated by δ Sct pulsation modes, they appear at too high a frequency for the relatively low density of a subgiant star’s envelope unless they are higher overtones. Our conclusion is that this is a genuine subgiant star in the cluster within the Hertzprung gap. Although stars like this are rare, it is most probable to find one in a heavily populated cluster like NGC 1817.
3.4.5. Unusual γ Dor–like Stars
The instability strip for γ Dor stars is observed to overlap with the cool edge of the δ Sct instability strip for field stars (e.g., Balona 2018), and the majority of the NGC 1817 γ Dor stars we identified show this as well (see the left panel of Figure 21). However, we also discovered a handful of much brighter (and sometimes hotter) stars with γ Dor–like pulsation. The pulsation spectra of these stars are shown in Figure 25.
Figure 25.

Amplitude spectra for stars with γ Dor–like pulsation in NGC 1817.
EPIC 246896275 is the bluest variable star identified in this study, and as with all of the stars in this section, Gaia parallax and proper motion information is completely consistent with cluster membership. This makes EPIC 246896275 a likely blue straggler. The low-frequency spectrum appears to have a roughly Gaussian-shaped envelope, similar to rotational candidates in Balona (2013). However, such features have not been explained yet.
EPIC 246892892 is brighter than the cluster turnoff, and if it is a single star, it would have to have started its evolution off of the main sequence. We find at least seven low-amplitude frequencies between 1.30 and 4.72 day−1, with four between 2.12 and 2.81 day−1. The indications are that these are real pulsation modes, which would also make this a possible hot γ Dor star (Balona et al. 2016).
EPIC 246860219 is one of the brightest main-sequence stars identified with pulsations, and its spectrum is dominated by a single frequency (0.795 day−1). We tentatively identify the star as a rotational variable candidate, similar to stars discussed in Balona (2013). If true, the detected frequency should be related to the rotation period of the star.
EPIC 246883000 is found among the δ Sct pulsating stars at the cluster turnoff. Its spectrum is also dominated by a single frequency (1.297 day−1), but there are several other, weaker low frequencies (1.211, 5.058, and 4.158 day−1) and one higher frequency (17.422 day−1) detected. Based on the pulsation modes and the CMD position, we classify the star as a hot γ Dor candidate.
4. Conclusions
We examined the K2 light curves for hundreds of stars in the massive open cluster NGC 1817. This data set gives us the opportunity to examine large uniform samples of stars in different evolutionary phases within this approximately 1 Gyr old, slightly subsolar metallicity population.
Photometric and asteroseismic evidence shows that the cluster is producing a large fraction of its red clump stars with nearly the minimum helium core mass. NGC 1817 is on the young side of the range of ages that can produce these stars. More precise measurement of the masses of these stars could allow a calibration of the amount of convective core overshooting on the main sequence.
We find two giant stars in relatively short-period binary systems that show photometric variations that may vary in phase with the orbits. We determine the periods of previously known eclipsing systems, and detect new systems. We identify one (V1178 Tau) that has an eccentric orbit despite a rather short period, which probably indicates dynamical interactions after the cluster’s birth. Another system (EPIC 246887733) probably contains a subgiant star, and shows an EW light curve despite an orbital period of more than eight days.
The turnoff of the cluster contains a rich population of pulsating variable stars of δ Sct and γ Dor classes. The large δ Sct population in particular gives some hope for using ensemble asteroseismology to help identify pulsation modes in their rich frequency spectra. The large sample includes unusual stars like a subgiant star pulsating in high-order modes (EPIC 246919843), and two hot γ Dor candidates (EPIC 246892892 and 246883000).
Acknowledgments
This paper includes data collected by the K2 mission, and we gratefully acknowledge support from the NASA Science Directorate under grant NNX17AE94G. D.S. is the recipient of an Australian Research Council Future Fellowship (project number FT1400147). Funding for the Stellar Astrophysics Centre is provided by The Danish National Research Foundation (Grant agreement no.: DNRF106).
This research made use of the SIMBAD database, operated at CDS, Strasbourg, France; the WEBDA database, operated at the Institute for Astronomy of the University of Vienna; and the Mikulski Archive for Space Telescopes (MAST). STScI is operated by the Association of Universities for Research in Astronomy, Inc., under NASA contract NAS5-26555. Support for MAST is provided by the NASA Office of Space Science via grant NNX09AF08G and by other grants and contracts.
Facilities: Kepler, Gaia, GALEX, MAST, CDS.
Software: K2FF pipeline (Vanderburg et al. 2016), Period04 (Lenz & Breger 2005), ELC (Orosz & Hauschildt 2000).
Footnotes
EA binaries have nearly spherical components, while EB star have somewhat ellipsoidal stars that results in out of eclipse variation.
Unified Astronomy Thesaurus concepts: Eclipsing binary stars (444); Spectroscopic binary stars (1557); Open star clusters (1160); Asteroseismology (73); Low mass stars (2050); Stellar distance (1595); Stellar evolution (1599)
References
- Andersen MF, Arentoft T, Frandsen S, et al. 2009, CoAst, 160, 9 [Google Scholar]
- Arentoft T, Bouzid MY, Sterken C, Freyhammer LM, & Frandsen S 2005, PASP, 117, 601 [Google Scholar]
- Arentoft T, Brogaard K, Jessen-Hansen J, et al. 2017, ApJ, 838, 115 [Google Scholar]
- Bagdonas V, Drazdauskas A, Tautvaišienė G, et al. 2018, A&A, 615, A165 [Google Scholar]
- Balaguer-Núñez L, Jordi C, Galadí-Enríquez D, & Masana E 2004a, A&A, 426, 827 [Google Scholar]
- Balaguer-Núñez L, Jordi C, Galadí-Enríquez D, & Zhao JL 2004b, A&A, 426, 819 [Google Scholar]
- Balona LA 2013, MNRAS, 431, 2240 [Google Scholar]
- Balona LA 2018, MNRAS, 479, 183 [Google Scholar]
- Balona LA, Engelbrecht CA, Joshi YC, et al. 2016, MNRAS, 460, 1318 [Google Scholar]
- Bianchi L, Shiao B, & Thilker D 2017, ApJS, 230, 24 [Google Scholar]
- Boesgaard AM, Roper BW, & Lum MG 2013, ApJ, 775, 58 [Google Scholar]
- Brogaard K, Hansen CJ, Miglio A, et al. 2018, MNRAS, 476, 3729 [Google Scholar]
- Brogaard K, Jessen-Hansen J, Handberg R, et al. 2016, AN, 337, 793 [Google Scholar]
- Brown TM, Gilliland RL, Noyes RW, & Ramsey LW 1991, ApJ, 368, 599 [Google Scholar]
- Cantat-Gaudin T, Jordi C, Vallenari A, et al. 2018, A&A, 618, A93 [Google Scholar]
- Cantiello M, Fuller J, & Bildsten L 2016, ApJ, 824, 14 [Google Scholar]
- Cardelli JA, Clayton GC, & Mathis JS 1989, ApJ, 345, 245 [Google Scholar]
- Carrera R, Bragaglia A, Cantat-Gaudin T, et al. 2019, A&A, 623, A80 [Google Scholar]
- Casamiquela L, Carrera R, Blanco-Cuaresma S, et al. 2017, MNRAS, 470, 4363 [Google Scholar]
- Castelli F, & Kurucz RL 2004, in IAU Symp. 210, Modelling of Stellar Atmospheres, ed. Piskunov N, Weiss WW, & Gray DF (Cambridge: Cambridge Univ. Press; ), A20 [Google Scholar]
- Choi J, Dotter A, Conroy C, et al. 2016, ApJ, 823, 102 [Google Scholar]
- Donati P, Beccari G, Bragaglia A, et al. 2014, MNRAS, 437, 1241 [Google Scholar]
- Faigler S, & Mazeh T 2011, MNRAS, 415, 3921 [Google Scholar]
- Frandsen S, & Arentoft T 1998, A&A, 333, 524 [Google Scholar]
- Gaia Collaboration, Babusiaux C, van Leeuwen F, et al. 2018a, A&A, 616, A10 [Google Scholar]
- Gaia Collaboration, Brown AGA, Vallenari A, et al. 2018b, A&A, 616, A1 [Google Scholar]
- Gaulme P, & Guzik JA 2019, A&A, 630, A106 [Google Scholar]
- Gaulme P, McKeever J, Jackiewicz J, et al. 2016, ApJ, 832, 121 [Google Scholar]
- Girardi L 1999, MNRAS, 308, 818 [Google Scholar]
- Girardi L 2016, ARA&A, 54, 95 [Google Scholar]
- Girardi L, Mermilliod J-C, & Carraro G 2000, A&A, 354, 892 [Google Scholar]
- Handberg R, Brogaard K, Miglio A, et al. 2017, MNRAS, 472, 979 [Google Scholar]
- Handberg R, & Lund MN 2014, MNRAS, 445, 2698 [Google Scholar]
- Harris GLH, & Harris WE 1977, AJ, 82, 612 [Google Scholar]
- Henden AA, Levine S, Terrell D, et al. 2015, AAS Meeting, 225, 336.16 [Google Scholar]
- Hidalgo SL, Pietrinferni A, Cassisi S, et al. 2018, ApJ, 856, 125 [Google Scholar]
- Huber D, Stello D, Bedding TR, et al. 2009, CoAst, 160, 74 [Google Scholar]
- Hut P 1981, A&A, 99, 126 [Google Scholar]
- Jacobson HR, Friel ED, & Pilachowski CA 2009, AJ, 137, 4753 [Google Scholar]
- Jacobson HR, Pilachowski CA, & Friel ED 2011, AJ, 142, 59 [Google Scholar]
- Jeffries RD, Totten EJ, Harmer S, et al. 2002, MNRAS, 336, 1109 [Google Scholar]
- Kahraman Aliçavuş F, Soydugan E, Smalley B, et al. 2017, MNRAS, 470, 915 [Google Scholar]
- Kaiser N, Burgett W, Chambers K, et al. 2010, Proc. SPIE, 7733, 77330E [Google Scholar]
- Kallinger T, Mosser B, Hekker S, et al. 2010, A&A, 522, A1 [Google Scholar]
- Kjeldsen H, & Bedding TR 1995, A&A, 293, 87 [Google Scholar]
- Krone-Martins A, Soubiran C, Ducourant C, Teixeira R, & Le Campion JF 2010, A&A, 516, A3 [Google Scholar]
- Lenz P, & Breger M 2005, CoAst, 146, 53 [Google Scholar]
- Liakos A, & Niarchos P 2017, MNRAS, 465, 1181 [Google Scholar]
- Luger R, Agol E, Kruse E, et al. 2016, AJ, 152, 100 [Google Scholar]
- Martin DC, Fanson J, Schiminovich D, et al. 2005, ApJL, 619, L1 [Google Scholar]
- McNamara DH, Clementini G, & Marconi M 2007, AJ, 133, 2752 [Google Scholar]
- Mermilliod J-C, Andersen J, Latham DW, et al. 2007, A&A, 473, 829 [Google Scholar]
- Mermilliod J-C, Latham DW, Glushkova EV, et al. 2003, A&A, 399, 105 [Google Scholar]
- Mermilliod JC, Mayor M, & Udry S 2008, A&A, 485, 303 [Google Scholar]
- Molenda-Żakowicz J, Arentoft T, Frandsen S, et al. 2009, AcA, 59, 69 [Google Scholar]
- Mosser B, Benomar O, Belkacem K, et al. 2014, A&A, 572, L5 [Google Scholar]
- Netopil M, Paunzen E, Heiter U, et al. 2016, A&A, 585, A150 [Google Scholar]
- Orosz JA, & Hauschildt PH 2000, A&A, 364, 265 [Google Scholar]
- Overbeek JC, Friel ED, & Jacobson HR 2016, ApJ, 824, 75 [Google Scholar]
- Peña JH, Robleto-Orús A, Piña DS, et al. 2017, RMxAA, 53, 309 [Google Scholar]
- Peña Suárez VJ, Sales Silva JV, Katime Santrich OJ, et al. 2018, ApJ, 854, 184 [Google Scholar]
- Poretti E, Mathias P, Barban C, et al. 2015, ASSL, 39, 101 [Google Scholar]
- Rampalli R, Vanderburg A, Bieryla A, et al. 2019, AJ, 158, 62 [Google Scholar]
- Reddy ABS, Giridhar S, & Lambert DL 2012, MNRAS, 419, 1350 [Google Scholar]
- Rucinski SM 2002, AJ, 124, 1746 [Google Scholar]
- Sandquist EL, Jessen-Hansen J, Shetrone MD, et al. 2016, ApJ, 831, 11 [Google Scholar]
- Sharma S, Stello D, Bland-Hawthorn J, et al. 2016, ApJ, 822, 15 [Google Scholar]
- Skrutskie MF, Cutri RM, Stiening R, et al. 2006, AJ, 131, 1163 [Google Scholar]
- Soubiran C, Cantat-Gaudin T, Romero-Gómez M, et al. 2018, A&A, 619, A155 [Google Scholar]
- Stellingwerf RF 1979, ApJ, 227, 935 [Google Scholar]
- Stello D, Cantiello M, Fuller J, et al. 2016a, Natur, 529, 364. [DOI] [PubMed] [Google Scholar]
- Stello D, Chaplin WJ, Basu S, et al. 2009, MNRAS, 400, L80 [Google Scholar]
- Stello D, Huber D, Bedding TR, et al. 2013, ApJL, 765, L41 [Google Scholar]
- Stello D, Huber D, Sharma S, et al. 2015, ApJL, 809, L3 [Google Scholar]
- Stello D, Vanderburg A, Casagrande L, et al. 2016b, ApJ, 832, 133 [Google Scholar]
- Sun W, de Grijs R, Deng L, et al. 2019, ApJ, 876, 113 [Google Scholar]
- Sweigart AV, Greggio L, & Renzini A 1990, ApJ, 364, 527 [Google Scholar]
- Taylor BJ 2006, AJ, 132, 2453 [Google Scholar]
- Taylor BJ 2007, AJ, 134, 934 [Google Scholar]
- Twarog BA, Anthony-Twarog BJ, & McClure RD 1993, PASP, 105, 78 [Google Scholar]
- Vanderburg A, & Johnson JA 2014, PASP, 126, 948 [Google Scholar]
- Vanderburg A, Latham DW, Buchhave LA, et al. 2016, ApJS, 222, 14 [Google Scholar]
- Wright EL, Eisenhardt PRM, Mainzer AK, et al. 2010, AJ, 140, 1868 [Google Scholar]
- York DG, Adelman J, Anderson JE Jr., et al. 2000, AJ, 120, 1579 [Google Scholar]
- Yu J, Huber D, Bedding TR, et al. 2018, ApJS, 236, 42 [Google Scholar]
- Ziaali E, Bedding TR, Murphy SJ, et al. 2019, MNRAS, 486, 4348 [Google Scholar]