Abstract
Interferometry is an optical technique that have been used to quantify the lipid layer of the precorneal tear film, and to investigate the relationship between lipid layer thickness and tear film evaporation. However, the relationship between lipid layer thickness and the rate of evaporation is far from consistent. One possible reason is the inherent limit of contemporary interferometric systems, which employ objectives with relatively long depth of focus (DOF) (>15 μm or more), which tend to collect excessive extra-planar noise. This limitation may negatively affect the accuracy of the characterization and thickness measurement of the lipid layer. The current system incorporated an objective with limited DOF (~1.5 μm) into a custom-built optical microscope to image the tear film lipid layer in humans. An algorithm was also developed to process these images. One major outcome of this system is that thick lipid layers exhibit higher variation in thickness values than thin or normal-thickness lipid layers. The variations may reflect the structural differences of the lipid layer, which may offer a novel dimension to explain the missing correlation between lipid layer thickness and evaporation. In summary, the development of the high resolution microscopy system and associated data processing algorithm may provide new insights into the lipid layer structure, topography and their relation to the tear film evaporation rate.
Keywords: interferometry, lipid layer thickness, tear film, dry eye
1. Introduction
The precorneal tear film (PCTF) contributes to the health and function of the cornea and conjunctiva by protecting and lubricating the ocular surface [1]. The outermost layer of the PCTF consists of a layer composed of lipids [2] and functions to stabilize the spread of the tear film and reduce its evaporative loss from the ocular surface. The lipid layer also prevents aqueous tear overflow onto the lids [2-5]. Ever since Doane described the first dynamic “thickness dependent” interferometry system in 1989 to measure the thickness of the PCTF lipid layer in-vivo [6], several related instruments have been developed and purposed for clinical use [7-10]. By analyzing the interference patterns arising from the air-lipid and lipid-aqueous interfaces of the tear film, the lipid layer thickness (LLT) can be quantified by applying principles of thin film interferometry. In the past 20 years, several studies have applied this optical technique to investigate the relationship between LLT and dry eye disease and meibomian gland dysfunction (MGD) [8, 10-12].
Many contemporary interferometric systems employ objectives characterized by long depth of focus (DOF) (>15 μm) [9-11, 13]. Since the lipid layer of the tear film is typically less than 100 nm thick (approx. 40–60 nm) [1], these objectives tend to collect excessive extra-planar noise, which reduces the accuracy and reliability of the measurement of the LLT. Although this drawback is well-recognized, several remedies have been proposed or investigated [13-15] but none could fully address this issue. Since high NA objectives have very short DOF, noise originating from outside the imaging plane can be greatly attenuated. It is possible to address this shortcoming by incorporating a high numerical aperture (NA) objective into a microscopy system to measure the human LLT in vivo. In our previous study, we reported the development of a high-resolution optical microscope with a high-NA objective, however the algorithm to quantify lipid layer thickness was based on analyzing the absolute reflectance intensity [16]. Absolute reflectance can be confounded by multiple factors such as eye motion, off-axis imaging, surface convexity, roughness, and distortion [16, 17]. To reduce some of these factors, the thickness quantification in this study was conducted based on reflected spectral profiles, which avoids confounding factors such as surface distortion, roughness, and convexity.
2. Description of the technique
2.1. System Design
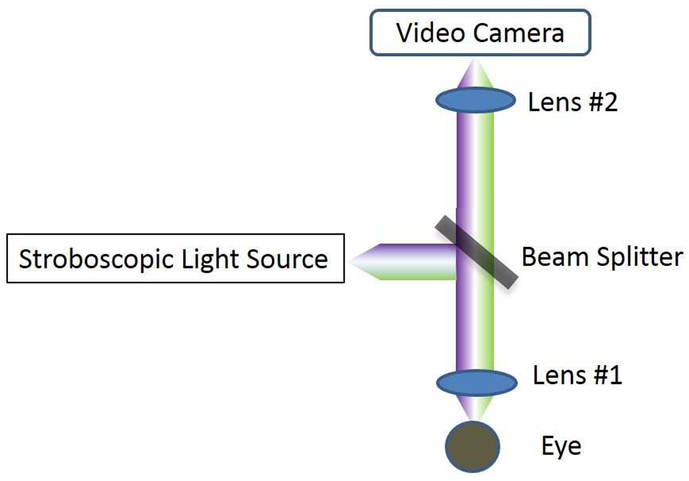
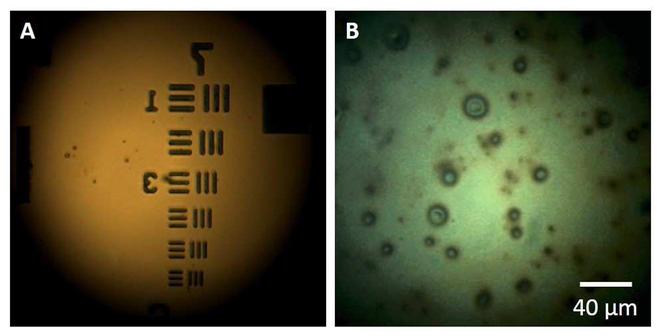
The system is developed based on a high-resolution optical microscope described elsewhere [16, 18]. This system consists of a microscope objective lens with NA of 0.6 and a DOF of ~1.5 μm and working distance of 13 mm (58-373, Edmund Optics, New Jersey). As shown in Figure 1, a white stroboscopic light (X-Strobe 400, Excelitas, Wheeling) serves as the illuminating source. The light has a pulse duration of 100 μs, which serves to reduce movement blur of the lipid layer. Light falling on the central cornea at normal incidence is reflected straight back along its incident path. The reflected signal is focused and used to form an image of the ocular surface via a color video camera (acA645-100gc, Basler, Berlin, Germany). The system has a circular field of view of 240 μm in diameter and a spatial resolution of 0.56 μm. Figure 2A demonstrates the resolution capabilities of the system using a resolution test target (R1DS1P, Thorlabs, New Jersey), and Figure 2B shows a representative image of the tear film lipid layer in vivo captured with this system. The head of each subject was positioned on a chin and head rest. After the lipid layer image was focused in the display, the subject was instructed to gently blink once and to keep their eyes open until they were instructed to close them. The operator used the foot pedal to start video data acquisition over a course of 15 seconds. After the recording, images that were in focus collected between 4.5 s to 5.0 s after blinking were selected for analysis.
Figure 1.
The schematic layout of the lipid layer microscope. Light falls on the cornea at normal incidence. The reflected signal forms an image of the ocular surface via a color video camera.
Figure 2.
Representative images captured using the microscope system. A: Image of a resolution test target. The width of the lines within group 7 is 3.91 μm in element 1, 3.38 μm in element 2, 3.10 μm in element 3, 2.76 μm in element 4, 2.46 μm in element 5, and 2.19 μm in element 6. B: Image of the lipid layer of the tear film in vivo.
2.2. Data processing algorithm
In an RGB camera configuration, each pixel is composed of three color channels – red, green, and blue (IR, IG, and IB, respectively). The interference pattern arising from the lipid layer is interpreted through the ratio of the intensities of the three channels. The algorithm described here to quantitatively analyze the lipid layer micrographs was developed from our previous work [7, 9]. Plots of wavelength versus intensity were used to simulate various LLT values based on the principles of thin film interferometry [7]. The measured ratios for IR, IG, and IB were fitted to those from the simulations to calculate the thickness. Using this algorithm, the thickness value for each pixel from an entire image can be calculated. To eliminate the spectral distortions arising from the biases of the optical components of the system, a BK7 crown glass plate was imaged as a reflectance standard to calibrate the optical system prior to analysis.
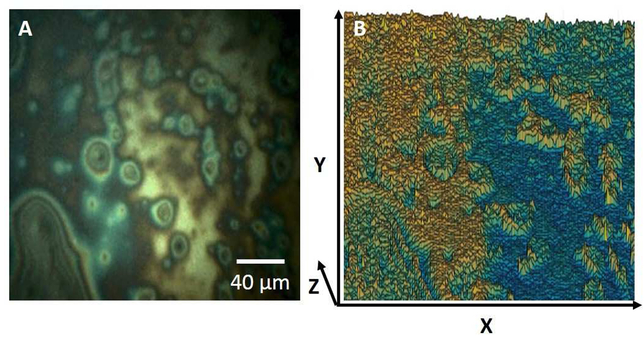
In Figure 3, a lipid layer image (Figure 3A) is processed and the spatial visualization of the LLT distribution is displayed as a 3D plot (Figure 3B) using MATLAB (MathWorks, Natick, Massachusetts) where the X-Y plane is the pixel distribution of the lipid layer plane, and the Z axis is the thickness value for each pixel. The thickness value of each pixel within the images were arbitrarily categorized as thin (<40 nm), normal (41-70 nm), or thick (>70 nm) [10-12]. Each image was expressed as a percentage composition of those three thickness categories, and the overall lipid layer thickness classification (thin, normal, thick) is determined based on the most dominant composition. The data processing algorithm and the qualitative classification system was applied to the set of lipid layer images.
Figure 3.
Quantitative processing of a lipid layer image to show physical thickness distribution. A: Representative image of the lipid layer from the system. B: Visualization of the spatial distribution of the LLT using a 3D plot.
3. Outcome data
For the development of the algorithm, images were randomly selected from 16 subjects who were enrolled in an overarching clinical study investigating the role of (O-acyl)-ω-hydroxy fatty acids (OAHFAs) in MGD (Principal Investigator: JJ Nichols; NIH/NEI R01EY026947). The study adhered to the principles of the Declaration of Helsinki and ethics approval was obtained by the Institutional Review Board at the University of Alabama at Birmingham. Informed consent was obtained from all subjects before any procedures were conducted.
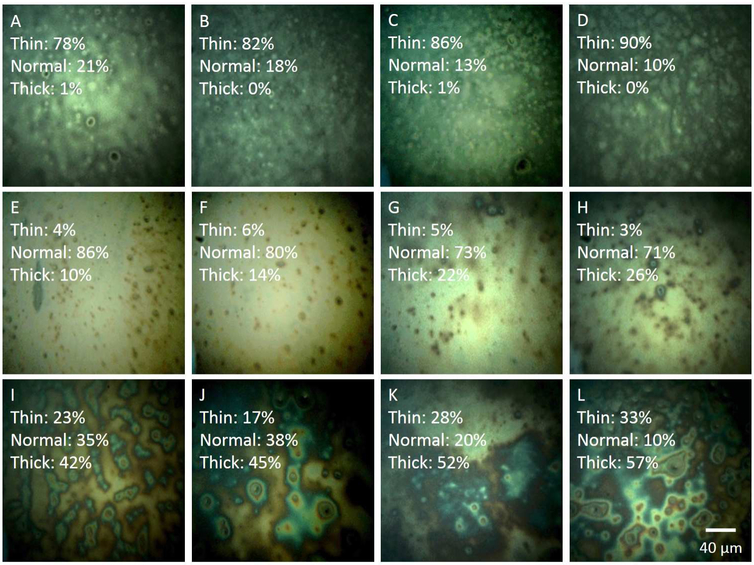
In Figure 4, the upper left corner of each image displays the percentage of pixels falling into the thin (<40 nm), normal (41-70 nm), and thick categories (>70 nm). In Figures 4A-4D, the images exhibit a thin LLT, with the majority of pixels (A: 78%, B: 82%, C: 86%, and D: 90%) falling into the thin category. Figures 4E-4H display the composition of a normal LLT, with the majority of pixels (E: 86%, F: 80%, G: 73%, and H: 71%) falling into the normal thickness range. The remaining four images, Figures 4I-4L exhibit a thick LLT, with the majority of pixels falling into the thick category (I: 42%, J: 45%, K: 52%, and L: 57%). Table 1 summarizes the average LLT from each image from Figures 4A-L
Figure 4.
A-L: Lipid layer images quantified using the algorithm. At the upper left corner of each image, the percentages of pixels falling into the thin, normal, and thick ranges are displayed. A-D, images of thin lipid layers. E-H, images of lipid layers with normal thickness. I-L, images of thick lipid layers.
Table 1.
The mean lipid layer thickness and their variations of three different types of lipid layer images, thin, normal and thick.
| Type | Mean Lipid layer Thickness (nm) | Standard Deviation in Lipid layer Thickness (nm) |
|---|---|---|
| Thin | 36.9 | 13.3 |
| 35.4 | 11.5 | |
| 34.5 | 11.5 | |
| 33.0 | 9.1 | |
| Normal | 61.8 | 11.1 |
| 62.4 | 13.2 | |
| 72.4 | 12.7 | |
| 75.5 | 11.7 | |
| Thick | 69.2 | 23.1 |
| 72.2 | 21.1 | |
| 72.4 | 30.5 | |
| 72.9 | 32.3 |
The variability of LLT does not appear to be dependent on mean LLT. The LLT variation in “thin” and “normal” lipid layers are similar (ranges from 9.1 nm to 13.3 nm), while the variations in “thick” lipid layers are almost double (ranges from 21.1 nm to 32.3 nm) that of “thin” and “normal” lipid layers. Moreover, while the average LLT values are similar between “normal” and “thick” lipid layers, they differ widely in terms of thickness composition and distribution as shown in images in Figure 4. Based on their different thickness compositions, it is possible that the physical properties could vary between these lipid layer categories.
It was thought that a greater LLT enhances evaporative barrier function, however it has been found that tear films with thick LLTs can still evaporate quickly [9, 19]. A reason proposed was that evaporative barrier function may not only depend on mean LLT, but also on structural and biochemical composition [20-22]. Consider two different lipid layers with similar mean thickness, one with low variable thickness and another with high variable thickness. The lipid layer with low variability will have a relatively uniform thickness throughout, and the one with high variability will have regions that are either very thick or very thin. In the latter case, the regions of low thickness may contribute to tear film instability and cause the lipid layer to collapse, causing the tear film to be prone to evaporation. This suggests that LLT variability, as a novel dimension, may explain the some of the variability between LLT and tear film evaporation rate. The algorithm in this system was able to quantify these structural variations, which allows for future studies to test this hypothesis.
Some additional structural features of each lipid category have been noted. The “thin” LLT images are characterized by an appearance of scattered round white and dark spots (2-5 μm in diameter) as shown in Figures 4A-4D. The lattice-like appearance in Figure 4D may be due to the corneal epithelium, which is visible due to a thin lipid layer [23]. In this case, light reflected from the underlying tissues may account for a proportion of the total detected signal. In the “normal” LLT images (Figures 4E-4H), small circular particles (2-10 μm in diameter) presumed to be lipid droplet structures can be observed. They may be undissolved or concentrated lipid droplets floating over the lipid film. The near-white background in “normal” LLT images is diminished compared to “thick” LLTs as displayed in Figure 4I-4L. Within these thick LLT images, a greater number of circular or irregular objects (2-30 μm in diameter) are present, and interference fringes may be visible around some of the larger objects.
4. Conclusion
The high resolution microscopy system and associated data processing algorithm was shown to be capable of imaging and characterizing the thickness of the PCTF lipid layer in human subjects. This algorithm uses an approach to analyze the physical distribution of the LLT within the micrograph and categorizes the thickness value of each pixel. Further development of the system may provide new insight into the lipid layer structure, topography and their relation to the tear film evaporation rate.
Footnotes
Disclosure/Conflicts of Interest
This work was partially funded by NIH/NEI R01EY026947 (Principal Investigator: JJ Nichols). The authors report no conflicts of interest. The authors alone are responsible for the content and writing of the paper.
Publisher's Disclaimer: This is a PDF file of an unedited manuscript that has been accepted for publication. As a service to our customers we are providing this early version of the manuscript. The manuscript will undergo copyediting, typesetting, and review of the resulting proof before it is published in its final citable form. Please note that during the production process errors may be discovered which could affect the content, and all legal disclaimers that apply to the journal pertain.
6 References
- 1.Bai Y and Nichols JJ. Advances in thickness measurements and dynamic visualization of the tear film using non-invasive optical approaches. Progress in Retinal and Eye Research. 2017; 58(Supplement C): 28–44. [DOI] [PubMed] [Google Scholar]
- 2.Craig JP and Tomlinson A. Importance of the lipid layer in human tear film stability and evaporation. Optometry & Vision Science. 1997; 74(1): 8–13. [DOI] [PubMed] [Google Scholar]
- 3.Mudgil P Antimicrobial role of human meibomian lipids at the ocular surface. Investigative ophthalmology & visual science. 2014; 55(11): 7272–77. [DOI] [PubMed] [Google Scholar]
- 4.Tomlinson A, Trees GR, and Occhipinti JR. Tear production and evaporation in the normal eye. Ophthalmic and Physiological Optics. 1991; 11(1): 44–47. [PubMed] [Google Scholar]
- 5.Tsubota K and Yamada M. Tear evaporation from the ocular surface. Investigative Ophthalmology & Visual Science. 1992; 33(10): 2942–50. [PubMed] [Google Scholar]
- 6.Doane MG An instrument for in vivo tear film interferometry. Optometry & Vision Science. 1989; 66(6): 383–88. [DOI] [PubMed] [Google Scholar]
- 7.King-Smith PE, Fink BA, and Fogt N. Three Interferometric Methods for Measuring the Thickness of Layers of the Tear Film. Optometry & Vision Science. 1999; 76(1): 19–32. [DOI] [PubMed] [Google Scholar]
- 8.Tomlinson A and Khanal S. Assessment of tear film dynamics: quantification approach. The ocular surface. 2005; 3(2): 81–95. [DOI] [PubMed] [Google Scholar]
- 9.King-Smith PE, Hinel EA, and Nichols JJ. Application of a novel interferometric method to investigate the relation between lipid layer thickness and tear film thinning. Investigative ophthalmology & visual science. 2010; 51(5): 2418–23. [DOI] [PMC free article] [PubMed] [Google Scholar]
- 10.Yokoi N and Komuro A. Non-invasive methods of assessing the tear film. Experimental eye research. 2004; 78(3): 399–407. [DOI] [PubMed] [Google Scholar]
- 11.Yokoi N, Takehisa Y, and Kinoshita S. Correlation of Tear Lipid Layer Interference Patterns With the Diagnosis and Severity of Dry Eye. American Journal of Ophthalmology. 1996; 122(6): 818–24. [DOI] [PubMed] [Google Scholar]
- 12.Korb DR, et al. Tear film lipid layer thickness as a function of blinking. Cornea. 1994; 13(4): 354–59. [DOI] [PubMed] [Google Scholar]
- 13.Hwang H, et al. Image-based quantitative analysis of tear film lipid layer thickness for meibomian gland evaluation. BioMedical Engineering OnLine. 2017; 16(1): 135. [DOI] [PMC free article] [PubMed] [Google Scholar]
- 14.Khamene A, Negahdaripour S, and Tseng SC. A spectral-discrimination method for tear-film lipid-layer thickness estimation from fringe pattern images. IEEE Transactions on Biomedical Engineering. 2000; 47(2): 249–58. [DOI] [PubMed] [Google Scholar]
- 15.Doane MG and Lee ME. Tear film interferometry as a diagnostic tool for evaluating normal and dry-eye tear film, in Lacrimal Gland, Tear Film, and Dry Eye Syndromes 2. Springer; 1998; 297–303. [DOI] [PubMed] [Google Scholar]
- 16.King-Smith PE, et al. High Resolution Microscopy of the Lipid Layer of the Tear Film. The Ocular Surface. 2011; 9(4): 197–211. [DOI] [PMC free article] [PubMed] [Google Scholar]
- 17.King-Smith PE, Kimball SH, and Nichols JJ. Tear Film Interferometry and Corneal Surface Roughness. Investigative ophthalmology & visual science. 2014; 55(4): 2614–18. [DOI] [PMC free article] [PubMed] [Google Scholar]
- 18.King-Smith PE, Begley CG, and Braun RJ. Mechanisms, imaging and structure of tear film breakup. The Ocular Surface. 2018; 16(1): 4–30. [DOI] [PMC free article] [PubMed] [Google Scholar]
- 19.Craig JP and Tomlinson A. Importance of the lipid layer in human tear film stability and evaporation. Optometry and Vision Science. 1997; 74(1): 8–13. [DOI] [PubMed] [Google Scholar]
- 20.Butovich IA, Wojtowicz JC, and Molai M. Human tear film and meibum. Very long chain wax esters and (O-acyl)-omega-hydroxy fatty acids of meibum. Journal of Lipid Research. 2009; 50(12): 2471–85. [DOI] [PMC free article] [PubMed] [Google Scholar]
- 21.Millar TJ and Schuett BS. The real reason for having a meibomian lipid layer covering the outer surface of the tear film – A review. Experimental Eye Research. 2015; 137: 125–38. [DOI] [PubMed] [Google Scholar]
- 22.Schuett BS and Millar TJ. An investigation of the likely role of (O-acyl) ω-hydroxy fatty acids in meibomian lipid films using (O-oleyl) ω-hydroxy palmitic acid as a model. Experimental Eye Research. 2013; 115: 57–64. [DOI] [PubMed] [Google Scholar]
- 23.Langmuir I Oil lenses on water and the nature of monomolecular expanded films. The Journal of Chemical Physics. 1933; 1(11): 756–76. [Google Scholar]


