

Abstract
Obesity and diabetes are associated with macrophage dysfunction and increased NLRP3 inflammasome activation. Saturated fatty acids (FAs) are abundant in these metabolic disorders and have been associated with lysosome dysfunction and inflammasome activation in macrophages. However, the interplay between cellular metabolic pathways and lipid-induced toxicity in macrophages remains poorly understood. In this study, we investigated the role of the lipid metabolic enzyme long chain acyl-CoA synthetase (ACSL1) in primary macrophages. ACSL1 is upregulated in TLR4-activated macrophages via a TIR (toll/IL-1R) domain-containing adapter inducing IFN-β (TRIF)-dependent pathway, and knockout of this enzyme decreased NLRP3 inflammasome activation. The mechanism of this response was not related to inflammasome priming, lipid uptake, or endoplasmic reticulum (ER) stress generation. Rather, ACSL1 was associated with mitochondria where it modulated fatty acid metabolism. The development of lysosome damage with palmitate exposure likely occurs via the formation of intracellular crystals. Herein, we provide evidence that loss of ACSL1 in macrophages decreases FA crystal formation thereby reducing lysosome damage and IL-1β release. These findings suggest that targeting lipid metabolic pathways in macrophages may be a strategy to reduce lipotoxity and to decrease pathologic inflammation in metabolic disease.
Keywords: diabetes, inflammation, metabolism, monocyte/macrophage
1 |. INTRODUCTION
Growing evidence argues that macrophage inflammasome activation plays an important role in the pathogenesis of diabetes complications. In both preclinical and clinical studies, therapeutics that target the NLRP3 inflammasome and/or neutralize its primary product, IL-1β, have been associated with improved wound healing, reduced atherosclerosis, and decreased severity of heart failure.1–7 We, and others, have demonstrated that excess fatty acids (FAs) can trigger inflammasome activation in macrophages in the setting of obesity and diabetes, the so-called lipotoxic inflammasome.8–12 However, the molecular pathways that influence how FAs produce toxicity in macrophages and lead to this inflammatory response are not well understood.
The NLRP3 inflammasome is a multimeric protein complex that assembles on membranes in the transGolgi network in response to diverse pathologic stimuli.13 Activation of the canonical inflammasome requires 2 distinct signals. Signal 1 is a priming signal that utilizes NF-κB to turn on transcription of IL-1β and NLRP3. Signal 2 is required for processing of pro-IL-1β and typically occurs in response to an intracellular stress such as mitochondrial reactive oxygen species (ROS)/DNA release, lysosome damage, or outward potassium flux. The inflammasome complex requires a NOD-like receptor (such as NLRP3), apoptosis associated spectral like protein (ASC), and caspase 1. Once activated, caspase 1 cleaves pro-IL-1β leading to the release of the mature and biologically active cytokine.
TLR activation of macrophages in the setting of excess FAs increases ceramide production, elicits endoplasmic reticulum (ER) stress and triggers lysosome damage/dysfunction all of which have been implicated in lipotoxic inflammasome activation.14–17 Interestingly, lysosome damage occurs independently of ceramide generation and ER stress and ultimately triggers caspase independent macrophage cell death.15 The development of lysosome damage in response to LPS and saturated fatty acids (SFAs) requires the TLR4 adaptor protein TRIF, but not the canonical downstream signaling mediators interferon regulatory factor 3 (IRF3) or type 1 interferon. Although it has recently been demonstrated that SFAs trigger lysosome damage in macrophages via the formation of intracellular crystals, the mechanism by which TRIF signaling influences lipid handling and lysosome damage is not known.12
Acyl-CoA synthetase 1 (ACSL1) is a member of a family of enzymes that esterify free FAs to allow for their use in downstream lipid metabolic pathways in cells including FA oxidation (FAO), triglyceride synthesis, and phospholipid/sphingolipid production.18 In cardiomyocyte and adipocyte loss-of-function models, ACLS1 appears to play a role in generating FA-CoA destined for the mitochondria.19,20 Interestingly, in macrophages, ACSL1 is induced by TLR4 activation via a TRIF-dependent pathway that is independent of the IFN-induced transcription factor STAT1.21 Moreover, loss of ACSL1 from myeloid cells led to a reduction in diabetic atherosclerosis in a mouse model, suggesting that this enzyme may play a role in macrophage lipotoxicity.22
In the current study, we aimed to address the role of ACSL1 in the inflammasome response of macrophages challenged with SFAs and LPS. Given the proposed function of ACSL1 to alter intracellular FA channeling, we hypothesized that induction of ACSL1 by TLR4/TRIF could be a key mechanism that directs the fate of internalized FAs and the development of lysosome damage and inflammasome activation. To this end, we demonstrate that ACLS1 is indeed a TRIF-dependent, IFN-independent gene target downstream of TLR4. Moreover, using macrophages derived from myeloid specific- ACSL1KO mice, we demonstrate that loss of this enzyme reduces lysosome damage and inflammasome activation in response to excess lipids.
2 |. EXPERIMENTAL SECTION
2.1 |. Reagents
Etomoxir, α-tubulin antibody (T9026;1:1000), α-actin antibody (A2066; 1:2500), Galectin 8 antibody (G5671; 1:100), nile red, and oil red O (oil red O) were from Sigma Chemical (St. Louis, MO, USA). Caspase 1-FLICA was from Immunocytochemistry Technologies. Triacsin C was from Enzo life sciences (Farmingdale, New York, USA). IL-1β, (#12426; 1:500) NLRP3 (#131585; 1:1000), and voltage-dependent anion channel (VDAC) (#4866; 1:500) antibodies were from Cell Signaling (Danvers, MA, USA). Alum, BODIPY 493/503, and Mitosox were from Thermofisher (Waltham, MA, USA). Duoset ELISA kits (IL-1β and TNF-α) were from R&D Systems (Minneapolis, MN, USA). Ultrapure E. coli LPS was from Invivogen. Lysotracker red and BODIPY-palmitate were from Life Technologies (Carlsbad, CA, USA). The interferon alpha and beta receptor subunit 1 (IFNAR) blocking antibody (I-400; MAR1–5AE) and control IgG were from Leinco Technologies (Fenton, MO, USA) and were used a concentration of 10 μg/ml. Thioglycollate was from Difco-BD (Franklin Lakes, NJ, USA). AnnexinV-GFP was from BioVision (San Francisco, CA, USA). Ultrapure LPS and nigericin were from Invivogen (San Diego, CA, USA). FAs were from Nu-Chek Prep (Waterville, MN, USA). Ultrapure-bovine serum albumin (BSA) was from Lampire (Pipersville, PA, USA) and was tested for TLR ligand contamination prior to use by treating primary macrophages and assaying for TNF-α release. The mouse ACSL1 antibody was a gift from Dr. Jean Schafer.
2.2 |. Mice
LysM-Cre × ACSL1 flox/flox mice were obtained from Karin Born-feldt (University of Washington). To generate mice with 2 copies of LysM-Cre and floxed ACSL1 alleles that could produce littermate controls, we rederived the ACSL1 flx/flx mice such that male and female breeder mice each contained 2 copies of LysM-Cre and were heterozygous for the ACSL1 flx allele. Wild-type (WT) mice from this breeding pair were those that contained LysM-Cre only and knockout (KO) were those mice containing LysM-Cre with ACSL1 flx/flx (mACSKO). Importantly, LysM-Cre had similar lysosome, cell death, and inflammasome phenotypes to C57BL/6 mice without LysM-cre. TRIF KO mice were obtained from Oriental Biosciences and were used with C57BL/6 controls obtained from the same vendor. All the animals used in these studies were bred in house. Macrophages were isolated from both male and female mice between the ages of 8–12 weeks. Mice were maintained in a pathogen free facility on a standard chow diet ad libitum (6% fat). All animal experiments were conducted in strict accordance with NIH guidelines for humane treatment of animals and were reviewed by the Animal Studies Committee of Washington University School of Medicine.
2.3 |. Cell culture
Peritoneal macrophages were isolated from C57BL/6, or the indicated knockout mice 4 days after intraperitoneal injection of 1 ml, 3.85% thioglycollate and plated at a density of 1 × 10⁶ cells/ml in DMEM containing 10% inactivated fetal serum (IFS), 50 U/ml penicillin G sodium, and 50U/ml streptomycin sulfate (pen-strep). Stimulations were performed on the day after harvest. For flow cytometry experiments, peritoneal cells were cultured on low adherence plates (Greiner Bio-One) to facilitate cell harvest. Cells were removed from low adherence plates by washing with PBS followed by 10 min with Cell Stripper (Gibco) and then 10 min with EDTA/trypsin (Sigma). Growth medium was supplemented with palmitate or stearate complexed to BSA at a 2:1 molar ratio as described previously, and BSA-supplemented media was used as control.23 For cell stimulations, PBS or LPS (100 ng/ml) were added to media containing BSA or BSA-free FA complexes. HepG 2 cells were obtained from ATCC and cultured in DMEM + 10% serum.
2.4 |. RNA isolation and quantitative RT-PCR
Total cellular RNA was isolated using Qiagen RNeasy columns and reverse transcribed using a high capacity cDNA reverse transcription kit (Applied Biosystems). Real-time qRT-PCR was performed using SYBR green reagent (Applied Biosystems) on an ABI 7500 fast thermo-cycler. Relative gene expression was determined using the delta-delta CT method normalized to 36B4 expression. Mouse primer sequences were as follows (all 5’−3’): 36B4 (forward-ATC CCT GAC GCA CCG CCG TGA, reverse-TGC ATC TGC TTG GAG CCC ACG TT); TNF-α (forward-CAT CTT CTC AAA ATT CGA GTG ACA A, reverse-TGG GAG TAG ACA CAA GGT ACA ACC C); IL-1β (forward-AAG GAG AAC CAA GCA ACG ACA AAA, reverse-TGG GGA ACT CTG CAG ACT CAA ACT); NLRP3 (forward-AAA ATG CCT TGG GAG ACT CA, reverse-AAG TAA GGC CGG AAT TCA CC); ACSL1 (forward-ACC ATC AGT GGT ACC CGC TA, reverse-CGC TCA CCA CCT TCT GGT AT); ISG15 (forward-AGC GGA ACA AGT CAC GAA GAC, reverse-TGG GGC TTT AGG CCA TAC TC); GRP78 (forward-GCC TCA TCG GAC GCA CTT, reverse-AAC CAC CTT GAA TGG CAA GAA); CHOP (forward-CAG ATT CCA GTC AGA GTT CTA TGG, reverse-GAC CAC TCT GTT TCC GTT TCC T).
2.5 |. XBP1 splicing
RNA was reverse transcribed and subjected to PCR with the following primers (forward-ACACGCTTGGGAATGGACAC reverse-CCATGGGAAGATGTTCTGGG) and subjected to PCR amplication (94° × 5 min and then 30 cycles of 94° × 20 s; 56° × 20 s; 72° × 90 s, followed by 72° × 7 min). The PCR products were separated by electrophoresis through a 2.5% agarose gel at 100 V × 45 min. The full-length XBP1 product is 171 bp, and the spliced product is 145 bp.
2.6 |. Western blotting
Total cellular protein was isolated by lysing cells in 150 mM NaCl, 10 mM Tris (pH 8), triton X-100 1%, and 1× protease complete and phosphatase inhibitors (Thermo-Fisher Scientific). Subsequently, 25 μg of protein from each sample was separated on a TGX gradient gel (4–20%; Biorad) and transferred to a nitrocellulose membrane. For blots of pro-IL-1β and NLRP3, the transfer was for 24 h on ice.
2.7 |. Mitochondrial fractionation protocol
Cytosolic and mitochondrial cellular fractionation was performed using a kit from BioVision (K256–25) according to the manufacturer’s instructions.
2.8 |. Caspase 1-FLICA flow cytometry
After the indicated stimulations, pMACs were removed from low adherence plates as described above. The caspase 1 FLICA reagent was reconstituted per manufacturer’s instructions and diluted in DMEM + 10% FCS. Macrophages were incubated in 200 μl of staining solution for 45 min at 37°C with gentle mixing every 10 min. After the incubation, cells were washed 2 times in 1 ml of FACS buffer and analyzed by flow cytometry.
2.9 |. Lysosome imaging
After the indicated stimulations, cells were stained with 500 nM lysotracker red in tissue culture media for 15 min at 37°C. After staining, cells were washed 3 times with PBS, harvested as described above and analyzed by flow cytometry.
2.10 |. Assessment of cell death
Annexin-PI staining.
Cells were stimulated as indicated recovered by trypsinization and stained with AnnexinV-GFP and propidium iodide according to manufacturer’s instructions (BioVision). To capture all of the dead cells, media containing floating cells from before typsinization was combined with the trypsinized media prior to pelleting the cells for staining. Samples were analyzed for green (FL1) and red (FL2) fluorescence on a Becton Dickinson FACaliber flow cytometer with analysis of 104 cells/sample. For this assay, ANX+PI− (apoptotic) and ANX+PI+ (necrotic) cells are both reported as dead cells. Data analysis was performed using Flow Jo software (Tree Star, Inc.).
2.11 |. BODIPY-palmitate uptake assay
Macrophages were grown on low adherence plates. BODIPY-palmitate was prepared at 1 mg ml (1000× stock) in DMSO and diluted to 1× IN PBS + 0.1% BSA. Cells were incubated with 100 μl of FA solution for 60 s at 37°C. After incubation, the cells were washed in 500 μM phloretin in PBS + 0.1% BSA. The cells were then removed from the plate and analyzed by flow cytometry (FL1).
2.12 |. ELISA for IL-1β and TNF-α
Supernatants were harvested from macrophage cultures after the indicated stimulations. IL-1β and TNF-α were quantified using a DuoSet ELISA kit (R&D systems) according to the manufacturer’s instructions.
2.13 |. Metabolism assays
Cells were plated into 96 well Seahorse plates at density of 75,000 cells/well and stimulated as indicated in the text. After stimulation, the cells were washed and placed in XF media (nonbuffered RPMI 1640 containing, 25 mM glucose, 2 mM L-glutamine, and 1 mM sodium pyruvate) with 10% FCS. Oxygen consumption rates (OCR) and extracellular acidification rates were measured under basal conditions and following the addition the following drugs: oligomycin, 1.5 μM flurorcarbonyl cynade phenylhydrazon, 50 μM etomoxir, and 100 nM rotenone + 1 μM antimycin A (all Sigma). Measurements were taken using a 96-well extracellular flux analyzer (Seahorse Bioscience; North Bellerica, MA, USA).
2.14 |. Oil red O, BODIPY, and nile red staining
Macrophages were plated into cover slips in 12 well plates at a density of 5 × 10⁶ cells/ml. After the indicated stimulations, cells were washed and fixed with 10% formalin at room temperature for 15 min. For BODIPY and Nile red, staining cells were incubated with 1:1000 dilution of a 1 mg/ml stock prepared in DMEM with no serum and incubated for 15 min at 37°. Following the incubation, the cells were washed 3 times with PBS, counterstained with DAPI and mounted on slides. For ORO staining, the fixed cells were washed 3 times in ddH20. A stock solution of (ORO) was prepared with 0.5 g/100 ml of isopropanol. To make a fresh working solution, the stock was diluted 6:4 with ddH20, incubated at room temperature for 10 min, and then placed through a 0.2 micron filter. Cells were stained with the working solution for 20 min at room temperature. Following the staining period, cells with washed with 50% isopropanol solution and mounted on slides. Cells were imaged using a Zeiss confocal microscope. To quantify ORO signal, the cells were treated with 250 μl of 4% NP40 in isopropanol for 15 min at room temperature. The lysate was then diluted, and the absorbance at 540 nm was measured using a Biorad plate reader.
2.15 |. C16 ceramide and acylcarnitine quantification
Macrophages were removed from the dish by scraping in PBS and homogenized by passing through 26 G needle 15 times. The lipids were extracted by incubating 50 μl of cell lysate with 450 μl of methanol with the addition of 50 ng C17 ceramide as a recovery standard. LC-MS/MS analysis was performed as described24 on an API4000 LC-MS/MS. Values were normalized to DNA concentration in the lysate as determined using a Nanodrop spectrophotometer.
2.16 |. Statistics
Statistical analysis was performed using GraphPad Prism software. All results are expressed as means ± SE. Groups were compared by paired Student’s t-test or 2-way ANOVA as appropriate. A value of P ≤ 0.05 was considered significant.
3 |. RESULTS
3.1 |. ACSL1 is required for lipotoxic inflammasome activation
We have previously shown that stimulation of lipid-loaded macrophages with the TLR4 agonist LPS leads to lysosome damage and NLRP3 inflammasome activation.9,16 Under these conditions, lysosome dysfunction occurs through a signaling pathway that requires the TLR4 adaptor TRIF via a mechanism that is independent of type 1 interferon. The lipid metabolic enzyme ACSL1 is a TLR4 target gene in macrophages whose expression has been reported to require the adaptor TRIF.21 Given that this enzyme regulates FA metabolism, we sought to investigate the role of ACLS1 in lipotoxic inflammasome activation in macrophages. First, we analyzed protein and mRNA expression of ACSL1 in WT and TRIF KO macrophages stimulated with LPS or palmitate with LPS. As expected, we confirmed that ACLS1 protein and mRNA expression is induced by LPS through a mechanism that requires the TLR4 adaptor TRIF (Fig. 1A and B). To address the role of TRIF-induced IFN signaling in the induction of ACSL1, we assessed the ACSL1 mRNA levels in macrophages incubated with an isotype control or type 1 interferon receptor (IFNAR) blocking antibody. LPS was required to induce the expression of ACSL1 and inhibition of IFNAR did not reduce the mRNA levels of this metabolic enzyme (Fig. 1C). In contrast, the induction of the interferon target gene ISG15 was suppressed by the IFNAR neutralizing antibody (Fig. 1D). Therefore, similar to the lysosome damage phenotype, ACSL1 is induced in macrophages via a TRIF-dependent, interferon independent pathway.
FIGURE 1. ACSL1 loss of function is associated with impaired IL-1β release in primary macrophages.
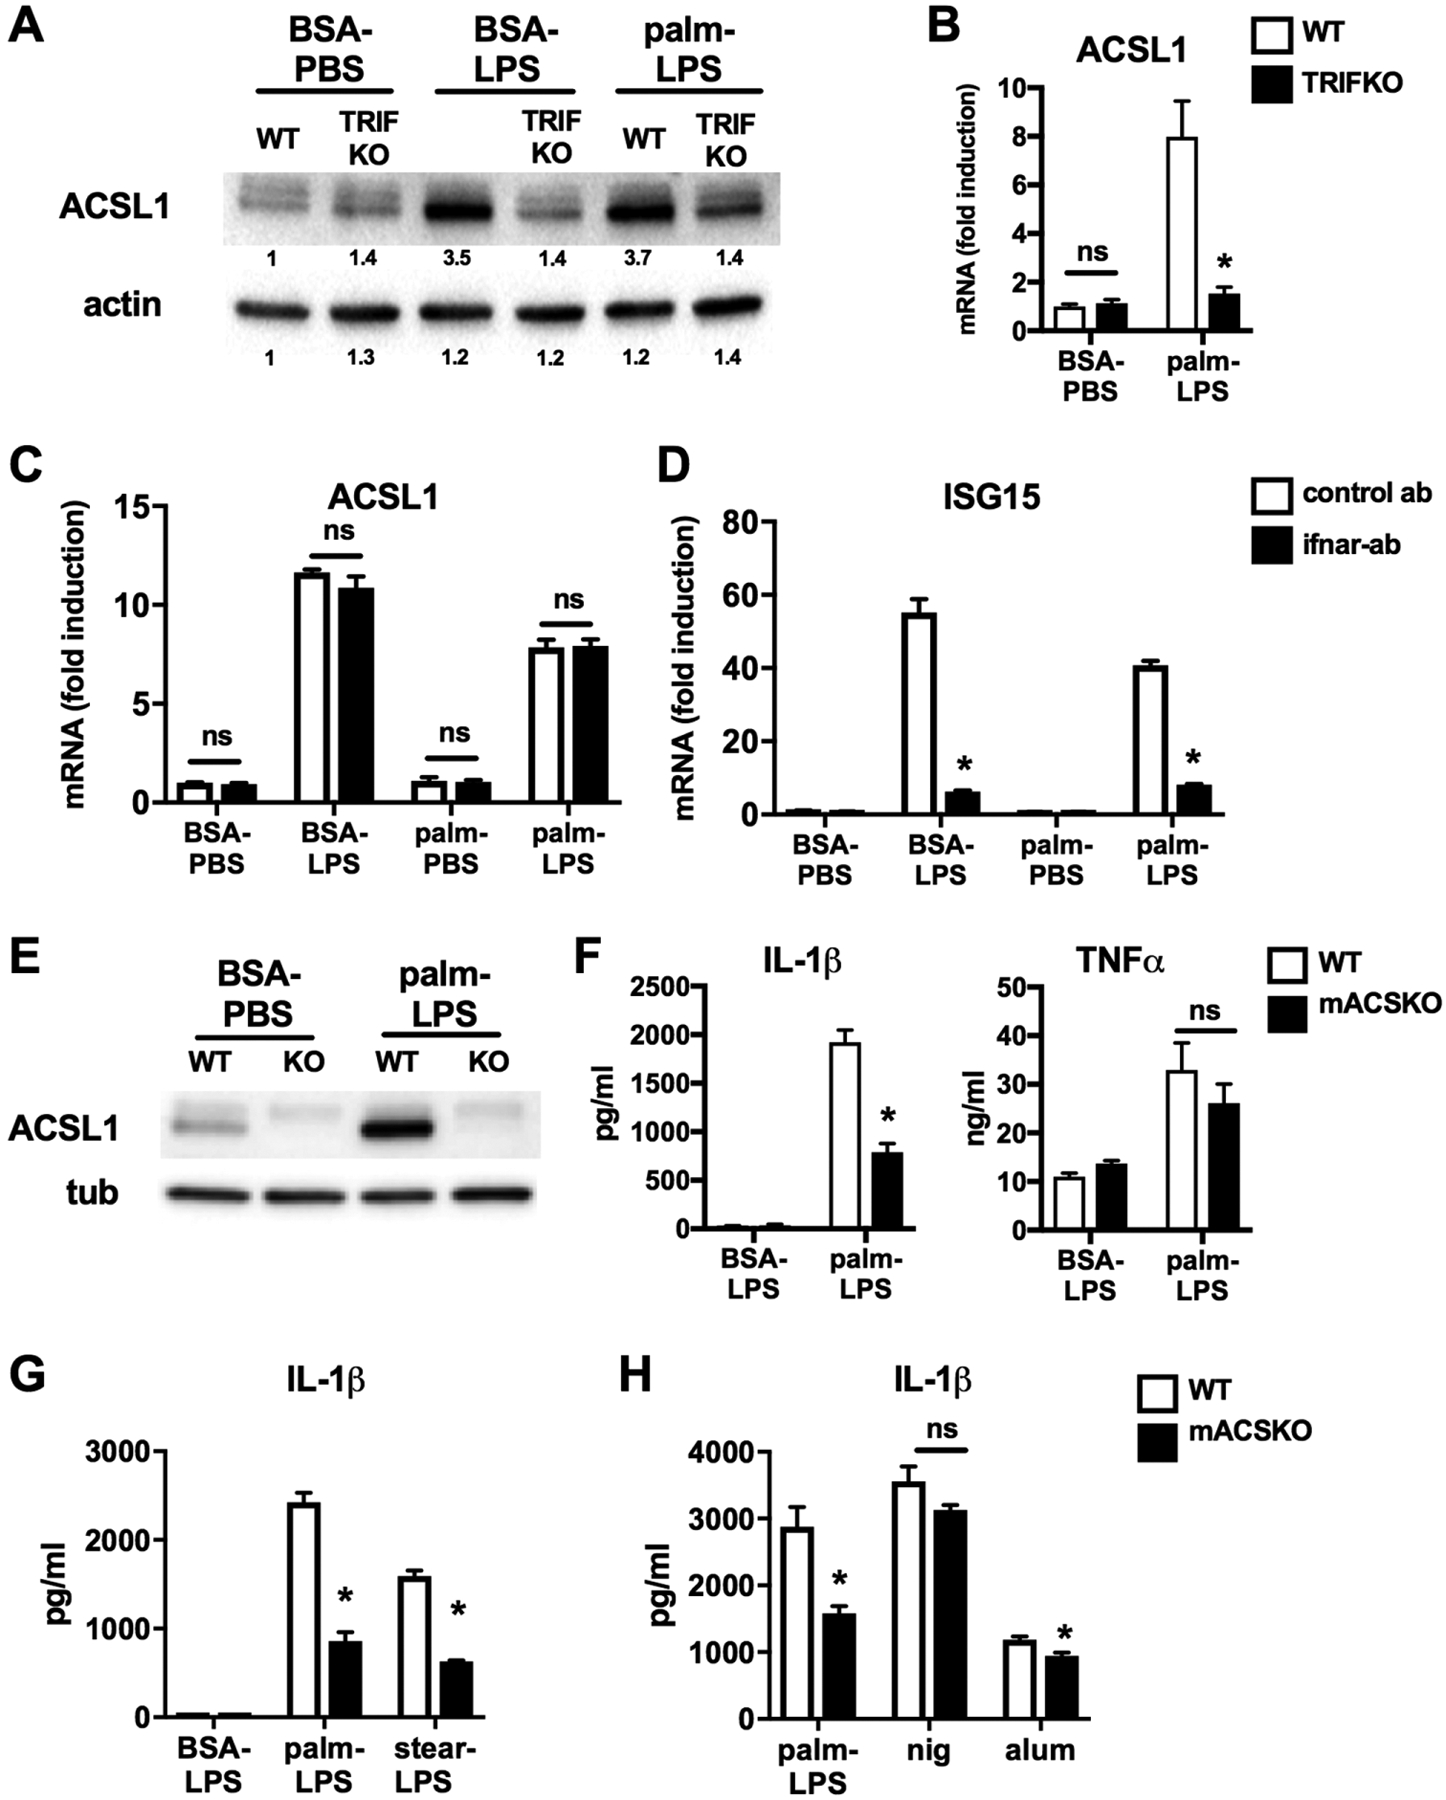
(A, B) Peritoneal macrophages (pMACs) isolated from WT or TRIF KO mice (TRIF) were stimulated as indicated (LPS 100 ng, palmitate – 250 μM) for 16 h. Cell lysates (A) or mRNA (B) were prepared and ACSL1 protein and mRNA expression was assessed by Western blotting (A) and qRT-PCR (B), respectively. The bands are quantified and shown beneath the blot. Actin is shown as a loading control. (C, D) WT pMACs were stimulated as indicated for 16 h in the presence of an IFNAR-antibody (filled bars) or isotype control antibody (open bars). The expression of ACSL1 (C) and ISG15 (D) was quantified qRT-PCR and normalized to 36B4. (E) Protein was isolated from pMACs isolated from littermate WT or LysM-Cre X ACSL1flx/flx (KO) mice stimulated with control of palm-LPS for 16 h. ACSL1 protein expression was assessed by Western blotting. (F) WT (open bars) or mACSKO (filled bars) pMACs were treated with control (BSA-LPS) or palm (250 μM)-LPS (100 ng) for 20 h, and the release of IL-1β and TNF-α was determined by ELISA. (G) WT or mACSKO pMACs were treated with palm-LPS or stearate (stear; 150 μM)-LPS for 20 h and IL-1β release was quantified by ELISA. (F) pMACs from WT or mACSKO mice were stimulated with palm-LPS or treated with LPS 500 ng for 2 h followed by nigericin (nig; 1 μM) for 60 min or alum (500 μg/ml) for 6 h. IL-β release was quantified by ELISA. Bar graphs report the mean ± SE for a minimum of 3 experiments, each performed in triplicate. *, P < 0.05 for WT versus TRIFKO or mACSKO or control ab versus IFNAR ab; ns; nonsignificant
To assess the functional role of this enzyme in macrophages, we turned to a model of macrophage specific ACSL1 deficiency. ACSL1 floxed mice were crossed with LysM-Cre mice to generate myeloid ACSL1 knockout animals (mACSKO).22 Macrophages derived from KO mice had no detectable ACSL1 protein at baseline or after LPS activation (Fig. 1E). As shown previously, stimulation of pMACs with palmitate and LPS led to robust production of IL-1β. In contrast, IL-1β release was reduced in macrophages from mACSKO mice (Fig. 1F). The release of TNF-α was similar in both genotypes indicating that KO cells are capable of responding to LPS. We also assessed the impact of ACSL1 loss-of function on the inflammasome response to stearate, another long chain SFA. As seen in Fig. 1G, mACSKO macrophages also release less IL-1β in response to this SFA. In contrast, IL-1β release after stimulation with nonlipid NLRP3 activators such as nigericin and alum was minimally impacted in mACSKO macrophages (Fig. 1H). Thus, ACSL1 is required for maximal activation of the lipotoxic inflammasome.
3.2 |. Loss of ACSL1 does not impact inflammasome priming, but does reduce lysosome damage
To determine whether loss of ACSL1 impacted inflammasome activation via signal 1 or signal 2 of the inflammasome complex, we first assessed expression of pro-IL-1β and NLRP3 in response to activation in WT and KO macrophages. As shown in Fig. 2, pro-IL-1β and NLRP3 induction after activation were similar between WT and mACSKO cells at both the mRNA and protein level. Therefore, ACSL1 is not required for priming of the inflammasome.
FIGURE 2. ACSL1 deficiency does not affect inflammasome priming.
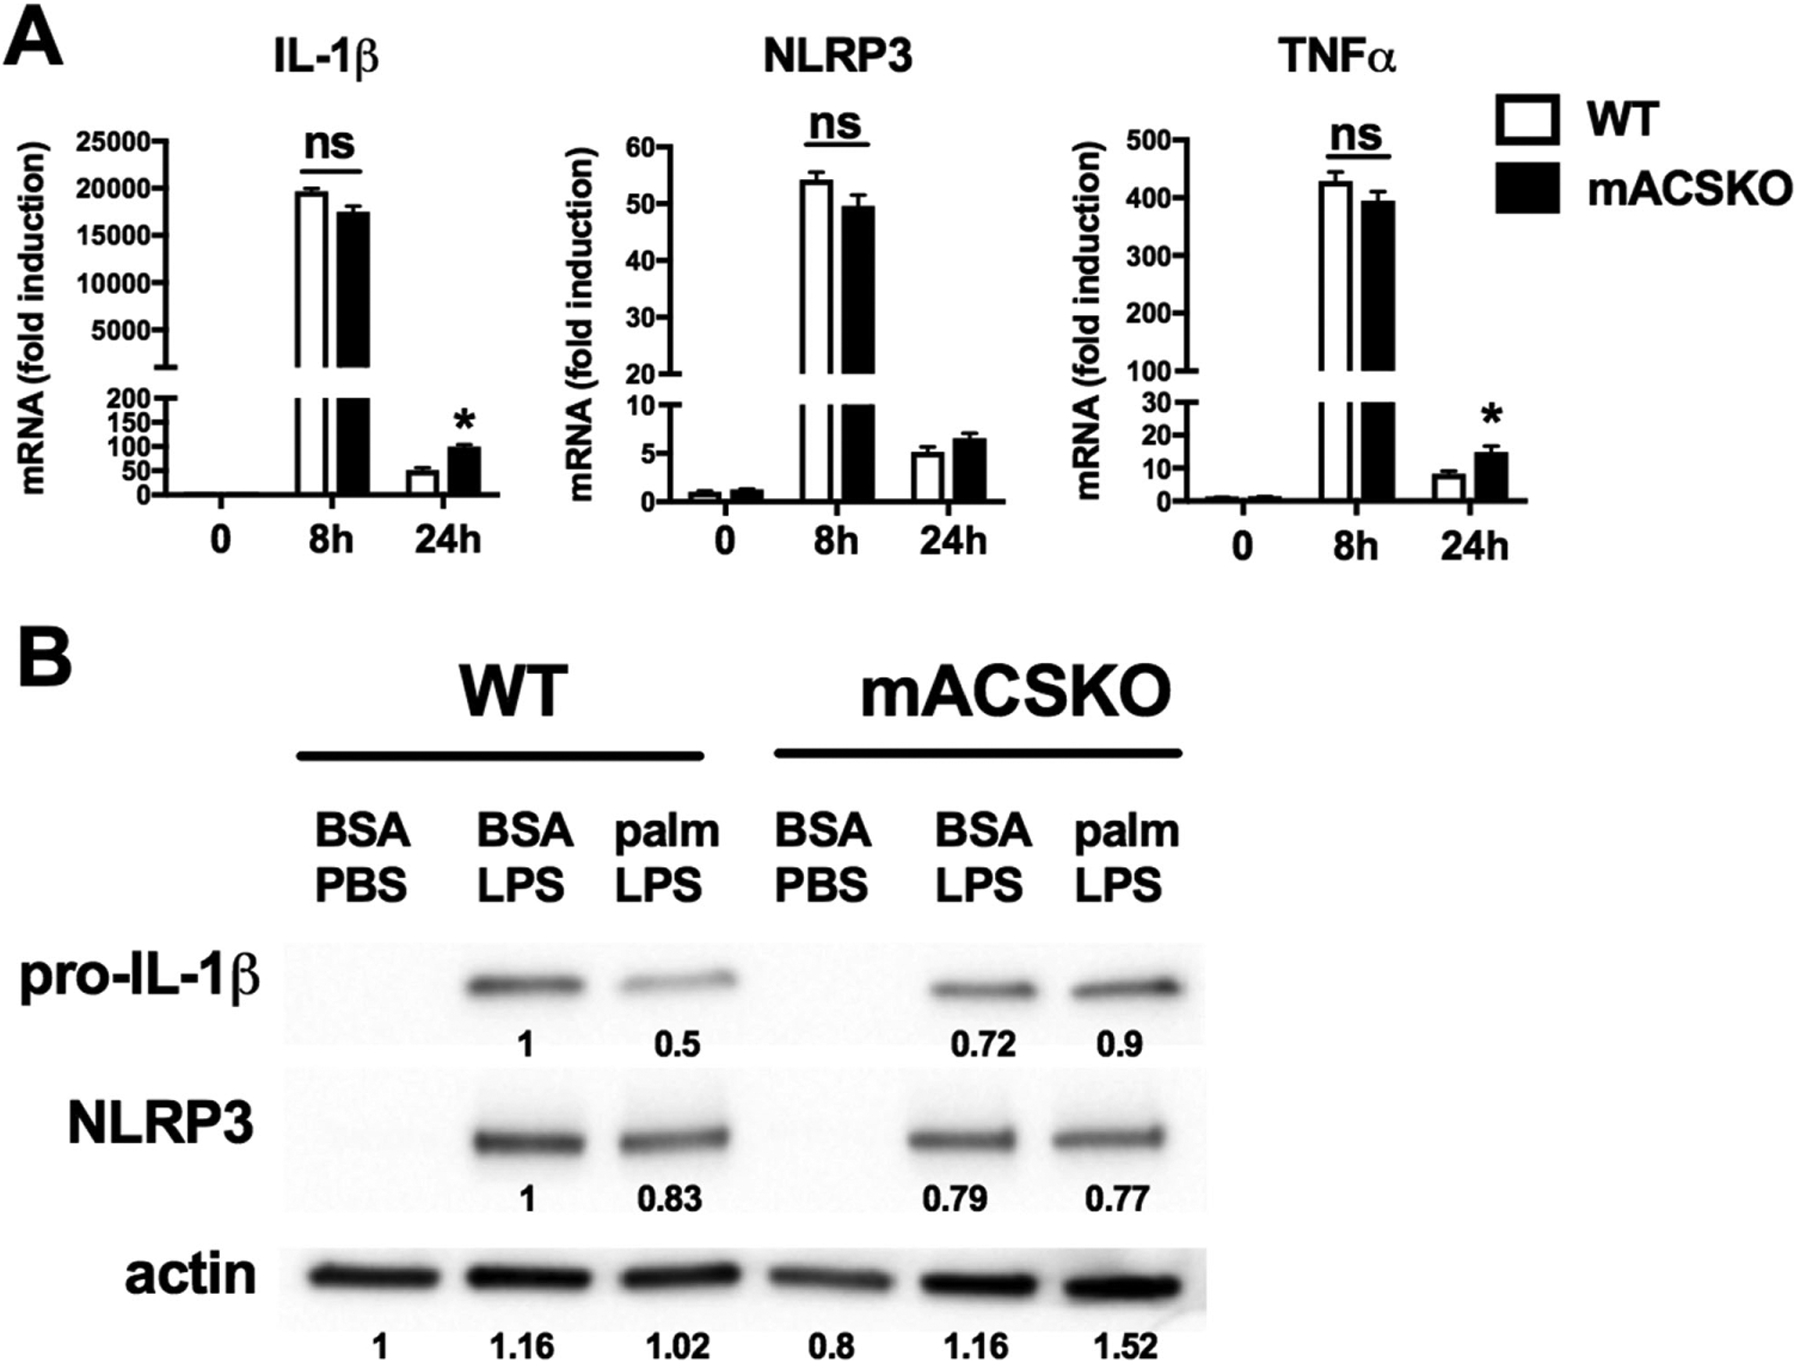
(A) WT or mACSKO macrophages were stimulated with palm-LPS for the indicated time points and the expression of IL-1β, NLRP3, and TNF-α was assessed by qRT-PCR. Gene expression was normalizeded to 36B4. (B) pMACs from WT or mACSKO mice were treated with the indicated stimuli for 16 h, and the protein level of pro-IL-1β and NLRP3 was assessed by Western blotting. Tubulin (tub) is shown as a loading control. Band quantification is shown beneath the blots. Bar graphs report the mean ± SE for a minimum of 3 experiments, each performed in triplicate. *, P < 0.05 for WT versus mACSKO
Lipotoxicity in macrophages has been shown to involve ER stress and lysosome damage and both have been linked to inflammasome activation.16,17 To determine the role of ACSL1 in these responses, we first assessed the ER stress response using well-described markers of this pathway including XBP1 splicing, CHOP expression, and Grp78 expression (Fig. 3A–C). Treatment of pMACs with palm-LPS induced ER stress in both WT and KO cells to a similar extent, indicating that this lipid-stress pathway was not influenced by expression of ACSL1. The development of lysosome damage was also interrogated using lysotracker red staining of activated macrophages. As shown previously, WT cells treated with palm-LPS had an increase in the percentage of lysotracker red low cells; a phenotype previously correlated with the extent of lysosome damage/dysfunction.15 In contrast, macrophages lacking ACSL1 had a reduction in the number cells with lysosome damage (Fig. 3D and E). This was also associated with reduced caspase 1 activation and macrophage cell death (Fig. 3F and G). Importantly, macrophage cell death was minimal at 20 h poststimulation, the time point at which lysosome damage and inflammasome activation were assessed. Thus, loss of ACSL1 attenuates the onset of lysosome damage in response to lipid stress.
FIGURE 3. ACSKO macrophages have reduced lysosome damage in response to FA excess.
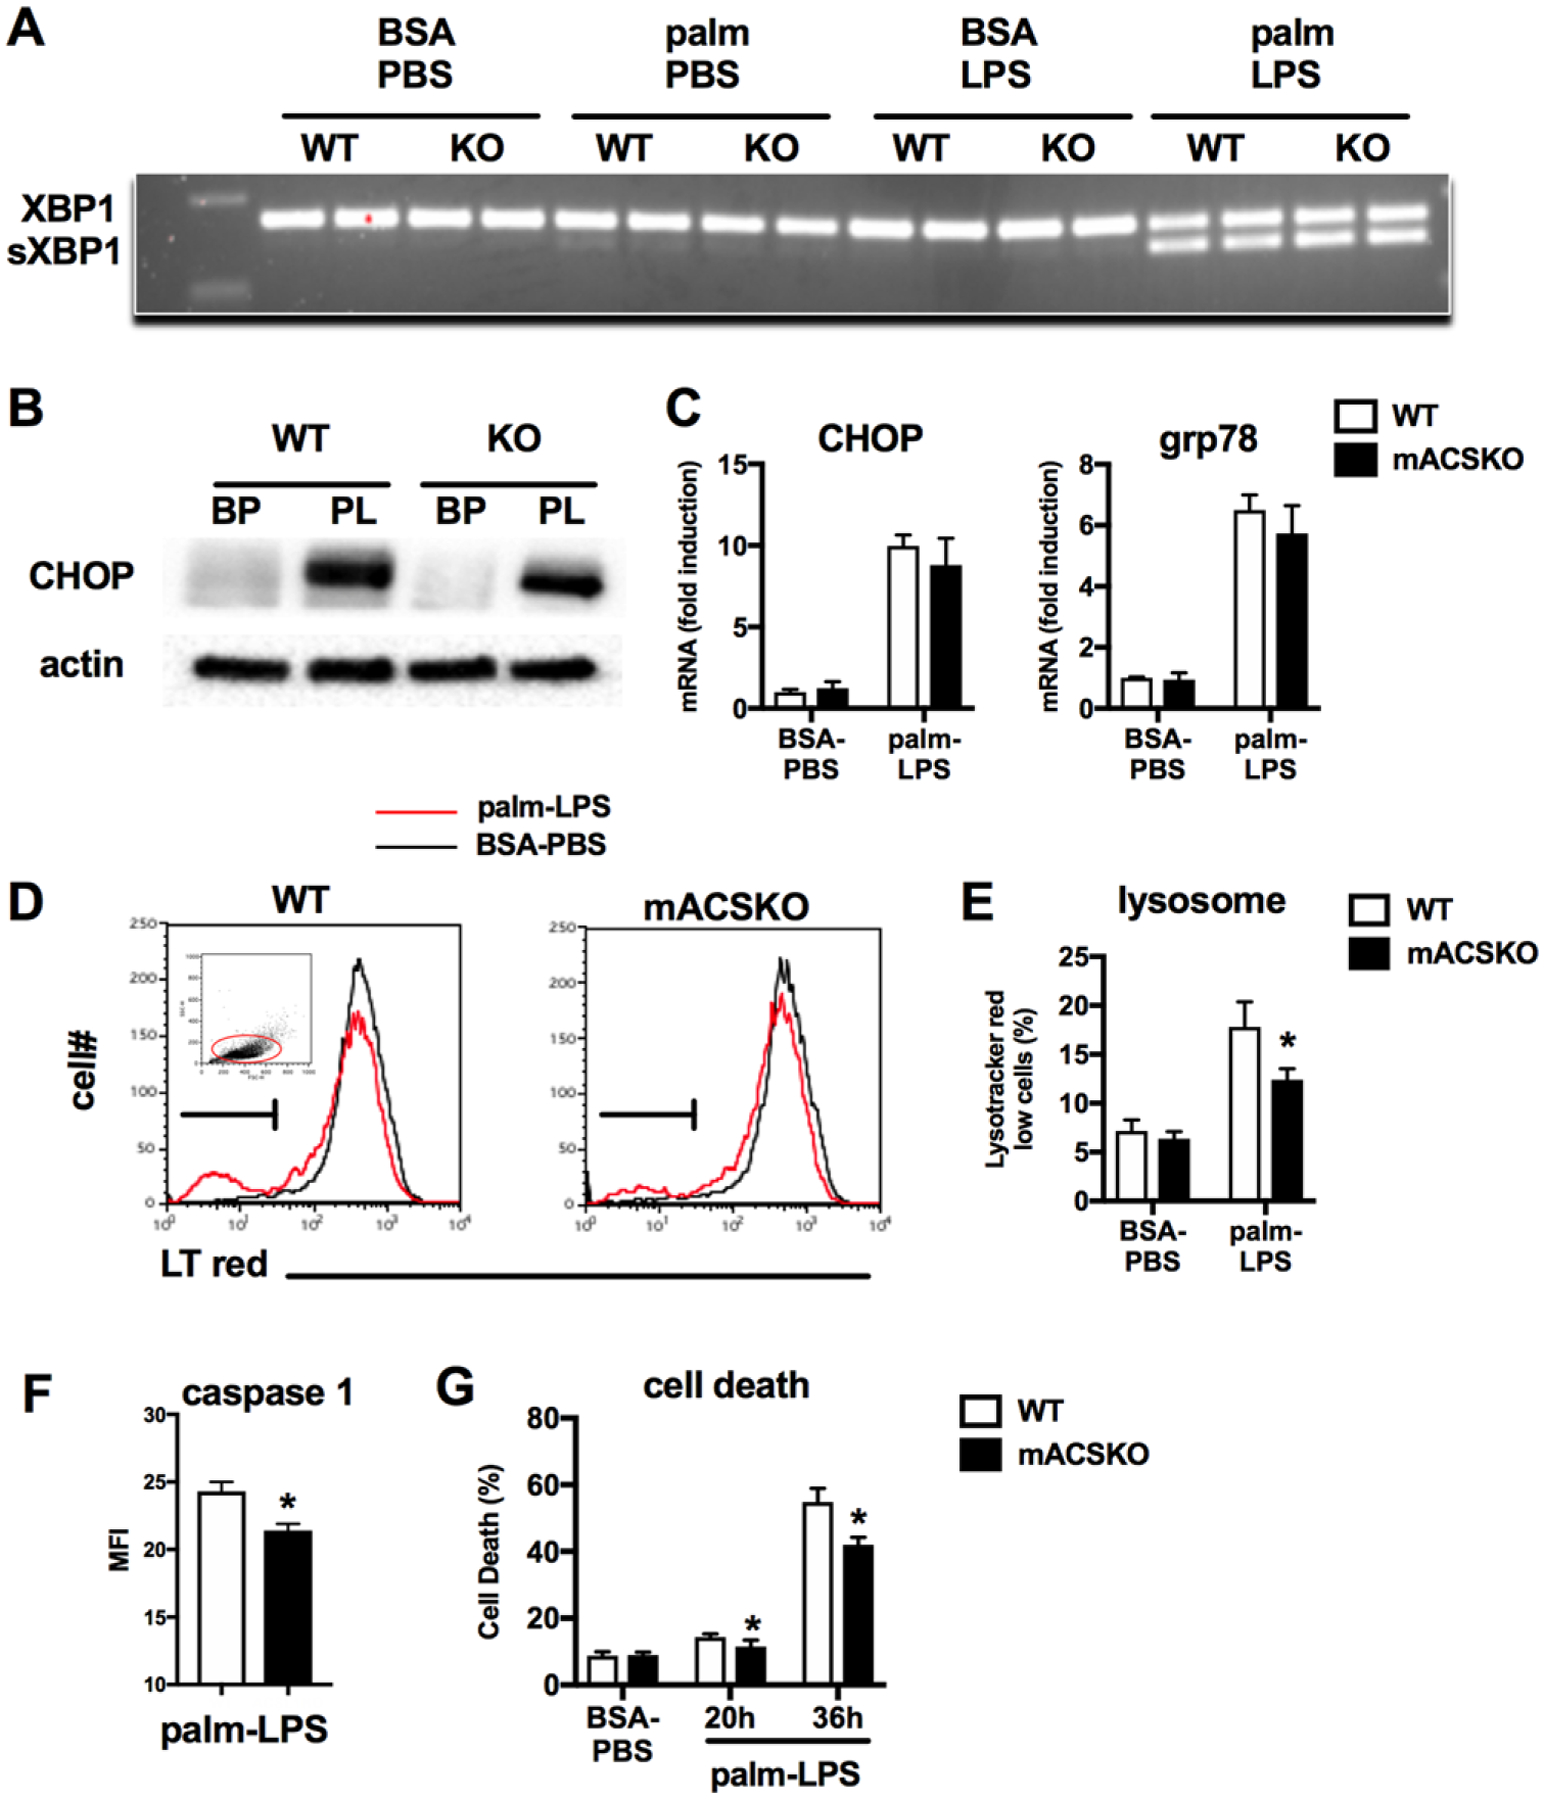
(A) WT or mACSKO pMACs were stimulated as indicated for 16 h after which mRNA was isolated, reverse transcribed, and subjected to PCR for assessment of XBP1 cleavage. (B) pMACs were treated with control of palm-LPS for 16 h, and protein expression of the ER stress response molecule CHOP was assessed by Western blotting. Actin is shown as a loading control. (C) mRNA from WT or mASCKO macrophages was subjected to qRT-PCR for the ER stress target genes CHOP and grp78. (D, E) pMACS were treated with BSA-PBS or palm-LPS for 16 h after which cells were stained with lysotracker red and analyzed by flow cytometry. A representative histogram (D) and triplicate quantification of lysotracker red low cells (E) are shown. The FCS and SSC gating scheme (red gate) for the lysotracker red assessment is shown in the inset. (F) Caspase 1 activity was assessed by staining cells with the caspase-1 FLICA probe followed by quantification by flow cytometry. (G) Macrophage cell death (composite of ANX+, PI-, and ANX+, PI+) was assessed after treatment with palm-LPS for 20 h or 36 h via annexin-PI staining and flow cytometry analysis. Bar graphs report the mean ± SE for a minimum of 3 experiments, each performed in triplicate. *, P < 0.05 for WT versus mACSKO
3.3 |. ACSL1 modulates macrophage FA metabolism
ACSL1 is an enzyme that esterifies FAs with CoA and therefore contributes to “activating” FAs for a variety of downstream cellular pathways including ceramide synthesis, phospholipid generation, FAO, and/or triglyceride synthesis. Moreover, prior studies have suggested that ACSL1 can interact with FA transporters at the cell membrane to facilitate rapid esterification of incoming FAs, thereby trapping them in the cell.25 However, much of this work came from studies where ACSL1 was overexpressed. To address whether differences in lipid uptake could explain the mASCKO phenotype, macrophages were incubated with BODIPY-labeled palmitate and uptake was determined via flow cytometry. The loss of ACSL1 did not affect macrophage FA uptake at baseline or after LPS stimulation (Fig. 4A).
FIGURE 4. ACSL1 regulates macrophage FA metabolism.
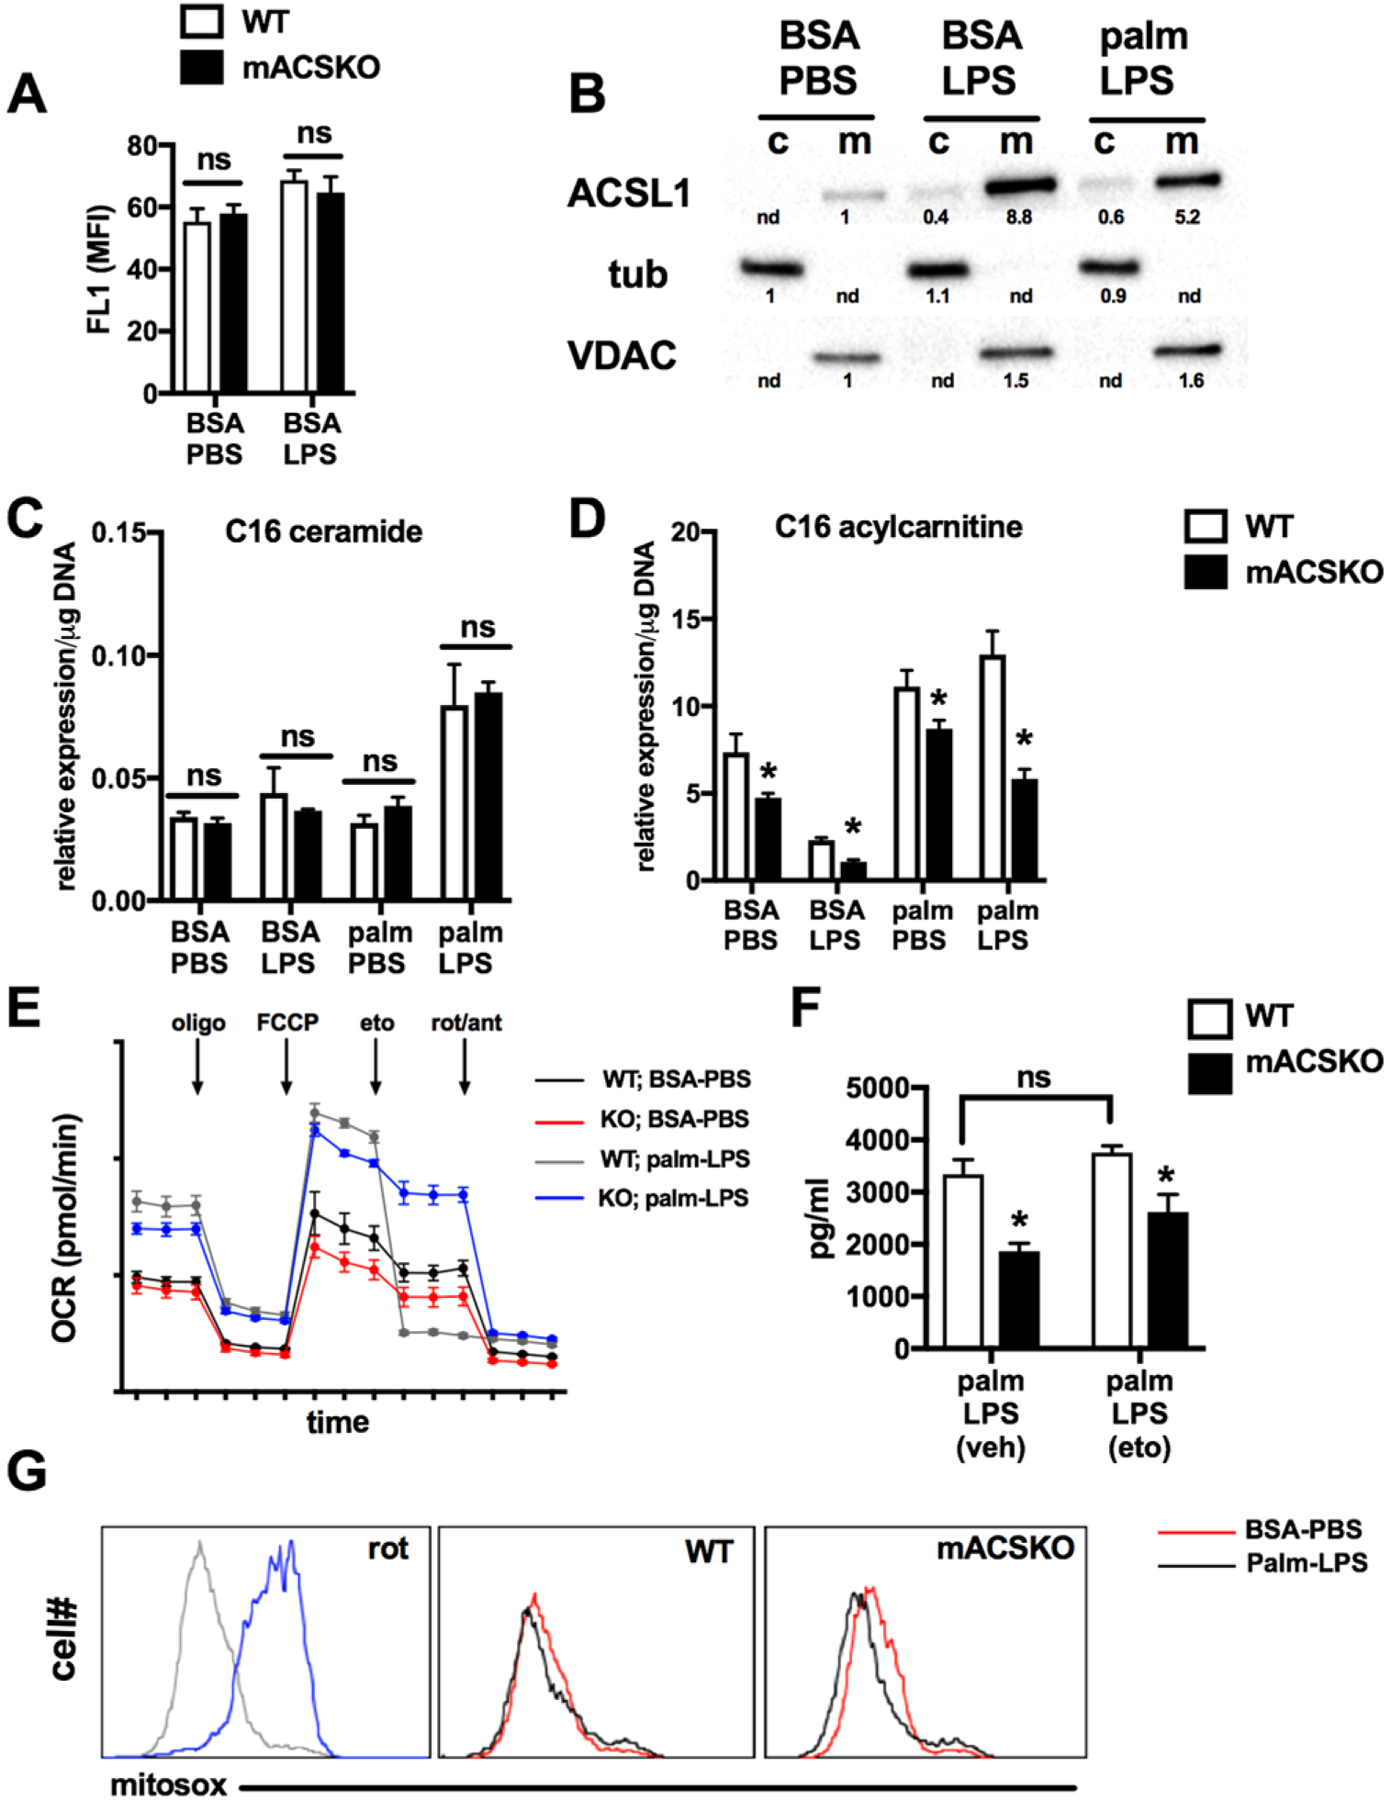
(A) BODIPY-palmitate uptake was quantified by flow cytometry in WT and mACSKO pMACs at baseline and following LPS activation for 16 h. (B) WT pMACS were stimulated as indicated for 16 h after which cells were lysed and partitioned in to cytosolic (c) and mitochondrial (m) fractions. ACSL1 protein expression was assessed by Western blotting. Tubulin and VDAC were used as controls for fraction of cytosolic and mitochondrial compartments, respectively. Band quantification is shown beneath the blots. (C, D) pMACs from WT or mACSKO mice were stimulated as indicated for 16 h after which cells were lysed and C16 ceramide (C) or C16 acylcarnitine (D) were quantified by LC-MS/MS. (E) WT (black, gray lines) or mACSKO (red, blue lines) were treated with PBS (black, red lines) or LPS (gray, blue lines) for 16 h and cellular OCR was assessed using a Seahorse flux analyzer. The arrows indicate drug injections occurring during the run. (F) pMACs were treated with palm-LPS ± 50 μM etomoxir (eto) for 20 h, and IL-1β release was quantified by ELISA. (G) Macrophages from WT and mACSKO mice were stimulated with BSA-PBS (red line) or palm-LPS (black line) for 16 h and mitochondrial ROS was assessed by mitosox staining coupled with flow cytometry. As a control for mitochondrial ROS generation, WT cells were treated with rotenone for 6 h (rot). Representative histograms are displayed. Bar graphs report the mean ± SE for a minimum of 3 experiments, each performed in triplicate. *, P < 0.05 for WT versus mACSKO
In other tissues, ACLS1 has been reported to reside in close proximity to mitochondria where it can esterify and channel FAs toward FAO.26 Using a cellular fractionation approach followed by Western blotting, we determined that ACSL1 also resides in the mitochondrial fraction in macrophages (Fig. 4B). To determine if ACSL1 plays a specific role in targeting FAs toward the mitochondria in macrophages, we compared the lipidomic profiles of ceramides and acylcarnitines in WT and KO pMACs. In response to LPS, ceramides are produced from palmitoyl-CoA in the ER via the de novo synthesis pathway.14 Acylcarnitines, on the other hand, are produced from FA-CoAs at the mitochondrial outer membrane via the enzyme carnitine palmitoyl transferase 1 (CPT1). As anticipated based on our ER stress data, C16 ceramide generation was similar in WT and mACSKO macrophages treated with palmitate, LPS, or both for 16 h (Fig. 4C). In contrast, the production of C16 acylcarnitine from these same cells was significantly decreased in the mACSKO cells under all conditions, but this effect was more pronounced when LPS was present (Fig. 4D).
To further assess the role of ACSL1 on FAO in macrophages, we performed experiments using the seahorse flux to assess mitochondrial respiration. Under basal conditions, mitochondrial OCR was similar between WT and KO cells; however, after LPS treatment mACSKO macrophages had slightly lower levels of basal respiration. In addition, mACSKO cells from both treatment groups also showed slightly reduced maximal OCR. To assess the contribution of FAO to mitochondrial respiration, the CPT1 inhibitor etomoxir was injected during maximal respiration and it nearly completely inhibited respiration in WT cells. In contrast, etomoxir had minimal effect on KO pMACs, suggesting a preference for other substrates (Fig. 4E). Glycolytic flux as estimated by extracellular acidification rate was not different between the genotypes at baseline or after LPS stimulation (data not shown). Together these data argue that one important function of ACSL1 in macrophages is to shuttle FAs to the mitochondria for oxidation.
Based on the role of ACSL1 in macrophage cellular metabolism, we aimed to determine whether alterations in FAO could explain the inflammasome defect in these cells. To perform these experiments, we pretreated macrophages with 50 μM of etomoxir, a dose which decreased C16 acylcarnitine production to a similar degree as ACSL1 deficiency. Surprisingly, etomoxir treatment did not significantly reduce the production of IL-1β from WT macrophages challenged with palm-LPS (Fig. 4F). We also investigated whether ACS might modulate mitochondrial ROS production, which has been linked to inflammasome activation. WT or mACSKO macrophages were activated with vehicle or palm-LPS and mitochondrial ROS was quantified using the mitochondrial localized redox sensitive dye mitosox. Although mitochondrial ROS was induced by rotenone, there were no appreciable differences in ROS levels in macrophages treated with palm-LPS in either WT or mACSKO macrophages (Fig. 4G).
3.4 |. Loss of ACLS alters the efficiency of SFA crystal formation
Recently, it was shown by Karasawa et al. that SFAs can form intracellular crystals in macrophages, and this is an important mechanism of lysosome damage.12 Therefore, we sought to investigate crystal formation in our cells. Interestingly, crystal-like structures could be visualized in pMACs treated with palmitate and LPS and stained with the dye ORO. To better define these intracellular structures, we compared pMACs to oleate-treated hepG2 cells, which are known to form abundant lipid droplets under these conditions. The crystal structures in macrophages that stain with ORO were clearly distinct from neutral lipid droplets in shape and by the fact that did not stain with lipid droplet binding dyes such as BODIPY and nile red (Fig. 5A). To further demonstrate that these structures were indeed crystals, we analyzed stimulated macrophages using polarized light microcopy. In macrophages treated with palmitate and LPS, there were numerous cells containing material with crystalline birefringent properties (Fig. 5B). We also assessed galectin 8 distribution in these cells as it is known to accumulate in damaged lysosomes. Consistent with our prior data, conditions that produced crystal formation also led to an increase in a lysosomal staining pattern of galectin 8, (Fig. 5C).
FIGURE 5. Intracellular crystal formation is induced by saturated FA treatment in macrophages.
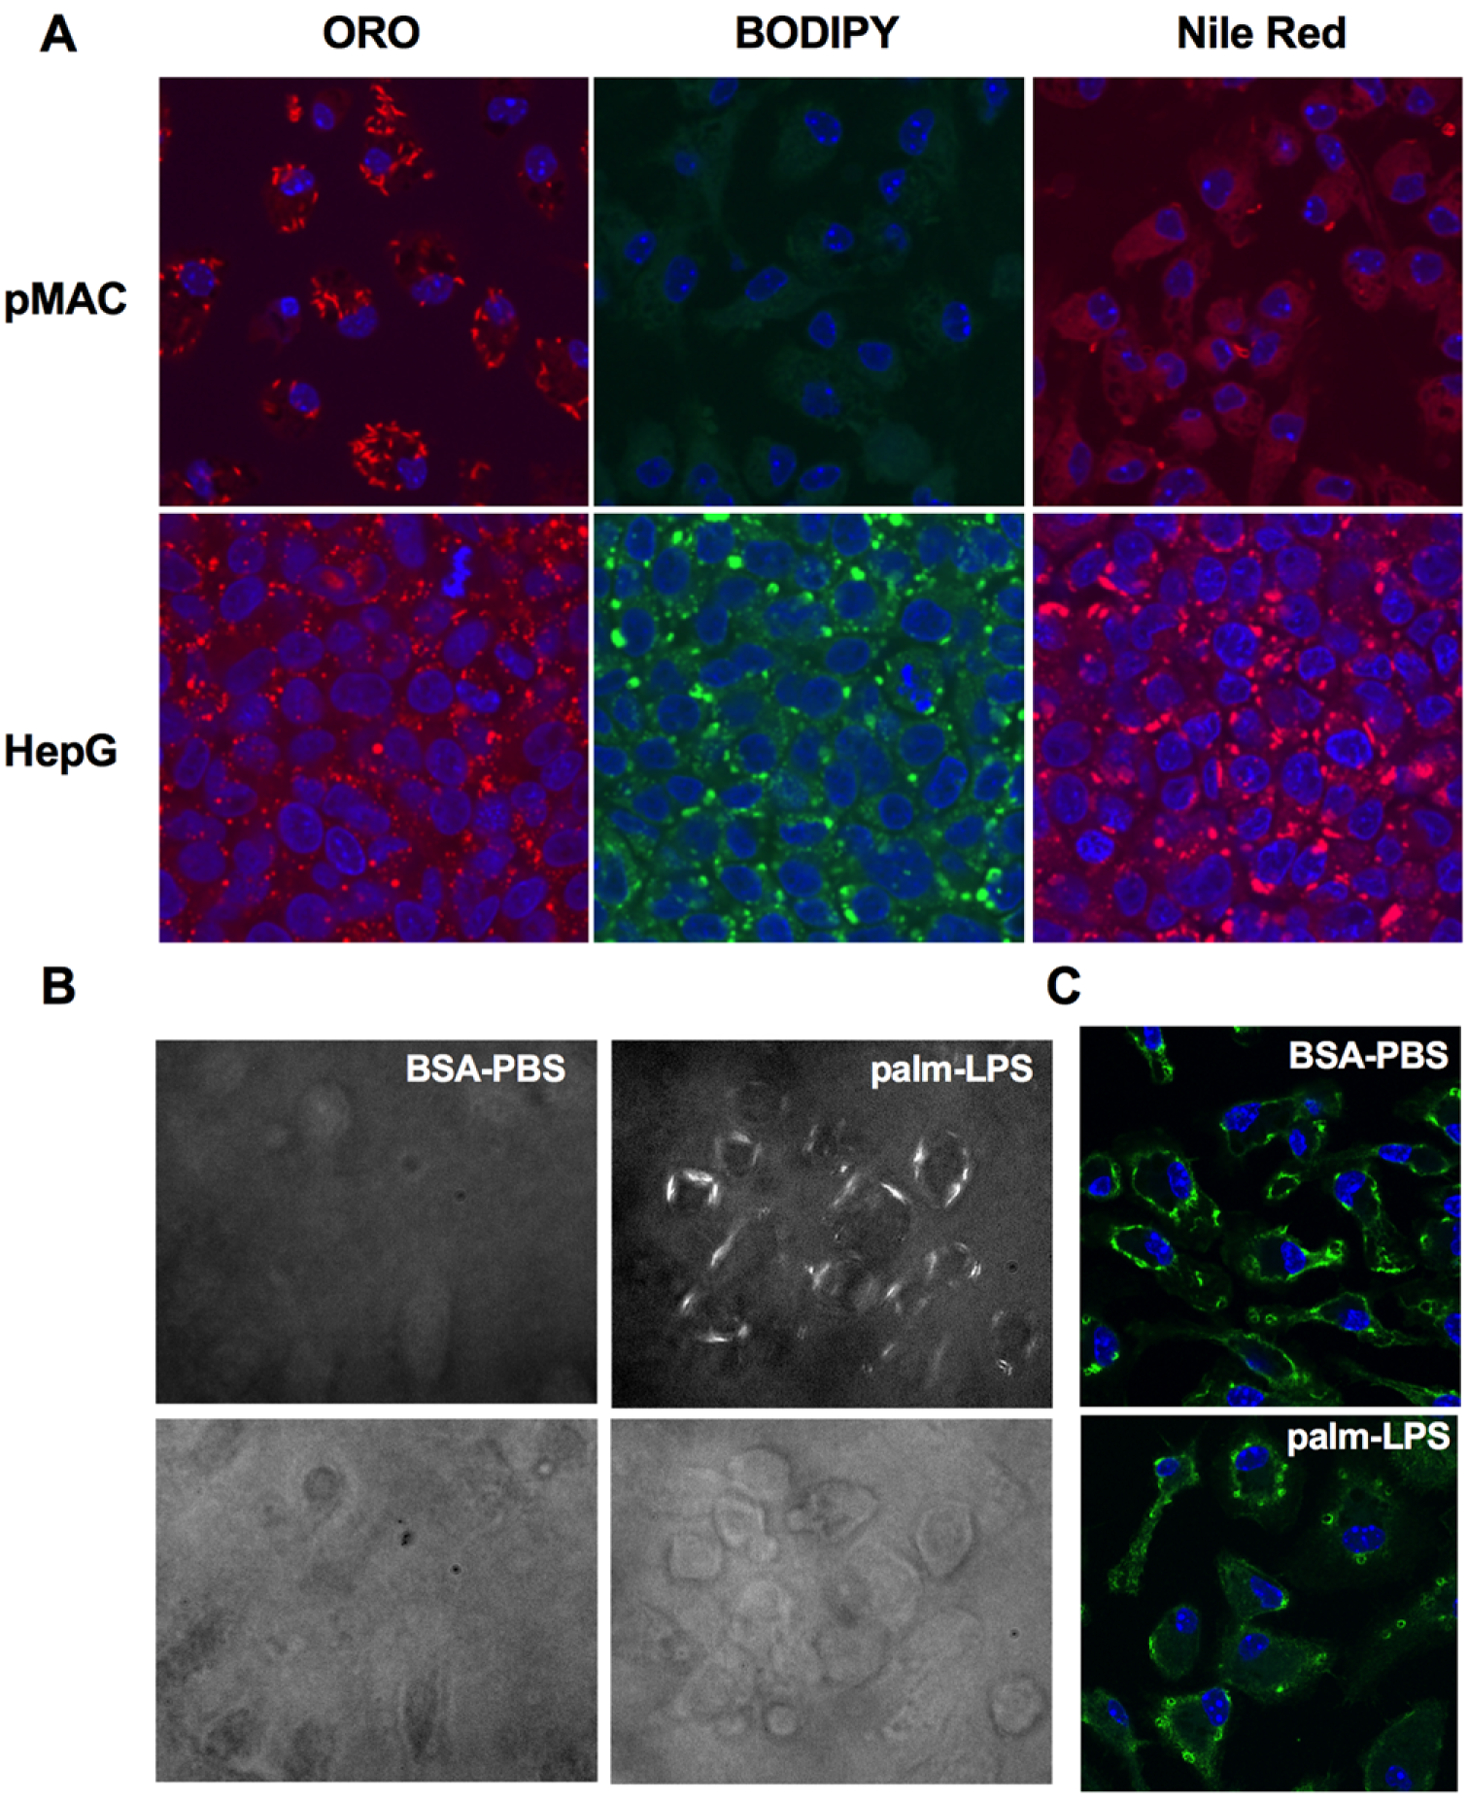
(A) pMACs or HepG2 cells were treated with palm-LPS or oleate (200 μM) for 16 h and then stained with ORO, BODIPY 493/503, or nile red and imaged with confocal microscopy at 63×magnification. Nuclei were counterstained with DAPI (blue). (B) WT pMACs were treated as indicated for 16 h and then imaged using polarized light microscopy at 20× to visualize crystalline material (top panels) or bright field microscopy (bottom panels). (C) Macrophages were treated with BSA-PBS or palm-LPS and stained with an antibody to galectin 8 to identify injured lysosomes. Images were taken on a confocal microscope at 63× magnification
To evaluate the impact of ACS deficiency on SFA-crystal formation, WT or mACSKO macrophages were treated with combinations of palmitate and LPS and stained with ORO. Both imaging and ORO quantification revealed that the formation of SFA crystals did not occur with PBS or LPS alone, but was increased with palmitate and even more so with the combination of palmitate and LPS. Interestingly, mACSKO macrophages treated with palm-LPS had significantly fewer crystals via ORO microscopy and quantification compared to WT cells (Fig. 6A and B). It was notable on fluorescence imaging that not all cells contained ORO crystals, but those that did tended to have multiple intracellular crystals. Electron microscopy images also revealed the cytoplasmic location of these crystalline structures (Fig. 6C). In addition, treatment of WT cells with the ACS inhibitor triacsin C (TC) also produced a similar reduction in crystal formation and IL-1β release (Fig. 6D and E). Together these findings, we argue that loss of ACSL1 in macrophages attenuates the formation of SFA crystals and thereby diminishes lysosome damage, lipotoxic inflammasome activation, and cell death.
FIGURE 6. ACSL1 exacerbates crystal formation in response to lipid and inflammatory activation.
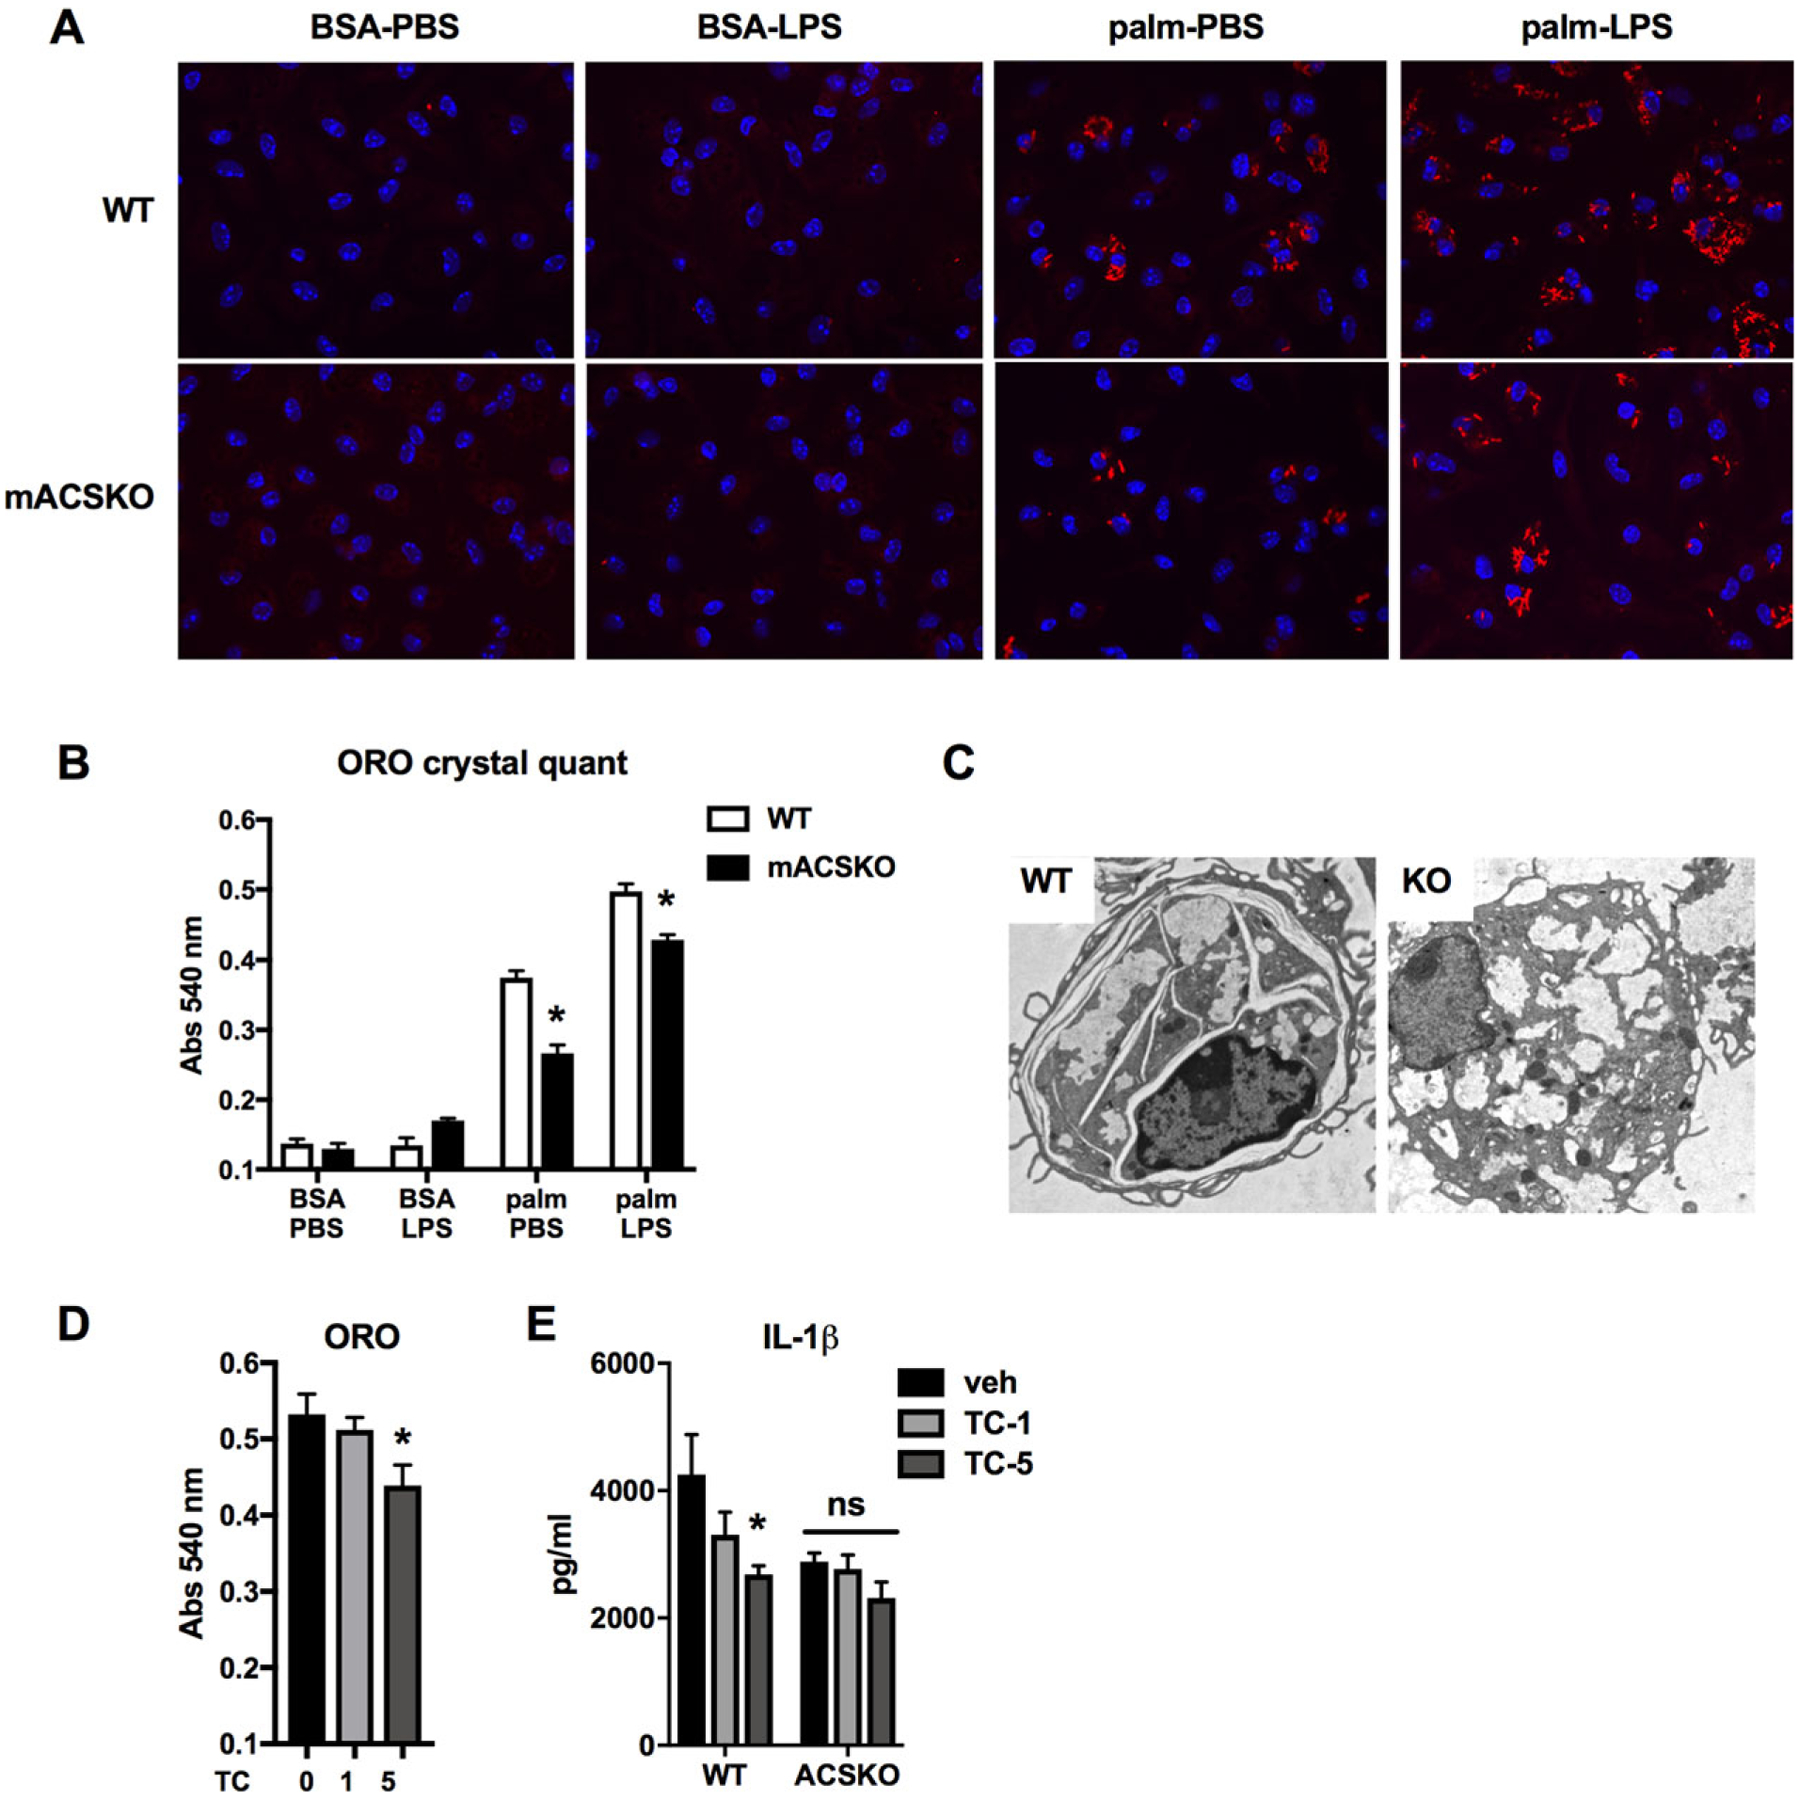
(A) WT (top panels) or mACSKO (bottom panels) pMACs were treated with the indicated stimuli for 16 h after which they were subjected to ORO staining to visualize crystals. Images were taken using confocal microscopy at 40× magnification. Nuclei were counterstained with DAPI (blue). (B) Quantification of ORO under all conditions is shown in A. (C) Electron microscopy of macrophages from WT and mACSKO mice demonstrating the ultrastructural appearance of intracellular crystals. (D) pMACs were treated with palm-LPS in the presence of the ACS inhibitor TC at 1 or 5 μM for 16 h after which the cells were stained with ORO, and the signal was quantified after extraction. (E) WT or mACSKO pMACs were treated with palm-LPS, and the indicated concentrations of TC and IL-1β release was quantified by ELISA. Bar graphs report the mean ± SE for a minimum of 3 experiments, each performed in triplicate.*, P < 0.05 for WT versus mACSKO or veh versus TC
4 |. DISCUSSION
In this study, we demonstrate an important role for the lipid metabolic enzyme ACSL1 in the activation of the lipotoxic inflammasome in primary macrophages. Previous data from our group has shown that TLR4-TRIF activation in the setting of lipid excess leads to lysosome damage and inflammasome activation in macrophages.15,16 Herein we report that ACLS1 is a TRIF-dependent, interferon-independent gene target and that disruption of this enzyme is protective against lysosome damage and inflammasome activation. ACSKO macrophages were shown to have an intact inflammasome priming response following TLR4 stimulation; however, IL-1β release was attenuated due to a reduction in lysosome damage. In macrophages, ACSL1 resides in mito-chondrially enriched membranes and is important for the channeling of FAs into the mitochondria for beta oxidation. However, the protective effect of ACS deficiency was independent of altering mitochondrial FAO and instead was related to a reduction in FA-induced crystal formation and secondary lysosome damage. These findings add to our mechanistic understanding of lipid-induced macrophage inflammasome activation and provide proof-of-concept evidence that targeting macrophage metabolism could attenuate this pathologic inflammation.
Recent studies in animals and humans have revealed an important role for macrophage NLRP3 inflammasome activation in lipid-induced diseases such as atherosclerosis and diabetes.1,3,11,27,28 Our group and others have shown that lysosome damage appears to be a common feature upstream of lipotoxic inflammasome activation in these diseases.12,15,16 However, the molecular details of this response remain unclear. Activation of the canonical NLRP3 inflammasome require 2 distinct signals. Signal 1 is a priming stimulus that leads to the expression of pro-IL-1β and NLRP3, whereas signal 2 is a cytosolic stress signal that triggers to the assembly of inflammasome complex and caspase 1-dependent cleavage of pro-IL-1β. In this study, we demonstrate that deletion of ACLS1 from myeloid cells reduces IL-1β release, but does not impact signal 1. Our findings also revealed that impact of ACSL1 deficiency on NLRP3 activation only occurs in response to lipid activators, demonstrating its specific role in lipid toxicity. ER stress and lysosome damage-dependent pathways have both been implicated in triggering signal 2 of the inflammasome pathway following exposure to SFAs. However, the ER stress response was similar between WT and mACSKO macrophages. Rather, markers of lysosome damage were attenuated in mACSKO pMACs. This led to the crucial question of how ACSL1 links to lysosome pathology.
ACSL1 is an enzyme that esterifies free fatty acids (FFA) with the addition of an acyl-CoA group. This reaction “activates” the FA for use in lipid synthesis or oxidation reactions, but also traps the FA in the cell.18 There are several ACS isoforms expressed in macrophages; however, ACSL1 accounts for ~ 50% of the total cellular ACS enzyme activity.22 The different ACS isoforms reside in distinct cellular compartments where they are thought to direct FAs to specific fates.26 While ACSL1 overexpression can increase lipid uptake, KO of this enzyme does not perturb FA entry to the cell. Consistent with these results, we demonstrated that mACSKO macrophages did not have a defect palmitate uptake. However, the FA uptake assay only assesses immediate lipid uptake and therefore differences in the accumulation of intracellular FAs cannot be addressed with this method. In other cells types, such as cardiomyocytes and brown fat cells, ACSL1 is required for channeling of FAs to the mitochondria for beta oxidation.19,20 Similar to these highly oxidative tissues, we discovered that that ACSL1 is enriched in the mitochondrial fraction of macrophages. Subsequent lipidomic and seahorse metabolic analysis further supported the notion that ACSL1 can target lipids toward FAO in macrophages. In addition to our findings, it has been demonstrated that loss of ACSL1 impairs phospholipid turnover macrophages treated with LPS.21 However, as this study used whole cell lipidomics, it remains unclear whether mitochondrial phospholipids were specifically impacted. Taken together, the data are consistent with a model in which ACSL1 is induced by TLR4-TRIF activation and then moves to the mitochondria where it regulates macrophage lipid metabolism and membrane composition.
The observation that ACSL1 resides in close proximity to mitochondria and modulates FAO led us to hypothesize that reduced β-oxidation may explain the dampened inflammasome response, perhaps through a shift in redox balance. However, inhibiting FAO pharma-cologically did not reduce IL-1β release. Nor did loss of ACSL1 impact mitochondrial ROS generation. Of interest, it was recently reported that SFAs can form intracellular crystals in macrophages causing lysosome damage and led to IL-1β release.12 Consistent with this study, we also observed crystal birefringence in palm-LPS–treated pMACs visualized under polarized light. To further evaluate crystal formation in our system, we took advantage of the fact that lipid droplet dye ORO-stained structures in lipid-treated pMACs that did not appear to be lipid droplets. Therefore, we compared typical lipid droplets formed in oleate-treated hepatocytes to macrophages treated with palm-LPS. The ORO positive structures present in pMACs had a distinct crystal shape when compared to ORO lipid droplets in hepatocytes. Moreover, in contrast to the hepatocytes the ORO structures in macrophages did not stain with other dyes that bind neutral lipid droplets (i.e. BODIPY, nile red). Visualization of the crystals via electron microscopy (EM) revealed that they were not in vacuoles, but rather appeared to be in the cytosol. Crystals were only observed in macrophages treatment with SFAs and did not form in response to LPS alone, suggesting that they are of lipid origin. Thus, SFA-induced crystals are a likely link between lipid overload and lysosome damage/inflammasome activation.
To determine whether ACSL1 influenced crystal formation in response to palm-LPS, we assessed ORO staining and quantification in WT and mACSKO macrophages. Consistent with our lysosome damage data, crystal formation was attenuated in mACSKO macrophages, arguing that ACSL1 activity could serve to accelerate crystal formation. We also obtained similar results with TC, a chemical inhibitor of the ACS family of enzymes. Based on these data, ACSL1 appears to act upstream of lysosome damage by altering the efficiency of crystal formation following SFA exposure. Our findings are similar to those described for macrophages in atherosclerosis where intracellular cholesterol crystals form from oxidized LDL that is internalized via CD36. In this system, the cholesterol crystals subsequently damage lysosome membranes and trigger activation of the NLRP3 inflammasome, leading to atherosclerosis progression.29 Interestingly, CD36 has also been reported to play a role in FFA internalization. Although crystal formation was not assessed, mACSKO mice also have decreased lesion size in a mouse model of diabetic atherosclerosis.22 In concert, the fact that SFAs and oxidized cholesterol both lead to intracellular crystal formation and lysosome damage raises the intriguing possibility this may be a common pathway by which lipids induce macrophage dysfunction and increase inflammasome activation.
At present, the factors that facilitate crystal formation in macrophages are not well understood. It has been suggested that nonesterified FAs are more prone to form crystals; however, ACSL1 and its family members catalyze FA esterification, suggesting that FFA crystallization may not be the whole story. Based on our findings linking ACSL1 to the mitochondria, it is tempting to speculate that changes in the mitochondrial lipidome may influence the concentrations of specific lipid intermediates that may be prone to crystalize. Moreover, the observation that cells tended to have multiple crystals or no crystals suggests that crystal formation catalyzes more crystals to form. Importantly, the in vivo relevance of SFA crystals has been shown for palmitate-induced inflammation. Further research will be necessary to better define this pathway and its relevance to human metabolic disease.
In this study, we present evidence that the lipid metabolic enzyme ACSL1 contributes to macrophage inflammasome activation in response to excess SFAs. ACSL1 is upregulated by inflammatory signals and appears to regulate mitochondrial lipid flux and SFA crystal formation. Our findings add to a growing body of literature that crosstalk between cellular metabolism and inflammatory signals can modulate immune cell biology in metabolic disease.
Funding information
This work was supported by NIH grants RO1 DK11003401 (to JDS) and P30 DK020579 (to JDS).
Abbreviations:
- ACSL1
long chain acyl-CoA synthetase 1
- ASCapoptosis associated spectral like
apoptosis associated spectral like protein
- CPT1
carnitine palmitoyl transferase 1
- FA
fatty acid
- FAO
fatty acid oxidation
- mACSKO
myeloid ACSL1 knock out
- OCR
oxygen consumption
- ORO
oil red O
- pMACthioglycolate elicited peritoneal
thioglycolate elicited peritoneal macrophage
- SFA
saturated fatty acid
- TC
triacsin C
- TLR4
toll-like receptor 4
- WT
wild type
Footnotes
DISCLOSURES
The authors declare no conflict of interest.
REFERENCES
- 1.Ridker PM, Everett BM, Thuren T, et al. Antiinflammatory therapy with canakinumab for atherosclerotic disease. N Engl J Med.2017;377:1119–1131. [DOI] [PubMed] [Google Scholar]
- 2.Bracey NA, Beck PL, Muruve DA, et al. The Nlrp3 inflammasome promotes myocardial dysfunction in structural cardiomyopathy through interleukin-1beta. Exp Physiol. 2013;98:462–472. [DOI] [PubMed] [Google Scholar]
- 3.Duewell P, Kono H, Rayner KJ, et al. NLRP3 inflammasomes are required for atherogenesis and activated by cholesterol crystals. Nature. 2010;464:1357–1361. [DOI] [PMC free article] [PubMed] [Google Scholar]
- 4.Graves DT, Kayal RA. Diabetic complications and dysregulated innate immunity. Front Biosci. 2008;13:1227–1239. [DOI] [PMC free article] [PubMed] [Google Scholar]
- 5.Mirza RE, Fang MM, Ennis WJ, Koh TJ. Blocking IL-1beta induces a healing-associated wound macrophage phenotype and improves healing in type-2 diabetes. Diabetes. 2013;62(7):2579–2587. [DOI] [PMC free article] [PubMed] [Google Scholar]
- 6.Sano S, Oshima K, Wang Y, et al. Tet2-mediated clonal hematopoiesis accelerates heart failure through a mechanism involving the IL-1beta/NLRP3 inflammasome. J Am Coll Cardiol. 2018;71:875–886. [DOI] [PMC free article] [PubMed] [Google Scholar]
- 7.Coverstone ED, Bach RG, Chen L, et al. A novel genetic marker of decreased inflammation and improved survival after acute myocardial infarction. Basic Res Cardiol. 2018;113:38. [DOI] [PMC free article] [PubMed] [Google Scholar]
- 8.Weber K, Schilling JD. Lysosomes integrate metabolic-inflammatory cross-talk in primary macrophage inflammasome activation. J Biol Chem. 2014;289:9158–9171. [DOI] [PMC free article] [PubMed] [Google Scholar]
- 9.He L, Weber KJ, Schilling JD. Glutamine modulates macrophage lipotoxicity. Nutrients. 2016;8:215. [DOI] [PMC free article] [PubMed] [Google Scholar]
- 10.Weber KJ, Sauer M, He L, et al. PPARgamma deficiency suppresses the release of IL-1beta and IL-1alpha in macrophages via a type 1 IFN-dependent mechanism. J Immunol. 2018;201:2054–2069. [DOI] [PMC free article] [PubMed] [Google Scholar]
- 11.Wen H, Gris D, Lei Y, et al. Fatty acid-induced NLRP3-ASC inflammasome activation interferes with insulin signaling. Nat immunol. 2011;12:408–415. [DOI] [PMC free article] [PubMed] [Google Scholar]
- 12.Karasawa T, Kawashima A, Usui-Kawanishi F, et al. Saturated fatty acids undergo intracellular crystallization and activate the NLRP3 inflammasome in macrophages. Arterioscler Thromb Vasc Biol. 2018;38:744–756. [DOI] [PubMed] [Google Scholar]
- 13.Chen J, Chen ZJ. PtdIns4P on dispersed trans-Golgi network mediates NLRP3 inflammasome activation. Nature. 2018;564:71–76. [DOI] [PMC free article] [PubMed] [Google Scholar]
- 14.Schilling JD, Machkovech HM, He L, et al. Palmitate and lipopolysaccharide trigger synergistic ceramide production in primary macrophages. J Biol Chem. 2013;288:2923–2932. [DOI] [PMC free article] [PubMed] [Google Scholar]
- 15.Schilling JD, Machkovech HM, He L, Diwan A, Schaffer JE. TLR4 activation under lipotoxic conditions leads to synergistic macrophage cell death through a TRIF-dependent pathway. J Immunol. 2013;190: 1285–1296. [DOI] [PMC free article] [PubMed] [Google Scholar]
- 16.Weber KJ, Schilling JD. Lysosomes integrate metabolic-inflammatory crosstalk in primary macrophage inflammasome activation. J Biol Chem. 2014;289 (13):9158–9171. [DOI] [PMC free article] [PubMed] [Google Scholar]
- 17.Robblee MM, Kim CC, Porter Abate J, et al. Saturated fatty acids engage an IRE1alpha-dependent pathway to activate the NLRP3 inflammasome in myeloid cells. Cell Rep. 2016;14:2611–2623. [DOI] [PMC free article] [PubMed] [Google Scholar]
- 18.Ellis JM, Frahm JL, Li LO, Coleman RA. Acyl-coenzyme A synthetases in metabolic control. Curr Opin Lipidol. 2010;21:212–217. [DOI] [PMC free article] [PubMed] [Google Scholar]
- 19.Ellis JM, Li LO, Wu PC, et al. Adipose acyl-CoA synthetase-1 directs fatty acids toward beta-oxidation and is required for cold thermogenesis. Cell Metab. 2010;12:53–64. [DOI] [PMC free article] [PubMed] [Google Scholar]
- 20.Ellis JM, Mentock SM, Depetrillo MA, et al. Mouse cardiac acyl coenzyme a synthetase 1 deficiency impairs fatty acid oxidation and induces cardiac hypertrophy. Mol Cell Biol. 2011;31:1252–1262. [DOI] [PMC free article] [PubMed] [Google Scholar]
- 21.Rubinow KB, Wall VZ, Nelson J, et al. Acyl-CoA synthetase 1 is induced by Gram-negative bacteria and lipopolysaccharide and is required for phospholipid turnover in stimulated macrophages. J Biol Chem. 2013;288:9957–9970. [DOI] [PMC free article] [PubMed] [Google Scholar]
- 22.Kanter JE, Kramer F, Barnhart S, et al. Diabetes promotes an inflammatory macrophage phenotype and atherosclerosis through acyl-CoA synthetase 1. Proc Natl Acad Sci U S A. 2012;109:E715–E724. [DOI] [PMC free article] [PubMed] [Google Scholar]
- 23.Listenberger LL, Ory DS, Schaffer JE. Palmitate-induced apoptosis can occur through a ceramide-independent pathway. J Biol Chem. 2001;276:14890–14895. [DOI] [PubMed] [Google Scholar]
- 24.Schnute ME, McReynolds MD, Kasten T, et al. Modulation of cellular S1P levels with a novel, potent and specific inhibitor of sphingosine kinase-1. Biochem J. 2012;444:79–88. [DOI] [PubMed] [Google Scholar]
- 25.Li LO, Klett EL, Coleman RA. Acyl-CoA synthesis, lipid metabolism and lipotoxicity. Biochim Biophys Acta. 2010;1801:246–251. [DOI] [PMC free article] [PubMed] [Google Scholar]
- 26.Cooper DE, Young PA, Klett EL, Coleman RA. Physiological consequences of compartmentalized Acyl-CoA metabolism. J Biol Chem. 2015;290:20023–20031. [DOI] [PMC free article] [PubMed] [Google Scholar]
- 27.Vandanmagsar B, Youm YH, Ravussin A, et al. The NLRP3 inflammasome instigates obesity-induced inflammation and insulin resistance. Nat Med. 2011;17:179–188. [DOI] [PMC free article] [PubMed] [Google Scholar]
- 28.Razani B, Feng C, Coleman T, et al. Autophagy links inflammasomes to atherosclerotic progression. Cell Metab. 2012;15:534–544. [DOI] [PMC free article] [PubMed] [Google Scholar]
- 29.Sheedy FJ, Grebe A, Rayner KJ, et al. CD36 coordinates NLRP3 inflammasome activation by facilitating intracellular nucleation of soluble ligands into particulate ligands in sterile inflammation. Nat Immunol. 2013;14:812–820. [DOI] [PMC free article] [PubMed] [Google Scholar]