Abstract
Heterochromatin impacts genome function at multiple scales. It enables heritable gene repression, maintains chromosome integrity and provides mechanical rigidity to the nucleus1,2. It has been proposed that these diverse functions arise in part from compaction of the underlying chromatin. A major type of heterochromatin contains at its core the complex formed between HP1 proteins and chromatin that is methylated on histone H3, lysine 9 (H3K9me). HP1 is proposed to use oligomerization to compact chromatin into phase-separated condensates3–6. Yet how HP1-mediated phase separation relates to chromatin compaction remains unclear. Here we demonstrate that chromatin compaction by the S. pombe HP1 protein, Swi6, results in phase-separated liquid condensates. Remarkably, we further find that Swi6 substantially increases the accessibility and dynamics of buried histone residues within a nucleosome. Restraining these dynamics impairs chromatin compaction by Swi6 into liquid droplets. Our results indicate that Swi6 couples oligomerization to the phase separation of chromatin by a counter-intuitive mechanism, namely dynamic exposure of buried nucleosomal regions. We propose that such reshaping of the octamer core by Swi6 increases opportunities for multivalent interactions between nucleosomes, thereby promoting phase separation. This mechanism may more generally drive chromatin organization beyond heterochromatin.
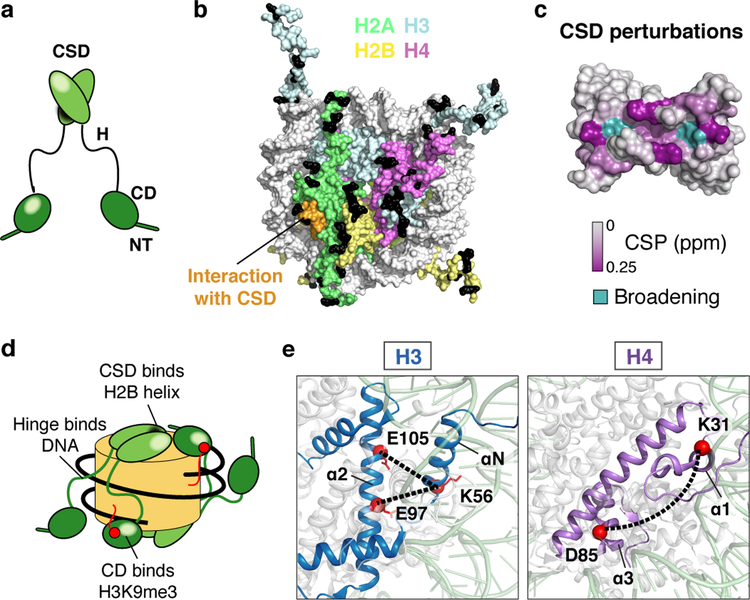
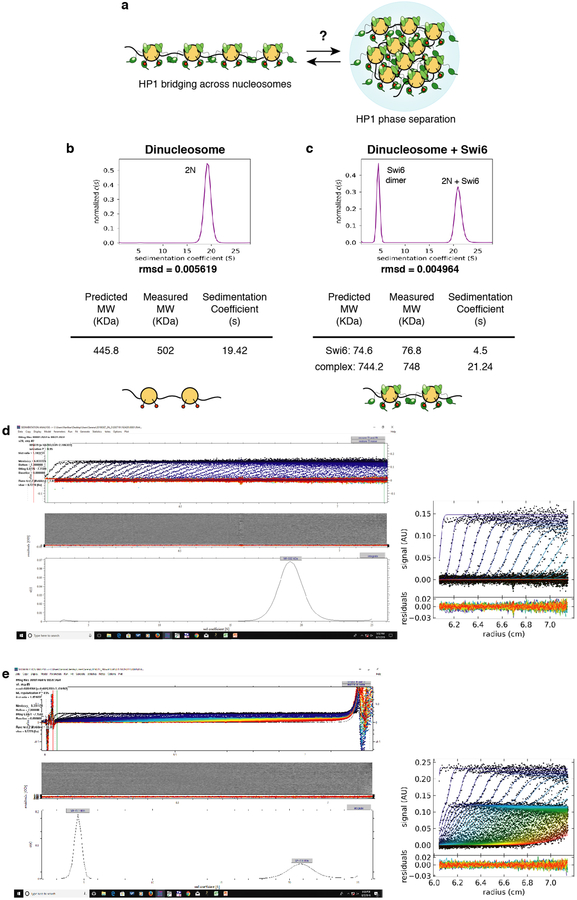
Swi6 has two structured domains, the chromodomain (CD), which binds the H3K9me mark, and the chromoshadow domain (CSD), which forms a dimer and contributes to nucleosome binding (Fig. 1a, Extended Data Fig. 1a)4,7. The CD and CSD are connected by a hinge region that binds DNA in a sequence non-specific manner7. Prior studies showed four molecules of Swi6 can bind to a single H3K9me nucleosome and we find dinucleosomes bind at least seven Swi6 molecules3 (Extended Data Figs1 b, c).
Fig. 1: Swi6 contacts histone octamer core and alters intra-histone cross-links.
(a) Swi6 domain architecture. Chromodomain (CD), chromoshadowdomain (CSD), N-terminal region (NT) and hinge (H) are shown. (b) Histone residues that cross-link to Swi6 are mapped in black on the nucleosome structure. Different histones are colored as indicated. H2B region interacting with the CSD is in orange. (c) Swi6 CSD crystal structure is colored by chemical shift perturbation (CSP, purple) and broadening beyond detection (teal) upon the addition of H2B peptide (PDB 1E0B). (d) Model for engagement of Swi6 with nucleosome. (e) Swi6 binding remodels histone-histone contacts. Examples of residues found cross-linked only upon Swi6 binding are represented as red spheres. Histones H3 and H4 are colored in blue and purple, respectively.
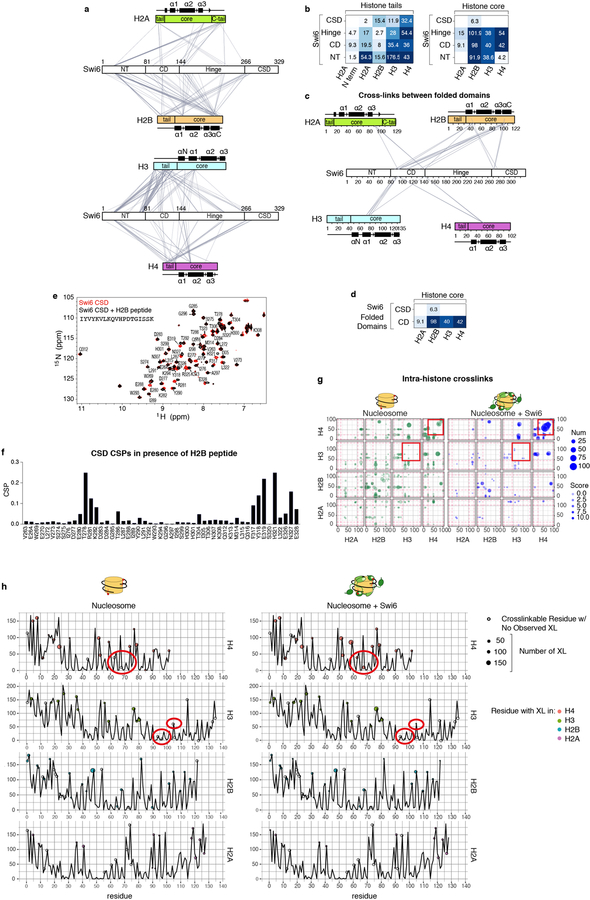
To understand the mechanism of Swi6 action we probed how Swi6 engages a mononucleosome using cross-linking mass spectrometry (XLMS). We used nucleosomes containing a methyl lysine analog on H3K9 (H3Kc9me3 nucleosomes) (Fig. 1b, Extended Data Figs 2a–d)4. In addition to cross-links between the CD and H3, we obtained extensive cross-links between the Swi6 CSD and the octamer core, particularly H2B (Fig. 1b, Extended Data Fig. 2d). The CSD-CSD dimer interface is known to interact with proteins containing the motif ϕx(V/P)xϕ (where ϕ and x, indicate a hydrophobic and any amino acid, respectively)8,9. The CSD of mammalian HP1 proteins has been shown to interact with the H3αN helix region of the nucleosome core10,11. However, the CSD of Swi6 does not interact substantially with the H3αN helix region and we do not observe crosslinks between the Swi6 CSD and the H3αN region9. Instead, we detect cross-linking between the Swi6 CSD and the α1-helix of H2B, which also contains a ϕx(V/P)xϕ motif (Extended Data Figs 2c, d). Using 1H-15N HSQC NMR we found that binding of the H2B peptide containing the ϕx(V/P)xϕ motif (residues 36–54) causes chemical shift perturbations (CSPs) in the CSD cleft indicating a direct interaction (Fig. 1c, Extended Data Figs 1e, f)9. Crystal structures show that ϕx(V/P)xϕ motifs adopt a linear unfolded conformation to fit into the cleft of the CSD dimer12. It is therefore plausible that a portion of the H2B α1-helix rearranges to resemble a short linear motif in order to bind the CSD. These experiments demonstrate that Swi6 interacts with the nucleosome core, in addition to the H3 tail, and that the CSD domain can specifically bind the H2B α1-helix (Fig. 1d).
We noticed several new H3-H3 and H4-H4 cross-links that arose in the Swi6-bound state (Extended Data Fig. 2g). These intra-histone cross-links are not within the standard distance captured by the cross-linker that was used. For example, the buried residues E97 and E105 of histone H3, whose Cα’s are ~15 Å from the alpha carbon of K56, cross-link with K56 only in the presence of Swi6 (Fig. 1e, Extended Data Fig. 2h). Together with the possibility that CSD binding partially unfolds the H2B α1-helix, the new intra-histone cross-links suggest that Swi6 binding perturbs the canonical conformation of the histone octamer. Analogously, the previously observed interaction between mammalian HP1 proteins and the buried H3αN helix region may also be indicative of a conformational change within the octamer10,11.
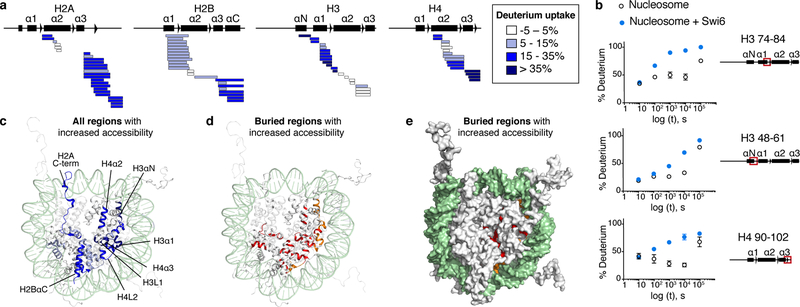
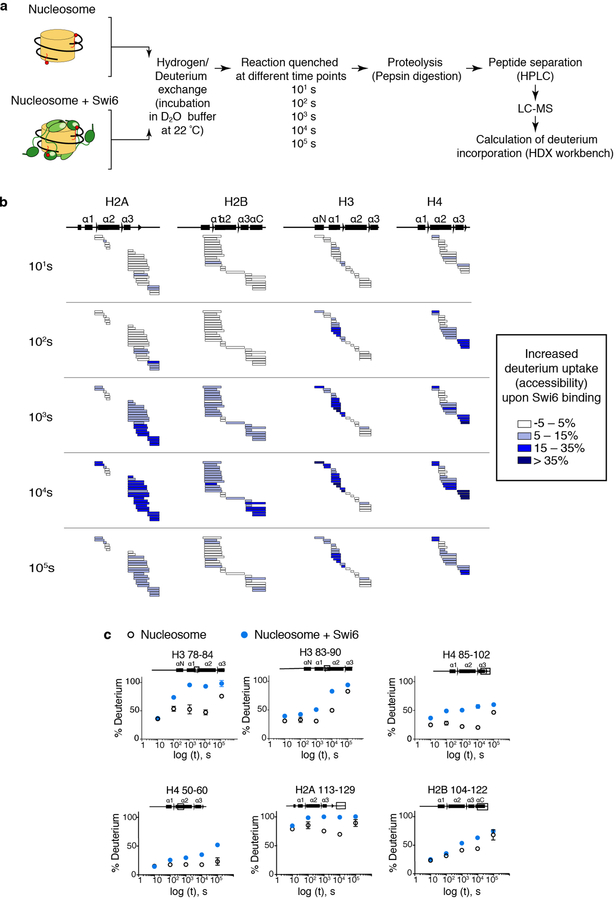
To more directly test for the impact of Swi6 on nucleosome conformation, we carried out HDX-MS as a function of time on H3Kc9me3 mononucleosomes alone or in complex with saturating concentrations of Swi6 (Extended Data Fig. 3). This method measures the exchange of backbone amide hydrogens with solvent deuterium, and reports on protein backbone conformation, dynamics and solvent accessibility13.
Given the role of Swi6 in chromatin compaction, the simplest expectation was that Swi6 would reduce solvent accessibility to mononucleosomes. Therefore, we expected decreased deuterium uptake upon Swi6 binding, which is also a typical consequence of protein-protein interactions13. Instead, Swi6 binding resulted in a robust and widespread increase of deuterium incorporation throughout the histone octamer (Figs 2a–c, Extended Data Figs 3b, c). Remarkably, the H3 and H4 regions showing the highest degree of deuterium incorporation upon Swi6 binding are buried within histone-histone and histone-DNA interfaces in the canonical nucleosome structure, suggesting partial unfolding of histone helices (Figs 2d, e). These observations indicate that Swi6 binding causes a conformational change in the nucleosome that results in a widespread increase in the solvent accessibility of buried histone residues.
Fig. 2: Swi6 binding increases solvent accessibility of buried histone residues.
(a) Differential HDX-MS of individual histones within Swi6-bound versus free nucleosomes from a single time point (104 sec; all time points in Extended Data Fig. 3). Each horizontal bar represents an individual peptide. Peptides are placed beneath schematic of secondary structure elements. Color map represents percent increase in deuterium uptake observed upon Swi6 binding. The percent increase values are derived from multiple peptides obtained from one of two independent experiments with similar results. (b) Kinetics of deuterium uptake of example histone peptides (residue numbers indicated) over time. Data are mean and SD of multiple peptides obtained from one of two independent experiments with similar results. Error bars not shown for points when shorter than the height of the symbol. (c) Histones in nucleosome structure (PDB 1KX5) colored according to the percent of deprotection in (a). For clarity, only one copy of histones is colored. DNA is in light green. (d) Buried regions showing increase in deuterium uptake upon Swi6 binding are highlighted in ribbon diagram. Residues proximal to DNA and histones are in orange and red, respectively. (e) Residues in (d) shown in space-fill representation.
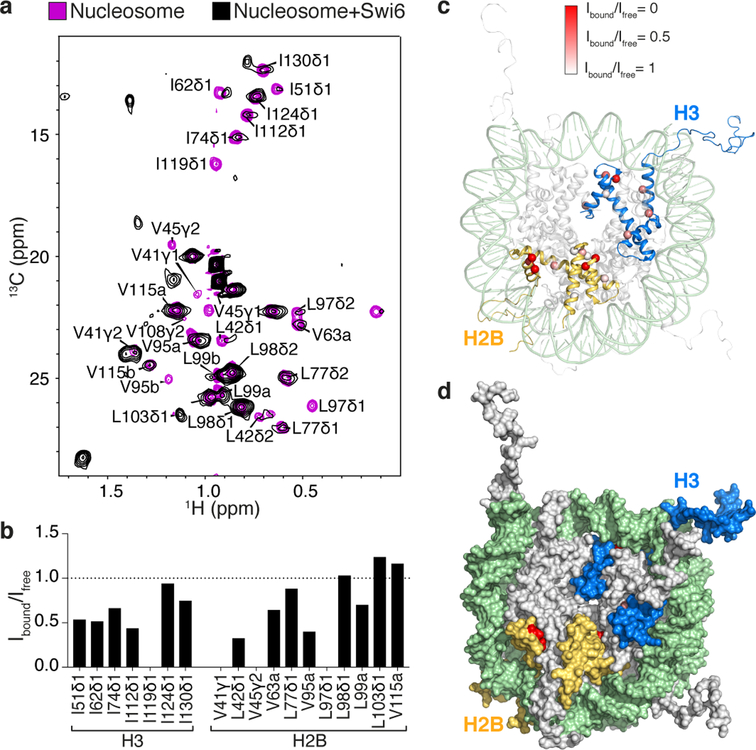
To further characterize the impact of Swi6 on nucleosomes, we used the orthogonal method of methyl-TROSY NMR spectroscopy, which allows studies of macromolecular assemblies as large as the proteasome and nucleosome14,15. In contrast to HDX-MS, this approach allows residue level resolution, assessment of changes in magnetic environment due to binding or conformational changes and determination of the time-scale of side-chain dynamics. H3 and H2B histones were labeled with 13C on methyl groups of isoleucine, leucine and valine (ILV) in an otherwise deuterated environment.
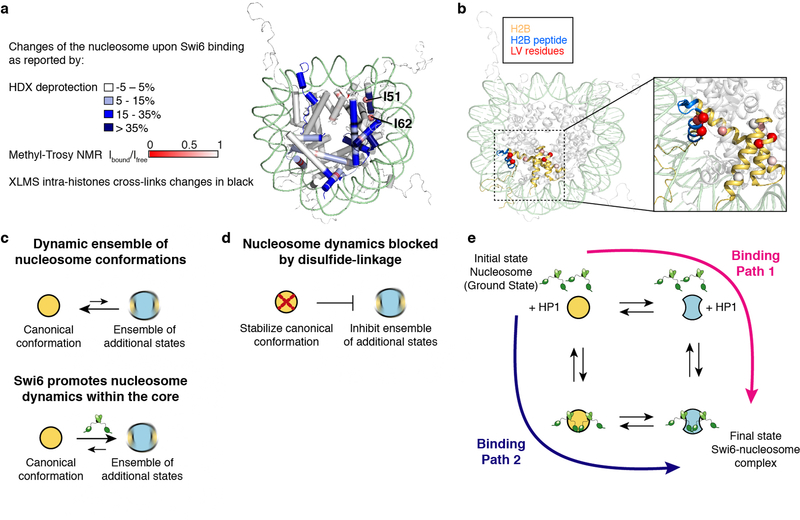
Binding of Swi6 to the nucleosome induced shifts and broadening of select resonances (Figs 3a, b). Because Swi6 is deuterated, its binding affinity for the nucleosome is tight (Kd <100 nM), and nearly all of the ILV residues that undergo resonance broadening are buried, we interpret differential resonance broadening as intramolecular conformational dynamics on the ms-µs timescale in the histone octamer core induced by Swi6 (Figs 3c, d, Extended Data Fig. 4, Table S1 for Kd value). Importantly, the changes in side-chain dynamics detected by NMR are consistent with the changes in backbone solvent accessibility detected by HDX-MS and the changes in intra-histone cross-links (Extended Data Figs 5a, b). For example, H3 residues I51 and I62, which are strongly affected by Swi6 based on methyl-TROSY NMR, are in the histone regions that display higher deuterium uptake. The NMR results also rule out that disassembly of the nucleosome contributes to the HDX-MS data, because the cross-peaks of free histones fall in a different chemical shift region than what we observe15. Analogous ms-µs dynamics within the histone core were not observed in previous methyl-TROSY studies using a linker histone, which also enables chromatin compaction, suggesting that our observations reflect a Swi6 specific effect16.
Fig. 3: Swi6 binding increases protein dynamics within octamer core.
(a) Methyl-TROSY spectra of Ile-methyl–labeled H3 and Leu/Val-methyl–labeled H2B in nucleosome alone (purple), and bound to Swi6 (black). Three resonances in H2B are not assigned as they correspond to residues V15, V38 and V66 present only in Xenopus H2B. Some resonances are largely unaffected (I124, L98, L99, V115, and two not assigned), while others are broadened and a few new resonances appear in presence of Swi6. (b) Peak volumes of H3 and H2B residues in the nucleosome-Swi6 complex (Ibound) relative to those in the nucleosome alone (Ifree). Spectra were normalized using volumes of their respective L98 and two non-assigned peaks, which do not show broadening upon Swi6 binding. Only unambiguously assigned peaks are included in quantification. Cross-peaks that disappear are taken to have an Ibound value of zero. (c) Cα of Ile residues in H3 and Leu/Val residues in H2B shown as red spheres in the nucleosome structure (PDB 1KX5). Color intensity represents extent of broadening determined by Ibound /Ifree. (d) Surface representation of nucleosome in (c). Experiments were performed two times to optimize conditions; data from one experiment are reported.
Based on the results above, we propose that Swi6 loosens histone-histone and histone-DNA interactions through simultaneous engagement of the H3K9me3 mark by the CD, the nucleosomal DNA by the hinge and the H2B α1 helix by the CSD dimer, allowing the buried histone residues to breathe and become solvent exposed (Fig. 1d, Extended Data Fig. 5c).
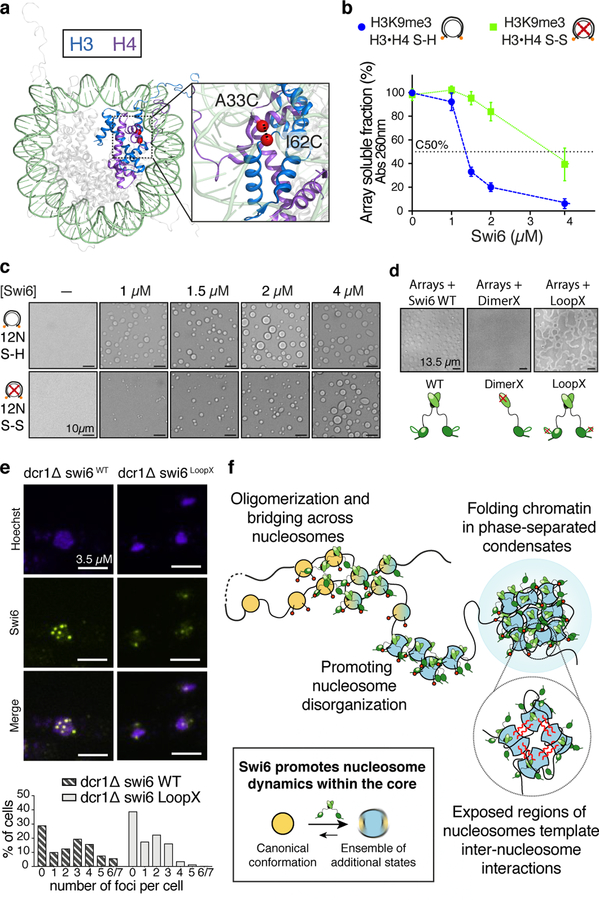
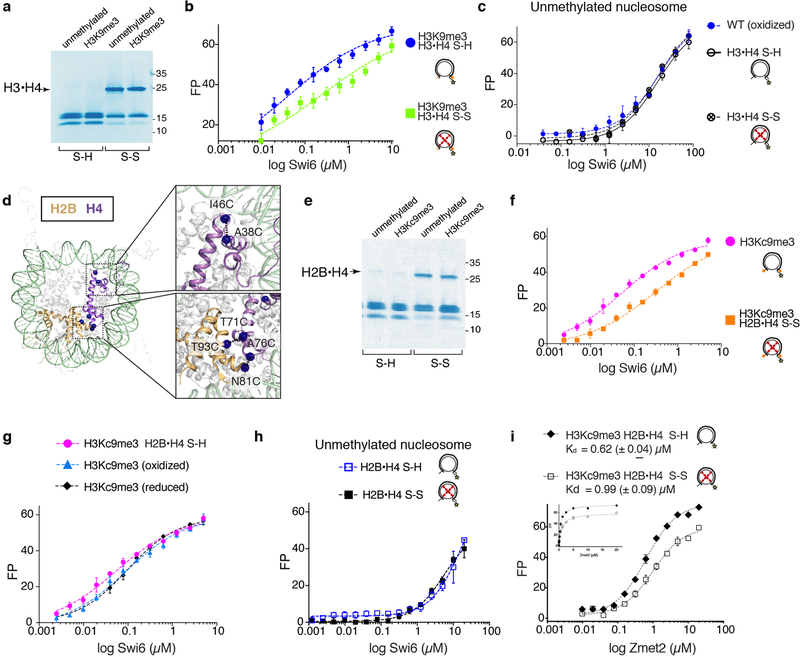
To test if conformational changes inside the octamer are important for the assembly of Swi6 on nucleosomes, disulfide linkages that lock the octamer into its ground state conformation were employed15,17. If conformational rearrangements within the octamer core are energetically coupled to Swi6 binding, then constraining these rearrangements is predicted to reduce Swi6 binding affinity (Extended Data Figs 5d, e). We introduced cysteines at H3-I62 and H4-A33 to lock this buried H3–H4 interface that showed major perturbations by NMR, HDX-MS and XLMS (Fig. 4a, Extended Data Fig. 5a). We generated nucleosomes with enzymatically methylated H3K9 and nearly 90% disulfide-linked histones (Extended Data Figs 6a, 7). The disulfide cross-link reduces Swi6 affinity for H3K9me3 methylated nucleosomes by ~5-fold, while it does not substantially affect binding to unmethylated nucleosomes (Extended Data Figs 6b, c, Table S1). Similar results were obtained with another set of disulfide linkages (Extended Data Figs 6d–h). These results indicate that Swi6 binding and octamer distortion are coupled in the context of specific H3K9me3-recognition.
Fig. 4: Octamer dynamics promote Swi6-mediated chromatin compaction and phase separation.
(a) Cysteines (red) introduced in H3 and H4 used for disulfide cross-links. (b) Array self-association assays using nucleosome arrays containing H3K9me3•H4 S-S (oxidized, green) and H3K9me3•H4 S-H (reduced, blue) octamers as a function of increasing Swi6. Dotted line represents C50, the Swi6 concentration at which 50% of arrays sediments. Measurements entailed at least three independent experiments and error bars reflect standard deviation from the mean (SD). (c) Bright-field representative images of the array-Swi6 mixtures analyzed in (b), showing phase-separated droplets. (d) DimerX mutation abrogates Swi6-array droplet formation. LoopX-array droplets show higher wetting properties as seen by flatter morphology. Cartoons of respective Swi6 proteins are shown. Red cross indicates mutation location. (c-d) Images are representative of at least three independent experiments. (e) Compared to WT cells, LoopX cells show reduced number of foci per cell and more diffuse nuclear staining. Top panel: Representative images of Swi6 WT or Swi6 LoopX mutant cells. Lower panel: Quantification of Swi6 foci in WT and LoopX cells. Experiments was repeated independently at least three times and >250 cells per condition were analyzed. (f) Model for Swi6-heterochromatin. Oligomerization of Swi6 (green) on H3K9me3 marked (red spheres) nucleosomes loosens histone-DNA and histone-histone contacts, increasing dynamics within the octamer core. Nucleosomes can then access larger ensemble of dynamically interconverting conformational states, increasing opportunities for transient weak multivalent interactions with other nucleosomes, including histone tails. Such interactions and nucleosome bridging by Swi6 enable chromatin compaction into liquid droplets. Black box: Nucleosomes in solution sample an ensemble of conformational states, of which the canonical conformation (orange) observed in the crystal structure is the most populated. Swi6 increases intrinsic histone core dynamics and accessibility. As a result, this increases the proportion of alternative conformational states of the nucleosome (blue).
Importantly, the binding of ZMET2, a plant DNA methyl-transferase that also binds H3K9me chromatin and bridges nucleosomes, is minimally affected by conformationally constrained nucleosomes (Extended Data Fig. 6i)18. We conclude that nucleosome core distortion is not a general property of H3K9me binding proteins and that Swi6’s ability to deform the octamer core relies on its specific interactions with the nucleosomal template.
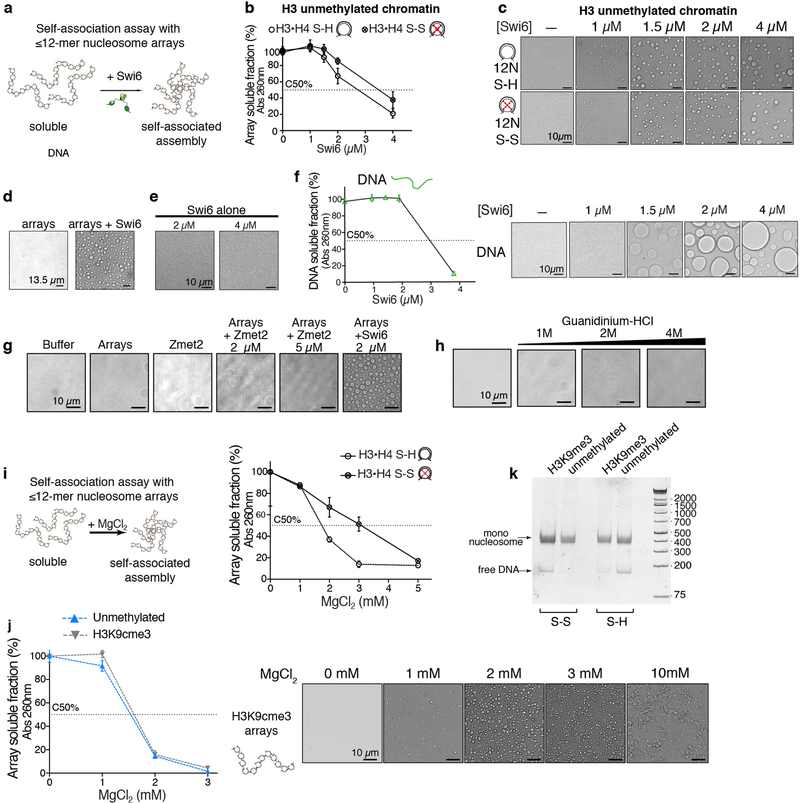
The dramatic increase in conformational dynamics observed within single nucleosomes raised the possibility that these dynamics play a role in chromatin compaction by Swi6. We addressed this possibility using a classic in vitro method that monitors inter-array self-association via pelleting (Extended Data Fig. 8a)19. We assembled 12 nucleosome-arrays containing the H3I62C–H4A33C cysteine pair. As observed previously for human HP1 proteins, we found that Swi6 pellets H3K9me3 nucleosome arrays in a dose dependent manner when the dynamics at the H3–H4 interface are not restrained (Fig. 4b)19. The concentration of Swi6 required to pellet 50% of the arrays (C50%) is ~2-fold greater for unmethylated vs. methylated chromatin (Fig. 4b, Extended Data Fig. 8b). Moreover, the different shapes of the concentration dependencies suggest that the effect of Swi6 is less cooperative in the absence of H3K9me.
When observed under a microscope, the Swi6-nucleosome array pellets appear as phase-separated condensates (Figs. 4c, and Extended Data Fig. 8c). Swi6 and nucleosome arrays formed these condensates under physiological conditions whereas Swi6 and mononucleosomes, Swi6 alone, or arrays alone did not (Extended Data Figs 8c–e). Similar to HP1α, Swi6 can also form droplets in the presence of DNA alone (Extended Data Fig. 8f)5. However, compared to arrays, a higher Swi6 concentration is required to form droplets. These data suggest that the multivalency provided by the nucleosome arrays as well as the specific Swi6-histones contacts are important to regulate phase separation driven by Swi6.
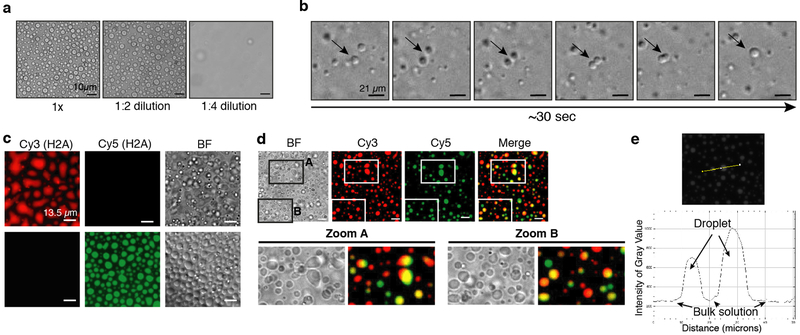
Further tests revealed that the Swi6-array condensates are liquid-like because they are reversible, undergo fusion and are capable of exchanging contents (Extended Data Figs 9a–d)20. Additionally, we observed a higher nucleosome concentration within the phase-separated condensate (Extended Data Figs 9c, e). These results provide direct experimental evidence that Swi6 compacts chromatin into liquid condensates.
Disulfide-linkage of the H3–H4 interface substantially impairs Swi6’s ability to pellet and phase separate H3K9me3 nucleosome arrays (Figs 4b, c), but not unmethylated arrays (Extended Data Figs 8b, c). Further, neither ZMET2 nor denaturant can promote phase separation of arrays under matched conditions (Extended data Figs 8g, h). These results indicate that phase separation of chromatin fibers relies on histone core dynamics specifically promoted by Swi6 in the presence of the H3K9me3 mark. Notably, the array experiments were performed using saturating Swi6 concentrations, indicating that, beyond enhancing Swi6 binding, octamer dynamics also promote inter-nucleosomal interactions (Table S1, see Methods). This conclusion was further validated by the observation that octamer dynamics are also required for chromatin sedimentation driven by Mg2+ (Extended Data Fig. 8i). Interestingly, at 2 and 3 mM Mg2+, chromatin arrays form spherical droplets, raising the possibility that Mg2+-driven compaction can also be coupled to phase separation (Extended Data Fig. 8j). This finding is consistent with previous in vitro studies showing lack of a defined structure in arrays that were cross-linked after Mg2+-dependent sedimentation21. Based on these results we conclude that the dynamic exposure of buried histone core residues promotes chromatin compaction and phase separation, and that HP1 proteins play an active role in promoting such exposure.
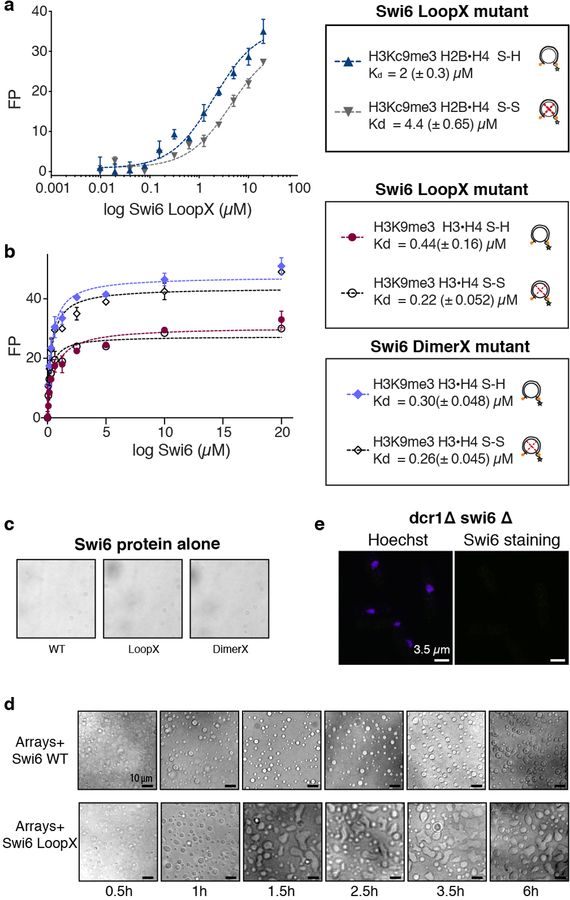
Previous work has underscored the dynamic nature of HP1 mediated heterochromatin foci in cells6,22–24. This dynamic behavior may be explained by the liquid-like properties that we observe for Swi6-chromatin droplets. To probe how in vitro Swi6-chromatin phase separation relates to in vivo heterochromatin organization, we used two Swi6 mutations that impair Swi6 oligomerization and gene silencing: the DimerX mutation, which inhibits dimer formation by the CSD; and the LoopX mutation, which reduces higher order oligomerization4,25 (Fig. 4d). Compared to wild-type (WT) Swi6, binding by both LoopX and DimerX to mononucleosomes is minimally affected by restraining histone dynamics, suggesting that these mutants are defective in promoting nucleosome distortion (Extended data Figs 10a, b). Further, DimerX fails to form phase-separated condensates with nucleosome arrays, even under saturating conditions for nucleosome binding (Fig. 4d, Extended data Fig. 10c). This finding directly correlates with previous in vivo observations that Swi6 heterochromatin foci are disrupted by mutating the CSD25.
In contrast, LoopX does not inhibit array phase separation, but forms larger droplets than WT Swi6 over time. Interestingly, these droplets show greater wetting behavior than the droplets with WT Swi6, implying a lower surface tension and reduced stability of the system (Fig. 4d, Extended data Figs 10c, d)20. The lower stability is consistent with the defective oligomerization of the LoopX mutant4. Correspondingly, in vivo, we observed that the LoopX mutation results in Swi6 foci that are fewer and more diffuse (Fig. 4e, Extended data Fig. 10e). We conclude that the formation of Swi6-heterochromatin condensates relies on both Swi6’s ability to oligomerize and promote octamer distortion. Further, changes in the intrinsic material properties of the Swi6-chromatin condensates in vitro correlate with changes in the formation of heterochromatin foci and gene silencing in vivo.
HP1 molecules have been shown to promote chromatin compaction by bridging across nucleosomes as dimers or oligomers3,26. Additionally, intrinsic chromatin compaction has been shown to involve interactions made by histone tails with nearby nucleosomes27. Our work uncovers another fundamental driver of chromatin compaction, namely the structural plasticity of the octamer core. We find that Swi6 leverages this plasticity to increase intrinsic histone core dynamics and accessibility by engaging the nucleosome core. The transient exposure of buried histone core residues can increase opportunities for weak multivalent interactions between nucleosomes, promoting formation of phase-separated liquid condensates20. We therefore propose that nucleosome disorganization by Swi6 together with the multivalency provided by Swi6 oligomerization drives the compaction of chromatin into phase-separated liquid droplets. This mechanism ultimately results in a less accessible chromatin state, consistent with the reduced histone turnover observed in S. pombe heterochromatin28.
Our model suggests new mechanisms for how HP1 ligands can regulate phase separation of heterochromatin: for example, by competing with the histone core for interaction with the CSD. Further, functional differences amongst HP1 orthologs and paralogs can arise from differences in their ability to bind and reshape nucleosomes. Namely, the different specificities of mammalian HP1 and Swi6 CSDs for histone and non-histone ligands may result in different ways of deforming the nucleosome core and thereby different mechanisms for fine-tuning heterochromatin phase separation7.
Our work also raises the possibility that histone modifications and histone variants tune chromatin compaction by directly affecting the conformational plasticity of the histone octamer. More generally, the phase separation and octamer deformation based mechanism for chromatin compaction proposed here can explain how the genome can be functionally organized without invoking structures such as the 30-nm fiber29. Indeed, consistent with such a possibility, recent reports suggest that nucleosomes in mitotic chromatin adopt non-canonical conformations30. Future studies will uncover how broadly octamer plasticity and phase separation regulate chromatin organization.
Methods
Protein expression, purification and isotope labeling
All the histones were expressed and purified from E. coli following published protocols31 with some modifications for the isotopically labeled histones. For expression of deuterated histones, M9 minimal media was made in deuterium oxide (D2O, Cambridge Isotope Ltd., CIL). The media contained 1,2,3,4,5,6,6-D7 Glucose (CIL or Sigma-Aldrich) as the sole carbon source. For labeling the histones at ILV residues, 13CH3-methyl group α-ketoisobutyrate and α-ketoisovalearate (CIL) were added to the M9 media as precursors32. To optimize coverage and spectral resolution, nucleosomes were labeled with isoleucine on histone H3 whereas histone H2B was labeled with leucine and valine. This labeling scheme maximizes the distribution of methyl probes across the nucleosome core and minimizes dephasing due to inter methyl-group dipolar interactions33. Deuteration and ILV labeling of the histones were confirmed by mass spectrometry. All the mutant versions of the histones were made by quick-change site-directed mutagenesis or the Gibson Assembly method. All mutations were confirmed by sequencing the plasmids.
Methyl lysine analogue (MLA) containing H3 histones at position 9 (H3KC9me3) were prepared as described previously34.
N-terminally 6X-His tagged Swi6 was purified from an E. coli as previously described3. Briefly, Swi6 was affinity purified with cobalt beads followed by TEV protease treatment to cleave the N-terminal 6x-His tag. After TEV cleavage, it was subjected to HiTrap Q HP column (GE Healthcare) and Superdex 200HR 10/300 column (GE Healthcare). Swi6 is stored in 25 mM HEPES pH 7.5, 150 mM KCl, 1mM DTT and 10% glycerol. For expression of deuterated Swi6, M9 minimal media was made in deuterium oxide (D2O, Cambridge Isotope Ltd., CIL) with 1,2,3,4,5,6,6-D7 Glucose (CIL) as the only carbon source.
15N-labelled CSD was expressed in M9 minimal media containing 15N-ammonium chloride as the sole nitrogen source. The CSD was purified as previously described9.
GST-Dim5 plasmid was kindly provided by Dr. Isao Suetake. GST-Dim5 was expressed in Rosetta cells in presence of 10 μM ZnSO4 as previously described35. Cells were lysed in 20 mM Tris pH 9.6, 500 mM NaCl, 0.05% NP40, 1 mM DTT and protease inhibitor EDTA-free. The protein is first purified on a GSTrap FF column (GE Healthcare), then on HiTrap Q HP column. Purified Dim5 is stored in 20 mM Tris pH 9.6, 150 mM NaCl, 1mM DTT, 5% glycerol.
H3K9 enzymatic methylation
Dim5 was dialyzed in the Methylation Buffer (MB): 100 mM Tris-Cl pH 9.6, 20 μM ZnSO4, 2 mM β-mercaptoethanol, 10 mM KCl, 10 mM MgCl2) plus 80 mM NaCl. Histone H3 C110A, I62C was resuspended in MB buffer at 0.1 mg/ml. The reaction condition was adapted from Mishima et al.36 and carried out at room temperature for 3 hours with 1:2 molar ratio histone:Dim5 in presence of 50 μM S-adenosylmethionine (SAM, NEB). The reaction pH is adjusted to 9.8 after SAM addition. The reaction is then mixed with 4 volumes of 9M deionized urea, and reagents added to reach 200 mM NaCl, 20 mM NaAc pH 5.2, 1 mM EDTA, 5 mM β-mercaptoethanol as final concentration. The sample pH is adjusted to 5.2 before loading it on a HiTrap SP HP cation exchange chromatography column (GE Healthcare), and eluted with a salt gradient. The histone is collected, dialyzed in H2O with 5 mM β-mercaptoethanol and diluted 10x with 0.1 % formic acid for Mass Spectrometry analysis.
Methylation was followed using a LC-MS-ETD-MS assay of the intact histone. The protein was separated over a 15 cm x 75 μm ID PepMap C18 column (Thermo) using a NanoAcquity UPLC system (Waters) running a gradient from 10–75% B (acetonitrile + 0.1% formic acid) at 300 nl/min over 40 minutes. Analysis was performed by an online Orbitrap Fusion Lumos (Thermo) mass spectrometer. Precursor ions were measured at 120,000 resolution in the Orbitrap (AGC: 1e6). Ions that were 15–22+ charged with intensity greater than 1e6 were isolated in the quadrupole (1.8 m/z isolation window) and fragmented by ETD for 4 msec. Product ions were measured in the Orbitrap at 30,000 resolution (AGC: 9e5, max injection time: 250 msec, 3 microscans).
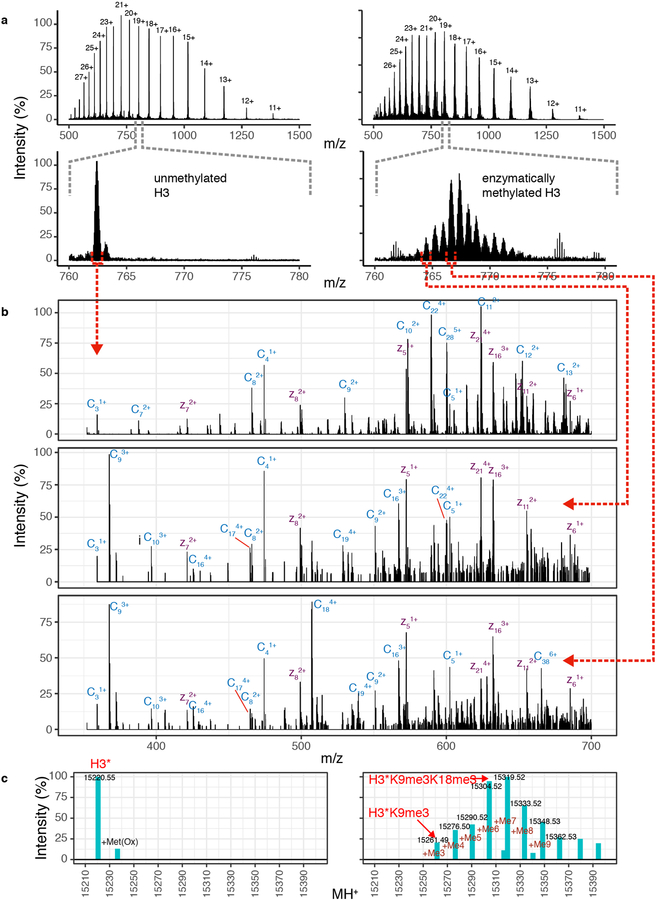
Precursor ion spectra were deisotoped using Xtract (Thermo). The deconvoluted M+H of the untreated histone (15220.442) was consistent with the expected mass of the H3-I62C mutant (15220.554) to 7.4 ppm and was about 11% oxidized on Methionine. Enzymatic methylation produced a pattern of deconvoluted M+H signals spaced 14 Da apart, although some of these signals were off by ±1 Da due to challenging monoisotopic peak detection. These were confirmed as methylations by bottom-up proteomic analysis of Lys-C digested sample. The methylated sample had no detectable unmethylated, monomethylated, or dimethylated species. All of the ions signals for which the ETD spectra were available showed 100% trimethylation at H3K9 based on their c-ions. Additional methylations could be localized to H3K18 and K3K14 (Extended Data Fig. 7).
Mononucleosome Assembly
Histone octamer was assembled from purified histones by salt dialysis as described37. The 601 positioning sequence (147 bp) DNA fragment was made using restriction enzyme digestion of a plasmid carrying multiple copies of 601 DNA fragment as described previously31. Fluorescence DNA was generated by PCR amplification using a primer 5’-labelled with 5,6 carboxy-fluorescein (IDT) followed by gel purification4. Nucleosomes were assembled using published gradient dialysis based protocols31. The purification of the nucleosomes was carried out on a 10 to 30% glycerol gradient. For NMR experiments, the glycerol gradient step was replaced by gel filtration purification with a Superdex-200 column.
Disulfide cross-linked nucleosomes were made using histone Cys variants, see Table S1 and S2. In order to maximize the likelihood of disulfide bridge formation, the cysteine pairs were selected so as to have an interatomic distance ≤5 Å between the sulfur atoms facing each other, to have side chains pointing toward each other in the structure and to form bonds in Coot (https://www2.mrc-lmb.cam.ac.uk/personal/pemsley/coot/). All the cysteine variant histone proteins were purified in the presence of excess dithiothreitol (DTT) during all the steps of protein purification. To purify the cysteine variants, only the gel filtration step was carried out, as previously described15. For reduced nucleosome, the assembly and subsequent purification were carried out in the presence of 3 mM TCEP in all the buffers. For disulfide-linked nucleosome formation, the octamer was subjected to oxidizing conditions. First, the octamer sample was diluted to a final octamer concentration of 0.5 mg/ml to minimize the formation of any intermolecular cross-links. Then it was subjected to 3 consecutive dialysis in refolding buffer (pH 8.5) in absence of any reducing agent as previously described15. Finally the solution containing octamers was mixed 4:1 with a solution containing 250 mM Tris-Cl pH 9, 2 M NaCl, 2.5 mM oxidized glutathione, 2.5 mM reduced glutathione and incubated 12 h at room temperature as previously described38. The sample was then dialyzed in refolding buffer with no reducing agent, before proceeding to nucleosome assembly. The cross-linking efficiency was confirmed by running the sample on a 15% non-reducing SDS gel.
12 nucleosome-array assembly
DNA was generated by restriction enzyme digestion of a plasmid containing 12 consecutive 601s spaced by 20 bp, followed by gel purification. The reconstitution of nucleosome arrays followed the protocols described with some modifications39. Histone octamers are combined in equimolar amount with 12-mer DNA (12 repeats of the 601 DNA sequence separated by 20-bp linkers). Final dialysis against 10 mM TEK (10 mM KCl, 10 mM Tris pH 7.5, 0.1 mM EDTA) was performed overnight. After assembly, arrays were usually used for experiments within 1–2 d after assembly. Since the 601 repeats in the 12-mer DNA sequence are separated by HpaI restriction enzyme sites, quality of assembly was assessed by HpaI digestion followed by native gel. Over-assembly was avoided by ensuring that >95% of the digested fragments migrated as mononucleosomes rather than slower migrating species. We note here that the quality of the arrays used in these studies had to be carefully controlled to avoid over assembly of histone octamers, as we noticed that over-assembled arrays displayed aberrant and non-reproducible precipitation behavior (Extended Data Fig. 8k).
Chromatin self-association assay
Swi6-mediated array self-association assays were performed at 40 nM nucleosome arrays in 10 mM Tris, 0.1 mM EDTA, 75 mM KCl, pH 7.8. Briefly, 5 μl of 2X array sample (80 nM) were incubated with 5 μL of 2X Swi6 solution for 20 min at 22 °C. Samples were centrifuged at 10,000 × g for 10 min at 22 °C, and the supernatants were transferred to a fresh tube. 5 μl of the supernatant was read at 260 nm. At least three technical and biological replicates were performed for each experiment. Mg2+ self-association assays were performed in TE 0.1 (10 mM Tris pH 7.8, 0.1 mM EDTA).
Liquid droplets microscopy
Microscopy of the droplets was done on a Leica Axiovert 200M microscope using a 20X air objective and on a Zeiss Axiovert 200M Fluorescence microscope. Samples were imaged on a 384 well plate, glass bottom, coated with Peg-silane (Laysan Bio). Image analysis was done in ImageJ.
Fluorescence polarization binding measurement
Nucleosome polarization assays were conducted in buffer containing 0.02% NP-40, 150 mM KCl, 20 mM HEPES pH 7.5, 1 mM DTT at 22 °C. Each anisotropy sample contained a final nucleosome concentration of 5 nM and the Swi6 concentration was varied. The reaction was incubated 30 min at 22 °C and fluorescence polarization was measured on an Analyst HT (Molecular Devices). Data points from three independent Swi6 dilution curves were averaged and standard errors calculated. The following binding model was used to derive Kd:
in which, Y is the fluorescence polarization signal observed; X is Swi6 concentration; FPmin is the fluorescence polarization signal for the probe alone; FPmax is the fluorescence polarization signal at saturating protein concentration; N is the Hill coefficient.
Nucleosome NMR sample preparation and spectroscopy
The nucleosome storage buffer was exchanged with NMR buffer by dialysis. The NMR buffer was made in D2O and contained 70 mM NaPO4 (pD 7.6), 10 mM deuterated DTT. The nucleosome concentration used was 50 μM. For the experiment involving Swi6-nucleosome complex, Swi6 was buffer exchanged in the NMR buffer. Nucleosome and Swi6 were mixed in a 1:6 molar ratio to get four Swi6 molecules per nucleosome. The Swi6 concentration was saturating in the concentration regime used.
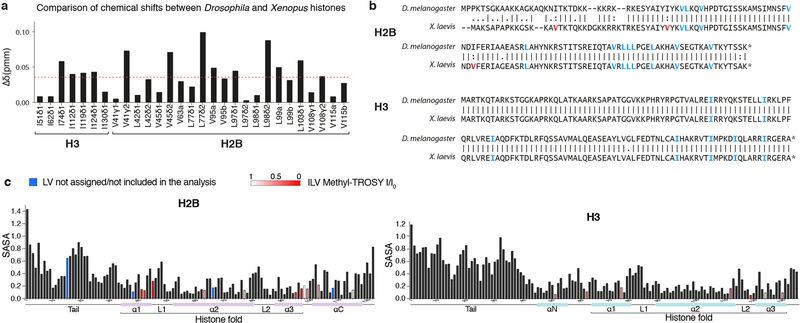
All the NMR spectra were acquired at 303K on a Bruker 600 MHz spectrometer equipped with a Cryoprobe. Recorded spectra were processed using the NMRPipe software and displayed using SPARKY40,41. The assignments were transferred from published spectra of Drosophila nucleosome by inspection42. The two sets of spectra were remarkably similar owing to sequence conservation between Drosophila and Xenopus histones H3 and H2B (Extended Data Fig. 4). A comparison of the chemical shift positions across Drosophila and Xenopus histone spectra suggested very small differences between the two, with the average Δδ (ppm) being <0.05 (Extended Data 4a). Buffer and temperature were selected based on optimal conditions screened by fluorescence polarization.
The concentrations of Swi6-mono-nucleosome complexes used for the NMR experiments did not display detectable aggregation or phase separation as evaluated using two different metrics. Firstly, analytical ultracentrifugation carried out at comparable concentrations of the complex did not detect higher-order species beyond four Swi6 molecules bound to a mono-nucleosome. Secondly, the NMR data did not show significant overall signal loss for up to ~60 hours of measurement time. Precipitation or aggregation is expected to result in signal loss due to overall broadening of all the cross-peak signals.
CSD NMR
Binding experiments were carried out with 80 μM 15N-CSD and 160 μM H2B peptide (dissolved in H2O, pH adjusted to 7.8) in 150 mM KCl, 20 mM HEPES pH 7.8, 2 mM DTT. HSQC spectra were recorded at 298K on a Bruker Avance DRX500 spectrometer.
CSPs were calculated from the equation:
where the factor 0.2 is used as a scaling factor for nitrogen spectral width.
HDX-MS
Solution-phase amide HDX experiments were carried out with a fully automated system described previously with slight modifications43. 5 μl of apo-nucleosome or nucleosome-Swi6 complex (1:4) was mixed with 20 μL of D2O-containing HDX buffer (20 mM Hepes pH 7.5, 150 mM KCl, 10% glycerol, and 10 mM DTT) and incubated at 22°C for a range of time points (0s, 10s, 102s, 103s, 104s or 105s). Each HDX experiment was carried out in triplicate with a single preparation of each protein-ligand complex. Following on-exchange, unwanted forward or back exchange was minimized and the protein was denatured with a quench solution (5 M urea, 50 mM TCEP, and 1% v/v TFA pH 2.5) at 1:1 ratio to protein. Samples were then passed through an in-house prepared immobilized pepsin column at 50 μL min−1 (0.1% v/v TFA, 15 °C) and the resulting peptides were trapped on a C8 trap column (Hypersil Gold, Thermo Fisher). The bound peptides were then gradient-eluted (5–50% CH3CN w/v and 0.3% w/v formic acid) across a 1 mm × 50 mm C18 HPLC column (Hypersil Gold, Thermo Fisher) for 5 min at 4 °C. The eluted peptides were then analyzed directly using a high resolution Orbitrap mass spectrometer (Q Exactive, Thermo Fisher). To identify peptides, MS/MS experiments were performed on Q Exactive Orbitrap mass spectrometer over a 70 min gradient. Product ion spectra were acquired in a data-dependent mode and the five most abundant ions were selected for the product ion analysis. The MS/MS *.raw data files were converted to *.mgf files and then submitted to Mascot (Matrix Science, London, UK) for peptide identification. Peptides with a Mascot score of 20 or greater were included in the peptide set used for HDX detection. The MS/MS Mascot (Matrix Science, London) search was also performed against a decoy (reverse) sequence and false positives were ruled out. The MS/MS spectra of all the peptide ions from the Mascot search were further manually inspected and only the unique charged ions with the highest Mascot score were used in estimating the sequence coverage. Peptic digestion of nucleosomes yielded ~70% sequence coverage of the histone core and minimal coverage on the histone tails. By observing overlapping peptic peptides we could unambiguously assign the HDX-MS data to the histones44. Percent deuterium exchange values for peptide isotopic envelopes at each time point were calculated and processed using HDX Workbench45. The intensity weighted mean m/z centroid value of each peptide envelope was calculated and subsequently converted into a percentage of deuterium incorporation. This is accomplished by determining the observed averages of the undeuterated and using the conventional formula described elsewhere46. Corrections for back-exchange were made on the basis of an estimated 70% deuterium recovery and accounting for 80% final deuterium concentration in the sample (1:5 dilution in D2O HDX buffer). Deuterium uptake for each peptide is calculated for each of time points and the difference in % D values between the Apo-nucleosome and Nucleosome-Swi6 samples is shown as a heat map with a color code given at the bottom of the figure.
Cross-linking Mass Spectrometry
Trimethyl lysine analog H3K9 mononucleosomes (85 µg, 20 µM) either with or without Swi6 (80 µM) in buffer A (20 mM Hepes, 150 mM KCl, 2 mM DTT, pH 7.5) were reacted with 25 µM EDC (added as 10x stock in buffer A) and 0.5 µM N-hydroxysulfosuccinimide (added as 15x stock in buffer A) for 60 minutes at 25°C. The reactions were quenched by adding 50 mM Tris-base and 20 mM β-mercaptoethanol and incubating for 15 minutes at 25°C. Samples were acetone precipitated and washed once with cold acetone. The pellet was resuspended in 8M Urea, 10 mM TCEP, 100 mM ammonium bicarbonate and heated at 56°C for 20 minutes, followed by alkylation with 20 mM iodoacetamide for 45 min at room temperature. The sample was diluted 6-fold with 100 mM ammonium bicarbonate and digested with 1:25 trypsin for 4 hours at 37°C followed by addition of a second aliquot of trypsin and overnight digestion.
Cross-linked peptides were desalted, fractionated by size-exclusion chromatography (SEC), and analyzed by LC-MS using a previously described method47. Briefly, trypsin digests were acidified to 0.2% TFA, desalted, and run over a Superdex Peptide PC 3.2/300 SEC column (GE Healthcare). SEC fractions eluting between 0.9 ml and 1.4 ml were dried and resuspended in 0.1% formic acid for LC-MS. Each fraction was separated over a 15 cm x 75 μm ID PepMap C18 column (Thermo) using a NanoAcquity UPLC system (Waters) and analyzed by a Q-Exactive Plus mass spectrometer (Thermo). The top 10 most abundant, triply charged and higher precursor ions (measured at 70,000 resolution) were selected for HCD (NCE: 24.5) and measured at 17,500 resolution.
Peak lists were generated using Proteome Discoverer 1.4 (Thermo) and searched for cross-linked peptides with Protein Prospector 5.17.2 against a target database containing Swi6 from S. pombe plus the four core histone sequences from X. laevis concatenated with a decoy database containing 10 randomized copies of each target sequence (total database size 60 sequences)48. Tri-methylation of histone H3 at K9 was treated as a constant modification as was loss of the initiator methionine and carbamidomethylation of cysteine. Methionine oxidation, peptide N-terminal glutamine to pyroglutamate formation, acetylation at the protein N-terminus, and mis-annotation of the monoisotopic peak (1Da neutral loss) were treated as variable modifications. EDC was designated as a heterbifunctional cross-linking reagent with specificity of aspartate, glutamate, and the protein C-terminus on one side and lysine and the protein N-terminus on the other with a bridge mass corresponding to loss of H2O. A mass modification range of 400–5000 Da was specified on these residues and 85 product ion peaks from the peaklist were used in the search. Precursor and product ion tolerances were 10 and 25 ppm respectively.
Cross-linked spectral matches (CSMs) were classified using a support vector machine based scoring model as described previously47. Crosslinked residue pairs were reported that had Score Difference > 5, detoo (SVM) Score > 0.1, peptide length > 4, and number of spectral counts >= 1. The final residue-pair level false discovery rate was 0.5%. Crosslink spectral counts were assigned to reside-pairs and domain-pairs in a way that normalized for ambiguous site-localization as previously detailed47. Solvent accessible surface values were generated from surface calculation using UCSF Chimera and the nucleosome structure for pdb code 1kxf.
Sedimentation Velocity Analytical Ultracentrifugation
Sedimentation velocity experiments were conducted using an analytical ultra-centrifuge (Beckman Coulter) equipped with an absorption optical scanner. The binding reaction was set up such that (i) both nucleosome and Swi6 concentrations were above the K1/2 value measured by native gel and (ii) the Swi6 concentration was sufficient to titrate all the nucleosomes as assayed by native gel shift. Solution density (r) and solution viscosity (h) were calculated in SEDNTERP49. Data were analyzed using the Sedfit software and plots were generated using GUSSI49,50. Experiments were performed with 200nM dinucleosome and 10 µM Swi6, in 20 mM Hepes pH 7.6, 150 mM KCl, 1 mM DTT, at 24 °C, spinning at 36000 rpm for 8hours. The continuous c(s) and c(s,bimodal fr) analysis was used to study the sedimentation properties and the molar mass of the dinucleosome and dinucleosome-Swi6 samples, respectively.
S. pombe growth and immunostaining
Cells were grown to mid log phase, OD 600nm =0.2–0.4/ml in supplemented YE medium. The culture was made 1.2 M with respect to sorbitol by adding an equal volume of 2.4 M sorbitol in PBS about 5 minutes prior to fixation. Cells were fixed for 30 minutes at 20°C in 3.8% para-formaldehyde. Cells were washed in PEMS buffer and cell walls were digested by 1.0 mg/ml zymolyase 100T for 70 minutes at 37°C, lysed by 5 minutes incubation in PEMS containing 1% Triton X-100 and then washed three times in PEM buffer before incubation for 30 minutes in PEM buffer with 1% bovine serum albumin, 0.1% sodium azide and 100 mM lysine hydrochloride (PEMBAL) buffer. Rabbit Swi6 antibody was used for overnight incubation with cells in PEMBAL at 4°C. Stained cells were washed three times in PEMBAL and then incubated with secondary antibody for 1h at room temperature. Staining with Hoechst was performed before mounting cells on slides. Microscopy was done on a Nikon Ti confocal microscope using a 100X objective. Image analysis was done in ImageJ. Cells were authenticated by immunostaining.
S. pombe strains used in this study are described in Canzio et al. 2013:
PM0251: P(h+), ura4-DS/E, ade6-M210, leu1–32, imr1L(NcoI)::ura4, otr1R(Sph1)::ade6
DC27: PM0251, swi6Δ:: KanMX:: KanMX, dcr1Δ:: NatMX
DC30: PM0251, swi6:: KanMX:: KanMX, dcr1Δ:: NatMX
DC32: PM0251, swi6 (R93A-K94A):: KanMX:: KanMX, dcr1Δ:: NatMX
Extended Data
Extended Data Figure 1:
Swi6 interaction with chromatin. (a) Model for HP1-mediated heterochromatin assembly: the bridging model relies on HP1’s ability to oligomerize across nucleosomes; the phase separation model relies on HP1’s ability to form phase separated assemblies that can sequester chromatin. The molecular link between these two models is unclear. (b) Sedimentation Velocity-Analytical Ultracentrifugation (SV-AUC) on H3Kc9me3 dinucleosomes. The continuous c(s) distribution is shown as a two-dimensional distribution. X- axis, sedimentation coefficient s; y-axis, normalized c(s). c(s) is the sedimentation coefficient distribution. Table shows measured masses using a continuous function c(s) distribution versus theoretically predicted masses. (c) SV-AUC on H3Kc9me3 dinucleosomes with Swi6. Data representation and table are as in (b). Analysis is performed using a continuous function c(s) with a bimodal f/f0 distribution. The peak at s = 21.24 corresponds to the Swi6-dinucleosome complex. The peak at s = 4.5 corresponds to free Swi6 dimers, as previously shown in Canzio et al. 2013. Analysis of raw SV-AUC data for (d) dinucleosome alone and, (e) dinucleosome+Swi6 complex showing that: (i) the fit lines describe the boundary data well; (ii) the rmsd is below 0.01; (iii) the residual bitmap has very few diagonal features indicating the good quality of the fit. For (b-d), measurements are representative of two independent experiments.
Extended Data Figure 2:
Swi6-nucleosome cross-linking analysis. (a) EDC cross-linking network between histones and Swi6. Histones tails and core regions are indicated, as well as the different Swi6 domains. (b) Interactions between Swi6 domains, histone tails, and core domains mapped by cross-link spectral counts. The number of cross-linked MS spectra matching to a given domain pair is indicated by the color of the tile as well as the numbers given. (c-d) Analysis as in (a-b) performed only on the structured domains of Swi6 (CSD and CD) and on the folded core of histones. (e) The Swi6 CSD binds to H2B core. Superposition of 1H-15N HSQC spectra of Swi6 CSD with (black) and without (red) H2B peptide. Measurements are representative of three independent experiments. The sequence of the H2B peptide is shown. (f) Chemical shifts perturbation (CSP) for assigned resonances between Swi6 CSD alone and with the addition of the H2B peptide shown in panel (e). (g) Intra-nucleosome cross-links are altered by Swi6 binding. Each axis maps residue position within a histone, while the red dashed lines indicate the boundaries between histone tail and core domains. A cross-link is represented by a filled circle between two residues, with area proportional to the number of MS2 spectra identifying a given cross-link. Cross-links found in the free nucleosome state are in green, while cross-links found in the Swi6 bound nucleosome are in blue. The red squares highlight changes in the H3-H3 and H4-H4 cross-linking patterns between the free and bound nucleosome states. (h) New histone-histone cross-links detected only with Swi6 binding involve buried regions of the nucleosome. The plots report the solvent-accessible surface area SASA (y-axis) vs. residues number (x-axis) for each histone. Cross-linkable residues (E, D, K) are indicated by a circle. Empty circles represent residues that do not show any cross-linking and filled circles represent cross-linked residues. The area of the circle reports the number of cross-linked spectra with one peptide mapped to a particular residue. The red ovals highlight buried residues that were observed to cross-link only in the presence of Swi6. Analysis in a-d, g, and h is performed on one of two XLMS data sets. Similar results were obtained with the other data set that used the BS3-crosslinker.
Extended Data Figure 3:
HDX-MS with nucleosome-Swi6 complex and nucleosomes alone. (a) Experimental scheme for HDX-MS. (b) Changes in deuterium incorporation are reported for every histone at five different time points. Each horizontal bar represents an individual peptide, and peptides are placed beneath the schematic of secondary structure elements of the histones. Peptides are colored according to the legend, showing the mean of deprotection derived from multiple peptides obtained from one of two independent experiments with similar results. Specifically, more than a 35% increase in deuterium incorporation compared to nucleosomes alone is observed in: (i) residues 74–90 of H3, corresponding to a portion of helix α1 and α2, and the connecting loop 1; (ii) residues 48–61 of H3, corresponding to helix αN of H3; (iii) and residues 85–102 of H4, corresponding to helix α3. Other regions with a significant increase in deuterium uptake are the C-terminal region and helix α2 of H2A (residues 113–129 and 40–51), the C-terminal of H2B (helix αC, residues 104–122), and H4 helix α2 and loop 2 (residues 50–60 and 72–84). These increases in the rates of deuterium incorporation caused by Swi6 binding indicate extensive changes in the backbone hydrogen bonding of histones within the nucleosome and partial unfolding of the helices in the histones. (c) Kinetics of deuterium uptake of example histone peptides (residue numbers indicated) over the time course. Data are mean and SD of multiple peptides obtained from one of two independent experiments with similar results. Error bars not shown for points when shorter than the height of the symbol.
Extended Data Figure 4:
Where the factor of 0.2 is used as a scaling factor for the carbon spectral width. The average value of Δδ is shown as a red dashed line. Experiments were performed two times to optimize conditions; data from one experiment are reported. (b) Amino acid sequence alignment of Drosophila and Xenopus H2B and H3 histones. ILV residues conserved between the two species are colored in blue, and in red are ILV residues not conserved. I residues are fully conserved between H3 histones. LV are conserved between H2B histones, except for V15, V38 and V66, which are present only in the Xenopus histone. V15, V38 and V66 are not included in our NMR analysis. (c) Quantification of the solvent-accessible surface area (SASA) of the residues indicated in x-axis in histone H2B (left) and H3 (right). SASA was calculated from the PDB structure file 1KX5 using the program POPS. The SASA values are for the entire residue and represent fraction of exposed surface area. Bars corresponding to ILV residues are colored in red with shading according to the legend, reflecting changes reported from the methyl-TROSY experiments due to Swi6 binding. ILV residues not assigned or not included in the analysis are colored in blue. The schematic of secondary structure elements is shown below the x-axis.
Extended Data Figure 5:
Swi6 disorganizes the nucleosome core. (a) Mapping of the Swi6-induced changes in the nucleosome structure (PDB 1KX5), as detected by XLMS (Fig.1), HDX-MS (Fig. 2), methyl-TROSY NMR (Fig. 3). Residues H3 I51 and I62 are shown as spheres. The figure highlights how the three different techniques consistently reported alterations in the same regions of the octamer. (b) In the nucleosome crystal structure, H2B is colored in light orange, H2B peptide used in the CSD 1H-15N HSQC NMR experiment is in cyan and Leu/Val residues analyzed in the nucleosome methyl-TROSY NMR are represented as spheres and colored according to the extent of broadening determined by Ibound /Ifree. The zoomed panel shows the location of the H2B peptide tested for binding to the CSD. (c) Model depicting the effect of Swi6 on nucleosome conformations. Nucleosomes in solution can sample an ensemble of conformational states, of which the canonical conformation observed in the crystal structure is the most populated and lowest energy state. Swi6 increases nucleosome dynamics and promotes nucleosomes alternative states. In absence of Swi6 the equilibrium is pushed toward the nucleosome in the canonical state (top). Swi6 increases nucleosome dynamics and promotes formation of a larger ensemble of nucleosomal conformations (bottom). (d) Model of how disulfide cross-links in the nucleosome core prevent nucleosome core dynamics. (e) This thermodynamic cycle integrates the different states of the nucleosome and nucleosome-Swi6 complexes implied by our work. In this thermodynamic cycle, the overall process involves a thermodynamic coupling between Swi6 binding and increased nucleosome dynamics. Path 1 shows how the intrinsic equilibrium between static and dynamic nucleosome states can be driven towards a dynamic nucleosomal state by Swi6 binding, while path 2 shows how binding by Swi6 to a static nucleosome can drive the equilibrium of the Swi6-nucleosome complex towards a more dynamic nucleosome state. Both paths lead to the same final state where the conformation of the Swi6 bound-nucleosome is different from the one observed in the crystal structure (PDB 1KX5). Importantly, both paths are thermodynamically equivalent.
Extended Data Figure 6:
Nucleosome octamer dynamics are important for Swi6 nucleosome binding. (a) Representative non-reducing SDS-PAGE showing nucleosome with H3–H4 histone disulfide linked (H3•H4 S-S) or reduced (H3•H4 S-H). ~90% of H3 and H4 are disulfide-linked in both the methylated and unmethylated nucleosomes. These are the cross-linking sites used in Fig. 4. For gel source data, see Supplementary Figure 1. (b) Nucleosome binding assays by fluorescence anisotropy showing reduced binding of Swi6 to H3K9me3 nucleosomes containing H3–H4 disulfide-linked octamer (H3•H4 S-S vs. H3•H4 S-H). (c) Fluorescence anisotropy measuring Swi6 binding to unmethylated nucleosome, H3•H4 S-H and S-S, showing that disulfide linkages have no effect on Swi6 binding to unmethylated nucleosome. (d) Additional residues in the H2B and H4 mutated to Cys for generating dynamically restrained octamers are represented with spheres. (e) Representative non-reducing SDS-PAGE showing nucleosome with H2B-H4 histone disulfide linked (H2B•H4 S-S) or reduced (H2B•H4 S-H). ~50% of H2B and H4 are disulfide-linked in both H3Kc9me3 and unmethylated nucleosomes. For gel source data, see Supplementary Figure 1. (f) Nucleosome binding assays by fluorescence anisotropy showing reduced binding of Swi6 to H2B-H4 disulfide-linked octamer (H2B•H4 S-S). (g) Fluorescence anisotropy experiments showing comparable Swi6 binding to H3cK9me3 non-oxidized, H3cK9me3 oxidized and H2B•H4 S-H mononucleosomes. These results show that the oxidation process does not alter Swi6 binding to Cys-devoid nucleosomes and that the presence of reduced Cys does not affect Swi6 binding either. (h) Fluorescence anisotropy measuring Swi6 binding to unmethylated nucleosome, H2B•H4 S-H and S-S, showing that disulfide linkages have no effect on Swi6 binding to unmethylated nucleosomes. (i) Nucleosome binding assays by fluorescence anisotropy showing that Zmet2 binding to H2B-H4 disulfide-linked octamer (H2B•H4 S-S) is not significantly affected. (b, c, f, g h, i) FP, fluorescence polarization units. Measurements entailed at least three independent experiments and error bars reflect standard deviation from the mean (SD).
Extended Data Figure 7:
Characterization of H3 Enzymatic Methylation by Dim5. Methylation of Histone H3 was followed by online LC-MS-ETD-MS of the intact proteins. (a) Charge state envelope of untreated (left panel) and methylated (right panel) H3. The lower panel, focused on a single charge state, shows disappearance of the starting material and the formation of higher mass species, spaced 14 Da apart. (b) ETD-MS of precursor ions corresponding to unmethylated H3 (top), H3-K9me3 (middle) and H3-K9me3-K18me3 (bottom). The rationale for these assignments is based on the precursor mass values and by the product ions. Z-ions (purple) do not change between the three spectra, while the pattern of c-ions (blue) are mass shifted by 42 Da and charge-state shifted by 1+ at C9 between the top and middle/bottom panels, and again at C18 between the middle and lower panels. These assignments are further validated by bottom-up proteomics analysis of Lys-C digested samples (not shown). (c) The precursor ion spectra in (a) were deconvoluted using Xtract, which models both the charge states and the isotope distributions. Deconvoluted MH+ values are consistent with multiple methylation states (due to the difficulty of modeling isotope distributions from large proteins, particularly as there is some underlying oxidation, Xtract sometimes picks the wrong monoisotope). Deconvoluted intensities show that the enzymatically treated sample (right) contains no significant unmethylated H3 or mono- and di-methylated H3K9. While, 100% of analyzed sample is tri-methylated at H3K9, additional methylations occur at H3K18 as noted above. The sample analyzed here was used to carry out all the experiments to minimize variability.
Extended Data Figure 8:
Nucleosome disorganization and chromatin phase separation are specifically driven by Swi6. (a) Schematic of chromatin self-association assay. (b-c) Restraining octamer dynamics do not affect the condensation of unmethylated chromatin in liquid droplets. Self-association assays in (b) are performed with unmethylated nucleosome arrays containing H3•H4 S-S (oxidized) and H3•H4 S-H (reduced) octamers as a function of increasing concentration of Swi6. The dotted line represents the C50, which is the concentration of Swi6 at which 50% of arrays sediments. In (c), bright-field representative images of the array-Swi6 complex analyzed in the top panel show that the formation of phase-separated droplets is not affected by the disulfide linkages in absence of H3K9me3. (d) Swi6 induces chromatin condensation in liquid droplets at physiological conditions, 150 mM KCl, 30°C, 2 μM Swi6. (e) Swi6 alone does not form phase-separated liquid droplets. Bright-field representative images of the Swi6 alone. (f) Left: self-association assay performed with naked DNA (601×12 ~2 kbp) in presence of increasing concentration of Swi6. Right: bright-field representative images of the DNA-Swi6 complex analyzed in the left panel, showing the formation of phase-separated droplets. (g) Zmet2 does not form phase-separated assemblies alone and it does not promote chromatin condensation in liquid droplets. Experiments are done at 40 nM nucleosome arrays, with 2 and 5 μM of Zmet2. Bright-field images of buffer only and Swi6-chromatin droplets are shown as controls. (h) Titration of the denaturant guanidinium-HCl into nucleosome arrays does not promote formation of phase-separated droplets, indicating that Swi6 specifically disorganizes the nucleosome core. (i) Disulfide cross-links between H3 and H4 impair Mg2+-driven self-association of nucleosome arrays, indicating the role of nucleosome core dynamic for inter-nucleosome interactions. (j) Left: Mg2+-driven self-association of unmethylated and H3K9cme3 arrays are comparable. Right: Representative bright-field images of the H3K9cme3 array sedimentation analyzed in the left panel, showing the formation of rounded phase-separated condensates at 2 and 3 mM Mg2+. The assay is performed in TE 0.1 (see Methods) and 75 mM KCl. (k) Nucleosome arrays quality controls, showing comparable octamer saturation and absence of over- and under- assemblies. Arrays are digested with HpaI, run on a native acrylamide gel and DNA is stained. For source gel data, see Supplementary Figure 1. All arrays used in this study conformed to the quality standard shown in (k). (b-i, j) Measurements and images entailed three independent experiments; error bars reflect standard deviation from the mean (SD).
Extended Data Figure 9: Swi6-chromatin assemblies present liquid-like properties.
(a) Chromatin-Swi6 condensates are reversible upon dilution. (b) Chromatin-Swi6 droplets fuse within seconds after incubation. The time course depicted is 30 seconds. (c) Chromatin is included in Swi6-induced condensates. Nucleosome arrays are assembled with H2A-Cy3 or H2A-Cy5 and H3Kc9me3 octamers. Images showing Cy-3 or Cy5- labeled chromatin mixed with Swi6 separately, before being incubated together. (d) Images show condensates 30 minutes after mixing Cy3 and Cy5 pre-formed droplets. By ~1 hour most of the droplets contains homogeneous labeling with both dyes. Doubly labeled droplets indicate chromatin exchanges between the pre-formed condensates. (e) Quantification of fluorescence intensity done in ImageJ using the Plot Profile function that creates a plot of intensity values across the yellow line shown in the left panel. Higher octamer concentration within the droplets as compare to the bulk of the solution is detected. Images are representative images from at least three independent experiments.
Extended Data Figure 10:
Swi6 DimerX and LoopX are defective in promoting octamer distortion and forming heterochromatin foci in S. pombe. (a) Nucleosome binding assays by fluorescence anisotropy showing that binding of Swi6 LoopX to H3K9cme3 nucleosomes is not affected by H2B-H4 histone disulfide linkage. H2B•H4 S-S are oxidized nucleosome, H2B•H4 S-H are reduced nucleosomes. Kd are shown. (b) Nucleosome binding assays by fluorescence anisotropy showing that binding of Swi6 LoopX and DimerX mutants to H3K9me3 nucleosomes is not affected by H3–H4 histone disulfide linkage. H3•H4 S-S are oxidized nucleosome, H3•H4 S-H are reduced nucleosomes. Kd are shown in the black boxes. (c) Swi6 WT, LoopX and DimerX proteins do not form liquid droplets in absence of chromatin. 4 µM concentration. (d) Bright-field images showing droplet wetting over time. Swi6-chromatin condensates are incubated at room temperature and images are collected at the indicated times (h = hours). Condensates are imaged on a bottom glass plate coated with Peg-silane (see Methods). (e) Swi6 immunofluorescence on dcr1Δ swi6Δ S. pombe cells shows absence of Swi6 staining, confirming the specificity of the anti-Swi6 antibody. Images in (c-e) are representative images from at least three independent experiments. In (a) and (b), measurements entailed three independent experiments, error bars reflect standard deviation from the mean (SD).
Supplementary Material
Acknowledgements:
We thank Michael Rosen for sharing data prior to publication. We thank J. Tretyakova for help and training in histone purification; RS. Isaac for providing initial nucleosomal array DNA; J. Pelton and the QB3 NMR Facility at the University of California Berkeley for help with collecting and processing NMR data; M. Keenen for providing Peg-silane coated slides and protocols; C. Stoddard for providing ZMET2; S. Catania and H. Madhani for guidance in S. pombe experiments; D. Canzio for help with AUC; the Nikon Imaging Center at UCSF and Kari Herrington for training and help with microscope data acquisition. We thank L. Hsieh, N. Gamarra, D. Canzio, A. Larson, E. Nora, H. Madhani for helpful comments on the manuscript and members of the Gross and Narlikar laboratories for stimulating discussion. This work was supported by grant NIH NCATS UL1 TR000004 to SS, JDG and GJN; Sandler Family Foundation Program for Breakthrough Research Post-doctoral Fellowship to SS; NIH NIGMS R01 GM121962 to JDG; NIH R01GM108455 and GM127020 to GJN; PBBR New Frontier Research Award to GJN; Dr. Miriam and Sheldon G. Adelson Medical Research Foundation to ALB, NIH NIGMS P41GM103481 to ALB; Instrumentation Grants- Qexactive Plus (Thermo): NIH S10D016229 to ALB, Orbitrap Fusion Lumos (Thermo): University of California, San Francisco (Program for Breakthrough Biomedical Research (PBBR).
Footnotes
Competing interests
The authors declare no competing financial interests.
Data availability: All relevant data are included in the main manuscript, Extended Data figures. Annotated XLMS Spectra are available using MS-Viewer at: http://msviewer.ucsf.edu/prospector/cgi-bin/msform.cgi?form=msviewer
Using the search key: 9ojpmsdzk5. Any additional data are available from the corresponding author upon reasonable request.
References
- 1.Stephens AD et al. Chromatin histone modifications and rigidity affect nuclear morphology independent of lamins. Mol. Biol. Cell 29, 220–233 (2018). [DOI] [PMC free article] [PubMed] [Google Scholar]
- 2.Allshire RC & Madhani HD Ten principles of heterochromatin formation and function. Nat. Rev. Mol. Cell Biol 19, 229–244 (2018). [DOI] [PMC free article] [PubMed] [Google Scholar]
- 3.Canzio D et al. Chromodomain-mediated oligomerization of HP1 suggests a nucleosome-bridging mechanism for heterochromatin assembly. Mol. Cell 41, 67–81 (2011). [DOI] [PMC free article] [PubMed] [Google Scholar]
- 4.Canzio D et al. A conformational switch in HP1 releases auto-inhibition to drive heterochromatin assembly. Nature 496, 377–381 (2013). [DOI] [PMC free article] [PubMed] [Google Scholar]
- 5.Larson AG et al. Liquid droplet formation by HP1α suggests a role for phase separation in heterochromatin. Nature 547, 236–240 (2017). [DOI] [PMC free article] [PubMed] [Google Scholar]
- 6.Strom AR et al. Phase separation drives heterochromatin domain formation. Nature 547, 241–245 (2017). [DOI] [PMC free article] [PubMed] [Google Scholar]
- 7.Eissenberg JC & Elgin SCR HP1a: a structural chromosomal protein regulating transcription. Trends Genet 30, 103–110 (2014). [DOI] [PMC free article] [PubMed] [Google Scholar]
- 8.Smothers JF & Henikoff S The HP1 chromo shadow domain binds a consensus peptide pentamer. Current Biology 10, 27–30 (2000). [DOI] [PubMed] [Google Scholar]
- 9.Isaac RS et al. Biochemical Basis for Distinct Roles of the Heterochromatin Proteins Swi6 and Chp2. J. Mol. Biol 429, 3666–3677 (2017). [DOI] [PMC free article] [PubMed] [Google Scholar]
- 10.Dawson MA et al. JAK2 phosphorylates histone H3Y41 and excludes HP1α from chromatin. Nature 461, 819–822 (2009). [DOI] [PMC free article] [PubMed] [Google Scholar]
- 11.Lavigne M et al. Interaction of HP1 and Brg1/Brm with the globular domain of histone H3 is required for HP1-mediated repression. PLoS Genet 5, e1000769 (2009). [DOI] [PMC free article] [PubMed] [Google Scholar]
- 12.Liu Y et al. Peptide recognition by HP1 chromoshadow domains revisited: plasticity in the pseudosymmetric histone binding site of human HP1. J. Biol. Chem jbc.M116.768374 (2017). 10.1074/jbc.M116.768374 [DOI] [PMC free article] [PubMed]
- 13.Hoofnagle AN, Resing KA & Ahn NG Protein analysis by hydrogen exchange mass spectrometry. Annu Rev Biophys Biomol Struct 32, 1–25 (2003). [DOI] [PubMed] [Google Scholar]
- 14.Rosenzweig R & Kay LE Bringing dynamic molecular machines into focus by methyl-TROSY NMR. Annu. Rev. Biochem 83, 291–315 (2014). [DOI] [PubMed] [Google Scholar]
- 15.Sinha KK, Gross JD & Narlikar GJ Distortion of histone octamer core promotes nucleosome mobilization by a chromatin remodeler. Science 355, eaaa3761 (2017). [DOI] [PMC free article] [PubMed] [Google Scholar]
- 16.Zhou B-R et al. Structural insights into the histone H1-nucleosome complex. Proc. Natl. Acad. Sci. U.S.A 110, 19390–19395 (2013). [DOI] [PMC free article] [PubMed] [Google Scholar]
- 17.Luger K, Mäder AW, Richmond RK, Sargent DF & Richmond TJ Crystal structure of the nucleosome core particle at 2.8 A resolution. Nature 389, 251–260 (1997). [DOI] [PubMed] [Google Scholar]
- 18.Stoddard CI et al. A Nucleosome Bridging Mechanism for Activation of a Maintenance DNA Methyltransferase. Mol. Cell 73, 73–83.e6 (2019). [DOI] [PMC free article] [PubMed] [Google Scholar]
- 19.Azzaz AM et al. Human Heterochromatin Protein 1α Promotes Nucleosome Associations That Drive Chromatin Condensation. J. Biol. Chem 289, 6850–6861 (2014). [DOI] [PMC free article] [PubMed] [Google Scholar]
- 20.Alberti S, Gladfelter A & Mittag T Considerations and Challenges in Studying Liquid-Liquid Phase Separation and Biomolecular Condensates. Cell 176, 419–434 (2019). [DOI] [PMC free article] [PubMed] [Google Scholar]
- 21.Maeshima K et al. Nucleosomal arrays self‐assemble into supramolecular globular structures lacking 30‐nm fibers. EMBO J 35, 1115–1132 (2016). [DOI] [PMC free article] [PubMed] [Google Scholar]
- 22.Cheutin T, Gorski SA, May KM, Singh PB & Misteli T In vivo dynamics of Swi6 in yeast: evidence for a stochastic model of heterochromatin. Mol. Cell. Biol 24, 3157–3167 (2004). [DOI] [PMC free article] [PubMed] [Google Scholar]
- 23.Cheutin T et al. Maintenance of stable heterochromatin domains by dynamic HP1 binding. Science 299, 721–725 (2003). [DOI] [PubMed] [Google Scholar]
- 24.Festenstein R et al. Modulation of heterochromatin protein 1 dynamics in primary Mammalian cells. Science 299, 719–721 (2003). [DOI] [PubMed] [Google Scholar]
- 25.Haldar S, Saini A, Nanda JS, Saini S & Singh J Role of Swi6/HP1 self-association-mediated recruitment of Clr4/Suv39 in establishment and maintenance of heterochromatin in fission yeast. J. Biol. Chem 286, 9308–9320 (2011). [DOI] [PMC free article] [PubMed] [Google Scholar]
- 26.Kilic S, Bachmann AL, Bryan LC & Fierz B Multivalency governs HP1α association dynamics with the silent chromatin state. Nat Commun 6, 7313 (2015). [DOI] [PMC free article] [PubMed] [Google Scholar]
- 27.Kalashnikova AA, Porter-Goff ME, Muthurajan UM, Luger K & Hansen JC The role of the nucleosome acidic patch in modulating higher order chromatin structure. Journal of The Royal Society Interface 10, 20121022–20121022 (2013). [DOI] [PMC free article] [PubMed] [Google Scholar]
- 28.Aygün O, Mehta S & Grewal SIS HDAC-mediated suppression of histone turnover promotes epigenetic stability of heterochromatin. Nat. Struct. Mol. Biol 20, 547–554 (2013). [DOI] [PMC free article] [PubMed] [Google Scholar]
- 29.Fussner E, Ching RW & Bazett-Jones DP Living without 30nm chromatin fibers. Trends Biochem. Sci 36, 1–6 (2011). [DOI] [PubMed] [Google Scholar]
- 30.Cai S et al. Cryo-ET reveals the macromolecular reorganization of S. pombe mitotic chromosomes in vivo. Proc. Natl. Acad. Sci. U.S.A 1–6 (2018). 10.1073/pnas.1720476115 [DOI] [PMC free article] [PubMed]
- 31.Dyer PN et al. Reconstitution of Nucleosome Core Particles from Recombinant Histones and DNA. Meth. Enzymol 375, 23–44 (2003). [DOI] [PubMed] [Google Scholar]
- 32.Tugarinov V, Kanelis V & Kay LE Isotope labeling strategies for the study of high-molecular-weight proteins by solution NMR spectroscopy. Nature Protocols 1, 749–754 (2006). [DOI] [PubMed] [Google Scholar]
- 33.Hamel DJ & Dahlquist FW The Contact Interface of a 120 kD CheA−CheW Complex by Methyl TROSY Interaction Spectroscopy. Journal of the American Chemical Society 127, 9676–9677 (American Chemical Society, 2005). [DOI] [PubMed] [Google Scholar]
- 34.Simon MD et al. The site-specific installation of methyl-lysine analogs into recombinant histones. Cell 128, 1003–1012 (2007). [DOI] [PMC free article] [PubMed] [Google Scholar]
- 35.Zhang X et al. Structure of the Neurospora SET Domain Protein DIM-5, a Histone H3 Lysine Methyltransferase. Cell 111, 117–127 (2002). [DOI] [PMC free article] [PubMed] [Google Scholar]
- 36.Mishima Y et al. Hinge and chromoshadow of HP1α participate in recognition of K9 methylated histone H3 in nucleosomes. J. Mol. Biol 425, 54–70 (2013). [DOI] [PubMed] [Google Scholar]
- 37.Luger K, Rechsteiner TJ & Richmond TJ Preparation of nucleosome core particle from recombinant histones. Meth. Enzymol 304, 3–19 (1999). [DOI] [PubMed] [Google Scholar]
- 38.Dorigo B et al. Nucleosome arrays reveal the two-start organization of the chromatin fiber. Science 306, 1571–1573 (2004). [DOI] [PubMed] [Google Scholar]
- 39.Rogge RA et al. Assembly of nucleosomal arrays from recombinant core histones and nucleosome positioning DNA. J Vis Exp (2013). 10.3791/50354 [DOI] [PMC free article] [PubMed]
- 40.Delaglio F et al. NMRPipe: A multidimensional spectral processing system based on UNIX pipes. J Biomol NMR 6, 277–293 (1995). [DOI] [PubMed] [Google Scholar]
- 41.Goddard TD & Kneller DG SPARKY 3 (Univ of California, San Francisco: ). (2008). [Google Scholar]
- 42.Kato H et al. Architecture of the high mobility group nucleosomal protein 2-nucleosome complex as revealed by methyl-based NMR. Proc. Natl. Acad. Sci. U.S.A 108, 12283–12288 (2011). [DOI] [PMC free article] [PubMed] [Google Scholar]
- 43.Chalmers MJ et al. Probing protein ligand interactions by automated hydrogen/deuterium exchange mass spectrometry. Anal. Chem 78, 1005–1014 (2006). [DOI] [PubMed] [Google Scholar]
- 44.Keppel TR & Weis DD Mapping residual structure in intrinsically disordered proteins at residue resolution using millisecond hydrogen/deuterium exchange and residue averaging. J. Am. Soc. Mass Spectrom 26, 547–554 (2015). [DOI] [PubMed] [Google Scholar]
- 45.Pascal BD et al. HDX workbench: software for the analysis of H/D exchange MS data. J. Am. Soc. Mass Spectrom 23, 1512–1521 (2012). [DOI] [PMC free article] [PubMed] [Google Scholar]
- 46.Zhang Z & Smith DL Determination of amide hydrogen exchange by mass spectrometry: a new tool for protein structure elucidation. Protein Sci 2, 522–531 (1993). [DOI] [PMC free article] [PubMed] [Google Scholar]
- 47.Gamarra N, Johnson SL, Trnka MJ, Burlingame AL & Narlikar G The nucleosomal acidic patch relieves auto-inhibition by the ISWI remodeler SNF2h. Elife 7, 34270 (2018). [DOI] [PMC free article] [PubMed] [Google Scholar]
- 48.Trnka MJ, Baker PR, Robinson PJJ, Burlingame AL & Chalkley RJ Matching cross-linked peptide spectra: only as good as the worse identification. Mol. Cell Proteomics 13, 420–434 (2014). [DOI] [PMC free article] [PubMed] [Google Scholar]
- 49.Brown PH & Schuck P Macromolecular size-and-shape distributions by sedimentation velocity analytical ultracentrifugation. Biophys. J 90, 4651–4661 (2006). [DOI] [PMC free article] [PubMed] [Google Scholar]
- 50.Brautigam CA Calculations and Publication-Quality Illustrations for Analytical Ultracentrifugation Data. Meth. Enzymol 562, 109–133 (2015). [DOI] [PubMed] [Google Scholar]
Associated Data
This section collects any data citations, data availability statements, or supplementary materials included in this article.


