

Summary:
Lymphoid cells that produce IL-17 cytokines protect barrier tissues from pathogenic microbes, but are also prominent effectors of inflammation and autoimmune disease. T-helper (TH17) cells, defined by RORγt-dependent production of IL-17A and IL-17F, exert homeostatic functions in the gut upon microbiota-directed differentiation from naïve CD4+ T cells. In the non-pathogenic setting, their cytokine production is regulated by serum amyloid A proteins (SAA1 and SAA2) secreted by adjacent intestinal epithelial cells. However, TH17 cell behaviors vary markedly according to their environment. Here we show that SAAs additionally direct a pathogenic pro-inflammatory TH17 cell differentiation program, acting directly on T cells in collaboration with STAT3-activating cytokines. Using loss- and gain-of-function mouse models, we show that SAA1, SAA2, and SAA3 have distinct systemic and local functions in promoting TH17-mediated inflammatory diseases. These studies suggest that T cell signaling pathways modulated by the SAAs may be attractive targets for anti-inflammatory therapies.
Keywords: experimental autoimmune encephalomyelitis (EAE), autoimmunity, inflammatory bowel disease, TGF-β, IL-23, TH1*, Helicobacter hepaticus, segmented filamentous bacteria (SFB), T cell transfer colitis
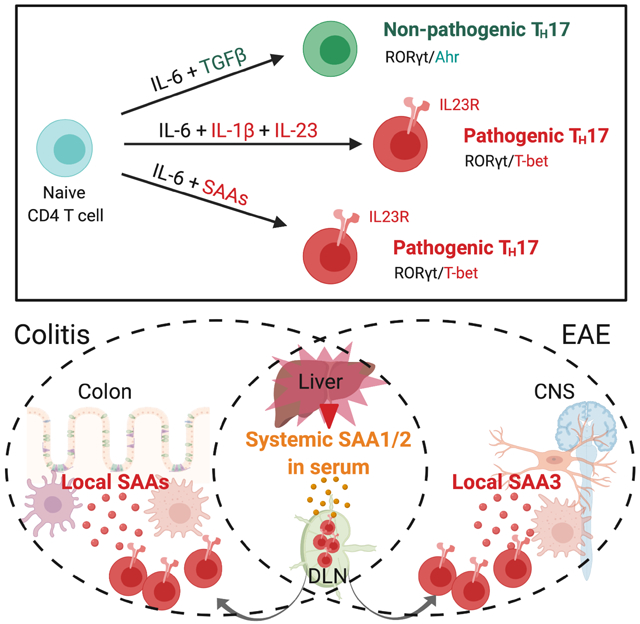
Graphical Abstract
Introduction
T-helper 17 (TH17) cells and related IL-17-producing T cells perform critical roles at mucosal surfaces, mediating protection from pathogenic bacteria and fungi and contributing to regulation of the mutualistic organisms that comprise the microbiota (Honda and Littman, 2016). TH17 cells also drive the pathogenesis of multiple inflammatory diseases (McGeachy et al., 2019; Patel and Kuchroo, 2015; Stockinger and Omenetti, 2017). Yet, despite extensive studies conducted both in vitro and in vivo, the differentiation cues that distinguish TH17 cells that execute homeostatic functions, such as maintenance of barrier epithelial integrity, from those with potentially harmful inflammatory functions as observed in autoimmune diseases, remain an enigma. Differentiation of the latter, which have a distinct transcriptional program with features resembling those of TH1 cells, requires IL-23 and IL-1β (Chung et al., 2009; Hirota et al., 2011; Komuczki et al., 2019; McGeachy et al., 2009). Mice deficient for either of those cytokines retain the capacity to generate TH17 cells in response to commensal microbiota (Ivanov et al., 2008), but are largely resistant to autoimmune disease in multiple animal models (Kullberg et al., 2006; Langrish et al., 2005). In vitro differentiation of “homeostatic” TH17 cells can be achieved by stimulation of antigen-activated T cells with TGF-β and either IL-6 or IL-21 that induce STAT3 phosphorylation, which is prerequisite for expression of the TH17-defining transcription factor, RORγt (Ivanov et al., 2006; Zhou et al., 2007). When myelin-reactive T cells were generated in vitro with TGF-β and IL-6, they failed to provoke autoimmune disease following transfer into mice (Lee et al., 2012). However, additional in vitro exposure to IL-23 rendered these cells pathogenic, as did their differentiation in the absence of TGF-β, with a combination of IL-6, IL-1β, and IL-23 (Ghoreschi et al., 2010; Lee et al., 2012).
The SAAs are a family of acute phase response proteins that were recently associated with gut microbial ecology and inflammation and are encoded by at least four closely-linked genes that likely arose from gene duplication events (Lloyd-Price et al., 2019; Tang et al., 2017; Uhlar et al., 1994). SAA1,2, and 3 are elicited by inflammatory cues, while SAA4 is constitutively produced and regulated independently of the inflammatory state (De Buck et al., 2016; Yarur et al., 2017; Ye and Sun, 2015). Previously, we demonstrated that colonization of mice with an epithelial cell-associated commensal microbe, segmented filamentous bacteria (SFB), triggered local secretion of SAA1 and SAA2 by the intestinal epithelial cells (IEC) (Ivanov et al., 2009). The SAAs directly potentiated local TH17 cell effector cell function (Sano et al., 2015). In this context, SAA1/2 remained confined to the ileum and did not enter into the circulation (Sano et al., 2015). However, SAA1 and SAA2 are most prominently induced in liver during sepsis and/or inflammation, with concentrations in serum increased by as much as a thousand-fold over basal levels (De Buck et al., 2016; Yarur et al., 2017; Ye and Sun, 2015). Serum concentrations of SAA1 and SAA2 are also consistently elevated in various TH17-mediated autoimmune diseases, including rheumatoid arthritis, Crohn’s disease (CD), ulcerative colitis (UC), and multiple sclerosis, in addition to numerous cancers (Ye and Sun, 2015). Systemic SAA levels have long served as biomarkers, but whether they contribute to these diseases is not known. The secreted proteins form hexamers that associate in serum with high density lipoprotein, and are thought to be involved in the maintenance of lipid homeostasis (Wang and Colon, 2004; Wang et al., 2002). There is also evidence that SAAs, particularly SAA3, oligomerize and associate with derivatives of vitamin A (Derebe et al., 2014). The anatomical distribution and cellular targets of SAAs in chronic disease are largely undefined, but the SAAs were recently implicated in conditioning the liver microenvironment to provide a niche for tumor metastases (Lee et al., 2019).
Here, we investigate the role of SAAs in the differentiation and function of potentially pathogenic TH17 cells. We find that the SAAs can substitute for TGF-β in the induction of TH17 cells, but engage a distinct signaling pathway that results in a pro-inflammatory program of differentiation. As a consequence, SAAs contribute in vivo to TH17-mediated pathogenesis, revealed in inflammatory bowel disease and experimental autoimmune encephalomyelitis with both loss- and gain-of-function models. Collectively, our findings show that the SAAs contribute selectively to TH17 cell functions in vivo, and suggest strategies for therapeutic modulation in TH17-mediated inflammatory disease.
Results
The SAAs direct a distinct TH17 cell differentiation program independently of TGF-β.
In vitro activation of naïve murine CD4+ T cells in the presence of IL-6 alone is insufficient to promote TH17 cell differentiation (Bettelli et al., 2006; Mangan et al., 2006; Veldhoen et al., 2006). Addition of either TGF- β or IL-1β plus IL-23 is required for the T cells to up-regulate RORγt and produce TH17 cytokines. Unexpectedly, we observed that a combination of SAA1 and IL-6, in the presence of TGF-β neutralizing antibody (referred to as TH17-SAA1 condition), elicited potent TH17 cell differentiation in a dose-dependent manner, with expression of the signature cytokines, IL-17A and IL-17F (Figures 1A-C and S1A). Similar results were obtained using T cells expressing the dominant negative form of TGFβRII (TGFβRII DNtg), while addition of SAA1 neutralizing antibodies prevented TH17 cell induction under TH17-SAA1 conditions (Figures S1B and S1C). Expression of RORγt was similar between TH17-SAA1 cells and TH17 cells induced by the standard polarization cocktail consisting of IL-6 + TGF-β (TH17-TGFβ) (Figure 1D). Notably, naïve murine CD8+ T cells responded similarly to CD4+ cells under the different polarization conditions (Figures S1D and S1E). To determine whether SAA-directed signaling converged with the TGF-β signaling pathway, we assessed levels of phosphorylated SMAD2/3 (pSMAD2/3). As expected, TGF-β rapidly induced pSMAD2/3. However, this was not observed with SAA1, which instead was found to rapidly engage the MAPK pathway, inducing p38 phosphorylation (Figures 1E and S1F). These findings demonstrate that SAA1 promotes Th17 cell differentiation through a TGF-β–independent mechanism.
Figure 1. SAAs act directly on mouse T cells to induce TH17 cell differentiation in vitro in absence of TGF-β.

(A) Experimental scheme for in vitro differentiation of naïve CD4+ or CD8+ T cells.
(B and C) Flow cytometric analysis of IL-17A and IL-17F expression (B) and summary of IL-17A frequency (C) among re-stimulated cells. Summary of 3 experiments, with n = 11. Statistics were calculated using the unpaired two-sided Welch’s t-test. Error bars denote the mean ± s.d. ns = not significant, ****p < 0.0001.
(D) RORγt expression in TH17 cells. Geometric mean fluorescence intensities (gMFI) are included in parentheses. Representative data of n > 10 experiments.
(E) Immunoblotting for SMAD2/3 phosphorylation (pSMAD2/3) of primed CD4+ T cells upon rmSAA1 (10μg/ml) or TGF-β (1ng/ml) treatment for indicated times. Total SMAD2/3 is shown as a loading control.
See also Figure S1.
To compare in vitro TH17 cell programming by SAA1 and TGF-β, we performed RNA sequencing (RNAseq) of cells differentiated under TH17-SAA1 or TH17-TGFβ conditions for 3h, 12h, and 48h (Figure S2A). After 48h, there were 3537 differentially expressed (DE) genes between TH17-SAA1 and TH17-TGFβ cells (Figure 2A). Compared to TH cells cultured in IL-6 alone or the TH17-TGFβ condition, TH17-SAA1 cells exhibited a profound induction of hallmark chronic inflammatory disease-associated genes, such as Il23r (Abdollahi et al., 2016; Duerr et al., 2006; Gaffen et al., 2014; Hue et al., 2006), Il1r1 (Shouval et al., 2016) , and S100a4 (Oslejskova et al., 2009) (Figures S2B and S2C). Gene set enrichment analysis using previously defined TH17 datasets revealed a striking correlation with the “pathogenic” TH17 signature, but an anti-correlation with the “non-pathogenic” TH17 signature, as early as 3h after SAA treatment (Lee et al., 2012) (Figure 2B). Examples of increased pathogenic-TH17 signature genes in differentiating TH17-SAA1 cells include Csf2, Tbx21 and Gzmb, while decreased non-pathogenic-TH17 signature genes include Maf, Ahr and Il10 (Figures S2D and S2E) (Lee et al., 2012). We validated elevated protein expression of GM-CSF (Csf2) and T-bet (Tbx21) in TH17-SAA1-compared to TH17-TGFβ–differentiated cells (Figures S2F-H). SAA1 had no measurable effect in TH1 differentiation culture conditions (Figures S2I and S2J). Using CD4+ T cells from IL23reGFP reporter mice, we confirmed that SAA1, compared to TGF-β, potently augmented IL-6-mediated IL23r induction (Figure 2C). This translated into stronger STAT3 activation (pSTAT3) in SAA-differentiated TH17 cells upon exposure to IL-23 (Figure 2D). These in vitro studies thus suggest that SAA1 sensitizes TH17 cells to inflammatory cytokines and poises them for pathological responses.
Figure 2. SAA1 elicits a pathogenic TH17 program in vitro.

(A and B) RNA sequencing analysis of temporal gene expression in IL6 + αTGF-β + SAA1 (TH17-SAA1, n = 3) and IL6 + TGF-β (TH17-TGFβ n = 3) differentiated CD4+ T cells. (A) MA plot depicts differentially expressed (DE) genes of TH17-SAA1 versus TH17-TGFβ cells at 48h in vitro polarization. Colored dots are significant DE genes. Red dots or green dots highlight pathogenic or non-pathogenic TH17 signature genes, respectively. DE genes were calculated in DESeq2 using the Wald test with Benjamini-Hochberg correction to determine the false discovery rate (FDR < 0.01). (B) GSEA plots of pathogenic (top) or non-pathogenic (bottom) TH17 signatures amongst TH17-SAA1 and TH17-TGFβ gene sets. NES, normalized enrichment score.
(C) Summary of eGFP expression in T cells from Il23reGFP mice following indicated condition and time of polarization. The gMFI of non-reporter, wild-type cells was subtracted from gMFI of eGFP to obtain the normalized gMFI. Representative data of two independent experiments. Statistics were calculated using the two-stage step-up method of Benjamini, Krieger and Yekutieliun. Error bars denote the mean ± s.d. ns = not significant, *p < 0.05, **p < 0.01, and ****p < 0.0001.
(D) Amount of Y705 phosphorylated STAT3 following IL-23 treatment (10ng/ml) of TH17 cells differentiated under different conditions for indicated times. Total STAT3 is shown as a loading control.
See also Figure S2.
SAAs direct human Th17 cell differentiation and expression is associated with inflamed colon of IBD patients
Multiple genes involved in the TH17 pathway have been described as contributing to inflammatory bowel disease (IBD) in humans. In particular, mutations in IL23R result in either protection or predisposition to disease (Abdollahi et al., 2016; Duerr et al., 2006; Gaffen et al., 2014). To determine if the SAAs also contribute to human TH17 cell differentiation, we subjected naïve CD4+ T cells from cord blood to TH17 differentiation conditions with and without inclusion of recombinant human SAA1 or SAA2. Both SAAs substantially enhanced RORγT expression and IL-17A production in cells differentiated from multiple donors (Figures 3A-C and S3A). As in mouse, SAAs also promoted human TH17 cell differentiation in absence of TGF-β, based on upregulated expression of the RORγt-dependent chemokine receptor CCR6 (Figures S3B and S3C).
Figure 3. Human SAA expression in inflamed tissue and induction of TH17 cell differentiation.

(A-C) Naïve human CD4+ T cells were isolated from cord blood and differentiated for 6 days in TH17 polarizing conditions ± recombinant human (rh) SAA1 or rhSAA2. (A) Summary of IL-17A production from in vitro polarized human TH17 cells. Connecting lines signify cells from the same donor. (B) Stacked histogram illustrates representative RORγT expression using the indicated polarizing conditions. (C) Summary of RORγT gMFI. Summary of 2 experiments with n = 6 donors for rhSAA1 and with n = 3 donors for rhSAA2.
(D and E) Representative confocal images (D) and quantification of SAA1/2 by fluorescence integrated optical density (FIOD) levels (E) show prominent SAA expression in biopsies of inflamed tissue from ulcerative colitis (UC, n = 7) patients. Panels from left to right: Healthy (n = 2), UC-uninflamed, and UC-inflamed. Scale bar corresponds to 50μm. SAA1/2 (green), EPCAM (red) and nucleus (Draq7; blue).
(F) Violin plots showing the log2 normalized UMI of SAA1 and SAA2 genes in the fibroblast cluster associated with the GIMATS module (IgG plasma cells, inflammatory MNP, activated T and stromal cells). Statistics were calculated using the paired two-tailed Student’s t-test. **p < 0.01, ****p < 0.0001.
See also Figure S3.
Increased SAA1/2 gene expression in inflamed tissues and elevated SAA serum concentrations have been reported in IBD patients with UC and CD (Lloyd-Price et al., 2019; Tang et al., 2017; Yarur et al., 2017). Using an antibody recognizing SAA1 and SAA2, we observed that SAA was prominently expressed by epithelia and lamina propria cells of inflamed but not non-inflamed adjacent regions of biopsies from UC patients (Figures 3D, 3E and S3D). Further, in a single cell RNAseq dataset of the terminal ileum lamina propria (Martin et al., 2019), there was selective heterogeneous expression of SAA1 and SAA2 in activated, podoplanin+ (PDPN) fibroblast-like cells isolated from inflamed lesions of CD patients (Figure 3F). Of note, this population was part of a highly pathogenic module characterized by an inflammatory mononuclear phagocyte (MNP)-associated cellular response organized around IgG plasma cells, inflammatory MNP, activated T and stromal cells (GIMATS) that could predict resistance to anti-TNFα therapy (Martin et al., 2019) and is reminiscent of the oncostatin M receptor-expressing PDPN+ population identified by Powrie and colleagues that also correlated with IBD severity and resistance to anti-TNFα therapy (West et al., 2017).
SAAs are required for differentiation and pathogenicity of colitogenic Th17 cells
The shared ability of mouse and human SAAs to propel in vitro TH17 cell differentiation, and the observation that SAA production was elevated in inflamed lesions in IBD patients, compelled us to examine whether SAAs exert important functions in mouse colitis models. We generated Saa isotype 1, 2, 3 triple-deficient (SAATKO) mice and colonized these and WT littermates with Helicobacter hepaticus (H. hepaticus). We then transferred into these mice naïve H. hepaticus-specific TCR transgenic (HH7-2Tg) CD4+ T cells and tracked the anti-bacterial T cell response (Xu et al., 2018) (Figures 4A and S4A). Previously, we showed that T cells primed by H. hepaticus in WT animals differentiate into predominantly RORγt+Foxp3+ induced regulatory T cells (iTreg) or Bcl6+ follicular helper cells (TFH) (Xu et al., 2018) . In this regard, examination of HH7-2Tg cells in the colonic lamina propria at 2 weeks post-adoptive transfer revealed that H. hepaticus elicited similar numbers and frequencies of HH7-2Tg iTreg and TFH cells in healthy SAATKO and WT littermate animals, indicating that SAAs did not affect T cell differentiation at steady state (Figures S4B-C). Using the same scheme, we subjected animals to continuous IL-10RA blockade, which subverts the function and maintenance of iTreg cells, resulting in expansion of cognate pathogenic TH17 cells and colitis (Kullberg et al., 2006; Xu et al., 2018) (Figure 4A). Sustained IL-10RA blockade resulted in abundant SAA1/2 in the serum of WT mice and upregulation of Saa1-3 transcripts in the proximal colon, specifically, Saa1 and Saa2 in epithelium and Saa3 in monocytes/macrophages and dendritic cells (Figures 4B-D, S4D and S4E). By contrast, in the terminal ileum of the same mice, which were also colonized with SFB, only transcripts for Saa1 and Saa2 were detected and there was little change upon IL-10RA blockade (Figures 4D and S4F).
Figure 4. SAAs drive pathogenic Th cell responses in IL-10 deficiency-dependent colitis.

(A) Experimental scheme to examine HH7-2tg cells in SAA1/2/3 triple knock-out (SAATKO) and WT littermate recipient mice colonized with H. hepaticus ± IL-10RA blockade (αIL10RA).
(B) Serum concentrations of SAA1/2 of recipient mice at day 21 post H. hepaticus colonization.
(C and D) Normalized expression of Saa1/2 in proximal colon (C) and Saa3 in ileum and colon (D) of recipient mice at day 21 post H. hepaticus colonization.
(E and F) Characterization of HH7-2tg donor-derived cells 5 days post-adoptive transfer in mesenteric lymph nodes of recipient SAATKO (blue boxes, n = 8) and WT (red boxes, n = 10) littermates injected with αIL10RA. Number of RORγt expressing HH7-2 cells (E) and T-bet gMFI level in the RORγt+ HH7-2 cells (F).
(G-J) Characterization of HH7-2tg donor-derived cells two weeks post-adoptive transfer in colon lamina propria of recipient mice injected with αIL10RA. Summary of 2 experiments with SAATKO (blue boxes, n = 8) and WT (red boxes, n = 10) littermates. Frequency (G) and number (H) of the indicated FoxP3− effector TH cells based on transcription factor expression as described in Figure S4A or cytokine expression after restimulation (I). Numbers of Foxp3+ iTreg cells in isotype-treated recipients (hollow boxes) versus αIL10RA-treated recipients (J).
(K) Representative H&E staining (left) and summary of histology scores (right) of colon sections harvested from mice with or without H. hepaticus colonization, following twelve weeks of αIL10RA injection. Summary of two separate experiments is shown. Uncolonized mice (open boxes): WT + αIL10RA (red, n = 5), SAATKO + αIL10RA (blue, n = 5); or colonized with H. hepaticus (closed boxes): WT + αIL10RA (red, n = 10), SAATKO + αIL10RA (blue, n = 13).
(B-F and K) Statistics were calculated using the unpaired two-sided Welch’s t-test. Error bars denote the mean ± s.d. ns = not significant, **p < 0.01, ***p < 0.001, and ****p < 0.0001.
(G-J) Statistics were calculated using the two-stage step-up method of Benjamini, Krieger and Yekutieliun. Error bars denote the mean ± s.d. ns = not significant, *p < 0.05, ***p < 0.001, and ****p < 0.0001.
See also Figure S4.
We then assessed the HH7-2Tg cell phenotype in the mesenteric lymph nodes (mLN) of WT and SAATKO recipients at 5d after transfer. We observed reduced numbers of RORγt+ TH17 cells in SAATKO mice compared to WT littermates, in which T-bet upregulation was also markedly decreased (Figures 4E and 4F). Phenotypic analysis of HH7-2Tg cells in the colon lamina propria at two weeks after transfer revealed striking reductions in both proportion and absolute number of HH7-2Tg TH1 and TH17 cells, corresponding to profoundly decreased IFN-γ+, IL-17A+, and IFN-γ+IL-17A+ cells in SAATKO recipients (Figures 4G-I). Notably, previous IL-17A fate mapping experiments performed in mice treated with anti-IL-10RA during H. hepaticus infection (Morrison et al., 2013), and other pathogenic TH17 responses, such as experimental autoimmune encephalomyelitis (EAE), demonstrated that a significant proportion of IFNγ+ cells previously expressed or descended from cells that expressed the TH17 program, described as EXTH17 (Harbour et al., 2015; Hirota et al., 2011). Therefore, reduced numbers of HH7-2Tg IFN-γ+ cells in SAATKO mice could be explained, at least in part, by the effect of SAAs on TH17 cells. Despite lower TH1 and TH17 responses in SAATKO mice, we observed a similar reduction in both the number and frequency of HH7-2Tg Treg cells in both mutant and WT recipients after αIL10RA blockade (Figures 4J and S4G). In accord with their reduced pathogenic TH response, SAATKO mice exhibited significantly attenuated histological features of colitis compared to WT littermates following chronic IL-10RA blockade (Figure 4K). Altogether, these findings argue that the SAAs have a major role in the induction of pathogenic TH17 responses both in vitro and in vivo, and thus contribute to exacerbated colonic inflammation.
Distinct sources of SAA promote experimental autoimmune encephalomyelitis at discrete stages of disease
To address the impact of SAAs on another TH17-dependent autoimmune disease model, we immunized mice with myelin oligodendrocyte glycoprotein (MOG) to induce EAE. SAATKO mice displayed delayed EAE onset and significantly milder disease compared to WT littermates, and had reduced TH17 cell accumulation in the central nervous system (CNS) (Figures 5A-C). Following MOG immunization, transcription of Saa1 and Saa2, but not Saa3, increased in the liver, which corresponded to high concentrations of SAA1/2 in the serum beginning at the preclinical stage of disease (Figures 5D and S5A). At the peak of disease, we also detected SAA1/2 in efferent lymph, though not in the CNS (Figures S5B-C). In contrast, Saa3 was the only Saa induced in the CNS during EAE, and was expressed by both microglia and monocyte-derived macrophages, particularly at the peak of disease (Figures 5E and S5D-F). Immunofluorescence staining also revealed colocalization of SAA3 with IBA1, a specific marker of microglia and monocyte-derived macrophages (Ajami et al., 2011), in the inflamed regions of the CNS marked by CD4+ T cell infiltrates (Figures 5F, S5G and S5H). Thus, SAAs are broadly induced during EAE; however, their temporal and spatial sequestration suggests that they differentially influence the fate of pathogenic TH17 cell responses.
Figure 5. Distinct sources of SAAs promote and sustain autoimmune encephalomyelitis.

(A) Mean EAE scores of myelin oligodendrocyte glycoprotein (MOG)-immunized SAATKO (blue boxes, n = 18) and WT littermate mice (red boxes, n = 22). Summary of 3 experiments.
(B and C) Number of CD4+ T cells (B) and frequency of RORγt+ TH17 cells among Foxp3Neg CD44hi CD4+ T cells (C) in the CNS of mice at the indicated stage of EAE. day 10 = preclinical, day 15 = acute, day 32 = chronic. Pre-clinical, (SAATKO = 6, WT = 9), acute, (SAATKO = 4, WT = 6) and Chronic, (SAATKO =10, WT = 11). Data combined two, two, and three experiments for the pre-clinical, acute, and chronic stages of disease, respectively.
(D) Longitudinal mean serum concentrations of SAA1/2 in MOG-immunized mice. Error bars denote the s.d.
(E) Normalized relative expression of Saa3 in CNS of MOG-immunized mice, measured by qPCR. Spinal cords were isolated at days 0, 10, 18, and 38 post-immunization. For WT, SAADKO, and SAATKO, the number of samples at each time point were 13, 7, and 13 (day 0); 5, 6, and 8 (day 10); 17, 11, and 10 (day 18); and 10, 3, 6 (day 38).
(F) Representative confocal images of spinal cord cross section isolated from WT mouse (n = 2) at the peak of EAE (score 4) (6x (left), 20x (right top) and 80x (right bottom) magnification). IBA1 (red), SAA3 (green), and CD4 (aqua). White arrows indicate yellow regions with IBA1/SAA3 colocalization.
(G) Mean EAE scores of MOG-immunized SAA1/2 DKO (SAADKO, orange boxes, n = 17) and WT littermate mice (red boxes, n = 19). Summary of 4 experiments.
(H and I) Number of RORγt+ TH17 cells among CD44hi effector/memory CD4+ T cells isolated from draining lymph nodes (dLNs) (H) and spinal cord (I) of SAADKO (n = 6) or WT (n = 9) littermates at day 10 post immunization.
(J) Mean EAE scores of MOG-immunized SAA3 KO (SAA3KO, purple boxes, n = 14) and WT littermate mice (red boxes, n = 16). Summary of 3 experiments.
(K) Number of RORγt+ TH17 and Foxp3+ Treg cells at pre-clinical (day 10) and chronic (day 32) stages of EAE. Summary of 3 experiments, with SAA3KO (n = 14) and WT (n = 16) littermates. (A-C, E, G, J, and K) Statistics were calculated using the two-stage step-up method of Benjamini, Krieger and Yekutieliun. Error bars denote the mean ± s.e.m (A, G, and J) or mean ± s.d. (B, C, E, H, I, and K). *p < 0.05, **p < 0.01, ***p < 0.001, and ****p < 0.0001.
(H and I) Statistics were calculated using the unpaired two-sided Welch’s t-test. Error bars denote the mean ± s.d. ns = not significant, *p < 0.05, **p < 0.01, ***p < 0.001, ****p < 0.0001.
See also Figure S5.
To distinguish the role of liver- from CNS-derived SAAs, we compared the course of EAE in SAA1 and SAA2 double-deficient (SAADKO) and SAA3-deficient (SAA3KO) mice, respectively. Like SAATKO mice, SAADKO mice exhibited delayed disease onset and milder symptoms than WT littermates (Figure 5G). SAA3KO mice, on the other hand, did not exhibit delayed disease onset; however, the magnitude of disease, particularly during the chronic stage of EAE, tapered faster in these animals than in WT littermates (Figure 5J). TH17 responses were also in striking concordance with these phenotypes, such that TH17 cell differentiation was impaired in the draining lymph nodes of SAADKO mice (Figures 5H and 5I), while the TH17 response in the CNS of SAA3KO mice was not sustained during EAE (Figure 5K). Taken together, these findings argue that systemic SAA1 and SAA2 exert functions early in EAE pathogenesis, while SAA3 functions subsequently to sustain inflammation locally in the CNS.
Local SAA expression fuels pathogenicity of activated TH17 cells
To further explore the distinct functions of SAAs in EAE pathogenesis, we employed an adoptive T cell transfer model of EAE in concert with either loss- or gain-of-function of the SAAs. We differentiated TH17-TGFβ cells in vitro from naive MOG peptide-specific 2D2 TCR transgenic T cells. When supplemented with IL-23 (TH17-IL-23 condition), these cells readily induce EAE in recipient mice (Lee et al., 2012). Following adoptive transfer of TH17-IL-23 cells into WT or SAADKO mice, all recipients developed EAE with similar kinetics and severity (Figures 6A-C). Moreover, the numbers of IL-17A+ 2D2 cells recovered from the CNS were indistinguishable between the two sets of recipients (Figure 6D). In contrast, when TH17-IL-23 2D2 cells were transferred into SAA3KO recipients, the majority did not develop EAE, and those that did exhibited significantly milder symptoms than WT littermates (Mean max score: WT = 5.9, SAA3KO = 2.3) (Figures 6E-H). Underscoring this impaired response was a significant reduction in the number of 2D2 cells infiltrating the CNS of SAA3KO mice at the peak of disease, with lower frequencies of TH17 cells and fewer IL-17A+ cells among those (Figures S6A-C). These results suggest that SAA3, produced by microglia and monocytes during EAE, engages a feed-forward loop the fuels the TH17 niche in inflamed tissue. Of note, although the combination of SAA3 with IL-6 had a much less striking effect than SAA1 and IL-6 on in vitro TH17 differentiation, in other TH17 culture settings, such as TH17-TGFβ or in combination with IL-6, IL-1β, and IL-23, SAA3 potentiated TH17 differentiation to a similar degree as SAA1. These findings indicate that SAA3 can also signal directly in T cells (Figures S6D-G).
Figure 6. SAA regulation of pathogenicity of in vitro-differentiated encephalitogenic TH17 cells.

(A-D) Examination of EAE development and the 2D2tg cell response in SAADKO and WT littermate recipients of 2D2tg TH17-IL-23 cells. Summary of 2 experiments, with SAADKO (orange, n = 9) and WT (red, n = 10) mice. Experimental scheme (A), EAE incidence (B) and mean score (C), and number of 2D2tg IL17A+ TH17 cells in spinal cords (D).
(E-H) Examination of EAE development and the 2D2tg cell response in SAA3KO and WT littermate recipients of 2D2tg TH17-IL-23 cells. Summary of 4 experiments, with SAA3KO (purple, n = 24) and WT (red, n = 24) mice. Experimental scheme (E), EAE incidence (F) and mean score (G), and maximal disease score (H).
(I-L) Examination of EAE development and the 2D2tg cell response in liver-specific SAA1tg (liverSAA1) and control Alb-Cretg littermates following transfer of 2D2tg TH17-TGFβ cells. Summary of 2 experiments, with liverSAA1 (red circles, n = 13) and Alb-Cretg (white circles, n = 11) mice. Experimental scheme (I), incidence of EAE onset (J), number of 2D2tg RORγt+ TH17 cells (K) and frequency of IL17A+ cells amongst RORγt+ TH17 cells in spinal cords at day 40 post-adoptive transfer (L).
(B, F, and J) Statistics were calculated by log-rank test using the Mantal-Cox method.
(C and G) Statistics were calculated using the two-stage step-up method of Benjamini, Krieger and Yekutieliun. Error bars denote the mean ± s.e.m. *p < 0.05, **p < 0.01, and ****p < 0.0001, (D, H, K, and L) Statistics were calculated using the unpaired two-sided Welch’s t-test. Error bars denote the mean ± s.d. ns = not significant, *p < 0.05, ***p < 0.001, ****p < 0.0001.
See also Figure S6.
We next sought to probe the effect of SAAs on TH17 responses in the absence of other inflammatory cues. Therefore, we generated mice capable of over-expressing SAA1, by placing the coding sequence of Saa1 downstream of a LoxP-flanked STOP cassette in the Rosa26 locus (R26Saa1) (Figure S6H). When these mice expressed a Cre transgene under control of albumin (Alb-CreTg;Rosa26Saa1, or liverSAA1, mice), they exhibited high concentrations of SAA1 in serum, due to constitutive production in liver (Figure S6I). There was no detectable elevation of other TH17 mediators, including IL-6, IL-1β and IL-23 (Figure S6J and data not shown). Consistent with the ability of SAAs to promote TH17 cell differentiation in vitro, we found that numbers of TH17, but not TH1 cells, were increased in secondary lymphoid tissues of liverSAA1 mice (Figures S6K and S6L). Furthermore, following MOG immunization with a low dose of the attenuated adjuvant Mycobacterium tuberculosis (H37RA) antigen emulsified in incomplete Freund's adjuvant (IFA), liverSAA1 mice had increased EAE disease incidence compared to control Alb-CreTg littermates, suggesting that systemic elevation of SAA1 in liverSAA1 mice potentiates pathogenic TH17 effector function (Figures S6M and S6N). To further investigate the consequence of systemically raised SAA1 levels in TH17-dependent autoimmune pathogenesis, we transferred 2D2 TH17-TGFβ cells that, under normal settings, fail to efficiently evoke a pathogenic response (Figure 6I). Accordingly, few of the control Alb-CreTg recipient mice developed disease (2/11), but the majority of littermate liver SAA1 mice (10/13) developed EAE (Figure 6J). In addition, we recovered significantly higher numbers of RORγt+ TH17-2D2 cells, of which a greater proportion expressed IL-17A, from the CNS of liverSAA1 recipients (Figures 6K and 6L). Therefore, serum SAA1/2 elevation supplants IL-23 preconditioning of TH17-TGFβ cells, consistent with a direct in vivo effect of SAAs on the myelin-specific T cells and suggesting that SAAs and IL-23 have convergent functions in TH17 autoimmune pathogenesis.
Discussion
TH17 cells exert beneficial or detrimental functions under context-specific conditions at multiple body sites. In response to colonization of the small intestine with SFB, a microbe that enforces protection from enteropathogenic bacteria, TH17 cells promote strengthening of the epithelial barrier. Production of cytokines by SFB-specific TH17 cells is enhanced by local epithelial cell-derived SAA1 and SAA2, as a consequence of a signaling circuit that involves myeloid cell-derived IL-23 inducing ILC3 to produce IL-22 that, in turn, stimulates the epithelial cells. These observations prompted us to propose that TH17 cell effector functions are acquired in two steps, with SAA-independent priming of naïve SFB-specific T cells in the draining mesenteric lymph nodes, accompanied by their differentiation into RORγt+ poised TH17 cells, followed by migration to the lamina propria, where exposure to the SAAs results in up-regulation of IL-17 cytokines. The protective function of this type of TH17 cell is highlighted by the findings that blockade of IL-17A promoted epithelial barrier permeability, exacerbating DSS-induced colitis (Lee et al., 2015), and by clinical trials targeting IL-17A or IL-17RA, that failed to ameliorate CD and resulted in higher rates of adverse events or disease worsening (Hueber et al., 2012; Targan et al., 2016).
In light of the previous results, which suggested that SAAs act on poised RORγt+ cells, we were surprised to find that SAAs act directly on naïve T cells, instructing their differentiation into TH17 cells in combination with the STAT3-activating cytokine IL-6. This SAA activity was critical for pathogenicity of TH17 cells in models of colitis and EAE, and likely reflects a program of differentiation distinct from that mediated by other combinations of cytokines both in vitro and in vivo.
SAA-dependent differentiation of pathogenic TH17 cells.
In vitro, SAA1 induced a pathogenic TH17 program independently of TGF-β signaling. TGF-β has been shown to be dispensable for TH17 cell differentiation under some conditions both in vitro and in vivo. For example, genetic repression of TH1 and TH2 cell differentiation was shown to relieve the requirement for TGF-β in IL-6-mediated TH17 cell induction and, indeed, TH17 cells can be differentiated in vitro by a combination of IL-6, IL-23 and IL-1β (Das et al., 2009; Ghoreschi et al., 2010). Recently, Wan and colleagues revealed that SKI, via SMAD4, transcriptionally repressed Rorc and that TGF-β signaling degraded or modified SKI to relieve the inhibition and promote TH17 cell differentiation in the presence of IL-6 (Zhang et al., 2017). Our studies indicate that SAAs function independently of STAT3 or the SMAD transcription factors, and that they do not regulate SKI degradation (J-Y.L., unpublished). Elucidation of the receptor(s) and signaling pathways(s) engaged by the SAAs will be needed to provide insight into how they promote distinct differentiation programs for homeostatic and pathogenic TH17 cells.
Context-dependent regulation of Th17 cell differentiation by SAAs
The requirement for inducible SAAs in mouse inflammatory disease models and the selective expression of SAAs in inflamed tissue from human IBD patients support a role for these secreted proteins in TH17-mediated inflammatory disease. Our results reveal that the effects of SAAs are subject to the context of TH17 cell differentiation. In SFB-mediated TH17 induction, the SAAs do not contribute to priming, but rather amplify the effector functions of TH17 cells in SFB-colonized regions. These “homeostatic” TH17 cells do not become pathogenic even under pro-colitogenic conditions, as occurs upon blockade of the IL-10 signaling pathway (Xu et al., 2018). By contrast, in the absence of IL-10, H. hepaticus-specific CD4+ T cells no longer adopt a Treg cell fate, but instead differentiate into colitis-inducing pathogenic TH17 cells with a transcriptome that is strikingly different from that of homeostatic TH17 cells (Chai et al., 2017; Xu et al., 2018). The SAAs support this H. hepaticus-driven colitis, inducing pathogenic features exemplified by T-bet expression during TH17 priming and sensitization of the T cells to cytokines essential for TH17-mediated autoimmune pathogenesis, such as IL-23 and IL-1β.
The SAA proteins thus have critical roles during TH17 cell induction and potentiation of effector functions. It remains unclear what distinguishes these properties that are associated with pathogenic and homeostatic TH17 cells. It may be a feature of the microenvironment of T cell priming, e.g. in lymph nodes draining a healthy small intestine versus an inflamed large intestine, and of the other cytokines that are present; of the concentration of SAAs that are encountered; or of the cell types that produce the SAAs. A better understanding of how SAAs participate in TH17 cell differentiation may permit selective targeting of potentially harmful TH17 cells while sparing the beneficial cells.
SAAs in mouse and human
In mouse inflammation models, we found that SAA1 and SAA2 were prominently produced by hepatocytes after systemic immune activation and by intestinal epithelial cells adjacent to colonizing bacteria, whereas SAA3 was produced by myeloid cells in both the gut and CNS. We discovered that SAA3 advanced a feed-forward loop that sustained murine TH17 responses and drove EAE pathology. Although SAA3 does not encode a full protein in humans, there are reports of inducible SAA1/2 expression by macrophages in inflamed tissues of multiple chronic inflammatory diseases (De Buck et al., 2016; Meek et al., 1994; Ye and Sun, 2015). Moreover, we and others found that tissue-derived SAA1 and SAA2 are not limited to the epithelium during inflammation. Fibroblast-like synoviocytes were shown to express and secrete SAA1/2 in rheumatoid arthritis patients (O'Hara et al., 2000), and we observed that activated fibroblasts in the inflamed parenchyma of CD patients expressed SAA1 and SAA2. Given our findings and links between activated fibroblast abundance and primary anti-TNFα resistance in Crohn’s disease (West et al., 2017), it will be important to investigate whether SAAs play a causal role in this disease setting. Taken together, these findings suggest that the evolution of SAA3 into a pseudogene in humans may be ascribed to functional redundancies with SAA1 and SAA2. However, we cannot rule out that SAA3 has a unique role in the mouse, particularly since it is considerably less effective than SAA1 and SAA2 in directing TH17 cell differentiation in the absence of TGF-β.
SAA signaling to TH17 cells in inflammatory disease
Although our results clearly demonstrate that SAAs interact directly with T cells and promote TH17 cell programming and response amplification, these secreted proteins also have effects on multiple other cell types. Several receptors have been described for the SAAs, including TLR2 and FPRL-1 (Ye and Sun, 2015), but inactivation of the genes for these candidate molecules had no effect on SAA1-induced Th17 cell differentiation (J-Y.L., unpublished). While we cannot rule out SAA functions through other cell types during in vivo pathogenic TH17 cell differentiation, our results strongly support a substantial contribution through direct interaction with T cells. In particular, the finding that enforced expression of SAA1 by hepatocytes overcame non-pathogenic TH17-TGFβ priming to promote EAE is consistent with sensitization of the T cells to render them more responsive to IL-23 and potentially other pro-inflammatory cytokines.
The general importance of the SAAs in maintaining the pathogenic programming of TH17 cells was underscored by the reductions in colitis and EAE observed when tissue SAAs were absent in mice. Elucidation of the receptor(s) for SAAs on T cells will resolve the relative contributions of direct and indirect signaling cues delivered by SAAs to T cells. However, the combined results showing that SAAs provide a previously unappreciated means for inducing inflammatory TH17 cells and that adoptively transferred antigen-specific T cells confer pathogenicity based on their response to SAAs argue strongly that the disease phenotypes in SAA-deficient mice were due, at least in part, to the breach of direct SAA interactions with T cells. Together, these findings suggest that a better understanding of TH17 cell responses modulated by SAAs will facilitate therapeutic efforts to ameliorate inflammatory diseases and enforce epithelial barrier integrity.
STAR Methods
LEAD CONTACT AND MATERIALS AVAILABILITY
Further information and requests for resources and reagents should be directed to and will be fulfilled by the Lead Contact, Dan R. Littman (Dan.Littman@med.nyu.edu).
EXPERIMENTAL MODEL AND SUBJECT DETAILS
Mouse Strains
C57BL/6J mice were purchased from The Jackson Laboratory. All transgenic animals were bred and maintained in specific-pathogen free (SPF) conditions within the animal facility of the Skirball Institute (NYU School of Medicine. Saa1/2 double-knockout (SAADKO) mice were previously described (Eckhardt et al., 2010) and maintained bred to the Il17a-GFP reporter strain (JAX; C57BL/6-Il17atm1Bcgen/J). H.hepaticus (Hh)-specific Th17-TCR tg (HH7) mice were previously described (Xu et al., 2018) and maintained on a Ly5.1 background (JAX; B6. SJLPtprca Pepcb/BoyJ). MOG-specific TCR transgenic (2D2, JAX; C57BL/6-Tg (Tcra2D2,Tcrb2D2)1 Kuch/J) mice were purchased from Jackson Laboratories, and maintained on an Ly5.1 background. CD4-dnTGFBRII (JAX; B6.Cg-Tg(Cd4-TGFBR2)16Flv/J) mice were purchased from Jackson Laboratories. Il-23r-GFP mice were provided by M. Oukka (Awasthi et al., 2009). Cx3cr1CreER (JAX; B6.129P2(Cg)-Cx3cr1tm2.1(cre/ERT2)Litt/WganJ) mice were bred with Rosa26LoxP-STOP-LoxP-DsRed (R26DsRed) mice to fate-label microglia (Parkhurst et al., 2013). Saa3 knockout (SAA3KO) and Saa1/2/3 triple-knockout (SAATKO) mice were generated using CRISPR-Cas9 technology. A premature stop codon was inserted into exon 2 of the Saa3 locus in WT (for SAA3KO) or Saa1/2 knock-out (for SAATKO) zygotes. Guide RNA and HDR donor template sequences are listed in Table S1. Inducible SAA1 knock-in mice (LoxP-STOP-LoxP-SAA1; LSL-SAA1) mice were generated by targeted insertion of the STOP-eGFP-ROSA26TV cassette (Addgene Plasmid 15912: CTV vector), in which the mouse Saa1 gene was sub-cloned, into the ROSA26 locus (Figure S6H). Without Cre-recombinase LSL-SAA1 mice were healthy, fertile, and born in Mendelian ratios. All in-house developed strains were generated by the Rodent Genetic Engineering Core (RGEC) at NYULMC. LSL-SAA1 mice were bred with Albumin-Cre (JAX; B6.Cg-Speer6-ps1Tg(Alb-cre)21Mgn/J) mice to generate liver-specific SAA1 overexpressing mice (LSL-SAA1/Alb-cre) (Figure S6H). Age-(6-12 weeks) and sex-(both males and females) matched littermates stably colonized with Segmented Filamentous Bacteria (SFB) were used for all experiments. To assay SFB colonization, SFB-specific 16S primers were used and universal 16S and/or host genomic DNA were quantified simultaneously to normalize SFB colonization in each sample. All animal procedures were performed in accordance with protocols approved by the Institutional Animal Care and Usage Committee of New York University School of Medicine.
Human IBD samples
Pinch biopsies were obtained from the colon tissues (distal and rectum) of adult UC patients (Sex: 2 males and 5 females; Age (mean ± sd) : 33 ± 11) undergoing surveillance colonoscopy using 2.8 mm standard biopsy forceps, after protocol review and approval by the New York University School of Medicine Institutional Review Board (Mucosal Immune Profiling in Patients with Inflammatory Bowel Disease; S12-01137). All biopsies were collected in ice cold complete RPMI (RPMI 1640 medium, 10% fetal bovine serum (FBS), penicillin/streptomycin /glutamine, 50 μM 2-mercaptoethanol). Inflammation status of rectal tissue included in the study was confirmed by pathological examination as chronic active colitis.
In vitro T cell culture and phenotypic analysis
Mouse T cells were purified from lymph nodes and spleens of six to eight week old mice, by sorting live (DAPI-), CD4+CD25−CD62L+CD44low naïve T cells using a FACSAria (BD). Detailed antibody information is provided above (Flow cytometry). Cells were cultured in IMDM (Sigma) supplemented with 10% heat-inactivated FBS (Hyclone), 10U/ml penicillin-streptomycin (Invitrogen), 10μg/ml gentamicin (Gibco), 4 mM L-glutamine, and 50 μM β-mercaptoethanol. For T cell polarization, 1 x 10⁵ cells were seeded in 200 μl/well in 96-well plates that were pre-coated with a 1:20 dilution of goat anti-hamster IgG in PBS (STOCK = 1mg/ml, MP Biomedicals Catalog # 55398). Naïve T cells were primed with anti-CD3ε (0.25μg/mL) and anti-CD28 (1μg/mL) for 24 hours prior to polarization. Cells were further cultured for 48h under TH-lineage polarizing conditions; Control (Con. : 20 ng/mL IL-6, 2.5 μg/mL anti-IL-4, 2.5 μg/mL anti-IFNγ, 10 μg/mL anti-TGFβ), TH17-TGFβ (0.3 ng/mL TGF-β, 20 ng/mL IL-6, 2.5 μg/mL anti-IL-4, 2.5 μg/mL anti-IFNγ), TH17-SAA1 (0.15-10 μg/mL rmSAA1 (R&D systems or homemade), 20 ng/mL IL-6, 2.5 μg/mL anti-IL-4, 2.5 μg/mL anti-IFNγ, 10 μg/mL anti-TGFβ) and TH1 (100U/ml IL-2, 20ng/ml IL-12, 2.5 μg/mL anti-IL-4). For the SAA1 blocking assay, 2.5μg/ml of rmSAA1 was preincubated with various amount (6.25μg/ml, 12.5μg/ml, 25μg/ml, 50μg/ml) of anti-mSAA1 (R&D systems, polyclonal goat IgG, antigen affinity-purified) or control polyclonal goat IgG (R&D systems) antibodies for 30 minutes prior to the treatment.
Human naïve CD4+ T cells were isolated from cord blood of healthy donors using anti-human CD4 MACS beads (Miltenyi), followed by CD4+CD25−HLA-DR−CD45RO−CD45RAhi staining and sorting using a FACSAria (BD). Human naïve CD4+ T cells were cultured for 6 days in 96-well U bottom plates with 10 U/ml of IL-2, 20 ng/mL of IL-1β, 20 ng/ml of IL-23, 1 ng/ml of TGF-β, 2.5 μg/ml of anti-IL-4, 2.5 μg/mL of anti-IFNγ and anti-CD3/CD28 activation beads (LifeTechnologies) at a ratio of 1 bead per cell, as previously described (Manel et al., 2008). For monitoring cell surface expression of CCR6 on human TH17 cells by recombinant SAA treatment (Figure S3C and S3D), isolated human naïve CD4+ T cells were cultured in anti-human CD3 (OKT3)-coated 96-well flat bottom plates with 50 ng/mL of IL-1β and 50 ng/ml of IL-23, as previously described (Revu et al., 2018). 20 μg/ml of recombinant human SAA (rhSAA) proteins and 10 μg/ml anti-TGFβ neutralizing antibodies (BioXcell) were added into the culture medium during the TH17 differentiation.
METHOD DETAILS
Flow cytometry
Single cell suspensions were pelleted and resuspended with surface-staining antibodies in HEPES Buffered HBSS. Staining was performed for 20-30min on ice. Surface-stained cells were washed and resuspended in live/dead fixable blue (ThermoFisher) for 5 minutes prior to fixation. For transcription factor staining, cells were treated using the FoxP3 staining buffer set from eBioscience according to the manufacturer’s protocol. Intracellular stains were prepared in 1X eBioscience permwash buffer containing anti-CD16/anti-CD32, normal mouse IgG (conc), and normal rat IgG (conc). Staining was performed for 30-60min on ice. For cytokine analysis, cells were initially incubated for 3h in RPMI or IMDM with 10% FBS, phorbol 12-myristate 13-acetate (PMA) (50 ng/ml; Sigma), ionomycin (500 ng/ml;Sigma) and GolgiStop (BD). After surface and live/dead staining, cells were treated using the Cytofix/Cytoperm buffer set from BD Biosciences according to the manufacturer’s protocol. Intracellular stains were prepared in BD permwash in the same manner used for transcription factor staining. Absolute numbers of isolated cells from peripheral mouse tissues in all studies were determined by comparing the ratio of cell events to bead events of CountBright™ absolute counting beads. Flow cytometric analysis was performed on an LSR II (BD Biosciences) or an Aria II (BD Biosciences) and analyzed using FlowJo software (Tree Star).
Isolation of Colonic Epithelial Cells
The large intestine was removed immediately after euthanasia, carefully stripped of mesenteric fat and the cecal patch, sliced longitudinally and vigorously washed in cold HEPES buffered (25mM), divalent cation-free HBSS to remove all fecal traces. The tissue was cut into 1-inch fragments and placed in a 50ml conical containing 10ml of HEPES buffered (25mM), divalent cation-free HBSS and 2 mM of fresh DTT. The conical was placed in a bacterial shaker set to 37 °C and 200rpm for 7 minutes After 20 seconds of vigorously shaking the conical by hand, the process was repeated once more. After 20 seconds of vigorously shaking the conical by hand, the tissue was moved to a fresh conical containing 10ml of HEPES buffered (25mM), divalent cation-free HBSS and 5 mM of EDTA. The conical was placed in a bacterial shaker set to 37 °C and 200rpm for 7 minutes. After 20 seconds of vigorously shaking the conical by hand, the EDTA wash was repeated once more. Both EDTA washes were combined, passed through a 100μM filter, then spun down at 1000rpm for 5 minutes with no brake. The supernatant was carefully aspirated and the pellet resuspended in 8ml of HEPES buffered (25mM), 5% FBS-supplemented, divalent cation-free HBSS containing 4mM CaCl2, DNase I (100 μg/ml; Sigma), dispase (0.05 U/ml; Worthington) and then transferred into a 15ml conical. The conical was placed horizontally in a bacterial shaker set to 37 °C and 180rpm for 7 minutes. The suspension was pipetted up-down multiple times to ensure homogenization and before adding HEPES buffered (25mM), divalent cation-free HBSS to volume. The sample was spun down at 1000rpm for 5 minutes with no brake and resuspended in an Ab cocktail to enrich for IECs (See Key Resource Table under IEC sorting) and stained for 15 minutes on ice. The cells were washed, spun down and resuspended in 2% FBS-supplemented DMEM containing DAPI and 1mM EDTA. CD326+ (Epcam1) cells were isolated through a 100 μM nozzle using a Sony SH800S.
KEY RESOURCE TABLE
| REAGENT or RESOURCE | SOURCE | IDENTIFIER |
|---|---|---|
| Antibodies | ||
| Flow Cytometry: anti-mouse CD3 (17A2) AlexaFluor700 | ThermoFisher | Cat. 56-0032 |
| Flow Cytometry: anti-mouse CD4 (RM4-5) eFluor450 | ThermoFisher | Cat. 48-0042 |
| Flow Cytometry: anti-mouse CD11b (M1/70) PerCP-cy5.5 | ThermoFisher | Cat. 45-0112 |
| Flow Cytometry: anti-mouse CD11c (N418) PerCP-cy5.5 | ThermoFisher | Cat. 45-0114 |
| Flow Cytometry: anti-mouse CD14 (Sa2-8) FITC | ThermoFisher | Cat. 11-0141 |
| Flow Cytometry: anti-mouse CD14 (Sa2-8) PerCP-cy5.5 | ThermoFisher | Cat. 45-0141 |
| Flow Cytometry: anti-mouse CD19 (1D3) PerCP-cy5.5 | TONBO | Cat. 65-0193 |
| Flow Cytometry: anti-mouse CD25 (PC61) PE-Cy7 | TONBO | Cat. 60-0251 |
| Flow Cytometry: anti-mouse CD44 (IM7) BV500 | BD Bioscience | Cat. 563114 |
| Flow Cytometry: anti-mouse CD45.1 (A20) BV650 | BD Bioscience | Cat. 563754 |
| Flow Cytometry: anti-mouse CD45.2 (104) APC-e780 | ThermoFisher | Cat. 47-0454 |
| Flow Cytometry: anti-mouse CD62L (MEL-14) APC | ThermoFisher | Cat. A14720 |
| Flow Cytometry: anti-mouse TCRβ (H57-597) PerCP-cy5.5 | ThermoFisher | Cat. 45-5961 |
| Flow Cytometry: anti-mouse TCRβ (H57-597) BV711 | BD Bioscience | Cat. 563135 |
| Flow Cytometry: anti-mouse TCR Vα3.2 (RR3-16) FITC | ThermoFisher | Cat. 11-5799 |
| Flow Cytometry: anti-mouse TCR Vβ6 (RR4-7) FITC | BD Bioscience | Cat. 553193 |
| Flow Cytometry: anti-mouse MHCII (M5/114.15.2) PE | ThermoFisher | Cat. 12-5321 |
| Flow Cytometry: anti-mouse MHCII (M5/114.15.2) PerCP-cy5.5 | BD Bioscience | Cat. 562363 |
| Flow Cytometry: anti-mouse NK1.1 (PK136) PerCP-cy5.5 | ThermoFisher | Cat. 45-5941 |
| Flow Cytometry: anti-mouse KLRG1 (2F1) PerCP-eFluor710 | ThermoFisher | Cat. 46-5893 |
| Flow Cytometry: anti-mouse Bcl6 (K112-91) BV421 | BD Bioscience | Cat. 563363 |
| Flow Cytometry: anti-mouse FoxP3 (FJK-16s) FITC | ThermoFisher | Cat. 53-5773 |
| Flow Cytometry: anti-mouse RORγt (B2D) PE | ThermoFisher | Cat. 12-6981 |
| Flow Cytometry: anti-mouse RORγt (Q31-378) BV421 | BD Bioscience | Cat. 562894 |
| Flow Cytometry: anti-mouse T-bet (eBio4B10) PE-cy7 | ThermoFisher | Cat. 25-5825 |
| Flow Cytometry: anti-mouse IL-17A (eBio17B7) eFluor660 | ThermoFisher | Cat. 50-7177 |
| Flow Cytometry: anti-mouse IL-17F (9D3.1C8) AlexaFluor488 | Biolegend | Cat. 517006 |
| Flow Cytometry: anti-mouse GM-CSF (MP1-22E9) PE | ThermoFisher | Cat. 12-7331 |
| Flow Cytometry: anti-mouse IFNγ (XM61.2) eFluor450 | ThermoFisher | Cat. 48-7311 |
| Flow Cytometry: anti-human CD4 (RPA-T4) PacBlue | BD Pharmingen | Cat. 558116 |
| Flow Cytometry: anti-human CD25 (2A3) PE | BD Pharmingen | Cat. 341009 |
| Flow Cytometry: anti-human CD45RA (HI100) FITC | ThermoFisher | Cat. 11-0458 |
| Flow Cytometry: anti-human CD45RO (UCHL1) APC | ThermoFisher | Cat. 17-0457 |
| Flow Cytometry: anti-human CCR6 (11A9) BV421 | BD Pharmingen | Cat. 565925 |
| Flow Cytometry: anti-human HLA-DR (LN3) APC-eFluor780 | ThermoFisher | Cat. 47-9956 |
| Flow Cytometry: anti-human IL-17A (Bio64DEC17) PE | ThermoFisher | Cat. 12-7179 |
| Flow Cytometry: anti-human IFNγ (4S.B3) eFluor450 | ThermoFisher | Cat. 48-7319 |
| Flow Cytometry: anti-human RORγt (Q21-559) | BD Pharmingen | Cat. 563081 |
| IEC sorting: anti-mouse CD326 (G8-8) PeCY7 | ThermoFisher | Cat. 11-5791 |
| IEC sorting: anti-mouse CD326 (G8-8) FITC | ThermoFisher | Cat. 25-5791 |
| IEC sorting: anti-mouse CD11b (M1/70) APC | ThermoFisher | Cat. 17-0112 |
| IEC sorting: anti-mouse CD31 (390) APC | ThermoFisher | Cat. 17-0311 |
| IEC sorting: anti-mouse TCRgd (eBioGL3) APC | ThermoFisher | Cat. 17-5711 |
| IEC/APC sorting: anti-mouse CD3 (145-2C11) APC | TONBO | Cat. 20-0031 |
| APC sorting: anti-mouse CD19 (eBio1D3) APC | ThermoFisher | Cat. 17-0193 |
| APC sorting: anti-mouse NK1.1 (PK136) APC | ThermoFisher | Cat. 17-5941 |
| APC sorting: anti-mouse CD11c (N418) PeCY7 | ThermoFisher | Cat. 17-0114 |
| APC sorting: anti-mouse CD14 (Sa2-8) FITC | ThermoFisher | Cat. 11-0141 |
| APC sorting: anti-mouse MHCII (M5/114.15.2) PE | ThermoFisher | Cat. 12-5321 |
| Immunoblotting: anti-Smad2/3 (D7G7) XP® Rabbit | Cell Signaling technology | Cat. 8685 |
| Immunoblotting: anti-Phospho-Smad2 (Ser465/467)/Smad3 (Ser423/425) (D27F4) Rabbit | Cell Signaling technology | Cat. 8828 |
| Immunoblotting: anti-p38 MAPK | Cell Signaling technology | Cat. 9212 |
| Immunoblotting: anti-Phospho-p38 MAPK (Thr180/Tyr182) | Cell Signaling technology | Cat. 9211 |
| Immunoblotting: ant-β-Tubulin | Cell Signaling technology | Cat. 2146 |
| Immunoblotting: anti- mouse Serum Amyloid A1/A2 | R&D systems | Cat. AF2948 |
| In vitro T cell differentiation: anti-hamster IgGs | MP Biomedicals Catalog |
Cat. 55398 |
| In vitro T cell differentiation: anti-mouse CD3ε (145-2C11) | BioXCell | Cat. BP0001-1 |
| In vitro T cell differentiation: anti-mouse CD28 (37.51) | BioXCell | Cat. BE0015-1 |
| In vitro T cell differentiation: anti-mouse IL-4 (11B11) | BioXCell | Cat. BP0045 |
| In vitro T cell differentiation: anti-mouse IFNγ (XMG1.2) | BioXCell | Cat. BP0055 |
| In vitro T cell differentiation: anti-TGFβ (1D11.16.8) | BioXCell | Cat. BP0057 |
| In vitro T cell differentiation: anti-human CD3ε (OKT-3) | BioXCell | Cat. BE0001-2 |
| In vitro T cell differentiation: anti-human IL-4 (8D4-8) | ThermoFisher | Cat. 14-7049-85 |
| In vitro T cell differentiation: anti-human IFNγ (MD-1) | ThermoFisher | Cat. 14-7317-85 |
| Dynabeads™ Human T-Activator CD3/CD28 for T Cell Expansion and Activation | Thermo Fisher Scientific |
Cat. 11131D |
| In vivo IL-10R blockade: anti-mouse IL10R (1B1.3A) | BioXCell | Cat. BE0050 |
| Immunohistochemistry: anti-mouse SAA1/2 | R&D Systems | Cat. AF2948 |
| Immunohistochemistry: anti-mouse SAA3 | Abcam | Cat. Ab231680 |
| Immunohistochemistry: anti-mouse Iba-1 | Wako | Cat. 019-19741 |
| Immunohistochemistry: anti-mouse CD4-BV510 | Biolegend | Cat. 100559 |
| Immunohistochemistry: anti-human SAA1/2 | Abcam | Cat. Ab207445 |
| Immunohistochemistry: anti-human SAA | Dako | Cat. M0759 |
| Immunohistochemistry: anti-human CD326-BV605 | Biolegend | Cat. 324224 |
| Immunohistochemistry: Donkey anti-goat 488 | Life Technologies | Cat. A11055 |
| Immunohistochemistry: Donkey anti-rat 594 | Life Technologies | Cat. A21209 |
| Immunohistochemistry: Donkey anti-rabbit 647 | Life Technologies | Cat. A21447 |
| Immunohistochemistry: Goat anti-Rabbit 488 | Life Technologies | Cat. A11070 |
| Bacterial and Virus Strains | ||
| Helicobacter Hepaticus | Gift from James Fox (MIT) | N/A |
| Biological Samples | ||
| Fetal Bovine Serum | Atlanta Biologicals | Cat. S11195 Lot. A16003 |
| Chemicals, Peptides, and Recombinant Proteins | ||
| EDTA, 0.5M, pH8.0 | Ambion | Cat. AM9260G |
| Collagenase D | Roche | Cat. 11088882001 |
| Dispase | Worthington | Cat. LS02104 |
| DNase I | Sigma | Cat. DN25 |
| DTT | Sigma | Cat. D9779 |
| Percoll | GE Healthcare Life Sciences | Cat. 45001747 |
| Ficoll-Paque Premium | GE Healthcare Life Sciences | Cat. 17-5442-02 |
| 2-Mercaptoethanol (BME) | ThermoFisher | Cat. 21985023 |
| Phorbol Myristate Acetate | Sigma | Cat. P1585 |
| Ionomycin | Sigma | Cat. I0634 |
| Recombinant Human IL-2 | NIH AIDS Reagent Program | Cat. 136 |
| Recombinant Human IL-23 Protein | R&D systems | Cat. 1290-IL |
| Recombinant Human IL-1 beta/IL-1F2 Protein | R&D systems | Cat. 201-LB |
| Recombinant Human TGFβ Protein | Peprotech | Cat. 100-21-10ug |
| Recombinant Human Serum Amyloid A1 Protein | CEPTER Biopartners | N/A |
| Recombinant Human Serum Amyloid A2 Protein | CEPTER Biopartners | N/A |
| Recombinant Mouse Serum Amyloid A1 Protein | R&D systems | Cat. 2948-SA |
| Recombinant Mouse Serum Amyloid A3 Protein | CEPTER Biopartners | N/A |
| Recombinant Mouse IL-6 Protein | R&D systems | Cat. 406-ML-200/CF |
| Recombinant Mouse IL-1 beta/IL-1F2 Protein | R&D systems | Cat. 401-ML |
| Recombinant Mouse IL-23 Protein | R&D systems | Cat. 1887-ML |
| Recombinant Mouse IL-12 Protein | R&D systems | Cat. 419-ML |
| Critical Commercial Assays | ||
| SAA Mouse ELISA Kit | ThermoFisher | Cat. KMA0021 |
| IL-6 Mouse ELISA Kit | ThermoFisher | Cat. KMC0061 |
| IL-1β Mouse ELISA Kit | ThermoFisher | Cat. BMS6002 |
| IL-23 Mouse ELISA Kit | ThermoFisher | Cat. BMS6017 |
| LIVE/DEAD® Fixable Blue Dead Cell Stain Kit | ThermoFisher | Cat. L34961 |
| CountBright™ absolute counting beads | ThermoFisher | Cat. C36950 |
| BD Cytofix/Cytoperm Plus Fixation/Permeabilization Solution Kit | BD Biosciences | Cat. 554714 |
| eBioscience™ Foxp3 / Transcription Factor Staining Buffer Set |
ThermoFisher | Cat. 00-5523-00 |
| LightCycler® 480 SYBR Green I Master | Roche Life Science | Cat. 04707516001 |
| SuperScript™ III First-Strand Synthesis System | ThermoFisher | Cat. 18080051 |
| RNeasy Mini Kit | QIAGEN | Cat. 74104 |
| RNeasy MinElute Cleanup Kit | QIAGEN | Cat. 74204 |
| RNase-Free DNase Set | QIAGEN | Cat. 79254 |
| TRIzol™ Reagent | ThermoFisher | Cat. 15596026 |
| BD GolgiPlug Protein Transport Inhibitor | BD Biosciences | Cat. 555029 |
| BD GolgiStop Protein Transport Inhibitor | BD Biosciences | Cat. 554724 |
| Deposited Data | ||
| RNA-seq raw and analyzed data: in vitro polarized Th17-SAA1 and Th17-TGFβ | This paper | GEO: GSE132761 |
| RNA-seq raw and analyzed data: ex vivo microglia and monocyte-derived macrophages isolated from EAE CNS. | This paper | GEO: GSE133180 |
| Experimental Models: Cell Lines | ||
| Plat-E Retroviral Packaging Cell Line | Cell Biolabs, INC. | RV-101 |
| Experimental Models: Organisms/Strains | ||
| C57BL/6J | The Jackson Laboratory |
JAX:000664 |
| C57BL/6-Il17atm1Bcgen/J | The Jackson Laboratory |
JAX: 018472 |
| B6. SJL Ptprca Pepcb/BoyJ | The Jackson Laboratory |
JAX:002014 |
| C57BL/6-Tg(Tcra2D2,Tcrb2D2)1Kuch/J | The Jackson Laboratory |
JAX:006912 |
| B6.Cg-Tg(Cd4-TGFBR2)16Flv/J | The Jackson Laboratory |
JAX:005551 |
| B6.129P2(Cg)-Cx3cr1tm2.1(cre/ERT2)Litt /WganJ | The Jackson Laboratory |
JAX: 021160 |
| B6.Cg-Speer6-ps1Tg(Alb-cre)21Mgn/J | The Jackson Laboratory |
JAX:003574 |
| ROSa26LoxP-STOP-LoxP-DsRed | Gift of the Wenbiao Gan laboratory |
https://www.sciencedirect.com/science/article/pii/S0092867413014815?via%3Dihub |
| IL23R-GFP knock-in reporter mice | Gift of the Mohamed Oukka laboratory | http://www.jimmunol.org/content/182/10/5904.long |
| LoxP-STOP-LoxP-SAA1; LSL-SAA1 | This paper | N/A |
| SAA1/2 double knock-out (DKO) | Gift from Frederick De Beer | https://www.cell.com/cell/fulltext/S0092-8674(15)01113-7 |
| SAA1/2/3 triple knock-out (TKO) | This paper | N/A |
| SAA3 knock-out (3KO) | This paper | N/A |
| Oligonucleotides | ||
|
Saa1 qRT-PCR forward primer: CATTTGTTCACGAGGCTTTCC |
Derebe MG. et al., 2014 | https://elifesciences.org/articles/03206 |
|
Saa1 qRT-PCR reverse primer: GTTTTTCCAGTTAGCTTCCTTCATGT |
Derebe MG. et al., 2014 | https://elifesciences.org/articles/03206 |
|
Saa2 qRT-PCR forward primer: TGATGCTGCCCAAAGG |
Liu J. et al., 2016 | https://jneuroinflammation.biomedcentral.com/articles/10.1186/s12974-016-0493-y |
| Saa2 qRT-PCR reverse primer: GCCAGGAGGTCTGTAGTAA | Liu J. et al., 2016 | https://jneuroinflammation.biomedcentral.com/articles/10.1186/s12974-016-0493-y |
|
Saa3 qRT-PCR forward primer: CGCAGCACGAGCAGGAT |
This paper | |
| Saa3 qRT-PCR reverse primer: TGGCTGTCAACTCCCAGG | This paper | |
| Gapdh qRT-PCR forward primer: AATGTGTCCGTCGTGGATCT | Sano, T. et al., 2015 | https://www.cell.com/cell/pdfExtended/S0092-8674(15)01113-7 |
| Gapdh qRT-PCR forward primer: CATCGAAGGTGGAAGAGTGG | Sano, T. et al., 2015 | https://www.cell.com/cell/pdfExtended/S0092-8674(15)01113-7 |
| Universal 16S qPCR forward primer: ACTCCTACGGGAGGCAGCAGT | Sano, T. et al., 2015 | https://www.cell.com/cell/pdfExtended/S0092-8674(15)01113-7 |
| Universal 16S qPCR reverse primer: ATTACCGCGGCTGCTGGC | Sano, T. et al., 2015 | https://www.cell.com/cell/pdfExtended/S0092-8674(15)01113-7 |
| SFB 16S qPCR forward primer: GACGCTGAGGCATGAGAGCAT | Sano, T. et al., 2015 | https://www.cell.com/cell/pdfExtended/S0092-8674(15)01113-7 |
| SFB 16S qPCR reverse primer: GACGGCACGAATTGTTATTCA |
Sano, T. et al., 2015 | https://www.cell.com/cell/pdfExtended/S0092-8674(15)01113-7 |
| H. hepaticus 16S qPCR forward primer: CAACTAAGGACGAGGGTTG | This paper | |
| H. hepaticus 16S qPCR reverse primer: TTCGGGGAGCTTGAAAAC | This paper | |
| Software and Algorithms | ||
| FlowJo | 9.9.6 | https://www.flowjo.com/ |
| Prism | 8.1.0 | https://www.graphpad.com/scientific-software/prism/ |
| IMARIS software | 9.0.1 | Oxford Instruments |
| DEseq2 | 1.22.2 | https://bioconductor.org/packages/release/bioc/html/DESeq2.html |
| Gene Set Enrichment Analysis tool | 3.0 | http://software.broadinstitute.org/gsea/index.jsp |
Isolation of Lamina Propria Lymphocytes
The intestine (small and/or large) was removed immediately after euthanasia, carefully stripped of mesenteric fat and Peyer's patches/cecal patch, sliced longitudinally and vigorously washed in cold HEPES buffered (25mM), divalent cation-free HBSS to remove all fecal traces. The tissue was cut into 1-inch fragments and placed in a 50ml conical containing 10ml of HEPES buffered (25mM), divalent cation-free HBSS and 1 mM of fresh DTT. The conical was placed in a bacterial shaker set to 37 °C and 200rpm for 10 minutes. After 45 seconds of vigorously shaking the conical by hand, the tissue was moved to a fresh conical containing 10ml of HEPES buffered (25mM), divalent cation-free HBSS and 5 mM of EDTA. The conical was placed in a bacterial shaker set to 37 °C and 200rpm for 10 minutes. After 45 seconds of vigorously shaking the conical by hand, the EDTA wash was repeated once more in order to completely remove epithelial cells. The tissue was minced and digested in 5-7ml of 10% FBS-supplemented RPMI containing collagenase (1 mg/ml collagenaseD; Roche), DNase I (100 μg/ml; Sigma), dispase (0.05 U/ml; Worthington) and subjected to constant shaking at 155rpm, 37 °C for 35 min (small intestine) or 55 min (large intestine). Digested tissue was vigorously shaken by hand for 2 min before adding 2 volumes of media and subsequently passed through a 70 μm cell strainer. The tissue was spun down and resuspended in 40% buffered percoll solution, which was then aliquoted into a 15ml conical. An equal volume of 80% buffered percoll solution was underlaid to create a sharp interface. The tube was spun at 2200rpm for 22 minutes at 22 °C to enrich for live mononuclear cells. Lamina propria (LP) lymphocytes were collected from the interface and washed once prior to staining.
For antigen presenting cell (APC) isolation, the cells were resuspended in an Ab cocktail to enrich for APCs (See Ab table under APC sorting) and stained for 15 minutes on ice. The cells were washed, spun down and resuspended in 2% FBS-supplemented DMEM containing DAPI. Dendritic cells and macrophage/inflammatory monocytes were sorted based on MHCII+CD11c+CD14neg and MHCII+CD11c+CD14+ expression, respectively, through a 100 μM nozzle using a Sony SH800S.
For ILC3 isolation, the cells were resuspended in an Ab cocktail to remove cells positive for the following lineage markers (CD3, CD11b, CD11c, CD14, CD19, TCRβ, TCRγ, NK1.1, KLRG1). CD127+CD90+ were sorted through a 70μM nozzle on an Aria II (BD Biosciences).
H. hepaticus-induced colitis
H. hepaticus was provided by J. Fox (MIT) and grown on blood agar plates (TSA with 5% sheep blood, Thermo Fisher) as previously described (Xu et al., 2018). H. hepaticus-induced colitis was induced as described (Kullberg et al., 2006). Briefly, mice were colonized with H. hepaticus by oral gavage on days 0 and 4 of the experiment. 1 mg of an IL-10R-blocking antibody (clone 1B1.2) was administered by intraperitoneal injection once weekly starting at day 0. After 7 days, naïve HH7-2 TCRtg CD4+ T cells were adoptively transferred into the H. hepaticus colonized recipients. Briefly, spleens from donor HH7-2 TCRtg mice were collected and mechanically disassociated. Red blood cells were lysed using ACK lysis buffer (Lonza). Naive HH7-2 Tg CD4+ T cells were sorted as CD4+CD3+CD44loCD62LhiCD25−Vβ6+ on an Aria II (BD Biosciences). Cells were resuspended in ice-cold PBS and transferred into congenic recipient mice via intravenous injection. In order to confirm H. hepaticus colonization, H. hepaticus-specific 16S primers were used on DNA extracted from fecal pellets. Universal 16S were quantified simultaneously to normalize H. hepaticus colonization of each sample.
To score colitis severity, colon and cecum samples were surgically removed from all groups of mice at 12 weeks post IL-10R-blockade injection. The samples were gently swiss rolled from the distal end and fixed in 4% paraformaldehyde (Electron Microscopy Science, Hatfield USA). Formalin-fixed tissues were then processed for paraffin embedding, cut into 5-micron thick sections and stained with hematoxylin and eosin (H&E) as per protocol by the Experimental Pathology Core Laboratory at New York University (NY, USA). H&E scoring was performed in a blinded fashion using coded slides. Total scores for colonic and cecum inflammation were comprised of individual scores from 4 categories: 1) Goblet cells per High Power Field (HPF) (Score of 1: 11 to 28 goblet cells per HPF; Score of 2: 1 to 10 goblet cells per HPF; Score of 3: ≤ 1 goblet cell per HPF). 2) Submucosa edema (Score of 0: no pathological changes; Score of 1: Mild edema accounting for <50% of the diameter of the entire intestinal wall; Score of 2: moderate edema involving 50-80% of the diameter of the entire intestinal wall; Score of 3: profound edema involving >80% of the diameter of the entire intestinal wall). 3) Inflammatory Infiltration Depth (Score of 0: No infiltrate; Score of 1: Infiltration above muscularis mucosae; Score of 2: Infiltration extending to include submucosa; Score of 3: Transmural Infiltration). 4) Epithelial Changes (Score of 0: No changes; Score of 1: Upper third or only surface epithelial missing; Score of 2: Moderate epithelial damage with intact base of crypts; Score of 3: Severe with missing crypts).
Induction of EAE by MOG-immunization or 2D2 transfer
For induction of active experimental autoimmune encephalomyelitis (EAE), mice were immunized subcutaneously on day 0 with 100μg of MOG35-55 peptide, emulsified in CFA (Complete Freund’s Adjuvant supplemented with 2mg/mL Mycobacterium tuberculosis H37Ra), and injected i.p. on days 0 and 2 with 200 ng pertussis toxin (Calbiochem). For induction of attenuated experimental autoimmune encephalomyelitis (EAE) in supplemental figure S6M and S6N, IFA (Incomplete Freund’s Adjuvant), supplemented with 0.2mg/mL Mycobacterium tuberculosis H37Ra, were used with the same immunization scheme. For 2D2 transfer EAE experiments, in vitro polarized 2D2 Th17 cells were injected intravenously into recipient mice at 3 × 10⁶ IL-17A producing 2D2 cells per recipient. Naive 2D2 TCR-transgenic CD4+ T cells from the spleen and lymph nodes of 2D2 mice were electronically sorted (CD4+Vβ11+CD62Lhi) and activated under TH17-polarizing conditions, in the presence of irradiated wild-type splenocytes at a 5:1 ratio, with the following: anti-CD3 (2.5μg/ml) (145-2C11, BioXCell), anti-IL-4 (20μg/ml) (11B11, BioXCell), anti-IFN-γ (20μg/ml) (XMG1.2, BioXCell), mIL-6 (30ng/ml) (Miltenyi Biotec) and hTGF-β1 (3ng/ml) (Miltenyi Biotec). After 48 h of activation, mIL-23 (10 ng/ml; R&D Systems) was added, as necessary. On day 5 of culture, cells were reactivated on plates precoated with 2 μg/ml of anti-CD3 and anti-CD28 (PV1, BioXCell) for an additional 48 h, before adoptive transfer. The EAE scoring system was as follows: 0-no disease, 1- Partially limp tail; 2- Paralyzed tail; 3- Hind limb paresis, uncoordinated movement; 4- One hind limb paralyzed; 5- Both hind limbs paralyzed; 6- Hind limbs paralyzed, weakness in forelimbs; 7- Hind limbs paralyzed, one forelimb paralyzed; 8- Hind limbs paralyzed, both forelimbs paralyzed; 9- Moribund; 10- Death. For isolating mononuclear cells from spinal cords during EAE, spinal cords were mechanically disrupted and dissociated in RPMI containing collagenase (1 mg/ml collagenaseD; Roche), DNase I (100 μg/ml; Sigma) and 10% FBS at 37 °C for 30 min. Leukocytes were collected at the interface of a 40%/80% Percoll gradient (GE Healthcare). Efferent lymph fluids of pre-clinical stage mice were collected from cysterna chyli as previously described (Matloubian et al., 2004).
Microglia and monocyte-derived macrophage isolation from EAE spinal cords
Cx3cr1CreERT2/+/R26DsRed/+ mice were gavaged with 10mg of tamoxifen diluted in corn oil at the age of 28 and 30 days. On day 60 EAE was induced by MOG-immunization and pertussis toxin injection as described. Mice were evaluated daily for weight loss and clinical development of hind limb paralysis. Mice were euthanized at the pre-clinical (day 9-10 post immunization), peak (acute; day 15-17), and chronic (day 25) stages of disease. Spinal cords were harvested, minced and digested as described. After obtaining a single cell suspension, samples were stained with the appropriate antibodies. Microglia cells and infiltrating monocyte-derived macrophage cells were sorted as DsRed+CX3CR1+CD11b+CD45intMHCIIloB220−CD3− (microglia) and DsRed− CX3CR1+ CD11b+CD45hiF480+MHChiB220−CD3− (monocyte-derived cells) on the Aria II (BD Biosciences) respectively.
Tissue Preparation for Immunofluorescence, Confocal Microscopy, and Image Analysis
Tissue preparation for immunofluorescence, confocal microscopy, and image analysis was conducted as described (Perez et al., 2017; Yeung et al., 2014). Briefly, tissues were fixed in paraformaldehyde, lysine, and sodium periodate buffer (PLP, 0.05 M phosphate buffer, 0.1M L-lysine, p.H. 7.4, 2 mg/mL NaIO4, and 10 mg/mL paraformaldehyde) overnight at 4°C followed by 30% sucrose overnight at 4°C and subsequent OCT media embedding. 20-μm frozen tissue sections were sectioned using a Leica CM3050S cryostat. FcR block was with anti-CD16/32 Fc block antibody (Biolegend) diluted in PBS containing 2% goat or donkey serum and 2% fetal bovine serum (FBS) for 1 hour at room temperature. Sections were stained with the indicated antibodies (Tables S2 and S3) diluted in PBS containing 2% goat or donkey serum, 2% FBS, and 0.05% Fc block for 1 hour at room temperature. For the intracellular staining, all antibodies including the Fc block were diluted in PBS containing 2% goat or donkey serum, 2% FBS, and 0.1% Triton-X. Images were acquired using a Zeiss LSM 880 confocal microscope (Carl Zeiss) with the Zen Black software. The imaging data were processed and analyzed using Imaris software version 9.0.1 (Bitplane; Oxford Instruments). Human SAA1/2 confocal images were analyzed by Image J software (NIH, Bethesda, MD) to measure signal intensity. Average signal intensity for each region of interest was normalized to healthy control.
Expression and purification of mouse recombinant SAAs
Escherichia coli codon optimized DNA sequences, encoding SAA isotypes (without the signal sequence), were chemically synthesized (GenScript) and cloned into the pET26(b)+ (Novagen) expression vector between NdeI and HindIII restriction endonuclease sites, with a C-terminal hexa-histidine. Proteins were purified following the previously published protocol (Derebe et al., eLife 2014;3:e03206) with slight modifications. Briefly, proteins were overexpressed in E. coli BL21(DE3) cells by induction with 0.4 mM isopropyl-β-D-galactoside (IPTG) for ~4 hr at 25°C for mSAA1, and at 37°C for mSAA3. Cells were harvested by centrifugation at 5000×g for 20 min at 4°C and re-suspended in ice-cold lysis buffer (50 mM NaH2PO4, 500 mM NaCl, 10 mM imidizole for mSAA1 and 500 mM NaCl, 50 mM Tris pH 8.0, 10 mM imidazole, 15 mM β-mercaptoethanol for mSAA3). After sonication of cell suspension, decyl maltopyranoside (DM) (Avanti Polar Lipids) was added to a final concentration of 40 mM and incubated for ~3 hr at 4°C followed by centrifugation at 14,000×g for 45 min. The supernatant was collected and incubated with Ni-NTA resin (GE Healthcare) pre-equilibrated with ice-cold corresponding lysis buffer containing 4 mM DM (DM buffer) for 3 h at 4 °C under mild mixing conditions to facilitate binding. The column was washed thrice with 25 mM imidazole in DM buffer to remove the non-specific contaminants. Finally, proteins were eluted using an imidazole gradient (in DM buffer) under gravity flow. Fractions containing the protein of interest were pooled and dialyzed against 20 mM Tris-HCl (pH 8.2) containing 500 mM NaCl, 0.1% (w/v) PEG 3350 and 20 mM Imidazole. The dialyzed protein was concentrated in an Amicon stirrer cell apparatus (Millipore) to a final concentration of ~1 mg/mL. Protein purity was assessed by SDS/PAGE.
RNA isolation and cDNA preparation
Total RNAs from in vitro polarized T cells or sorted cell populations were extracted using TRIzol (Invitrogen) followed by DNase I (Qiagen) treatment and cleanup with RNeasy MinElute kit (Qiagen) following manufacturer protocols. For total tissue RNA isolation, dissected tissues were homogenized in TRIzol. cDNA was generated using a Superscript™ III First-Strand Synthesis System (ThermoFisher).
qRT-PCR and qPCR
Quantitative RT-PCR and PCR were performed using the Hot Start-IT SYBR Green (Affymetrix) on the Roche real-time PCR system (Roche 480). For analysis of mRNA transcripts, RNA samples were treated with DNase (Roche) prior to cDNA synthesis to avoid effect of DNA contamination. Gene specific primers spanning exons were used. Values were normalized to GAPDH for each sample.
Library preparation for RNA sequencing
RNA-seq libraries for in vitro polarized TH17 lineages were prepared with the TruSeq Stranded Total RNA Library Prep Gold Kit (Illumina, 20020598). The sequencing was performed using the Illumina NovaSeq or NextSeq. RNA-seq libraries were prepared and sequenced by the Genome Technology Core at New York University School of Medicine.
RNAseq libraries for isolated microglia and CNS-infiltrating monocytes were prepared and sequenced by the Illumina RapidRun at the Genome Services Laboratory, HudsonAlpha.
QUANTIFICATION AND STATISTICAL ANALYSIS
Transcriptome analysis
Fastq files were aligned to the mouse Ensemble genome GRCm38 with STAR v 2.6.1d. Read pairs were counted using featurecounts from the Subread package v 1.6.2, prior to normalization and differential expression analysis which were performed using DESeq2. Gene set enrichment analyses were performed with the Broad Institute's GSEA tool. Potential enrichment of pathogenic and non-pathogenic gene sets defined from previous studies (Lee et al., 2012) were analyzed with the RNAseq data at each time point.
The single cell RNA sequencing data of SAA1 and SAA2 genes in the fibroblast clusters was analyzed as described in (Martin et al., 2019).
Statistical analysis
Differences between groups were calculated using the unpaired two-sided Welch’s t-test or the two-stage step-up method of Benjamini, Krieger and Yekutieliun. For EAE disease induction, log-rank test using the Mantal-Cox method was performed. For RNA-seq analysis, differentially expressed genes were calculated in DESeq2 using the Wald test with Benjamini–Hochberg correction to determine the FDR. GSEA p value was calculated with gene set permutations. Genes were considered differentially expressed with FDR < 0.01 and log2 fold change > 1.2. Data was processed with GraphPad Prism, Version 8 (GraphPad Software). We treated less than 0.05 of p value as significant differences. *p < 0.05, **p < 0.01, ***p < 0.001, and ****p < 0.0001. Details regarding number of replicates and the definition of center/error bars can be found in figure legends.
DATA AND CODE AVAILABILITY
The RNA-sequencing datasets generated during this study are available at Gene Expression Omnibus (GEO: GSE132761, GSE133180).
Supplementary Material
Figure S1. Mouse TH17/Tc17 cell differentiation by SAAs, Related to Figure 1 (A) IL-17A dose response curve to rmSAA1.
(B) Representative IL-17A versus IFNγ expression (left) and summary (right) in WT and TGFβRII DNtg CD4+ T cells following SAA1-induced differentiation.
(C) Dosage-dependent inhibition of rSAA1-induced Th17 cell differentiation by SAA1-neutralizing antibody.
(D, E) Representative IL-17A versus IFNγ expression (D) and RORγt expression (E) in CD8+ T cells cultured under SAA1 or TGF-β differentiation conditions. gMFI of RORγt is in parentheses.
(F) Immunoblotting for p38 MAPK phosphorylation (p-p38) at T180/Y182 of primed CD4+ T cells upon rmSAA1 (10μg/ml) or vehicle (Veh.) treatment for indicated times. Total p38 is shown as a loading control. A summary of 2 experiments with at least 2 biological replicates per experiment.
(A-E) Experiments were conducted based using the same scheme as in Figure 1A.
(A-C) All statistics were calculated using the unpaired two-sided Welch’s t-test. Error bars denote the mean ± s.d. ns = not significant, *p < 0.05, **p < 0.01, ***p < 0.001, ****p < 0.0001.
Figure S2. Transcriptional responses and validation of differentially expressed genes in TH17 cells differentiated with IL6 plus SAA1 or TGF-β, Related toFigure 2
(A) Experimental scheme. Cells were harvested and RNA extracted at 3, 12 and 48 h after polarization.
(B) Clustered heatmap of differentially expressed genes at 48 h timepoint. Color scale is based on normalized read counts. Genes listed on the righthand margin are color coded. Green = non-pathogenic TH17 signature. Maroon = pathogenic TH17 signature. Black = Autoimmune disease associated.
(C-E) Normalized counts of autoimmune disease-associated (Il23r, Il1r1, S100a4) (C), pathogenic (Csf2, Tbx21, Gzmb) (D), or non-pathogenic (Maf, Ahr, Il10) (E) genes at the indicated time points. (F-H) GM-CSF (F and G) and T-bet (H) expression at 48 h. gMFI of T-bet is in parentheses.
(I and J) Representative expression of IFNγ versus IL-17A (I) and T-bet (J) in TH1 cells induced in vitro with IL-2 and IL-12, with and without SAA1, for 48 hrs.
(C-E) Statistics were calculated using the two-stage step-up method of Benjamini, Krieger and Yekutieliun. Error bars denote the mean ± s.d.
(F) Statistics were calculated using the unpaired two-sided Welch’s t-test. Error bars denote the mean ± s.d. ns = not significant, *p < 0.05, ***p < 0.001, and ****p < 0.0001.
Figure S3. Role of SAA in human TH17 cell differentiation and protein expression in inflamed colon tissue from UC patients, Related to Figure 3
(A) Representative FACS plots of IL-17A versus IFNγ expression by in vitro polarized human TH17 cells upon restimulation.
(B and C) Representative FACS plots (B) and summaries (C) indicating cell surface expression of CCR6 on in vitro polarized human TH17 cells upon human recombinant SAA treatment. Connecting lines signify the same donor. Summary of 3 experiments with n = 8 donors.
Statistics were calculated using the paired two-tailed Student’s t-test. *p < 0.05,
(D) Confocal images show prominent SAA expression in biopsies of inflamed tissues from UC patients. Scale bar corresponds to 100μm. SAA1/2 (green), EPCAM (red) and nucleus (Draq7; blue).
Figure S4. Role of SAAs in IL-10R blockade-induced colitis in response to Helicobacter hepaticus, Related to Figure 4
(A) Gating strategy to identify all TH populations amongst HH7-2tg donor-derived cells in the colon lamina propria of representative homeostatic (isotype control IgG-injected) or colitis-developing (anti-IL10R- injected) recipients at 2 weeks post transfer.
(B and C) Characterization of HH7-2tg donor cells in colon lamina propria of recipient mice injected with isotype control Ab. SAATKO (blue boxes, n = 4) and WT (red boxes, n = 4) littermates. Frequencies (B) and numbers (C) of indicated TH cells based on transcription factor staining.
(D and E) Normalized expression of Saa1 (D) and Saa3 (E) in the indicated sort-purified populations from colons of mice treated as in Figure 4A. Tissues were harvested 3-5 days after transfer of HH7-2tg cells.
(F) Normalized expression of Saa1 and Saa2 in ileum of recipient mice.
(G) Percentage of Foxp3+ iTreg cells in isotype-treated recipients (open boxes) versus αIL10RA-treated recipients (solid boxes).
(A-G) Experiments were conducted based on the same scheme as in Figure 4A. Statistics were calculated using the two-stage step-up method of Benjamini, Krieger and Yekutieliun. Error bars denote the mean ± s.d. ns = not significant. *p<0.05, ***p < 0.001.
Figure S5. Distinct sources of SAA production in EAE, Related to Figure 5
(A) Normalized expression of Saa isotypes in the liver at day 15 post MOG-immunization.
(B) SAA1/2 concentrations in lymph fluid collected from thoracic duct, at day 10 post immunization (pre-clinical stage) of EAE.
(C) Expression of SAA1/2 in the spinal cord and liver of WT (n=2) and SAATKO (n=2) at day 15 of EAE. β-tubulin is shown as a loading control. Center lanes marked (M) are molecular weight markers, 14kD for the top and 64kD for the bottom.
(D) Normalized expression of Saa isotypes in the spinal cord at day 15 post MOG-immunization.
(E and F) Expression of SAAs in myeloid cells of the CNS. In order to distinguish microglia (DsRed+) from infiltrating monocyte-derived macrophages, Cx3cr1creER:R26-DsRed mice were injected with tamoxifen at day 28 and day 30, then rested for 30 days before MOG-immunization. RNAseq was performed on sort-purified microglia and infiltrating monocytes. Normalized RNAseq counts of Saa isotypes in microglia (E) and monocyte (F) isolated from CNS of WT mice at the indicated stages of EAE. Data for each condition are the mean of 2 biological replicates.
(G) Representative confocal image of spinal cord cross sections illustrating the specificity of the α-SAA3 Ab used. IBA1 (red), SAA3 (green), and CD4 (aqua).
(H) Quantification of SAA3 and IBA1 colocalization in the CNS at peak of disease activity in mice with MOG-induced EAE. Inflamed regions were determined by the localization of CNS-infiltrating CD4+ T cells (aqua). The frequencies of SAA3/IBA1 colocalization were quantified from 4 separate regions of CNS images by IMARIS.
(A, B, and D) Statistics were calculated using the unpaired two-sided Welch’s t-test. Error bars denote the mean ± s.d. **p < 0.01, and ***p < 0.001.
Figure S6. Role of SAAs in the TH17-dependent 2D2 transfer EAE model, Related to Figure 6
(A-C) Total number (A), percentage that are RORγt+ TH17 (B) and quantification of IL-17A+ (C) transferred 2D2tg donor cells in the CNS of WT (red boxes, n = 8) or SAA3KO (purple boxes, n = 9) recipients on day 17 post-adoptive transfer. Summary of 3 experiments.
(D) In vitro Th17 cell differentiation in response to SAA1 versus SAA3. The experiment was conducted based on the scheme in Figure 1A. Expression of IL-17A versus IFN-γ in in vitro polarized CD4+ T cell with IL-6 and TGFβ neutralizing antibodies ± rmSAA1 (10μg/ml) or ± rmSAA3 (10μg/ml) following restimulation.
(E-G) Comparison of cytokine production following different Th17 cell differentiation conditions. Experiments were conducted based on the scheme in Figure 1A. (E) Expression of IL-17A versus GM-CSF in in vitro polarized CD4+ T cell with TH17-TGFβ (Top: IL6 + TGFβ) or TH17-IL23 (Bottom: IL-6 + IL-1β + IL-23) conditions ± rmSAA1 (10μg/ml) or ± rmSAA3 (10μg/ml) following restimulation. (F and G) Summary of IL-17A frequency. Summary of 4 experiments, with 8 biological replicates.
(H) Schematic of conditional Saa1 targeting construct and generation of liverSaa1mouse.
(I) Serum concentrations of SAA1/2 in liver-Saa1-overexpressing mice (liverSaa1) (red circles, n = 42) or Alb-CreTg (white circles, n = 32) in 6-week-old mice.
(J) Serum concentrations of IL-6 in liverSaa1 (red circles, n = 21) or control Alb-CreTg (white circles, n =15) 6-week-old mice. Serum IL-6 from peak EAE mice (black dots, n=4) were measured as a positive control.
(K and L) Percent of RORγt+ TH17 (K) and Tbet+ TH1 (L) cells amongst Foxp3Neg CD44hi CD4+ T cells in secondary lymph nodes of liverSaa1 (red circles, n = 10) or control Alb-CreTg (white circles, n = 10) 6-week-old mice, summarized over two experiments.
(M and N) Examination of EAE development in liverSAA1 and control Alb-Cretg littermates by attenuated MOG-immunization with low-dose heat-killed Mycobacterium tuberculosis (H37Ra) antigen emulsified in IFA (0.2mg/ml). Summary of 2 experiments, with liverSAA1 (red circles, n = 8) and Alb-Cretg (white circles, n = 9) mice. Incidence of EAE onset (M) and maximum disease score (N).
(A-G and I-N) Statistics were calculated using the unpaired two-sided Welch’s t-test.
(M) Statistics were calculated by log-rank test using the Mantal-Cox method.
Error bars denote the mean ± s.d. ns = not significant, *p < 0.05, **p < 0.01, ***p < 0.001, ****p < 0.0001.
SAAs direct a distinct TH17 cell differentiation program independently of TGF-β
Expression of SAAs is associated with inflamed colon of IBD patients
Systemic SAAs in serum promote differentiation of pathogenic TH17 cells
Local SAA expression fuels pathogenicity of activated TH17 cells
Serum amyloid A proteins dictate the balance between homeostatic and inflammatory Th17 cells
Acknowledgements:
We thank members of the Littman lab and Drs. Susan R. Schwab and Juan J. Lafaille for valuable discussions, Audrey Baeyens for collecting efferent lymph fluid from mice, Sang Y. Kim at the Rodent Genetic Engineering Core (RGEC) of NYU Medical Center (NYULMC) for generation of SAATKO, SAA3KO and LSL-SAA1 mice, Cindy Loomis and Experimental Pathology Research Laboratory of NYULMC for H&E staining of mouse colitis colon samples, and Adriana Heguy and the Genome Technology Center (GTC) for the RNA sequencing. The Experimental Pathology Research Laboratory is supported by National Institutes of Health Shared Instrumentation grants S10OD010584-01A1 and S10OD018338-01. The GTC is partially supported by the Cancer Center Support grant P30CA016087 at the Laura and Isaac Perlmutter Cancer Center. This work was supported by an HHMI Fellowship of the Damon Runyon Cancer Research Foundation 2232-15 (J.-Y.L.), a Dale and Betty Frey Fellowship of the Damon Runyon Cancer Research Foundation 2105-12 (J.A.H), an Alberta Innovates Fellowship (H.N.), a Postdoctoral Fellowship of the National Multiple Sclerosis Society FG 2089-A-1 (L.W.), the Howard Hughes Medical Institute (D.R.L.), the Helen and Martin Kimmel Center for Biology and Medicine (D.R.L.), National Institutes of Health grant R01AI143861 (K. M. K.), and National Institutes of Health grants R01AI121436 and R01DK103358 (D.R.L.).
Footnotes
Declaration of Interests: The authors declare no competing interests.
Publisher's Disclaimer: This is a PDF file of an unedited manuscript that has been accepted for publication. As a service to our customers we are providing this early version of the manuscript. The manuscript will undergo copyediting, typesetting, and review of the resulting proof before it is published in its final form. Please note that during the production process errors may be discovered which could affect the content, and all legal disclaimers that apply to the journal pertain.
References
- Abdollahi E, Tavasolian F, Momtazi-Borojeni AA, Samadi M, and Rafatpanah H (2016). Protective role of R381Q (rs11209026) polymorphism in IL-23R gene in immune-mediated diseases: A comprehensive review. J Immunotoxicol 13, 286–300. [DOI] [PubMed] [Google Scholar]
- Ajami B, Bennett JL, Krieger C, McNagny KM, and Rossi FMV (2011). Infiltrating monocytes trigger EAE progression, but do not contribute to the resident microglia pool. Nat Neurosci 14, 1142–U1263. [DOI] [PubMed] [Google Scholar]
- Awasthi A, Riol-Blanco L, Jager A, Korn T, Pot C, Galileos G, Bettelli E, Kuchroo VK, and Oukka M (2009). Cutting edge: IL-23 receptor gfp reporter mice reveal distinct populations of IL-17-producing cells. J Immunol 182, 5904–5908. [DOI] [PMC free article] [PubMed] [Google Scholar]
- Bettelli E, Carrier YJ, Gao WD, Korn T, Strom TB, Oukka M, Weiner HL, and Kuchroo VK (2006). Reciprocal developmental pathways for the generation of pathogenic effector T(H)17 and regulatory T cells. Nature 441, 235–238. [DOI] [PubMed] [Google Scholar]
- Chai JN, Peng Y, Rengarajan S, Solomon BD, Ai TL, Shen Z, Perry JSA, Knoop KA, Tanoue T, Narushima S, et al. (2017). Helicobacter species are potent drivers of colonic T cell responses in homeostasis and inflammation. Sci Immunol 2. [DOI] [PMC free article] [PubMed] [Google Scholar]
- Chung Y, Chang SH, Martinez GJ, Yang XXO, Nurieva R, Kang HS, Ma L, Watowich SS, Jetten AM, Tian Q, et al. (2009). Critical Regulation of Early Th17 Cell Differentiation by Interleukin-1 Signaling. Immunity 30, 576–587. [DOI] [PMC free article] [PubMed] [Google Scholar]
- Das J, Ren G, Zhang L, Roberts AI, Zhao X, Bothwell AL, Van Kaer L, Shi Y, and Das G (2009). Transforming growth factor beta is dispensable for the molecular orchestration of Th17 cell differentiation. J Exp Med 206, 2407–2416. [DOI] [PMC free article] [PubMed] [Google Scholar]
- De Buck M, Gouwy M, Wang JM, Van Snick J, Opdenakker G, Struyf S, and Van Damme J (2016). Structure and Expression of Different Serum Amyloid A (SAA) Variants and their Concentration-Dependent Functions During Host Insults. Curr Med Chem 23, 1725–1755. [DOI] [PMC free article] [PubMed] [Google Scholar]
- Derebe MG, Zlatkov CM, Gattu S, Ruhn KA, Vaishnava S, Diehl GE, MacMillan JB, Williams NS, and Hooper LV (2014). Serum amyloid A is a retinol binding protein that transports retinol during bacterial infection. Elife 3, e03206. [DOI] [PMC free article] [PubMed] [Google Scholar]
- Duerr RH, Taylor KD, Brant SR, Rioux JD, Silverberg MS, Daly MJ, Steinhart AH, Abraham C, Regueiro M, Griffiths A, et al. (2006). A genome-wide association study identifies IL23R as an inflammatory bowel disease gene. Science 314, 1461–1463. [DOI] [PMC free article] [PubMed] [Google Scholar]
- Eckhardt ERM, Witta J, Zhong JA, Arsenescu R, Arsenescu V, Wang Y, Ghoshal S, de Beer MC, de Beer FC, and de Villiers WJS (2010). Intestinal Epithelial Serum Amyloid A Modulates Bacterial Growth In Vitro and Pro-Inflammatory Responses in Mouse Experimental Colitis. Bmc Gastroenterol 10. [DOI] [PMC free article] [PubMed] [Google Scholar]
- Gaffen SL, Jain R, Garg AV, and Cua DJ (2014). The IL-23-IL-17 immune axis: from mechanisms to therapeutic testing. Nat Rev Immunol 14, 585–600. [DOI] [PMC free article] [PubMed] [Google Scholar]
- Ghoreschi K, Laurence A, Yang XP, Tato CM, McGeachy MJ, Konkel JE, Ramos HL, Wei L, Davidson TS, Bouladoux N, et al. (2010). Generation of pathogenic T(H)17 cells in the absence of TGF-beta signalling. Nature 467, 967–U144. [DOI] [PMC free article] [PubMed] [Google Scholar]
- Harbour SN, Maynard CL, Zindl CL, Schoeb TR, and Weaver CT (2015). Th17 cells give rise to Th1 cells that are required for the pathogenesis of colitis. P Natl Acad Sci USA 112, 7061–7066. [DOI] [PMC free article] [PubMed] [Google Scholar]
- Hirota K, Duarte JH, Veldhoen M, Hornsby E, Li Y, Cua DJ, Ahlfors H, Wilhelm C, Tolaini M, Menzel U, et al. (2011). Fate mapping of IL-17-producing T cells in inflammatory responses. Nat Immunol 12, 255–U295. [DOI] [PMC free article] [PubMed] [Google Scholar]
- Honda K, and Littman DR (2016). The microbiota in adaptive immune homeostasis and disease. Nature 535, 75–84. [DOI] [PubMed] [Google Scholar]
- Hue S, Ahern P, Buonocore S, Kullberg MC, Cua DJ, McKenzie BS, Powrie F, and Maloy KJ (2006). Interleukin-23 drives innate and T cell-mediated intestinal inflammation. J Exp Med 203, 2473–2483. [DOI] [PMC free article] [PubMed] [Google Scholar]
- Hueber W, Sands BE, Lewitzky S, Vandemeulebroecke M, Reinisch W, Higgins PD, Wehkamp J, Feagan BG, Yao MD, Karczewski M, et al. (2012). Secukinumab, a human anti-IL-17A monoclonal antibody, for moderate to severe Crohn's disease: unexpected results of a randomised, double-blind placebo-controlled trial. Gut 61, 1693–1700. [DOI] [PMC free article] [PubMed] [Google Scholar]
- Ivanov II, Atarashi K, Manel N, Brodie EL, Shima T, Karaoz U, Wei DG, Goldfarb KC, Santee CA, Lynch SV, et al. (2009). Induction of Intestinal Th17 Cells by Segmented Filamentous Bacteria. Cell 139, 485–498. [DOI] [PMC free article] [PubMed] [Google Scholar]
- Ivanov II, Frutos RD, Manel N, Yoshinaga K, Rifkin DB, Sartor RB, Finlay BB, and Littman DR (2008). Specific Microbiota Direct the Differentiation of IL-17-Producing T-Helper Cells in the Mucosa of the Small Intestine. Cell Host Microbe 4, 337–349. [DOI] [PMC free article] [PubMed] [Google Scholar]
- Ivanov II, McKenzie BS, Zhou L, Tadokoro CE, Lepelley A, Lafaille JJ, Cua DJ, and Littman DR (2006). The orphan nuclear receptor ROR gamma t directs the differentiation program of proinflammatory IL-17(+) T helper cells. Cell 126, 1121–1133. [DOI] [PubMed] [Google Scholar]
- Komuczki J, Tuzlak S, Friebel E, Hartwig T, Spath S, Rosenstiel P, Waisman A, Opitz L , Oukka M, Schreiner B, et al. (2019). Fate-Mapping of GM-CSF Expression Identifies a Discrete Subset of Inflammation-Driving T Helper Cells Regulated by Cytokines IL-23 and IL-1beta. Immunity 50, 1289–1304 e1286. [DOI] [PubMed] [Google Scholar]
- Kullberg MC, Jankovic D, Feng CG, Hue S, Gorelick PL, McKenzie BS, Cua DJ, Powrie F, Cheever AW, Maloy KJ, et al. (2006). IL-23 plays a key role in Helicobacter hepaticus-induced T cell-dependent colitis. J Exp Med 203, 2485–2494. [DOI] [PMC free article] [PubMed] [Google Scholar]
- Langrish CL, Chen Y, Blumenschein WM, Mattson J, Basham B, Sedgwick JD, McClanahan T, Kastelein RA, and Cua DJ (2005). IL-23 drives a pathogenic T cell population that induces autoimmune inflammation. J Exp Med 201, 233–240. [DOI] [PMC free article] [PubMed] [Google Scholar]
- Lee JS, Tato CM, Joyce-Shaikh B, Gulen MF, Cayatte C, Chen Y, Blumenschein WM, Judo M, Ayanoglu G, McClanahan TK, et al. (2015). Interleukin-23-Independent IL-17 Production Regulates Intestinal Epithelial Permeability. Immunity 43, 727–738. [DOI] [PMC free article] [PubMed] [Google Scholar]
- Lee JW, Stone ML, Porrett PM, Thomas SK, Komar CA, Li JH, Delman D, Graham K, Gladney WL, Hua X, et al. (2019). Hepatocytes direct the formation of a prometastatic niche in the liver. Nature 567, 249-+. [DOI] [PMC free article] [PubMed] [Google Scholar]
- Lee Y, Awasthi A, Yosef N, Quintana FJ, Xiao S, Peters A, Wu C, Kleinewietfeld M, Kunder S, Hafler DA, et al. (2012). Induction and molecular signature of pathogenic T(H)17 cells. Nat Immunol 13, 991–999. [DOI] [PMC free article] [PubMed] [Google Scholar]
- Lloyd-Price J, Arze C, Ananthakrishnan AN, Schirmer M, Avila-Pacheco J, Poon TW, Andrews E, Ajami NJ, Bonham KS, Brislawn CJ, et al. (2019). Multi-omics of the gut microbial ecosystem in inflammatory bowel diseases. Nature 569, 655–662. [DOI] [PMC free article] [PubMed] [Google Scholar]
- Manel N, Unutmaz D, and Littman DR (2008). The differentiation of human T(H)-17 cells requires transforming growth factor-beta and induction of the nuclear receptor ROR gamma t. Nat Immunol 9, 641–649. [DOI] [PMC free article] [PubMed] [Google Scholar]
- Mangan PR, Harrington LE, O'Quinn DB, Helms WS, Bullard DC, Elson CO, Hatton RD, Wahl SM, Schoeb TR, and Weaver CT (2006). Transforming growth factor-beta induces development of the T(H)17 lineage. Nature 441, 231–234. [DOI] [PubMed] [Google Scholar]
- Martin JC, Chang C, Boschetti G, Ungaro R, Giri M, Grout JA, Gettler K, Chuang LS, Nayar S, Greenstein AJ, et al. (2019). Single-Cell Analysis of Crohn's Disease Lesions Identifies a Pathogenic Cellular Module Associated with Resistance to Anti-TNF Therapy. Cell 178, 1493–1508 e1420. [DOI] [PMC free article] [PubMed] [Google Scholar]
- Matloubian M, Lo CG, Cinamon G, Lesneski MJ, Xu Y, Brinkmann V, Allende ML, Proia RL, and Cyster JG (2004). Lymphocyte egress from thymus and peripheral lymphoid organs is dependent on S1P receptor 1. Nature 427, 355–360. [DOI] [PubMed] [Google Scholar]
- McGeachy MJ, Chen Y, Tato CM, Laurence A, Joyce-Shaikh B, Blumenschein WM, McClanahan TK, O'Shea JJ, and Cua DJ (2009). The interleukin 23 receptor is essential for the terminal differentiation of interleukin 17-producing effector T helper cells in vivo. Nat Immunol 10, 314–324. [DOI] [PMC free article] [PubMed] [Google Scholar]
- McGeachy MJ, Cua DJ, and Gaffen SL (2019). The IL-17 Family of Cytokines in Health and Disease. Immunity 50, 892–906. [DOI] [PMC free article] [PubMed] [Google Scholar]
- Meek RL, Urieli-Shoval S, and Benditt EP (1994). Expression of apolipoprotein serum amyloid A mRNA in human atherosclerotic lesions and cultured vascular cells: implications for serum amyloid A function. Proc Natl Acad Sci U S A 91, 3186–3190. [DOI] [PMC free article] [PubMed] [Google Scholar]
- Morrison PJ, Bending D, Fouser LA, Wright JF, Stockinger B, Cooke A, and Kullberg MC (2013). Th17-cell plasticity in Helicobacter hepaticus-induced intestinal inflammation. Mucosal Immunol 6, 1143–1156. [DOI] [PubMed] [Google Scholar]
- O'Hara R, Murphy EP, Whitehead AS, FitzGerald O, and Bresnihan B (2000). Acutephase serum amyloid A production by rheumatoid arthritis synovial tissue. Arthritis Res 2, 142–144. [DOI] [PMC free article] [PubMed] [Google Scholar]
- Oslejskova L, Grigorian M, Hulejova H, Vencovsky J, Pavelka K, Klingelhofer J, Gay S, Neidhart M, Brabcova H, Suchy D, et al. (2009). Metastasis-inducing S100A4 protein is associated with the disease activity of rheumatoid arthritis. Rheumatology 48, 1590–1594. [DOI] [PubMed] [Google Scholar]
- Parkhurst CN, Yang G, Ninan I, Savas JN, Yates JR 3rd, Lafaille JJ, Hempstead BL, Littman DR, and Gan WB (2013). Microglia promote learning-dependent synapse formation through brain-derived neurotrophic factor. Cell 155, 1596–1609. [DOI] [PMC free article] [PubMed] [Google Scholar]
- Patel DD, and Kuchroo VK (2015). Th17 Cell Pathway in Human Immunity: Lessons from Genetics and Therapeutic Interventions. Immunity 43, 1040–1051. [DOI] [PubMed] [Google Scholar]
- Perez OA, Yeung ST, Vera-Licona P, Romagnoli PA, Samji T, Ural BB, Maher L, Tanaka M, and Khanna KM (2017). CD169(+) macrophages orchestrate innate immune responses by regulating bacterial localization in the spleen. Sci Immunol 2. [DOI] [PMC free article] [PubMed] [Google Scholar]
- Revu S, Wu J, Henkel M, Rittenhouse N, Menk A, Delgoffe GM, Poholek AC, and McGeachy MJ (2018). IL-23 and IL-1 beta Drive Human Th17 Cell Differentiation and Metabolic Reprogramming in Absence of CD28 Costimulation. Cell Rep 22, 2642–2653. [DOI] [PMC free article] [PubMed] [Google Scholar]
- Sano T, Huang WD, Hall JA, Yang Y, Chen A, Gavzy SJ, Lee JY, Ziel JW, Miraldi ER, Domingos AI, et al. (2015). An IL-23R/IL-22 Circuit Regulates Epithelial Serum Amyloid A to Promote Local Effector Th17 Responses. Cell 163, 381–393. [DOI] [PMC free article] [PubMed] [Google Scholar]
- Shouval DS, Biswas A, Kang YH, Griffith AE, Konnikova L, Mascanfroni ID, Redhu NS, Frei SM, Field M, Doty AL, et al. (2016). Interleukin 1 beta Mediates Intestinal Inflammation in Mice and Patients With Interleukin 10 Receptor Deficiency. Gastroenterology 151, 1100–1104. [DOI] [PMC free article] [PubMed] [Google Scholar]
- Stockinger B, and Omenetti S (2017). The dichotomous nature of T helper 17 cells. Nat Rev Immunol 17, 535–544. [DOI] [PubMed] [Google Scholar]
- Tang MS, Bowcutt R, Leung JM, Wolff MJ, Gundra UM, Hudesman D, Malter LB, Poles MA, Chen LA, Pei Z, et al. (2017). Integrated Analysis of Biopsies from Inflammatory Bowel Disease Patients Identifies SAA1 as a Link Between Mucosal Microbes with TH17 and TH22 Cells. Inflamm Bowel Dis 23, 1544–1554. [DOI] [PMC free article] [PubMed] [Google Scholar]
- Targan SR, Feagan B, Vermeire S, Panaccione R, Melmed GY, Landers C, Li D, Russell C, Newmark R, Zhang N, et al. (2016). A Randomized, Double-Blind, Placebo-Controlled Phase 2 Study of Brodalumab in Patients With Moderate-to-Severe Crohn's Disease. Am J Gastroenterol 111, 1599–1607. [DOI] [PubMed] [Google Scholar]
- Uhlar CM, Burgess CJ, Sharp PM, and Whitehead AS (1994). Evolution of the Serum Amyloid-a (Saa) Protein Superfamily. Genomics 19, 228–235. [DOI] [PubMed] [Google Scholar]
- Veldhoen M, Hocking RJ, Atkins CJ, Locksley RM, and Stockinger B (2006). TGF beta in the context of an inflammatory cytokine milieu supports de novo differentiation of IL-17-producing T cells. Immunity 24, 179–189. [DOI] [PubMed] [Google Scholar]
- Wang L, and Colon W (2004). The interaction between apolipoprotein serum amyloid A and high-density lipoprotein. Biochem Biophys Res Commun 317, 157–161. [DOI] [PubMed] [Google Scholar]
- Wang L, Lashuel HA, Walz T, and Colon W (2002). Murine apolipoprotein serum amyloid A in solution forms a hexamer containing a central channel. Proc Natl Acad Sci U S A 99, 15947–15952. [DOI] [PMC free article] [PubMed] [Google Scholar]
- West NR, Hegazy AN, Owens BMJ, Bullers SJ, Linggi B, Buonocore S, Coccia M, Gortz D, This S, Stockenhuber K, et al. (2017). Oncostatin M drives intestinal inflammation and predicts response to tumor necrosis factor-neutralizing therapy in patients with inflammatory bowel disease. Nat Med 23, 579–589. [DOI] [PMC free article] [PubMed] [Google Scholar]
- Xu M, Pokrovskii M, Ding Y, Yi R, Au C, Harrison OJ, Galan C, Elkaid YB, Onneau RB, and Littman DR (2018). c-MAF-dependent regulatory T cells mediate immunological tolerance to a gut pathobiont. Nature 554, 373-+. [DOI] [PMC free article] [PubMed] [Google Scholar]
- Yarur AJ, Quintero MA, Jain A, Czul F, Barkin JS, and Abreu MT (2017). Serum Amyloid A as a Surrogate Marker for Mucosal and Histologic Inflammation in Patients with Crohn's Disease. Inflamm Bowel Dis 23, 158–164. [DOI] [PubMed] [Google Scholar]
- Ye RD, and Sun L (2015). Emerging functions of serum amyloid A in inflammation. J Leukocyte Biol 98, 923–929. [DOI] [PMC free article] [PubMed] [Google Scholar]
- Yeung ST, Myczek K, Kang AP, Chabrier MA, Baglietto-Vargas D, and Laferla FM (2014). Impact of hippocampal neuronal ablation on neurogenesis and cognition in the aged brain. Neuroscience 259, 214–222. [DOI] [PMC free article] [PubMed] [Google Scholar]
- Zhang S, Takaku M, Zou L, Gu AD, Chou WC, Zhang G, Wu B, Kong Q, Thomas SY, Serody JS, et al. (2017). Reversing SKI-SMAD4-mediated suppression is essential for TH17 cell differentiation. Nature 551, 105–109. [DOI] [PMC free article] [PubMed] [Google Scholar]
- Zhou LA, Ivanov II, Spolski R, Min R, Shenderov K, Egawa T, Levy DE, Leonard WJ, and Littman DR (2007). IL-6 programs TH-17 cell differentiation by promoting sequential engagement of the IL-21 and IL-23 pathways. Nat Immunol 8, 967–974. [DOI] [PubMed] [Google Scholar]
Associated Data
This section collects any data citations, data availability statements, or supplementary materials included in this article.
Supplementary Materials
Figure S1. Mouse TH17/Tc17 cell differentiation by SAAs, Related to Figure 1 (A) IL-17A dose response curve to rmSAA1.
(B) Representative IL-17A versus IFNγ expression (left) and summary (right) in WT and TGFβRII DNtg CD4+ T cells following SAA1-induced differentiation.
(C) Dosage-dependent inhibition of rSAA1-induced Th17 cell differentiation by SAA1-neutralizing antibody.
(D, E) Representative IL-17A versus IFNγ expression (D) and RORγt expression (E) in CD8+ T cells cultured under SAA1 or TGF-β differentiation conditions. gMFI of RORγt is in parentheses.
(F) Immunoblotting for p38 MAPK phosphorylation (p-p38) at T180/Y182 of primed CD4+ T cells upon rmSAA1 (10μg/ml) or vehicle (Veh.) treatment for indicated times. Total p38 is shown as a loading control. A summary of 2 experiments with at least 2 biological replicates per experiment.
(A-E) Experiments were conducted based using the same scheme as in Figure 1A.
(A-C) All statistics were calculated using the unpaired two-sided Welch’s t-test. Error bars denote the mean ± s.d. ns = not significant, *p < 0.05, **p < 0.01, ***p < 0.001, ****p < 0.0001.
Figure S2. Transcriptional responses and validation of differentially expressed genes in TH17 cells differentiated with IL6 plus SAA1 or TGF-β, Related toFigure 2
(A) Experimental scheme. Cells were harvested and RNA extracted at 3, 12 and 48 h after polarization.
(B) Clustered heatmap of differentially expressed genes at 48 h timepoint. Color scale is based on normalized read counts. Genes listed on the righthand margin are color coded. Green = non-pathogenic TH17 signature. Maroon = pathogenic TH17 signature. Black = Autoimmune disease associated.
(C-E) Normalized counts of autoimmune disease-associated (Il23r, Il1r1, S100a4) (C), pathogenic (Csf2, Tbx21, Gzmb) (D), or non-pathogenic (Maf, Ahr, Il10) (E) genes at the indicated time points. (F-H) GM-CSF (F and G) and T-bet (H) expression at 48 h. gMFI of T-bet is in parentheses.
(I and J) Representative expression of IFNγ versus IL-17A (I) and T-bet (J) in TH1 cells induced in vitro with IL-2 and IL-12, with and without SAA1, for 48 hrs.
(C-E) Statistics were calculated using the two-stage step-up method of Benjamini, Krieger and Yekutieliun. Error bars denote the mean ± s.d.
(F) Statistics were calculated using the unpaired two-sided Welch’s t-test. Error bars denote the mean ± s.d. ns = not significant, *p < 0.05, ***p < 0.001, and ****p < 0.0001.
Figure S3. Role of SAA in human TH17 cell differentiation and protein expression in inflamed colon tissue from UC patients, Related to Figure 3
(A) Representative FACS plots of IL-17A versus IFNγ expression by in vitro polarized human TH17 cells upon restimulation.
(B and C) Representative FACS plots (B) and summaries (C) indicating cell surface expression of CCR6 on in vitro polarized human TH17 cells upon human recombinant SAA treatment. Connecting lines signify the same donor. Summary of 3 experiments with n = 8 donors.
Statistics were calculated using the paired two-tailed Student’s t-test. *p < 0.05,
(D) Confocal images show prominent SAA expression in biopsies of inflamed tissues from UC patients. Scale bar corresponds to 100μm. SAA1/2 (green), EPCAM (red) and nucleus (Draq7; blue).
Figure S4. Role of SAAs in IL-10R blockade-induced colitis in response to Helicobacter hepaticus, Related to Figure 4
(A) Gating strategy to identify all TH populations amongst HH7-2tg donor-derived cells in the colon lamina propria of representative homeostatic (isotype control IgG-injected) or colitis-developing (anti-IL10R- injected) recipients at 2 weeks post transfer.
(B and C) Characterization of HH7-2tg donor cells in colon lamina propria of recipient mice injected with isotype control Ab. SAATKO (blue boxes, n = 4) and WT (red boxes, n = 4) littermates. Frequencies (B) and numbers (C) of indicated TH cells based on transcription factor staining.
(D and E) Normalized expression of Saa1 (D) and Saa3 (E) in the indicated sort-purified populations from colons of mice treated as in Figure 4A. Tissues were harvested 3-5 days after transfer of HH7-2tg cells.
(F) Normalized expression of Saa1 and Saa2 in ileum of recipient mice.
(G) Percentage of Foxp3+ iTreg cells in isotype-treated recipients (open boxes) versus αIL10RA-treated recipients (solid boxes).
(A-G) Experiments were conducted based on the same scheme as in Figure 4A. Statistics were calculated using the two-stage step-up method of Benjamini, Krieger and Yekutieliun. Error bars denote the mean ± s.d. ns = not significant. *p<0.05, ***p < 0.001.
Figure S5. Distinct sources of SAA production in EAE, Related to Figure 5
(A) Normalized expression of Saa isotypes in the liver at day 15 post MOG-immunization.
(B) SAA1/2 concentrations in lymph fluid collected from thoracic duct, at day 10 post immunization (pre-clinical stage) of EAE.
(C) Expression of SAA1/2 in the spinal cord and liver of WT (n=2) and SAATKO (n=2) at day 15 of EAE. β-tubulin is shown as a loading control. Center lanes marked (M) are molecular weight markers, 14kD for the top and 64kD for the bottom.
(D) Normalized expression of Saa isotypes in the spinal cord at day 15 post MOG-immunization.
(E and F) Expression of SAAs in myeloid cells of the CNS. In order to distinguish microglia (DsRed+) from infiltrating monocyte-derived macrophages, Cx3cr1creER:R26-DsRed mice were injected with tamoxifen at day 28 and day 30, then rested for 30 days before MOG-immunization. RNAseq was performed on sort-purified microglia and infiltrating monocytes. Normalized RNAseq counts of Saa isotypes in microglia (E) and monocyte (F) isolated from CNS of WT mice at the indicated stages of EAE. Data for each condition are the mean of 2 biological replicates.
(G) Representative confocal image of spinal cord cross sections illustrating the specificity of the α-SAA3 Ab used. IBA1 (red), SAA3 (green), and CD4 (aqua).
(H) Quantification of SAA3 and IBA1 colocalization in the CNS at peak of disease activity in mice with MOG-induced EAE. Inflamed regions were determined by the localization of CNS-infiltrating CD4+ T cells (aqua). The frequencies of SAA3/IBA1 colocalization were quantified from 4 separate regions of CNS images by IMARIS.
(A, B, and D) Statistics were calculated using the unpaired two-sided Welch’s t-test. Error bars denote the mean ± s.d. **p < 0.01, and ***p < 0.001.
Figure S6. Role of SAAs in the TH17-dependent 2D2 transfer EAE model, Related to Figure 6
(A-C) Total number (A), percentage that are RORγt+ TH17 (B) and quantification of IL-17A+ (C) transferred 2D2tg donor cells in the CNS of WT (red boxes, n = 8) or SAA3KO (purple boxes, n = 9) recipients on day 17 post-adoptive transfer. Summary of 3 experiments.
(D) In vitro Th17 cell differentiation in response to SAA1 versus SAA3. The experiment was conducted based on the scheme in Figure 1A. Expression of IL-17A versus IFN-γ in in vitro polarized CD4+ T cell with IL-6 and TGFβ neutralizing antibodies ± rmSAA1 (10μg/ml) or ± rmSAA3 (10μg/ml) following restimulation.
(E-G) Comparison of cytokine production following different Th17 cell differentiation conditions. Experiments were conducted based on the scheme in Figure 1A. (E) Expression of IL-17A versus GM-CSF in in vitro polarized CD4+ T cell with TH17-TGFβ (Top: IL6 + TGFβ) or TH17-IL23 (Bottom: IL-6 + IL-1β + IL-23) conditions ± rmSAA1 (10μg/ml) or ± rmSAA3 (10μg/ml) following restimulation. (F and G) Summary of IL-17A frequency. Summary of 4 experiments, with 8 biological replicates.
(H) Schematic of conditional Saa1 targeting construct and generation of liverSaa1mouse.
(I) Serum concentrations of SAA1/2 in liver-Saa1-overexpressing mice (liverSaa1) (red circles, n = 42) or Alb-CreTg (white circles, n = 32) in 6-week-old mice.
(J) Serum concentrations of IL-6 in liverSaa1 (red circles, n = 21) or control Alb-CreTg (white circles, n =15) 6-week-old mice. Serum IL-6 from peak EAE mice (black dots, n=4) were measured as a positive control.
(K and L) Percent of RORγt+ TH17 (K) and Tbet+ TH1 (L) cells amongst Foxp3Neg CD44hi CD4+ T cells in secondary lymph nodes of liverSaa1 (red circles, n = 10) or control Alb-CreTg (white circles, n = 10) 6-week-old mice, summarized over two experiments.
(M and N) Examination of EAE development in liverSAA1 and control Alb-Cretg littermates by attenuated MOG-immunization with low-dose heat-killed Mycobacterium tuberculosis (H37Ra) antigen emulsified in IFA (0.2mg/ml). Summary of 2 experiments, with liverSAA1 (red circles, n = 8) and Alb-Cretg (white circles, n = 9) mice. Incidence of EAE onset (M) and maximum disease score (N).
(A-G and I-N) Statistics were calculated using the unpaired two-sided Welch’s t-test.
(M) Statistics were calculated by log-rank test using the Mantal-Cox method.
Error bars denote the mean ± s.d. ns = not significant, *p < 0.05, **p < 0.01, ***p < 0.001, ****p < 0.0001.
Data Availability Statement
The RNA-sequencing datasets generated during this study are available at Gene Expression Omnibus (GEO: GSE132761, GSE133180).