

Abstract
Starch is a major source of our daily diet and it is important to understand the molecular structure that plays a significant role in its wide number of applications. In this review article, microscopic structures of starch granules from potato, corn, rice canna, tania, wheat, sweet potato, and cassava are revealed using advanced microscopic techniques. Optical microscopy depicts the size and shape, polarization microscopy shows the anisotropy properties of starch granules, scanning electron microscopy (SEM) displays surface topography, and confocal microscopy is used to observe the three-dimensional internal structure of starch granules. The crystallinity of starch granules is revealed by second harmonic generation (SHG) microscopy and atomic force microscopy (AFM) provides mechanical properties including strength, texture, and elasticity. These properties play an important role in understanding the stability of starch granules under various processing conditions like heating, enzyme degradation, and hydration and determining its applications in various industries such as food packaging and textile industries.
Keywords: Starch, Optical microscopy, Polarization microscopy, Confocal microscopy, Atomic force microscopy, SHG microscopy
Introduction
Starch is an important polymeric carbohydrate, found in rice, potato, maize, wheat, etc. It is stored as granules in the amyloplast and constitutes a major part of our diet (Buleon et al. 1998; Roy et al. 2013; Ong and Blanshard, 1995; Sunderram and Murthy, 2014; Oostergetel and Van Bruggen, 1993). The morphology of the granule depends on its biological origin; for example, rice starch granules are polygonal in shape and their diameter on average is usually < 5 μm, and potato starch granules are elliptical in shape and are > 75 μm in diameter as shown in Table 1 (Sunderram and Murthy, 2014; Pérez and Bertoft, 2010; Perez-Rea et al. 2013). The granules may present individually (simple) or as cluster (compound) composition. These granules contain growth rings comprising of amorphous and crystalline domains which are formed by a complex network of amylose and amylopectin, organized in the form of alternating concentric shell-like structures of 120–400 nm thickness (Fig. 1). Amylose is a linear chain of glucose units linked by α-1,4 glycosidic bonds whereas amylopectin is the highly branched chain-like structure present at the α-1,6 position along the linear chain of glucose units (Buleon et al. 1998). Physiologically, starch is broken down by enzymes into monomeric glucose units and utilized as an energy source. The desired quality of starch-based foods can be obtained only through a thorough understanding of starch-water, starch-amylase interaction and by optimizing the processing procedures (Roy et al. 2013; Gallant et al. 1992; Fannon et al. 2004).
Table 1.
Characteristics of starch granules from different botanical sources
| Starch | Type | Shape | Distribution | Size (μm) |
|---|---|---|---|---|
| Maize (waxy and normal) | Cereal | Spherical/polyhedral | Unimodal | 2–30 |
| Potato | Tuber | Lenticular | Unimodal | 5–100 |
| Rice | Cereal | Polyhedral | Unimodal | 3–8 (single) |
| Wheat | Cereal | Lenticular (A-type) | Bimodal | 15–35 |
| Spherical (B-type) | 2–10 | |||
| Pea | Legume | Rentiform (single) | Unimodal | 5–10 |
Fig. 1.

Overview of starch granule structure. Lowest level of starch granule organization (upper left) shows alternating crystalline and semi-crystalline shells. At a higher level of structure, the blocklet structure is shown. At the next highest level of structure, one blocklet is shown containing several amorphous crystalline lamellae. In the next diagram, the starch amylopectin polymer in the lamellae is shown. At the highest level of order, the crystal structures of the starch polymers are shown. Figure reproduced from Gallant et al. (1997) with kind permission from Elsevier
Starches are divided into resistant, slowly degradable and digestive starches. When the starch is undigested in the small intestine, it is called resistant starch. This starch is indigestible by the enzymes of the human body; however, in the large intestine, it is fermented by the gut microbiota into metabolites such as short chain fatty acids, gases, organic acids, and alcohols (Gallant et al. 1997). Generally, starches with high amylose content have increased resistant starch content and are not fully broken down because of its straight chains which limit the amount of surface area exposed for digestion. Uncooked food contains high amount of resistant starch. However, this amount decreases when starch is cooked. Again, processed food is easily digested to release more glucose that can be absorbed by human body. Consumption of easily digestible starches increases the blood glucose levels which can lead to metabolic disorders including obesity, diabetes, and also to cell, tissue, and organ damage (Roy et al. 2013; Gallant et al. 1997).
There are various biochemical tests, microscopy, and analytical techniques which reveal the molecular and structural changes in hydrated starch granules upon interacting with amylase (Pérez and Bertoft, 2010). The amylases from microorganisms are an important source of industrial enzymes as compared to other sources. This is due to the plasticity and vast availability of microorganisms. Microbes are obtained from cost-effective sources, require less space, are easy to handle, and grow rapidly, which in turn speeds up the production of the enzymes (Yamada et al. 1995; Sarko and Wu, 1978). Bacterial degradation of starch is one of the most important processes in the food and fermentation industries for ethanol production and textile industries (Gallant et al. 1997; Yamada et al. 1995; Sarko and Wu, 1978). Recently, genetically modified organisms are used for industrial production of enzymes. Amylases are classified into α-amylase (endo-acting), β-amylase (exo-acting), and γ-amylase (debranching enzymes) (Gallant et al. 1997; Alacazar-Alay et al. 2015). In its most general role, amylase hydrolyzes starch into sugars. Endo-amylases catalyze the hydrolysis in a random manner in the starch molecule producing various lengths of linear and branched oligosaccharide chains. Exo-amylases act on the non-reducing end thereby producing short end products (Gallant et al. 1997; Liu et al. 2015). Among these enzymes, alpha-amylase is ubiquitously distributed (found in plants, microorganisms, etc.). It is the major form of amylase present in humans and is in increasing demand due to its important role in starch hydrolysis and is faster acting when compared to β-amylase as it can randomly cleave amylase and amylopectin (Alcázar-Alay and Meireles, 2015). In this review, we are reviewing the effect of α-amylase on various types of starch granules. There are several biochemical tests, spectroscopic methods, to investigate the effect of α-amylase on the starch granules (Qin et al., 2011; Souza, 2010; Ji et al. 2004). However, microscopic studies of starch granules using advanced microscopic techniques provide more insightful information.
In this review, we describe starches from potato, corn, rice canna, tania, wheat, sweet potato, and cassava. Common purification strategies were used for particular sources of starch. As the purification strategy can influence the subsequently observed properties here, we describe the canonical protocols used throughout the reviewed material for isolation of starch from the three most common starting source materials rice, potato, and corn. Starch isolated from rice was gotten using the method of Qin et al. (2011). Characterization of the starch granules using compound microscope, polarization microscope, scanning electron microscope (SEM), confocal microscope, atomic force microscope (AFM), and second harmonic generation (SHG) microscope. The microscopic structures play a key role in starch digestion. The abovementioned microscopy techniques provide various information complimentary to each other.
Sample preparation
In this review, starches from potato, corn, rice, yam, edible canna, tania, wheat, sweet potato, cassava, etc. are used. We are describing the starch isolation from rice, potato, and corn for reference. Starch was isolated according to the method of Qin et al. (2011). Commercially available milled rice was purchased from a local store and used in the experiment. Ten grams of rice flour was added in 20 mL 0.1% NaOH and incubated for 18 h at 4 °C. The slurry was homogenized at high speed for 2 min and centrifuged at 176g for 10 min. Then, the bottom layer of starch was washed with 0.1% NaOH followed by water and neutralized with 1.0 N HCl to pH 6.5 and centrifuged. The starch was then washed with distilled water and lyophilized (Qin et al. 2011). The potato starch granules were extracted from commercially available potatoes by suspending freshly cut pieces in Milli-Q water at room temperature for 24 h. The potato pieces were discarded once the starch grains settle to the bottom of the beaker. The liquid was centrifuged 3–4 times at 806g for 15 min at 4 °C. The starch was then washed with distilled water and lyophilized (Chen et al., 2011a).
Whole corn kernels were collected, cleaned, and soaked in 5 mL of 1% sodium metabisulfite solution (0.67% SO2) at 45 °C for 1–3 days. The pericarp and germ were manually removed using forceps. The separated endosperm was put in a 50 mL centrifuge tube containing 10 mL of distilled water and homogenized using a vortex type tissue homogenizer (Ultra-Turrax T25, 600 W, Tekmar, Cincinnati, OH) at 560g for 30 s. The slurry obtained was filtered using a 30 μm nylon filter under vacuum with several washes, to obtain a total wash water volume of 500 mL. The coarse and fine fibres and parts of the protein were filtered out during this step. The protein-starch mixture present in the filtrate was further separated by either centrifugation or sedimentation. Each sample was separated three times, with 250 mL of distilled water being used for each separation. All treatments were performed 5 times, and the results were averaged (Murphy 2002). These starch samples were lyophilized and stored for microscopic analysis.
Optical microscopy of starch granules
The optical microscope uses visible light and lenses to magnify the image of small specimens which, in the modern era, can be recorded digitally. An optical microscope can be used to determine the size and shape of a specimen precisely and for live cell imaging with minimum photodamage (Murphy 2002; Shaw 2006). The effect of α-amylase on starch granules was observed under optical microscope through the disruption of morphology of the starch. Samples were prepared by dissolution in a solution [0.1 M acetate buffer (100 mL, pH 5.6), 300 L-Novozymes (Denmark)] which contains Aspergillus oryzae α-amylase that was added to 25 g of starch (Canna, Cassava, Tania) and stirred at 32 g for 8 h at 60 °C, and the remaining starch was washed after hydrolysis and dried at 40.8 °C for microscopic observations. A drop of the starch-water mixture was placed on a coverslip and after this mixture adhered to it, it was covered with another cover slip. The prepared samples were mounted upside down on the stage of the optical microscope for observation. Native Manihot esculenta starch granules had smooth surfaces but after the enzymatic action, irregular surfaces were observed. Figure 2 shows very little changes in the starch granules of Xanthosoma sagittifolium before and after hydrolysis but some granules displayed molten appearance. Thus, starch morphology and enzymatic effects were investigated and analysed in transmitted optical microscopy (Perez-Rea et al., 2013). However, optical microscope limits its imaging contrast. The contrast can be improved using polarization microscopy.
Fig. 2.

Optical microscopy of native and hydrolyzed starch granules. The (a), (b), (c), and (a1), (b1), (c1) micrographs show untreated and treated starch granules with enzyme respectively. (a) Canna indica (edible canna). (b) Manihot esculenta (cassava). (c) Xanthosoma sagittifolium (tania). Scale bar in images (a), (a1) is 50 μm; (b), (b1), (c), (c1) is 20 μm. Figure reproduced from Perez-Rea et al. (2013) with kind permission from Wiley
In another study, twelve starch granules were used from sweet potato, rhizome of lotus and yam, tuber of potato, corm of water chestnut, and seeds of pea, bean, barley, wheat, lotus, water caltrop, and ginkgo (Cai and Wei, 2013). Hilum is the core of the granules from where the growth rings arise. Based on the type of hilum, there are 2 types of starch granules: central hilum and eccentric hilum. When starch granules were heated in the presence of water, the amorphous regions absorbed water resulting in gelatinization. This process can be viewed in situ using a polarization microscope and a hot stage. This process is economically important and exploited in food industries (Fonseca-Florido et al., 2017). The morphology of the starch granules was studied using a normal optical microscope. As shown in Fig. 3, potato starch granules were either large ovals or small spheres with an eccentric hilum. Lotus rhizome starch showed heterogeneous shapes with an eccentric hilum. Yam starches were slightly oval with an eccentric hilum. Pea and bean starches were observed to be oval containing a central hilum. Wheat and barley starches had bimodal size distribution, i.e. large granules were disc shaped and smaller ones spherical, both with central hilum. Lotus seed, water caltrop, and water chestnut were mostly oval with a central hilum. Sweet potato starches were mostly spherical with a central hilum and their sizes varied significantly. The effect of gelatinization can be studied using a polarization microscope (Cai and Wei, 2013).
Fig. 3.

Morphology of starch granules under normal light microscope. a Potato. b Lotus rhizome. c Yam. d Pea. e Bean. f Barley. g Wheat. h Lotus seeds. i Water chestnut. j Water caltrop. k Ginkgo. l Sweet potato. Scale bar = 20 μm. Figure reproduced from Cai and Wei (2013) with kind permission from Elsevier
To summarize, optical microscopy is the basic imaging technique for morphological analysis of starch granules. It is simple and cost effective compared to other advanced microscopy techniques such as scanning electron microscope (SEM) and confocal microscope. However, it does not give information about finer structures. The image contrast can be increased using polarization microscope, iodine staining (Jacobson et al. 1997). It is generally used to determine the birefringence property of the starch granules, growth rings, and hilum and also to analyse the structural changes before and after hydrolysis.
Polarization microscopy of starch granules
Polarization microscopy is one of the simple techniques to investigate the local anisotropy of the optical properties of the specimen such as refraction and absorption (Carlton 2011). Any specimen whose refractive index depends on polarization propagation direction of light is said to be birefringent that shows a characteristic variation of intensity of light. An optical microscope can be modified into a polarization microscope by addition of a polarizer before the sample and an analyzer before the detector which results in a double refractive index. Polarization light microscopy is a contrast-enhancing technique for optical anisotropic materials such as starch, cellulose, and live cell imaging. Optical anisotropy is a consequence of molecular order in crystals which provides a sensitive tool to analyse the molecular orientation or fine structural form in a specimen (Shalin et al. 2013). By its very nature, polarizing microscope provides structural information at a sub-microscopic level. In native starch granules, the principle component of the amorphous region is made up of amylose and the branching points of amylopectin, and the linear branches of amylopectin and some amylose association in crystalline double helixes that arrange in parallel fashion, forming the crystalline structure. Due to the orderly arrangement of the crystalline areas, these starch granules show birefringence, with an interference pattern seen as Maltese cross under polarized light.
Cai et al. (2013) investigated the morphology of starch granules and identified the disruption of this pattern upon gelatinization. Starches from different sources were taken and imaged using a polarization microscope. Photomicrographs of starch granules taken under polarized light are shown in Fig. 4. It was observed that hilum positions of potato oval and spherical starches were at one end of the granules (Fig. 4a). The hilum positions of lotus rhizome and yam starch were at one end of the granules (Fig. 4b, c) and that of pea, bean, barley, wheat, lotus seed, water chestnut, and ginkgo starches were centre of the granules (Fig. 4d–k). Most sweet potato granules had central hila and some of them had hila at one end of the granule (Fig. 4i) (Cai and Wei, 2013).
Fig. 4.

Morphology of starch granule under polarization microscope. a Potato. b Lotus rhizome. c Yam. d Pea. e Bean. f Barley. g Wheat. h Lotus seed. i Water chestnut. j Water caltrop. k Ginkgo. l Sweet potato. Scale bar = 20 μm. Figure reproduced from Cai and Wei (2013), with kind permission from Elsevier
Perez-Rea et al. (2013) investigated the effect of α-amylase on starch granules (canna, cassava, tania) with regard to molecular crystallinity using a polarization microscope. It was observed that on hydrolyzing the starch granules for 8 h at 60 °C by the commercial enzyme Fungamyl 800 L which contained Aspergillus oryzae α-amylase, the native starch granules showed birefringence with the typical “Maltese cross”. The destruction of starch granules was observed after hydrolysis and this process occurred with concomitant loss of the birefringence signal from semi-crystalline areas. A gradual decrease of birefringence of starch may be observed in concentration-dependent α-amylase (Fig. 5). Since the spatial resolution of the polarization microscope was a few microns, the molecular resolution was achieved using an electron microscope.
Fig. 5.

Polarization microscopy of native and hydrolyzed starch granules by commercial enzyme, Fungamyl 800 L. The (a), (b) and (a1), (b1) micrographs show untreated and treated starch granules with enzyme respectively. (a) Canna indica (edible canna) and (b) Manihot esculenta (cassava) showing hilum location in the starch granules. Figure reproduced from Perez-Rea et al. (2013) with kind permission from Wiley
Tapia et al. (2012) investigated the properties of starch and starch-edible films form under-utilized roots and tubers from Venezuelan Amazons. The determination of granular shape and Maltese crosses of starch were done using polarization microscope (here, optical microscope was fitted with polarized light filters). It was observed that the polarized light micrographs of starch isolated from Ipomoea batatas, Arracacia xanthorrhiza, Colocasia esculenta, X. sagittifolium, and Dioscorea trifida (grown in Venezuelan Amazons) showed granular shape and typical Maltese crosses. Variable granule size and shape were observed, such as shells, rounded, egg-truncated, and bells.
A study by Wang et al. (2018) investigated the physiochemical properties of C-type of starch from root tuber of Apios fortunei and compared it with the maize, potato, and pea starches. Polarized light microscope was used to observe the morphology of starch granules. The results showed that A. fortunei starch exhibited a spherical, polygonal, and elliptical shape with central hila. The starch granules of maize had polygonal shape with central hila; potato starch had small spherical granules with central hila and large ellipsoidal granules with eccentric hila; and pea starch had elliptical granules with central hila. It was also observed that A. fortunei showed unimodal size distribution and its granule size was smaller than the maize and potato starch granule sizes. Maize, potato, and pea starch had bimodal size distribution and their sizes varied in small and large granules.
In summary, polarization microscopy is a technique used to visualize specimens exhibiting birefringence. Native starch shows birefringence in the form of maltese cross structures and observed with high contrast under a polarization microscope. Starch gelatinization is a process of breaking down the intermolecular bonds of starch molecules in the presence of water and heat, allowing the hydrogen bonding sites to be occupied hence causing starch to lose its order and hence also its birefringence property. This can be clearly investigated using a polarization microscope. Hence, it is an efficient technique to detect changes in the structure of the birefringent samples after any treatment.
Confocal scanning laser microscopy of starch granules
Confocal scanning laser microscopy (CSLM) is a type of optical microscopy which allows the acquisition of images from the primary focal plane by eliminating out of focus light using an aperture diaphragm (pinhole). During the imaging of the specimen, the primary focal plane of the objective lens is converted into a “conjugate” focal plane close to the detection system. Opening the aperture diaphragm allows more planes to contribute to the image formed. Starch imaging using CSLM allows for examination of the different cross-sections of starch without the use of any sectioning techniques. It provides high-resolution images of different sections of starch which can be stacked together to obtain a three dimension (3D) image of the starch granule. CSLM is used to visualise starch granules from various botanical sources (Velde, Riel and Tromp, 2002).
In a study, starch granules were tagged with APTS (8-amino-1,3,6-pyrenetrisulfonic acid) and analysed using CSLM (Glaring et al. 2000). SEM images were also used to find the detailed information on the external structure of the granules. APTS specifically reacts with the reducing ends of sugar molecules in starch granule and since amylose is smaller in size, it has a higher molar ratio of reducing ends resulting in higher by-weight labelling of amylose. Images of APTS-tagged starch showed specific internal structures such as growth rings, channels, and distribution of amylose and amylopectin within the molecule. In pea, the hilum appears to be diffused and elongated and the growth rings are formed around it. This could explain its irregular shape (Fig. 6 c, d). In maize, growth rings were observed to be cut off at the surface. This could be due to the formation of the granules; the growth was enhanced or stopped in certain regions (Fig. 6k). A possible explanation for this irregularity in growth pattern is the interaction of the surface with external environment. High amylose maize starch showed smooth and round granules. Potato (Fig. 6a, b), wheat (Fig. 6e, f), and barley (Fig. 6 g, h) starch granules were found to have regular round structures. In the rice starch granules, the growth rings were not visible. This could be due to their smaller size and more uniform distribution of amylose (Fig. 6i, j). A unique feature of rice starch was the observation of triangular regions with intense APTS staining. It had one corner anchored to the hilum and the other to the opposite flat face located at the granule edge. Altered distribution of the amylose chain in relation to the proposed growth ring structure gave an idea about the starch granule deposition. Integrity of the starch granule was found to be closely related to the amylose content (Glaring et al. 2000).
Fig. 6.

CLSM optical images of the following: a normal potato starch granule; b high-amylose potato starch granule; c, d pea starch granule; e, f wheat starch granule; g, h barley starch granule; i rice starch granule; j maize starch granule; k high-amylose rice starch granule; l high-amylose maize starch granule. Figure reproduced from Glaring et al. (2006), Biomacromolecules, with kind permission from ACS publications
In another study, CLSM cross-sections of different corn starches, with and without APTS, were studied and it was observed that the intensity of APTS fluorescence was greater in amylose-rich starch. Internal cavities and channels of starch were also seen by CLSM after labelling with APTS. These channel structures vary in different starch granules depending on the amylose content. The higher the content of amylose present in starch, the higher is the number of channels present within the granule. In maize starch with low amylose concentration (Fig. 7 a, b), these channels can be visualized as dark lines running from the outer surface towards the hilum. Whereas in high-amylose starch granules (Fig. 7c, d), it is seen as concentric rings. CLSM imaging showed that the growth rings were not visible without any treatment. Acid treatment is an ideal method to image this structure. On treatment with dilute hydrochloric acid, the growth rings become discernible because of the difference in susceptibility of each layer to hydrolysis (Chen et al., 2011b).
Fig. 7.

Internal structure of a waxy maize (low amylose); b normal maize (low amylose); c G50 maize starch granule (high amylose); and d G80 maize starch granule observed under CLSM optical imaging. Figure reproduced from Chen et al. (2011a) with kind permission from Elsevier
The amylose content of banana starch granules was determined using APTS staining followed by CLSM imaging by Peroni-Okita et al. (2013) (Fig. 8). In the images obtained (Fig. 8a), growth rings were clearly visible around the hilum. In a previous study, it was found that amylose is present between amylopectin molecules within the starch granule and near the surface of the granule. The results of this study revealed that amylose was concentrated between the growth rings in the amorphous region of the granule. The confocal images also showed that the format of the starch in ripe, cold-stored banana is different from that of the control group (Peroni-Okita et al. 2013).
Fig. 8.

CLSM optical sections of a starch granules isolated from banana showing concentric growth rings around the hilum. Figure reproduced from Peroni-Okita et al. (2013), with kind permission from Elsevier Ltd. b Transgenically modified potato starch showing growth rings, rough surface, and deep fissures. Figure reproduced from Blennow et al. (2003), with kind permission from Elsevier
The starch molecules of transgenic, hydrated, and native APTS-labelled starch granules were also visualized using confocal microscopy (Fig. 8b) (Blennow et al. 2003). Combined analysis of molecular, structural, and bioimaging of transgenic starch granules has helped us understand several processes behind starch granule morphogenesis. Normal and low-level amylose starch granules show an intense, 1 μm (approx.), fluorescence dot at the hilum indicating a high amylose concentration at the centre of the granule. The presence of several surface protrusions indicates the irregular packaging of the molecules in these regions. With the help of CLSM and SEM imaging techniques, some rough areas were observed whose position was localized to the opposite side of the hilum. Starch with suppressed starch-branching enzyme (SBE; transgenically modified variety) was found to have a high concentration of phosphate, amylose, and long amylopectin side chains. On observation using CLSM microscopy, they were observed to have rough outer surfaces with deep internal cracks. Even though the native starch obtained from Curcuma zedoaria has a high phosphate and amylose concentration, it does not show any fissures and has a smooth surface. In another transgenically modified plant, presence of antisense of the GWD enzyme within the starch granules resulted in reduced phosphate concentration. However, there was an increase in the number of fissures and low molecular weight amylopectin. These fissures did not appear to be very severe when compared to those of SBE starch granules but sometimes they appeared to protrude at the surface of the granule (Blennow et al. 2003). It is known that in the presence of ligands like iodine and linear alcohol, the amylose present within the starch granules tend to adopt a compact helical conformation and form a complex with the ligand, which gives rise to “V-amylose”. In a study, the formation of this inclusion complex between amylose of starch from different sources and lipophilic molecules labelled with fluorescein was studied. CLSM images were obtained below the gelatinization temperature to study this interaction. By analyzing the images of waxy and not-waxy starch granules, it was observed that the amylose present at the periphery of these granules interacts with aliphatic chains of the lipophilic molecules specifically and forms inclusion complexes. It was also confirmed that long-chain amylopectin could also form complexes with the ligand (Manca et al., 2015).
To summarize, CLSM is a powerful tool for imaging starch granules. It is not limited to native starch granules and can also be used to image gelatinization of starch paste, observe cross-sections of granules, and even obtain images of optically dense specimen. It allows us to observe starch in its natural environment. This lets us study the structure of starch granules from their sources, through the processing steps, to the final (food) product.
Scanning electron microscopy of starch granules
The scanning electron microscope (SEM) scans the sample with a focused beam of electrons to produce a reflected image of higher magnification than is capable through use of an optical microscope (Egerton, 2005). The sample is prepared by first coating it with a very thin layer of a suitable metal coating such as silver or gold (Sujka and Jamroz, 2009). Detection of the secondary electrons produced by the metal adlayer coating on the specimen is used to generate a reflected image containing surface topology and composition (Egerton, 2005). Spatial resolution of optical microscope is limited due to the visible light diffraction; this problem is resolved by decreasing the wavelength of incident light. In SEM, the electrons are accelerated to produce a high-energy beam, and hence, the wavelength created is much shorter than that of visible light (Pérez and Bertoft, 2010). SEM provides high-resolution images, but these images lack contrast when compared to polarization images. SEM is widely used to study the organization of shells in granules, but very limited information can be obtained on the molecular structure and arrangement of lamellae (Pilling and Smith 2003).
A growing appreciation of the importance in the food and starch industries is occurring due to the topic’s high economic and industrial relevance. In one study, AmyBS-I (a raw-starch-digesting amylase gene) from Bacillus subtilis strain AS01a was cloned and expressed in Escherichia coli BL21 cell. The purified enzyme was obtained which showed an optimum activity at 7 °C and pH 6.0 (Roy et al. 2013) and glucose was able to hydrolyze a wide range of raw starches (wheat, rice, and potato) to produce mainly maltose and glucose. The sample was prepared by adding 5.0 mL of 2% (w/v) starch to 50 mM sodium phosphate buffer (pH 6.0) with a concentration of 10 g/mL AmyBS-I and was incubated at 60 °C for 6 h. The efficiency of raw starch digestion due to AmyBS-I was observed under SEM. Figure 9 compares the SEM images of starch granules before and after hydrolysis with the enzymes with the enzyme, AmyBS-I. Starch granules after degradation showed shallow and deep cavities on its surface. Potato, rice, and wheat starches were 61%, 58%, and 44% hydrolyzed respectively. Only a limited number of bacterial amylases can degrade raw potato starch. Hence, AmyBS-I has a potential application in food and fermentation industries with relation to potato starch hydrolysis (Roy et al. 2013).
Fig. 9.

SEM images of starch granules before and after hydrolysis with AmyBS-I. a Raw potato starch. b Hydrolyzed potato starch. c Raw rice starch. d Hydrolyzed rice starch. e Raw wheat starch. f Hydrolyzed wheat starch. Figure reproduced from Roy et al. (2013), with kind permission from Elsevier
In another study, the effects of α-amylase obtained from a mutant type of Bacillus amyloliquefaciens on raw wheat, potato, corn, sweet potato, and rice starches were observed under SEM (Demirkan et al. 2005). To prepare sample, first, starch was washed with Milli-Q water and dried, then 5% of each type of starch was suspended in 400 mL of 50 mM acetate buffer (pH 5.5) containing 10 mM 2-ME (mercaptoethanol), 5 mM CaCl2. The reaction began by the addition of 100 mL enzyme solution to it. Enzyme substrate mixtures were incubated for 24 h and then centrifuged. The supernatants were used to determine amount of released sugars using dinitrosalicylic acid method with maltose as the standard. The starch grains were washed twice with pure ethanol/t-butyl alcohol and lyophilized for obtaining SEM images. Degradation patterns of raw starch granules were observed by SEM (Fig. 10). The degradation begins on the surface and proceeds towards the centre. The enzyme activity is higher in the case of corn, rice, and wheat starches, while potato and sweet potato starches are resistant to degradation. The effect of enzyme is clearly observed in SEM micrographs (Demirkan et al. 2005).
Fig. 10.
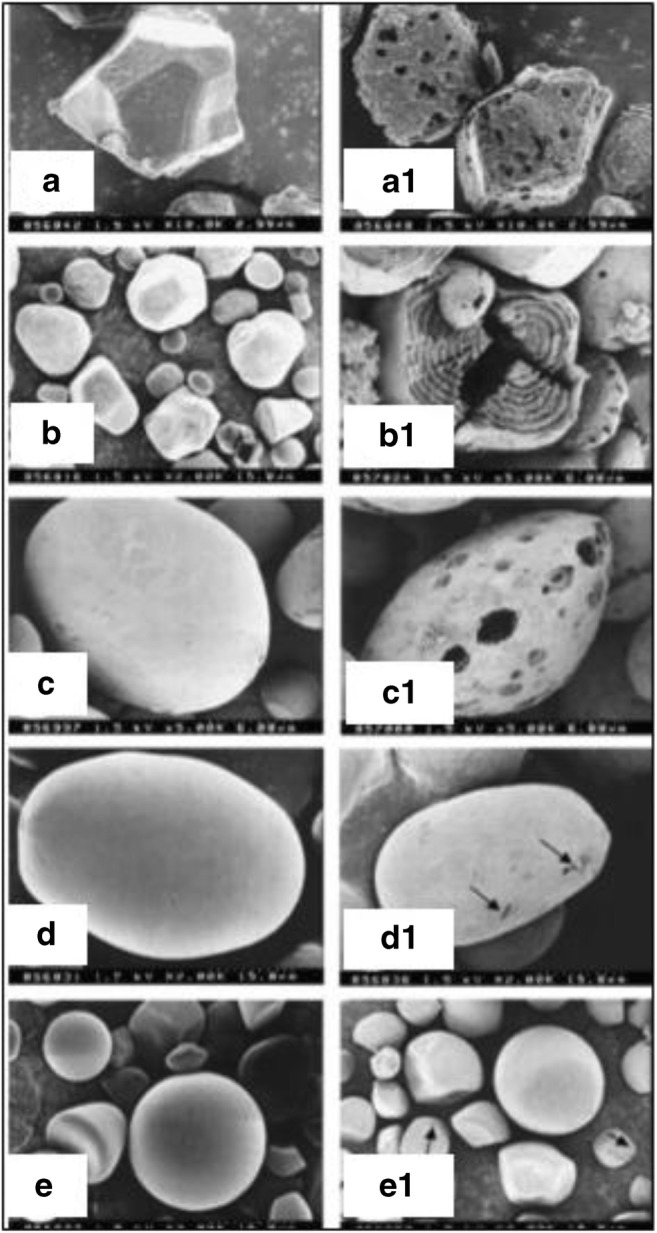
SEM images of starch granules before and after hydrolysis with enzyme (a) untreated rice starch, (a1) treated rice starch, (b) untreated corn starch, (b1) treated corn starch, (c) untreated wheat starch, (c1) treated wheat starch, (d) untreated potato starch, (d1) treated potato starch, (e) untreated sweet potato starch, and (e1) treated sweet potato starch. Figure reproduced from Demirkan et al. (2005) with kind permission from Elsevier
In a study by Li et al. (2011), they investigated the effect of α-amylase on yam starch granules at various time points of incubation (12, 24 h). A starch-α-amylase mixture was prepared using 20 g of native yam starch, 75 mL of 20 mmol/L of phosphate buffer at pH 6.9, and 200 U enzyme/g α-amylase. The morphology of the native starch granule was large, oval to small, irregular in shape. With the increase in incubation time, small starch granules were broken down along with some integrated granules. After 12 h of hydrolysis, the inner structures of the starch granules were degraded, whereas the starch surface remained smooth with the presence of a few fissures. After 24 h of incubation, the granules were completely broken down into small pieces when observed under SEM. In this study, it was concluded that the core of the granule is easily attacked by the α-amylase and that it hydrolyzes internal α-1,4-glycoside bonds of amylose which is amorphous and the crystalline part on the surface of starch granules. Mu et al. (2015) investigated the susceptibility of starch granules to different concentrations of α-amylase at different levels of high hydrostatic pressure (HHP) and the extent of starch hydrolysis. The molecular structure of native, HHP-treated, hydrolyzed native and hydrolyzed HHP600-treated potato starches were observed using SEM micrographs as shown in Fig. 11. Native potato starch shows a smooth granule surface, a typical elliptical and spherical shape without any cavities or fissures. The extent of degradation increases at higher enzyme concentrations. HPP treatment gelatinizes the starch granules partially, thus increasing their susceptibility to enzymatic degradation when compared to native forms (Mu et al. 2015).
Fig. 11.

SEM micrographs for native potato starch (NPS), hydrolyzed native potato starch (hNPS), and 600 MPa-treated potato starches (PS) with 0.06% (w/v) α-amylase: a NPS, b 600 MPa, 0.02% (w/v), c 600 MPa, 0.04% (w/ v), d 600 MPa, 0.06% (w/v). Figure reproduced from Mu et al. (2015) with kind permission from PLoS ONE
In another study, the morphologies of normal and high-amylose maize starches were compared. SEM images of normal maize starch showed homogenous polygonal granules. Magnified images displayed several cavities on the granule surface (Fig. 12). High-amylose starch showed significant heterogeneity and consisted of three different types of granules: individual granules, aggregated granules, and elongated granules. The individual granules had smoother surfaces, smaller size, and were rounder in shape than normal maize. Aggregated and elongated granules were significantly different from the individual granules, showing rough and lumpy shapes. Pores were absent on the surfaces of all these granules (Cai and Wei, 2013).
Fig. 12.

SEM images of starch granules. a, c Normal maize. b, d–g High-amylose maize. c Individual granule showing many pores on the granule surface. d–g The morphologies of individual, aggregate, and elongated granules, respectively. Scale bar = 10 μm. Figure reproduced from Cai and Wei (2013) with kind permission from Elsevier
Previous studies suggest that the growth ring formation is under the control of two biological mechanisms: diurnal rhythm (day/night variations in the environment) and circadian rhythm (persists in the absence of environmental cycles). These theories were tested in a study conducted by Pilling and Smith (2003). A plant was subjected to constant conditions with altered photoperiods. They also examined whether formation of growth rings was influenced by the structure of starch polymers, i.e. by variation in starch-synthesizing enzymes. Growth rings were studied after mechanical damage and treatment with α-amylase. Starch granules of potato (Solanum tuberosum) plant grown under 16 h of light and 8 h of darkness showed formation of uniform growth rings and a decrease in width from hilum to periphery. The effect of these constant conditions was investigated in plants from the time of planting and also on microtubers developed on stem explants at high sucrose concentrations. There were prominent major rings alternating with minor rings, but that was also seen under normal conditions. To investigate the diurnal effect, two transgenic types were taken in which the diurnal pattern of supply of sucrose to the tuber was altered. One of the plants had an altered FBPase (fructose-1,6-bisphosphtase) and the other had an altered SPS (sucrose phosphate synthase). Both showed growth rings similar to the control, indicating that the formation of growth rings is not affected by diurnal variation. Overall, the data raise the possibility that the growth ring formation is influenced by circadian rhythms and physical mechanisms. It is possible that diurnal rhythms could also have contributed to the growth ring formation in potato (Pilling and Smith 2003).
To summarize, SEM provides higher magnification images as compared to optical microscopy which helps us differentiate between various genetic varieties of starches even though the phase contrast is not comparable to polarization microscopy. It provides detailed information about surface topology and composition. Thus, it is used for investigating/monitoring the degradative effect of amylase under various conditions. Formation of growth rings can be analysed which gives us more information about starch synthesis.
Atomic force microscopy of starch granules
Since the invention of atomic force microscope (AFM) in 1986, it had been widely used to identify the surfaces of nano-scale resolution objects (Chang et al. 2012). AFM is a type of scanning probe microscope which provides 3D topographical and textural information of the sample on the basis of force of interaction between the crystal tip of the cantilever and the sample. Initially, it was used to observe the surface structures of micro- and nano-scaled non-biological materials. Later on, it was applied to the observation of biological engineered samples (Yang 2011; Ridout et al. 2002). High-speed atomic force microscopy (HSAFM) has been utilized recently to continuously evaluate the structure and dynamics of protein molecules (Ando 2018). AFM is preferred over the conventional microscopic techniques due to its ease in sample preparation as it does not require complicated procedures such as metal coating, and freezing or drying the samples. It can image samples in aqueous or atmospheric conditions and has high resolution (Chang et al., 2012).
The basic components of an AFM include a cantilever with a sharp tip, a piezo scanner that drives the cantilever, a laser diode, and a sensitive detector (Ando 2018; Chang et al. 2012). The cantilever, generally made up of silicon or silicon nitride, touches the surface of the specimen through means of a sharp tip also referred to as AFM probe (Engel et al. 1999). Depending on the type of force (attractive or repulsive) acting between the probe and the sample surface, the cantilever attached to the probe gets deflected. This deflection is detected generally using an optical laser beam detection system (Vahabi et al 2013). Displacement is measured by detecting the deflections in the laser light on the photosensitive detector (Chang et al. 2012). AFM has several modes of operation among which the commonly used ones are contact and non-contact modes (Dufrêne et al. 2017). The conventional microscopic techniques made significant contributions in understanding the features of starch such as physical nature, structural orientation, chemical nature, and molecular organizations. Using advanced techniques, it is revealed that around 90–95% of the starch granule surface is primarily carbohydrate in nature (Chang et al., 2012). SEM requires sample preparation which can induce changes in the starch structure, thus hindering the observation. Ayoub et al. (2006) revealed that multiple cycles of freeze thawing processes involved during sample preparations influenced the potato starch granule by disrupting its crystalline order. Additionally, the structure of starch granules can be disturbed on introducing water or any plasticizers like glycerol. Hence, AFM can be used to observe the actual structure of starch without inducing any error due to sample preparations. A study (Ayoub et al. 2006) reveals how the surface topography of native starch changes on using plasticizer/lyophilizing procedure to introduce disorder in the structure of rice starch (here, by mixing a plasticizer glycerol with rice starch and lyophilizing the sample). The results indicated that the surfaces of the native starch granule were robust, hence providing sufficiently high-resolution image in AFM. It was observed that the image showed globular structures on the surface of the native starch with a diameter of approximately 70 nm (Fig. 13a). An enlarged view of size 500 × 500 nm2 (Fig. 13b) shows that the granules are arranged in series and look like beaded chain bundled together into a cylindrical shape with the varying sizes of these granule structures. Figure 13c shows the AFM image of starch after its treatment with plasticizer and lyophilization process. The diameter of the processed starch showed globular structures with diameter between 10 and 70 nm, with average size almost half of that of blocklet structure of native starch.
Fig. 13.

Topographical image of surface region of a native starch, scan size 1.5 μm × 1.3 μm, height range 400 nm; b native starch, scan size 500 μm × 500 μm, height range 250 nm; and c rice starch after treatment with plasticizer and lyophilization, scan size 500 μm × 500 μm, height range 10 nm. Figure reproduced from Ayoub et al. (2006) with kind permission from Wiley
Baldwin et al. (1998) investigated the structure of wheat and potato starch using AFM and low-voltage scanning electron microscope (LVSEM) as these techniques do not require sample coating, hence reducing the errors. It was observed that wheat granule surface showed structures ranging between 10 and 50 nm and some elevated regions (raised nodules) showing larger sized structures of size 50–300 nm (Fig. 14a). Potato starch granule surfaces contained larger number of elevated regions (Fig. 14b). The raised nodules in potato starch were more frequent than in that of wheat starch. It was observed that the sizes of these raised nodules were comparable with the size of “blocklet” described by Gallant et al. (1997); hence, it was concluded that “blocklet” and “raised nodules” were the same structures and that they are carbohydrate in nature.
Fig. 14.

AFM image of a typical surface region of a Wheat starch granule (scan size 1000 nm2, z height difference (representing the difference between the highest and the lowest points measured in the scan) of 52.6 nm. b Potato starch granule (scan size 1000 nm2, z height difference of 73.8 nm) showing elevated regions. Figure reproduced from Baldwin et al. (1998) with kind permission from permission of Elsevier
Ridout et al. (2003) investigated the internal structure of potato and maize starch granules using AFM. It was concluded that it is possible to visualize the internal structure of starch using AFM after going through the embedding and sectioning processes. Despite the flatness of the sample, a difference in the elastic modulus across the sample is said to increase contrast in the image. Figure 15 shows the imaging of maize starch fixed in rapidly setting Araldite, imaged in air. The image shows a radial crack and a central hole (Fig. 15a). The error signal mode (Fig. 15b) and force modulation (Fig. 15c) images give a clear view of the growth rings. Further evidences for globular structures within and across the growth rings can be seen in the high magnification force resolution image (Fig. 15d). These globular structures existed in size ranging between 45 and 85 nm are identifiably as true features of a starch granule. The internal structure of banana granules was also investigated through AFM (Peroni-Okita et al. 2015). The banana starch was embedded in rapid-fast Araldite and was placed in resin block and polished until mirror-like surface was obtained and then AFM imaging was done to observe the internal structure of the granule. At low resolution, the growth rings were clearly visualized with a radial crack existing mainly due to the variation of height across the granule because of absorption of water and permanent swelling of amorphous regions. To observe the internal structure, AFM was used in force modulation mode to create further contrast in imaging. Images taken by AFM displayed several details of the internal structure of starch granule. It revealed that in banana starch granules, the central region was composed of different materials with different viscoelastic properties when compared to the other regions of the granule. Also, the central region is predominantly composed of blocklet structures of larger size (80–200 nm) and few blocklet structures of smaller size (15–50 nm).
Fig. 15.

AFM image of sectioned maize starch embedded in rapid-set Araldite. a Topographical image. b Error signal image. c Force modulation image. d High magnification force modulation image. Figure reproduced from Ridout et al. (2003) with kind permission from permission of Elsevier
To summarize, AFM imaging provides information at near-molecular resolution of the granule surfaces. The contrast in image is obtained due to sample topography and differences in sample elasticity. Despite the flatness in the samples, the difference in elastic modulus can enhance contrast, hence attaining a fairly high-contrast image for sampling internal structures. AFM provides a novel method for observation of samples in a native, unstained, and unmodified system. This technique can also be used to identify structural modifications in mutated or processed specimen from different botanical sources.
Second harmonic generation microscopy of starch granules
Second harmonic generation (SHG) microscopy has emerged as a powerful nonlinear optical imaging technique in the last decade (Cox 2011). SHG is a nonlinear optical effect observed in non-centrosymmetric molecules, where two photons with the same frequency “combine” to produce a single photon with twice the frequency (Cox 2011). This process has been used to obtain images of SHG active molecules by subjecting the specimen to highly focused, short pulse of radiation and recording the emitted signal. SHG microscopy is now commonly used for collagen imaging and is becoming popular for myosin and starch imaging (Cox 2011). SHG imaging is done by analyzing the contrast in the signals obtained from different parts of the specimen. Furthermore, on enhancing the resonant SH signals with respect to different electronic levels, we can pick up signals from specific molecules which allow us to map the distribution of these molecules across a biological sample (Mizutani et al. 2000).
Starch is a semi-crystalline, water-insoluble polysaccharide present in plants in the form of macroscopic granules and as such starch shows a very intense SH response making SHG microscopy an ideal tool for starch imaging. The molecular origin of SHG signals in starch is amylopectin. This has been confirmed by quantitative analysis of the SHG signals obtained from different types and varieties of rice with known amylose:amylopectin ratio. This experiment concluded that the orientation and structural arrangement of amylopectin within the starch granule affects the resulting SHG signal. In fact, upon studying the SHG signal variations in relation to the axial direction, the 3D orientation of amylopectin in starch can be obtained (Zhuo et al. 2010).
Starch images are captured using polarization second harmonic generation (PSHG) microscopy, i.e. the light incident on the specimen is polarized light. Images of wheat starch (Fig. 16a) and potato starch (Fig. 16b) were obtained using light of different incident polarization states. On using a polarized beam of light on a single-starch granule, the anisotropic nature of starch is observed. Due to its anisotropy, the SHG signals obtained vary with different incident polarization states. This can be used for imaging of the starch granule by calculating the mean intensity of these signals (Fig. 16c) and for estimating the helical pitch angle of the amylopectin by optical slicing. Representation of the angle φ parameter of the obtained SHG signal in the form of a 2D image (Fig. 16d) shows the radial orientation of amylopectin within the starch granule (Psilodimitrakopoulos et al. 2010; Zhuo et al. 2010).
Fig. 16.

a Images of potato starch granules obtained using a PSHG microscope at different polarization states. Figure reproduced from Zhuo et al. (2010) with kind permission from Elsevier. b Images of wheat starch granules obtained using a PSHG microscope at different polarization states. c Image obtained by calculating mean of SHG intensities. d Representation of angle φ (angle between the region of starch under study and incident polarized light) parameter depicting the radial orientation of amylopectin in starch. Figure reproduced from Psilodimitrakopoulos et al. (2010) with kind permission from IOP Publishing
In a study, the effect of hydration on the structure of wheat starch granules was studied using SHG microscopy (Psilodimitrakopoulos et al. 2010). Upon embedding starch in water, the amylopectin present in the outer layer of starch reorganizes into a more uniform spherical shape or crystalline lamellae. Movement of water within the granule is also observed indicating channelling of water into the granule. The SHG images of hydrated and dry starch showed that a better response was obtained from the hydrated starch sample. However, on superposing the forward and backward SHG signals detected from the hydrated starch sample, it was noted that at the equator region, there was no overlap and a dark region was obtained. This is due to the hard, heterogenous, amylopectin-rich outer envelope of starch known as a “ghost”. After almost 3 h of embedding the starch in water, the outer envelope separated from the rest of the starch. At this stage, SHG imaging was done and it was observed that the signals were only generated in the backward direction. This was suggested to be due to backscattering of light by the hard outer envelope of starch granules (Psilodimitrakopoulos et al. 2010).
During SHG imaging of starch granule with linearly polarized light, it was observed that there is a region perpendicular to the axis of polarization that is devoid of any signal. This indicates the radial distribution of SHG-active molecule (amylopectin) in starch. The more orthogonal the dark region, the more radial the organization of amylopectin within the granule. On summation of the images of starch obtained using incident light of different polarization states, a central dark region was observed. This is the hilum. It is comparatively less organized than the rest of the starch granule (Mazumder et al. 2018).
In another study, both SHG and coherent anti-Stokes scattering (CARS) imaging of rice starch were performed and it was observed that both signals were complementary to each other. While SHG mainly focuses on crystallinity, CARS signal described on the local density of resonant bonds (Slepkov et al. 2010). Both CARS and SHG images were obtained and analysed. Both signals showed striations, but the striations of CARS image were more intense when compared to those of SHG. This suggests that crystalline shells of starch are less dense than the amorphous shells. The hilum is also visible as a dark dimple in CARS imaging. The images obtained by CARS and SHG microscopy were merged together to obtain a single image in which the striations of both the images were anti-correlated with each other (Fig. 17a). Swelling of rice starch was also observed using combined CARS and SHG imaging. It was concluded that water penetrates the starch granule and disrupts its structure from inside-out. However, it was observed that SHG signal dropped significantly faster when compared to CARS signal indicating that the structure is more affected than the bond concentration (Slepkov et al. 2010).
Fig. 17.

a Overlaid CARS (red) and SHG (green) images of potato starch grains in which striations associated with alternating crystalline and amorphous layers are clearly visible. Figure reproduced from Slepkov et al. (2010) with kind permission from The Optical Society. b Polarization-resolved SHG images of starch granule showing a stack of images of 4 different polarization inputs. c 2D reconstruction of Stokes image (S0) of starch granule. Figure reproduced from Mazumder et al. (2018) with kind permission from IOP Publishing
To summarize, a Stokes vector-based polarization SHG microscopy has been developed that measures the different Stokes vector intensities of SHG signals produced, in four different channels, for a fixed polarization state. There are 4 Stokes vectors: S0, S1, S2, and S3. S0 denotes the total intensity of emitted SHG signal, S1 gives the difference between the intensities of horizontal and vertical linearly polarized light at 0° and 90°, S2 is the difference in intensities of the polarization states of linearly polarized light at 45° and − 45o, and S3 is the intensity difference between right and left circularly polarized light. The SHG technique allows one to obtain the complete polarization states of the resulting SHG signal and gives significant molecular orientation information on further analysis of the Stokes parameter. For example, analysis of the S3 parameter depicts chirality of the amylopectin in starch. Images of starch acquired using a regular PSHG and a Stokes vector-based PSHG were compared (Mazumder et al. 2018). This study also concluded that linearly polarized light can be used to find out the right or left handedness of helical structures like amylopectin (Mazumder et al. 2013). On heating dry starch and analyzing it using Stokes vector-based microscopy, not much change was observed in the properties of SHG signals at high temperature. However, hydrated starch granules showed changes in the Stokes parameters of the SHG signals at high temperatures indicating disruption of the orientation of the crystalline molecules, amylopectin (Mazumder et al. 2017). SHG provides a powerful, non-destructive, and label-free method for starch visualization. Imaging of starch using SHG gives information not only on the structure of starch but also on the organization of molecules within the starch granule. 3D imaging of starch can also be done using SHG microscopy. The use of SHG microscopy for imaging of starch has offered us a lot more information about its structure and molecular properties. Further development of SHG signal processing techniques and combined use of SHG microscopy with other microscopy techniques will provide highly detailed information of the specimen in the future.
Conclusion
Microscopy has been a fundamental tool of science for nearly 400 years and it is still to this day one of the most frequently used techniques in the material and life sciences. Advancement in microscopic techniques has allowed us to obtain detailed information of the specimen being examined. This review describes the use of microscopic techniques such as optical microscopy, polarization microscopy, scanning electron microscopy (SEM), confocal microscopy, atomic force microscopy (AFM), and second harmonic generation (SHG) microscopy to characterize starch molecules obtained from different biological sources. The average size of starch ranges from 1 to 100 μm and therefore can be observed using optical microscopy. Polarization microscopy visualizes the destruction of birefringence and characteristic Maltese cross which indicates that the starch granules are semi-crystalline. SEM images provide a much higher magnification clearly depicting the surface topography of the granules before and after enzymatic hydrolysis that elucidates the process of degradation. This helps to understand the mechanism of action of various starch-degrading enzymes. The alpha-amylase digests raw starch from various sources (wheat, potato, rice, etc.) very effectively which makes the enzyme a better candidate for industrial application in food, production of ethanol, sugar syrups, biofuel, and fermentation industries. Confocal imaging allows visualization of cross-section of starch granules in its natural environment. AFM enables imaging of native, unstained, and unmodified starch granules. SHG microscopy imaging gives a detailed understanding of the internal structure and molecular organization of starch granules. The basic understanding of the physiochemical properties of starch granules will provide a valid basis for further studies in food science technology. For example, slowly digestible or resistant starch derived from uncooked food, whole grains, legumes, tubers, and vegetables can be used as an appropriate source of carbohydrates to reduce the risk of various conditions/diseases such as cardiovascular diseases, obesity, and diabetes.
Acknowledgements
The authors thank Dr. K. Satyamoorthy, Director, Manipal School of Life Sciences (MSLS), MAHE, for his encouragement and Manipal Academy of Higher Education, Manipal, for providing the infrastructure and facilities. We thank Dr. K. K. Mahato, HoD, Department of Biophysics, MSLS, MAHE, for the fruitful discussion in preparation of this review article.
Funding information
We thank Department of Biotechnology (DBT), Government of India, for the financial support (project number: BT/PR25099/NER/95/1014/2017).
Footnotes
Publisher’s note
Springer Nature remains neutral with regard to jurisdictional claims in published maps and institutional affiliations.
References
- Alcázar-Alay SC, Meireles MAA. Physicochemical properties, modifications and applications of starches from different botanical sources. Food Sci Technol. 2015;35:215–236. doi: 10.1590/1678-457X.6749. [DOI] [Google Scholar]
- Ando T. High-speed atomic force microscopy and its future prospects. Biophys Rev. 2018;10:285–292. doi: 10.1007/s12551-017-0356-5. [DOI] [PMC free article] [PubMed] [Google Scholar]
- Ayoub A, Ohtani T, Sugiyama S. Atomic force microscopy investigation of disorder process on rice starch granule surface. Starch-Stärke. 2006;58:475–479. doi: 10.1002/star.200500471. [DOI] [Google Scholar]
- Baldwin PM, Adler J, Davies MC, Melia CD. High resolution imaging of starch granule surfaces by atomic force microscopy. J Cereal Sci. 1998;27:255–265. doi: 10.1006/jcrs.1998.0189. [DOI] [Google Scholar]
- Blennow A, Hansen M, Schulz A, Jørgensen K, Donald AM, Sanderson J. The molecular deposition of transgenically modified starch in the starch granule as imaged by functional microscopy. J Struct Biol. 2003;143:229–241. doi: 10.1016/j.jsb.2003.08.009. [DOI] [PubMed] [Google Scholar]
- Buleon A, Colonna P, Planchot V, Ball S. Starch granules: structure and biosynthesis. Int J Biol Macromol. 1998;23:85–112. doi: 10.1016/s0141-8130(98)00040-3. [DOI] [PubMed] [Google Scholar]
- Cai C, Wei C. In situ observation of crystallinity disruption patterns during starch gelatinization. Carbohydr Polym. 2013;92:469–478. doi: 10.1016/j.carbpol.2012.09.073. [DOI] [PubMed] [Google Scholar]
- Carlton Robert Allen. Pharmaceutical Microscopy. New York, NY: Springer New York; 2011. Polarized Light Microscopy; pp. 7–64. [Google Scholar]
- Chang KC, Chiang YW, Yang CH, Liou JW. Atomic force microscopy in biology and biomedicine. Tzu Chi Med J. 2012;24:162–169. doi: 10.1016/j.tcmj.2012.08.002. [DOI] [Google Scholar]
- Chen P, Yu L, Simon GP, Liu X, Dean K, Chen L. Internal structures and phase-transitions of starch granules during gelatinization. Carbohydr Polym. 2011;83:1975–1983. doi: 10.1155/2015/397128. [DOI] [Google Scholar]
- Chen Y, Huang S, Tang Z, Chen X, Zhang Z. Structural changes of cassava starch granules hydrolyzed by a mixture of α-amylase and glucoamylase. Carbohydr Polym. 2011;85:272–275. doi: 10.1016/2Fj.carbpol.2011.01.047. [DOI] [Google Scholar]
- Cox G. Biological applications of second harmonic imaging. Biophys Rev. 2011;3:131. doi: 10.1007/2Fs12551-011-0052-9. [DOI] [PMC free article] [PubMed] [Google Scholar]
- Demirkan ES, Mikami B, Adachi M, Higasa T, Utsumi S. α-Amylase from B. amyloliquefaciens: purification, characterization, raw starch degradation and expression in E. coli. Process Biochem. 2005;40:2629–2636. doi: 10.1016/j.procbio.2004.08.015. [DOI] [Google Scholar]
- Egerton RF. Physical principles of electron microscopy: 41. New York: Springer; 2005. [Google Scholar]
- Engel A, Lyubchenko Y, Müller D. Atomic force microscopy: a powerful tool to observe biomolecules at work. Trends Cell Biol. 1999;9:77–80. doi: 10.1016/S0962-8924(98)01415-9. [DOI] [PubMed] [Google Scholar]
- Fannon JE, Gray JA, Gunawan N, Huber KC, BeMiller JN. Heterogeneity of starch granules and the effect of granule channelization on starch modification. Cellulose. 2004;11:247–254. doi: 10.1023/B:CELL.0000025399.66700.d7. [DOI] [Google Scholar]
- Fonseca-Florido HA, Hernández-Ávilab J, Rodríguez-Hernández AI, Castro-Rosas J, Acevedo-Sandoval OA, Chavarria-Hernández N, Gómez-Aldapa CA. Thermal, rheological, and mechanical properties of normal corn and potato starch blends. Int J Food Prop. 2017;20:611–622. doi: 10.1080/10942912.2016.1171779. [DOI] [Google Scholar]
- Gallant DJ, Bouchet B, Baldwin PM. Microscopy of starch: evidence of a new level of granule organization. Carbohydr Polym. 1997;32:177–191. doi: 10.1016/S0144-8617(97)00008-8. [DOI] [Google Scholar]
- Gallant DJ, Bouchet B, Buleon A, Perez S. Physical characteristics of starch granules and susceptibility to enzymatic degradation. Eur J Clin Nutr. 1992;46:3–16. [PubMed] [Google Scholar]
- Glaring MA, Koch CB, Blennow A. Genotype-specific spatial distribution of starch molecules in the starch granule: a combined CLSM and SEM approach. Biomacromolecules. 2006;7:2310–2320. doi: 10.1021/bm060216e. [DOI] [PubMed] [Google Scholar]
- Jacobson MR, Obanni M, Bemiller JN. Retrogradation of starches from different botanical sources. Cereal Chem. 1997;74:511–518. doi: 10.1094/CCHEM.1997.74.5.511. [DOI] [Google Scholar]
- Ji Y, Seetharaman K, White PJ. Optimizing a small-scale corn-starch extraction method for use in the laboratory. Cereal Chem. 2004;81:55–58. doi: 10.1094/CCHEM.2004.81.1.55. [DOI] [Google Scholar]
- Li X, Gao W, Wang Y, Jiang Q, Huang L. Granule structural, crystalline, and thermal changes in native Chinese yam starch after hydrolysis with two different enzymes—α-amylase and gluco-amylase. Starch-Stärke. 2011;63:75–82. doi: 10.1002/star.201000104. [DOI] [Google Scholar]
- Liu Y, Xu Y, Yan Y, Hu D, Yang L, Shen R. Application of Raman spectroscopy in structure analysis and crystallinity calculation of corn starch. Starch-Stärke. 2015;67:612–619. doi: 10.1002/star.201400246. [DOI] [Google Scholar]
- Manca M, Woortman AJ, Loos K, Loi MA. Imaging inclusion complex formation in starch granules using confocal laser scanning microscopy. Starch-Stärke. 2015;67:132–138. doi: 10.1002/star.201400118. [DOI] [Google Scholar]
- Mazumder N, Qiu J, Foreman MR, Romero CM, Török P, Kao FJ. Stokes vector-based polarization resolved second harmonic microscopy of starch granules. Biomed Opt Express. 2013;4:538–547. doi: 10.1364/BOE.4.000538. [DOI] [PMC free article] [PubMed] [Google Scholar]
- Mazumder N, Xiang L, Qiu J, Kao FJ. Investigating starch gelatinization through Stokes vector resolved second harmonic generation microscopy. Sci Rep. 2017;7:45816. doi: 10.1038/2Fsrep45816. [DOI] [PMC free article] [PubMed] [Google Scholar]
- Mazumder N, Yun-Xiang L, Qiu J, Kao FJ. Revealing molecular structure of starch with Stokes-vector based second harmonic generation microscopy. J Opt. 2018;47:40–46. doi: 10.1007/s12596-017-0419-9. [DOI] [Google Scholar]
- Mehta SB, McQuilken M, La Riviere PJ, Occhipinti P, Verma A, Oldenbourg R, Tani T. Dissection of molecular assembly dynamics by tracking orientation and position of single molecules in live cells. Proc Natl Acad Sci. 2016;113:E6352–E6361. doi: 10.1073/pnas.1607674113. [DOI] [PMC free article] [PubMed] [Google Scholar]
- Mizutani G, Sonoda Y, Sano H, Sakamoto M, Takahashi T, Ushioda S. Detection of starch granules in a living plant by optical second harmonic microscopy. J Lumin. 2000;87:824–826. doi: 10.1016/S0022-2313(99)00428-7. [DOI] [Google Scholar]
- Mu TH, Zhang M, Raad L, Sun HN, Wang C. Effect of α-amylase degradation on physicochemical properties of pre-high hydrostatic pressure-treated potato starch. PloS One. 2015;10:e0143620. doi: 10.1371/journal.pone.0143620. [DOI] [PMC free article] [PubMed] [Google Scholar]
- Murphy DB (2002) Fundamentals of light microscopy and electronic imaging. John Wiley & Sons
- Ong M.H., Blanshard J.M.V. Texture determinants in cooked, parboiled rice. I: Rice starch amylose and the fine stucture of amylopectin. Journal of Cereal Science. 1995;21(3):251–260. doi: 10.1006/jcrs.1995.0028. [DOI] [Google Scholar]
- Oostergetel GT, Van Bruggen EF. The crystalline domains in potato starch granules are arranged in a helical fashion. Carbohydrate Polymers. 1993;21:7–12. doi: 10.1016/0144-8617(93)90110-P. [DOI] [Google Scholar]
- Pérez S, Bertoft E. The molecular structures of starch components and their contribution to the architecture of starch granules: a comprehensive review. Starch-Stärke. 2010;62:389–420. doi: 10.1002/star.201000013. [DOI] [Google Scholar]
- Perez-Rea D, Rojas C, Carballo S, Aguilar W, Bergenståhl B, Nilsson L. Enzymatic hydrolysis of Canna indica, Manihot esculenta and Xanthosoma sagittifolium native starches below the gelatinization temperature. Starch-Stärke. 2013;65:151–161. doi: 10.1002/star.201200103. [DOI] [Google Scholar]
- Peroni-Okita FH, Gunning AP, Kirby A, Simão RA, Soares CA, Cordenunsi BR. Visualization of internal structure of banana starch granule through AFM. Carbohydr Polym. 2015;128:32–40. doi: 10.1016/j.carbpol.2015.04.019. [DOI] [PubMed] [Google Scholar]
- Peroni-Okita Fernanda H.G., Cardoso Mateus B., Agopian Roberta G.D., Louro Ricardo P., Nascimento João R.O., Purgatto Eduardo, Tavares Maria I.B., Lajolo Franco M., Cordenunsi Beatriz R. The cold storage of green bananas affects the starch degradation during ripening at higher temperature. Carbohydrate Polymers. 2013;96(1):137–147. doi: 10.1016/j.carbpol.2013.03.050. [DOI] [PubMed] [Google Scholar]
- Pilling E, Smith AM. Growth ring formation in the starch granules of potato tubers. Plant Physiol. 2003;132:365–371. doi: 10.1104/pp.102.018044. [DOI] [PMC free article] [PubMed] [Google Scholar]
- Psilodimitrakopoulos S, Amat-Roldan I, Loza-Alvarez P, Artigas D. Estimating the helical pitch angle of amylopectin in starch using polarization second harmonic generation microscopy. J Opt. 2010;12:084007. doi: 10.1088/2040-8978/12/8/084007. [DOI] [Google Scholar]
- Qin F, Man J, Xu B, Hu M, Gu M, Liu Q, Wei C. Structural properties of hydrolyzed high-amylose rice starch by α-amylase from Bacillus licheniformis. J Agric Food Chem. 2011;59:12667–12673. doi: 10.1021/jf203167f. [DOI] [PubMed] [Google Scholar]
- Ridout M.J, Gunning A.P, Parker M.L, Wilson R.H, Morris V.J. Using AFM to image the internal structure of starch granules. Carbohydrate Polymers. 2002;50(2):123–132. doi: 10.1016/S0144-8617(02)00021-8. [DOI] [Google Scholar]
- Ridout MJ, Parker ML, Hedley CL, Bogracheva TY, Morris VJ. Atomic force microscopy of pea starch granules: granule architecture of wild-type parent, r and rb single mutants, and the rrb double mutant. Carbohydr Res. 2003;338:2135–2147. doi: 10.1016/s0008-6215(03)00309-4. [DOI] [PubMed] [Google Scholar]
- Roy JK, Borah A, Mahanta CL, Mukherjee AK. Cloning and overexpression of raw starch digesting α-amylase gene from Bacillus subtilis strain AS01a in Escherichia coli and application of the purified recombinant α-amylase (AmyBS-I) in raw starch digestion and baking industry. J Mol Catal B Enzym. 2013;97:118–129. doi: 10.1016/j.molcatb.2013.07.019. [DOI] [Google Scholar]
- Sarko A, Wu HC. The crystal structures of A-, B-and C-polymorphs of amylose and starch. Starch-Stärke. 1978;30:73–78. doi: 10.1002/star.19780300302. [DOI] [Google Scholar]
- Shalin BM, Shribak M, Oldenbourg R (2013) Polarized light imaging of birefringence and diattenuation at high resolution and high sensitivity. J Optics 15:094007 [DOI] [PMC free article] [PubMed]
- Shaw SL. Imaging the live plant cell. Plant J. 2006;45:573–598. doi: 10.1111/j.1365-313X.2006.02653.x. [DOI] [PubMed] [Google Scholar]
- Slepkov AD, Ridsdale A, Pegoraro AF, Moffatt DJ, Stolow A. Multimodal CARS microscopy of structured carbohydrate biopolymers. Biomed Opt Express. 2010;1:1347–1357. doi: 10.1364/BOE.1.001347. [DOI] [PMC free article] [PubMed] [Google Scholar]
- Souza PMD. Application of microbial α-amylase in industry—a review. Braz J Microbiol. 2010;41:850–861. doi: 10.1590/2FS1517-83822010000400004. [DOI] [PMC free article] [PubMed] [Google Scholar]
- Sujka M, Jamroz J. α-Amylolysis of native potato and corn starches—SEM, AFM, nitrogen and iodine sorption investigations. LWT-Food Sci Technol. 2009;42:1219–1224. doi: 10.1016/j.lwt.2009.01.016. [DOI] [Google Scholar]
- Sundarram A, Murthy TPK. α-Amylase production and applications: a review. J Appl Environ Microbiol. 2014;2:166–175. doi: 10.12691/jaem-2-4-10. [DOI] [Google Scholar]
- Tapia MS, Pérez E, Rodríguez PE, Guzmán R, Ducamp-Collin MN, Tran T, Rolland-Sabaté A. Some properties of starch and starch edible films from under-utilized roots and tubers from the Venezuelan Amazons. J Cell Plast. 2012;48:526–544. doi: 10.1177/2F0021955X12445291. [DOI] [Google Scholar]
- Vahabi S, Salman BN, & Javanmard A (2013) Atomic force microscopy application in biological research: a review study. Iranian Journal of Medical Sciences 38(2):76 [PMC free article] [PubMed]
- Velde FV, Riel J, Tromp RH (2002) Visualisation of starch granule morphologies using confocal scanning laser microscopy (CSLM). Journal of the Science of Food and Agriculture 82(13):1528–1536. 10.1002/jsfa.1165
- Wang J, Guo K, Fan X, Feng G, Wei C. Physicochemical properties of C-type starch from root tuber of Apios fortunei in comparison with maize, potato, and pea starches. Molecules. 2018;23:2132. doi: 10.3390/2Fmolecules23092132. [DOI] [PMC free article] [PubMed] [Google Scholar]
- Yamada T, Hisamatsu M, Teranishi K, Katsuro K, Hasegawa N, Hayashi M. Components of the porous maize starch granule prepared by amylase treatment. Starch-Stärke. 1995;47:358–361. doi: 10.1002/star.19950470907. [DOI] [Google Scholar]
- Yang R, Xi N, Fung CKM, Seiffert-Sinha K, Lai KWC, & Sinha AA (2011) The emergence of AFM applications to cell biology: How new technologies are facilitating investigation of human cells in health and disease at the nanoscale. Journal of Nanoscience letters 1(2):87. [PMC free article] [PubMed]
- Zhuo ZY, Liao CS, Huang CH, Yu JY, Tzeng YY, Lo W, Chu SW. Second harmonic generation imaging—a new method for unravelling molecular information of starch. Journal of Structural Biology. 2010;171:88–94. doi: 10.1016/j.jsb.2010.02.020. [DOI] [PubMed] [Google Scholar]