Abstract
Exhaled acetone is one of the representative biomarkers for the noninvasive diagnosis of type-1 diabetes. In this work, we have applied a facile two-step chemical bath deposition method for acetone sensors based on α-Fe2O3/SnO2 hybrid nanoarrays (HNAs), where one-dimensional (1D) FeOOH nanorods are in situ grown on the prefabricated 2D SnO2 nanosheets for on-chip construction of 1D/2D HNAs. After annealing in air, ultrafine α-Fe2O3 nanorods are homogenously distributed on the surface of SnO2 nanosheet arrays (NSAs). Gas sensing results show that the α-Fe2O3/SnO2 HNAs exhibit a greatly enhanced response to acetone (3.25 at 0.4 ppm) at a sub-ppm level compared with those based on pure SnO2 NSAs (1.16 at 0.4 ppm) and pure α-Fe2O3 nanorods (1.03 at 0.4 ppm), at an operating temperature of 340°C. The enhanced acetone sensing performance may be attributed to the formation of α-Fe2O3–SnO2 n-n heterostructure with 1D/2D hybrid architectures. Moreover, the α-Fe2O3/SnO2 HNAs also possess good reproducibility and selectivity toward acetone vapor, suggesting its potential application in breath acetone analysis.
1. Introduction
As a potential alternative for the noninvasive diagnosis of disease, exhaled breath analysis has been proposed and developed over the past decades [1–3]. The exhaled breath of human beings includes not only nitrogen, oxygen, carbon dioxide, nitric oxide, and water vapor but also a mixture of volatile organic compounds (VOCs) and some other nonvolatile molecules. Encouragingly, a few of them have been regarded as biomarkers to diagnose diseases (). For example, formaldehyde (lung cancer) [4], toluene (lung cancer) [5], ammonia (hemodialysis) [6], H2S (halitosis) [7], isoprene (heart disease) [8], benzene (smoker) [9], and pentane (acute asthma) [10] at few dozens to few thousands of ppb are known as biomarkers for patients. Researchers have also found that exhaled acetone can intuitively correlate with type-1 diabetes, which may exceed 1.8 ppm (only 0.3–0.9 ppm for healthy people) [1, 11]. Therefore, an ultrasensitive acetone sensor is of great importance to detect acetone vapor at a sub-ppm level.
Metal oxide semiconductors (MOXs), such as SnO2, ZnO, α-Fe2O3, CuO, and NiO, have been widely explored in the field of gas detection owing to their simple and cost-effective synthesis, high sensitivity, and good stability. Among these MOXs, α-Fe2O3 is a multifunctional n-type semiconductor with a direct bandgap (Eg = 2.2 eV at 300 K) that has been intensively investigated in the field of gas sensing [12–15]. Several effective strategies have been designed to improve the gas sensing properties of these MOXs, such as doping, surface modification, porous/hollow structures, and hierarchical architectures [16–18]. Recently, construction of hybrid nanostructures is rapidly emerging as a fascinating strategy that combines different MOXs with precise control of their morphologies, such as hollow ZnO/ZnFe2O4 heterostructures that were synthesized by growing ultrathin ZnFe2O4 nanosheets on the outer surface of ZnO hollow microspheres [19], NiO nanoparticle-decorated SnO2 nanosheets [20], CuO nanosheets/ZnO nanorods (NRs) [21], and Fe2O3 nanoparticle-decorated CuO NRs [22]. For this purpose, the rational combination of SnO2 and α-Fe2O3 has been proven to improve their gas sensing performances (). The results show that the α-Fe2O3/SnO2 composites present excellent sensing performances to acetone [23, 24], ethanol [25–30], toluene [31], and LPG [32, 33]. Moreover, their gas sensing properties can be largely affected by the size and shape of nanobuilding blocks (α-Fe2O3 and SnO2). As far as we know, only a few reports about α-Fe2O3–SnO2 system have concerned on the detection of ultralow concentrations of acetone.
In this work, we report a two-step chemical bath deposition (CBD) method to construct the α-Fe2O3/SnO2 hybrid nanoarrays (HNAs) on-chips with subsequent annealing in air. The one-dimensional (1D) α-Fe2O3 NRs are distributed homogenously on the surface of the 2D SnO2 nanosheets to construct novel 1D/2D HNAs. In comparison with pure SnO2 NSAs and α-Fe2O3 NRs, the α-Fe2O3/SnO2 HNAs show a dramatically enhanced response to acetone (down to sub-ppm). Moreover, the α-Fe2O3/SnO2 HNAs also possess a superior selectivity to acetone against other interfering gases (formaldehyde, toluene, benzene, and ammonia). A possible sensing mechanism based on the formation of α-Fe2O3–SnO2 n-n heterostructure is proposed.
2. Results and Discussion
2.1. Morphological Characteristics
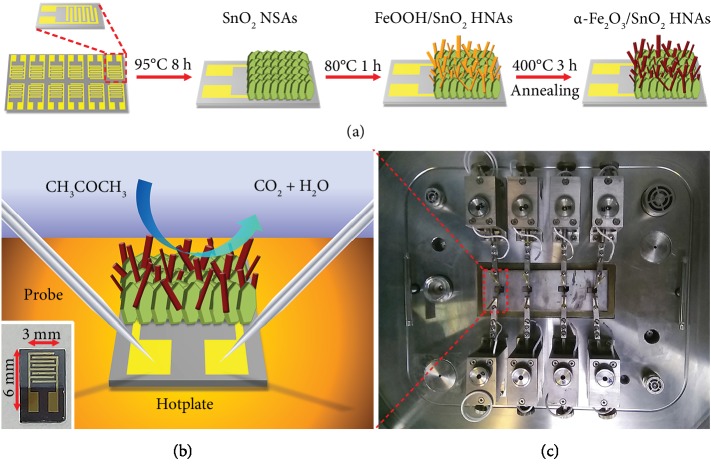
As illustrated in Figure 1(a), a chip with interdigital Au electrodes (200 μm lines separated by 200 μm gaps) was fabricated on a (100) silicon substrate with a 2 μm thermally grown SiO2 layer, and the SnO2 NSAs were prepared with an on-chip growth method similar to our previous work [34]. The chip was vertically dipped into the mixed solution (containing Sn2+ and CO(NH2)2) during this process, and then the prefabricated SnO2 NSAs were immersed in another aqueous solution (containing Fe2+ and CO(NH2)2) for depositing FeOOH NRs on SnO2 NSAs. After annealing in air, the as-prepared sensors were placed on a CGS-4TP gas sensing measurement system. A schematic of the gas sensing measurement systems used in this work is illustrated in . Figure 1(b) presents a schematic diagram of the test platform used in this work. A hotplate was used to adjust the operating temperature, and two pins of a sensor were connected with a pair of probes. A digital photograph of the gas sensing chip (3 mm × 6 mm in size) with α-Fe2O3/SnO2 HNAs is given in the inset of Figure 1(b). During the test, four sensors were measured simultaneously, as shown Figure 1(c), and the electrical resistance of each sensor was recorded.
Figure 1.
Schematic diagrams of (a) synthesis process of α-Fe2O3/SnO2 HNAs and (b) gas sensing measurement platform; the inset shows the digital photograph of the α-Fe2O3/SnO2 HNAs gas sensing chips. (c) A photograph of the test platform of CGS-4TPs.
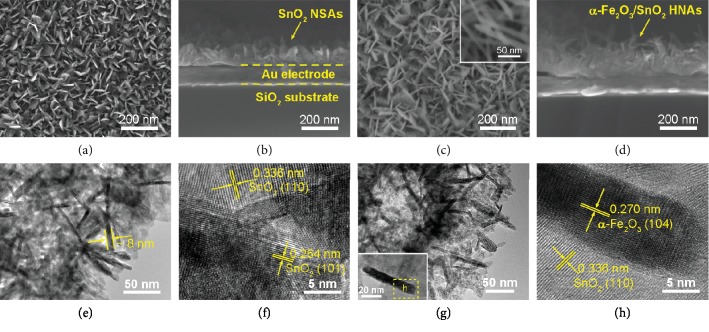
Figure 2 shows the morphologies of as-prepared pure SnO2 NSAs and α-Fe2O3/SnO2 HNAs. It can be seen from Figure 2(a) that the pure SnO2 NSAs are composed by oriented growth of nanosheets, where the adjacent SnO2 nanosheets will interconnect with each other and form a semiopen network. From the cross-sectional scanning electron microscope (SEM) images of SnO2 NSAs (Figure 2(b)), the flake-like SnO2 stands vertically on the chip with a uniform film thickness (~100 nm), and the SnO2 NSAs are robustly adhered to the substrate. After the growth of α-Fe2O3 NRs, it is obvious that the surface morphology of α-Fe2O3/SnO2 HNAs is much different from that of the pure SnO2 NSAs. As shown in Figure 2(c), numerous ultrathin α-Fe2O3 NRs are homogenously distributed among the interconnected SnO2 NSAs. A SEM close-up image of α-Fe2O3 NRs (inset Figure 2(c)) reveals that the diameter of NRs ranges from 9 nm to 20 nm, and the average diameter is about 12.7 nm. Otherwise, for the second-step (CBD method), the α-Fe2O3 NRs tend to form irregular aggregates without a substrate (). The cross-sectional SEM images of α-Fe2O3/SnO2 HNAs in Figure 2(d) further indicate that the 1D α-Fe2O3 NRs are in situ grown on the surface of 2D SnO2 nanosheets, and novel 1D/2D hybrid nanoarrays can be achieved by a facile two-step CBD method. At the same time, the average film thickness of α-Fe2O3/SnO2 HNAs increases up to 220 nm.
Figure 2.
Top view SEM images of (a) SnO2 NSAs and (c) α-Fe2O3/SnO2 HNAs. Cross-sectional SEM images of (b) SnO2 NSAs and (d) α-Fe2O3/SnO2 HNAs. The inset of (c) shows a SEM close-up image of α-Fe2O3 NRs. (e) TEM and (f) HRTEM images of the pure SnO2 NSAs. (g) TEM and (h) HRTEM images of α-Fe2O3/SnO2 HNAs. The inset of (g) shows an individual α-Fe2O3 rod grown on the surface of SnO2 nanosheet.
To get further insight into the definite morphology of pure SnO2 NSAs and α-Fe2O3/SnO2 HNAs, transmission electron microscope (TEM) images were taken from the scraped-off products. As shown in Figure 2(e), SnO2 NSAs made up of interconnecting flakes with a thickness of <10 nm are obtained. Because of the vertical direction of growth, the thickness of a SnO2 nanosheet can be easily measured in Figure 2(e) (marked by arrows, ~8 nm). These 2D nanosheets have an edge length of tens of nanometers, which agree well with the SEM observation (Figure 2(a)). A high-resolution TEM (HRTEM) image (Figure 2(f)) reveals the fringe patterns in SnO2 NSAs, and the d-spacings of 0.264 and 0.336 nm are assigned to the interplanar distances of (101) and (110) planes of rutile SnO2, respectively.
For α-Fe2O3/SnO2 HNAs, the overall TEM image (Figure 2(g)) indicates that the hybrid composites are constructed by interconnected 2D nanosheets and some disordered 1D nanorods with respect to their different structural features. The inset of Figure 2(g) shows an individual nanorod grown on the surface of the nanosheet. The diameter of the rod is around 9 nm, and the length is estimated to be 57 nm. Figure 2(h) provides the HRTEM image of the selected region from the inset of Figure 2(g) (marked by a dashed rectangle). The lattice fringes with d-spacings of 0.270 and 0.336 nm can be indexed to the (104) plane of α-Fe2O3 and (110) plane of SnO2, respectively. These results further confirm the construction of the 1D/2D hybrid nanostructure of α-Fe2O3/SnO2 HNAs.
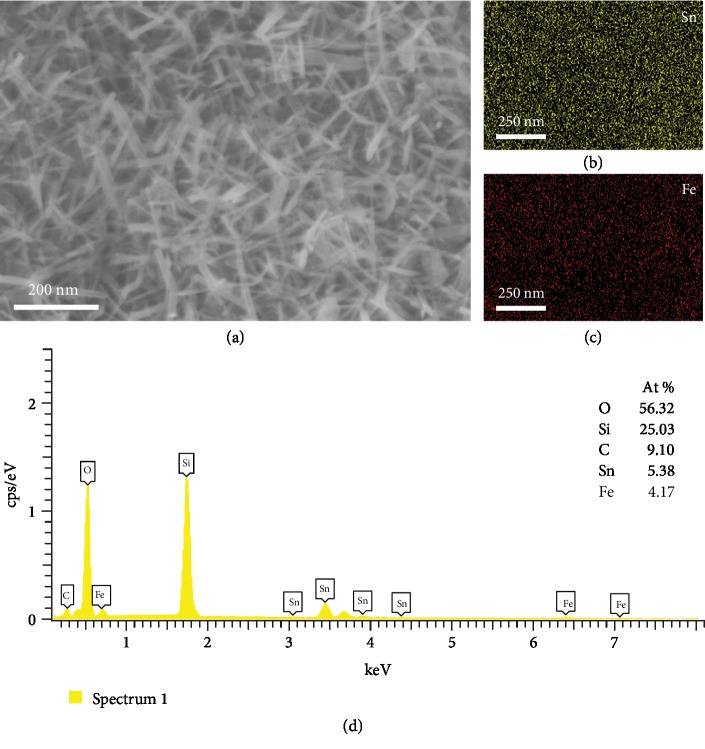
The chemical composition of the samples was identified by EDS and XPS analysis. The EDS mapping and spectrum of α-Fe2O3/SnO2 HNAs are depicted in Figures 3(a)–3(c) and 3(d), respectively. Sn (Figure 3(b)) and Fe (Figure 3(c)) elements were distributed randomly and uniformly on the substrate, which was in agreement with the fact that the hybrid composites were constructed by hybrid α-Fe2O3 and SnO2. The existence of Sn and Fe elements was confirmed by the EDS characterization, and the atomic percentages of Sn and Fe were measured to be 5.38% and 4.17%, respectively.
Figure 3.
(a) SEM image, (b–c) the corresponding EDS mapping images, and (d) EDS spectrum of α-Fe2O3/SnO2 HNAs.
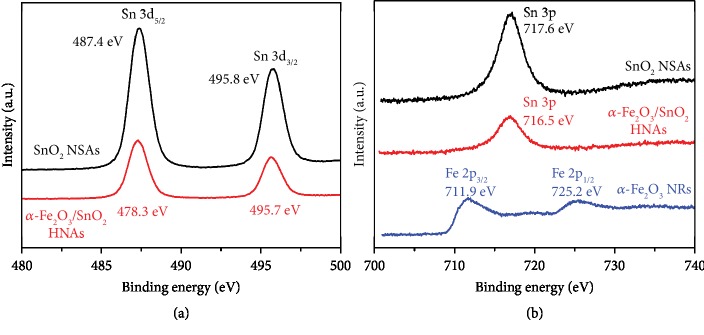
Moreover, XPS analysis was used to obtain more information about the chemical valences of our samples. Figure 4(a) displays the high-resolution Sn 3d spectra of SnO2 NSAs and α-Fe2O3/SnO2 HNAs. In the pure SnO2 NSAs, the two peaks centered at 487.4 and 495.8 eV can be ascribed to the peaks of Sn 3d5/2 and Sn 3d3/2, respectively, which are in good agreement with Sn4+. With the modification of α-Fe2O3, a slight negative shift of the binding energies is observed in α-Fe2O3/SnO2 HNAs, shifting to 487.3 and 495.7 eV, respectively, as a result of the formation of α-Fe2O3/SnO2 heterojunction interface. In the spectrum of Fe 2p in Figure 4(b), interference peaks are detected at 717.6 eV in SnO2 NSAs and 716.5 eV in α-Fe2O3/SnO2 HNAs, which come from the Sn 3p peak. The Fe 2p peaks are not found in α-Fe2O3/SnO2 HNAs due to the strong interference peak. In comparison, the two peaks at 711.9 and 725.2 eV detected in pure α-Fe2O3 NRs are attributed to Fe 2p3/2 and Fe 2p1/2, respectively, corresponding to Fe3+ in α-Fe2O3.
Figure 4.
The high-resolution XPS spectra of SnO2 NSAs, α-Fe2O3 NRs, and α-Fe2O3/SnO2 HNAs: (a) Sn 3d and (b) Fe 2p.
2.2. Gas Sensing Properties
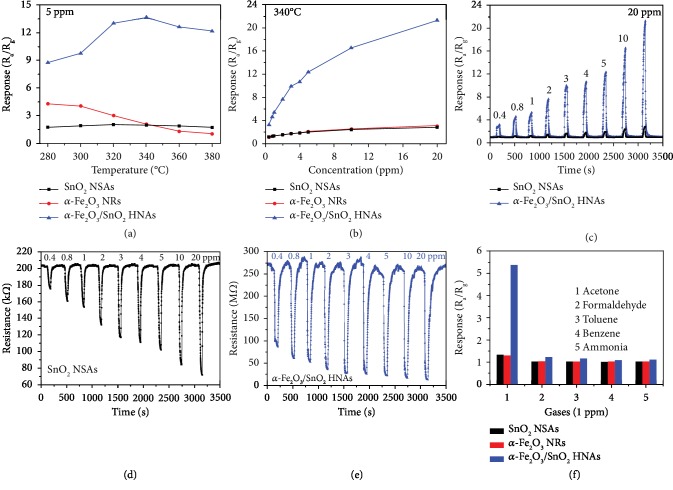
As is well-known, the gas sensing properties of MOXs are highly dependent on the operating temperature. To confirm it, the as-prepared gas sensors were examined at various temperatures (280-380°C) toward 5 ppm acetone. The sensor response is defined as Ra/Rg, where Ra and Rg are the sensor resistance in air and target gas, respectively. As shown in Figure 5(a), the response of α-Fe2O3/SnO2 HNA-based sensor increases with the increase in operating temperature and reaches its maximum value (13.63) at 340°C, then decreases with the further increase of operating temperature. Therefore, 340°C can be chosen as the optimum operating temperature of α-Fe2O3/SnO2 HNAs. Differently, the pure SnO2 NSA-based sensor exhibits no obvious variation over the whole temperature range (2.00, at 340°C). The pure α-Fe2O3 NR-based sensor shows a monotonic decrease of the response with an increase in operating temperature, and the highest response value is about 4.28 at 280°C. It is clear that the α-Fe2O3/SnO2 HNA-based sensor displays the highest response in the three sensors, revealing that the acetone sensing properties of SnO2 NSAs can be significantly enhanced by the modification of α-Fe2O3 NRs.
Figure 5.
(a) Sensor responses of the pure SnO2 NSAs, α-Fe2O3 NRs, and α-Fe2O3/SnO2 HNAs toward 5 ppm acetone as a function of operating temperature (280-380°C). (b) Sensor responses vs. acetone concentration (0.4-20 ppm) at 340°C. The corresponding transient response curves of (c) SnO2 NSAs and α-Fe2O3/SnO2 HNAs. Resistance curves of (d) SnO2 NSAs and (e) α-Fe2O3/SnO2 HNAs at 340°C. (f) Selectivity of the sensors to various gases (1 ppm) at 340°C.
Figure 5(b) gives the acetone sensing properties of the above three sensors at the same operating temperature of 340°C. It is clear that the sensor response increases with the acetone concentration ranging from 0.4 to 20 ppm for each sensor. Especially, in the case of α-Fe2O3/SnO2 HNAs, the response increases rapidly over the whole concentration range, which is rather different from the other two sensors. The response values of α-Fe2O3/SnO2 HNAs are 3.25, 4.64, 5.37, 7.68, 9.91, 10.69, 12.34, 16.55, and 21.26 toward 0.4, 0.8, 1, 2, 3, 4, 5, 10, and 20 ppm acetone, respectively. In comparison, the response values of pure SnO2 NSAs and α-Fe2O3 NRs toward acetone can be as low as 1.16 and 1.03, respectively, at a concentration of 0.4 ppm, and their values are still less than 3.1 even toward 20 ppm acetone. Therefore, the α-Fe2O3/SnO2 HNA-based sensor exhibits the highest response values toward acetone in the three sensors, indicating the improvement of sensitivity.
Figure 5(c) plots the corresponding transient response curves of the pure SnO2 NSA- and α-Fe2O3/SnO2 HNA-based sensors over an acetone concentration range of 0.4 to 20 ppm recorded at 340°C. Obviously, these response curves present a sharp increase upon acetone exposure and can recover to their original values in air. In accordance with these, the sensor resistance curves are shown in Figures 5(d) and 5(e). Amongst them, the α-Fe2O3/SnO2 HNA-based sensor exhibits a higher resistance in air (Ra, 282.683 MΩ, Figure 5(e)) than that of pure SnO2 NSAs (204.05 kΩ, Figure 5(d)) and α-Fe2O3 NRs (132.298 MΩ, ). Upon exposure to acetone gas, the sensor resistance quickly decreases as expected and then recovers to its Ra after being exposed to air. Rg decreases monotonically with the increase of acetone concentration; in other words, the sensor response increases (refer to Figure 5(c) and ).
The response and recovery times (tres and trec) are very important parameters for high-performance gas sensors. The response time tres (or recovery time trec) is defined as the time required to reach 90% resistance change when the sensor is exposed to target gas (or air). As shown in , the α-Fe2O3/SnO2 HNA-based sensor shows a faster tres (14 s, at 1 ppm) at 340°C compared with that of the SnO2 NSAs (37 s, at 1 ppm). On the contrary, the trec of the α-Fe2O3/SnO2 HNA-based sensor always exceeds one minute (62–159 s, in the range 0.4–20 ppm), which is apparently higher than that of the SnO2 NSA-based sensor (22–34 s, in the range 0.4–20 ppm). According to the previous studies, the vertically ultrathin SnO2 NSAs can provide as much surface area as possible to adsorb gas molecules and facilitate the adsorption/desorption of the acetone gas. When the α-Fe2O3 NRs were introduced, the branched α-Fe2O3 NRs on the surface of SnO2 NSAs will adsorb more acetone molecules, making the α-Fe2O3/SnO2 HNAs more sensitive and present faster response toward acetone.
To study the selectivity in the above sensors, some interfering gases (formaldehyde, toluene, benzene, and ammonia) were measured at 340°C with a low concentration of 1 ppm. It can be seen in Figure 5(f) that the α-Fe2O3/SnO2 HNA-based sensor exhibits higher responses toward all gases than those of pure SnO2 NSAs and α-Fe2O3 NRs. Especially, all the sensors obtain their highest responses toward acetone compared with other interfering gases. In the case of the α-Fe2O3/SnO2 HNA-based sensor, it shows the highest response toward acetone (5.37), then toward formaldehyde (1.23) and toluene (1.16) and is almost insensitive toward ammonia (1.11) and benzene (1.09). On the other hand, the corresponding responses of pure SnO2 NSAs toward above gases are 1.33, 1.02, 1.02, 1.02, and 1.01 in turn (for α-Fe2O3 NRs: 1.30, 1.03, 1.02, 1.03, and 1.03). These results suggest that the α-Fe2O3 NRs, indeed, have a significant impact on the selectivity of the SnO2 NSAs toward acetone.
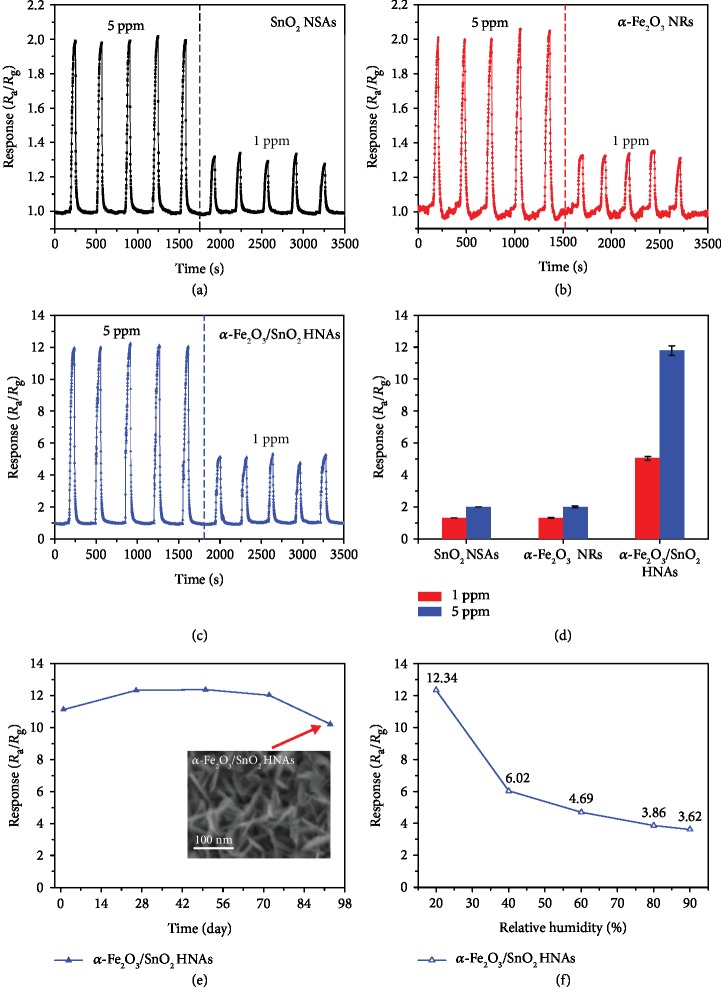
The reproducibility of the sensors at 340°C has been investigated by continuously testing the sensors to 5 ppm and 1 ppm acetone with 5 cycles for each. As shown in Figures 6(a)–6(c), all the sensors maintain their response values without obvious variation (less than 4%) during the cyclic testing, indicating excellent reproducibility of our devices. By comparison, Figure 6(d) illustrates the statistical analysis of the results of sensor responses (for SnO2 NSAs sensor: 1.32 ± 0.02 at 1 ppm and 2.00 ± 0.01 at 5 ppm; α-Fe2O3 NRs sensor: 1.33 ± 0.03 at 1 ppm and 2.02 ± 0.06 at 5 ppm; α-Fe2O3/SnO2 HNAs sensor: 5.05 ± 0.11 at 1 ppm and 11.80 ± 0.29 at 5 ppm), further demonstrating their robustness as acetone sensors.
Figure 6.
Reproducibility of (a) SnO2 NSAs, (b) α-Fe2O3 NRs, and (c) α-Fe2O3/SnO2 HNA-based sensors toward acetone (5 ppm and 1 ppm, each of 5 cycles) at 340°C; (d) is the corresponding comparison of the sensor responses. (e) Stability of α-Fe2O3/SnO2 HNA-based sensor toward 5 ppm acetone at 340°C for 93 days; the inset is the SEM image of α-Fe2O3/SnO2 HNAs taken after 93 days of gas sensing test. (f) Response of α-Fe2O3/SnO2 HNA-based sensor to 5 ppm acetone at 340°C under different relative humidity (20–90% RH).
To assess the long-term stability of our sensor, we tested the α-Fe2O3/SnO2 HNA-based sensor for 93 days toward 5 ppm acetone at 340°C. The mean response of the α-Fe2O3/SnO2 HNA-based sensor is 11.62 with a standard deviation estimated to be 0.93 during the whole period, suggesting its stability for acetone detection over a long period. Furthermore, it can be clearly seen that there is no obvious change between the nanostructures of α-Fe2O3/SnO2 HNAs before (Figure 2(c)) and after (inset of Figure 6(e)) a number of gas sensing tests. This observation is consistent with the good long-term stability of the α-Fe2O3/SnO2 HNA-based sensor.
It is well-known that human exhaled breath is highly humid (RH ≥ 80%) and the existence of water vapor has a significant influence on the gas sensing performance for MOX-based gas sensors. As shown in Figure 6(f), the response of α-Fe2O3 NRs to 5 ppm acetone was measured as a function of relative humidity (20%–90% RH). The responses of α-Fe2O3/SnO2 HNAs under 20%, 40%, 60%, 80%, and 90% RH were 12.34, 6.02, 4.69, 3.86, and 3.62, respectively. Obviously, the response of α-Fe2O3/SnO2 HNAs is highly dependent on relative humidity, and some available approaches (such as employing water filtering membranes) are needed to eliminate the influence of water vapor.
Considering the previous reports in Table 1 [11, 35–38], the α-Fe2O3/SnO2 HNA-based sensor in this work possesses relatively medium sensitivity (or operating temperature). We can conclude that the acetone sensing properties of MOXs can be further enhanced by constructing heterostructures or modifying with noble metals. As mentioned before, the acetone detection capability (or resolution) for the diagnosis of diabetes mellitus should be as low as sub-ppm, all of which need sufficient and reliable sensors for acetone. In this sense, the high sensitivity, good selectivity, and excellent reproducibility of the α-Fe2O3/SnO2 HNA-based sensor imply that it can potentially be used for breath acetone analysis.
Table 1.
Comparison of the acetone sensing properties of MOX-based sensors.
| Materials | Temperature (°C) | RH (%) | Detection range (ppm) | Response (Ra/Rg) | t res/trec (s/s) | Ref. |
|---|---|---|---|---|---|---|
| α-Fe2O3/SnO2 HNAs | 340 | 20 | 0.4–20 | 5.37@1 ppm | 14/70 | This work |
| Pt-SnO2 fibers | 300 | 80 | 0.12–3 | 3.47@3 ppm | 15/6 | 35 |
| ZnO@ZIF-CoZn nanowire arrays | 260 | 0–90 | 10–2000 | 2.3@10 ppm | 43/61 | 36 |
| PdO-Co3O4 hollow nanocages | 350 | 90 | 0.4–5 | 1.52∗@1 ppm | — | 37 |
| NiO/ZnO hollow spheres | 275 | 30 | 0.8–100 | 1.6@0.8 ppm | 1/20 | 38 |
| ZnO/CuO inverse opals | 310 | 93.5 | 0.2–50 | 1.8@1 ppm | 7/13 | 11 |
∗ R g/Ra.
2.3. Sensing Mechanism
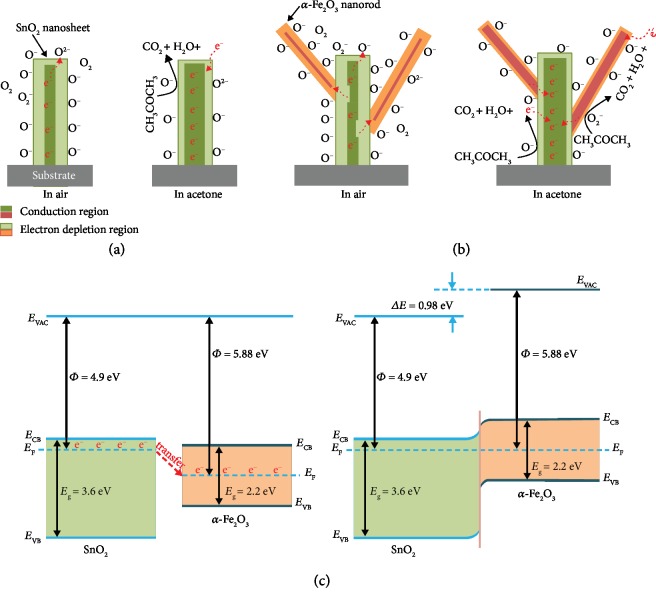
For n-type MOXs (SnO2 and α-Fe2O3), their acetone sensing mechanisms can be briefly understood as the reaction between the adsorbed oxygen species and acetone molecules on the active sites of sensitive materials. [24] In general, an electron depletion layer (EDL) can be formed on the near surface of SnO2 nanosheets (Figure 7(a)) owing to the adsorbed oxygen species (O–, O2–, and O2–) after exposing to air and makes the absorbed oxygen species capture free electrons from the conduction band of SnO2. This results in a decrease of electron concentration (or width of EDL) and thus a relatively high resistance in air atmosphere. The generation and transformation processes of the oxygen species at different operating temperatures have the following expressions [39]:
| (1) |
Figure 7.
Schematic illustration of the acetone sensing mechanism of (a) the pure SnO2 NSAs and (b) α-Fe2O3/SnO2 HNAs (not drawn to scale). (c) Energy band diagrams of α-Fe2O3/SnO2 system before and after equilibrium. EVAC: the vacuum level; EF: Fermi level; ECB: the bottom of conduction band; EVB: the top of valence band; Eg: band gap.
On the contrary, upon exposure to reducing gases such as acetone, acetone molecules will react with the absorbed oxygen species, as expressed by Equation (2) and release free electrons back to the SnO2 nanosheets. Hence, the electron concentration increase will cause an increase in conductivity (or a decrease in sensor resistance), and the width of EDL also becomes broader. According to the SEM and TEM observations, the vertically distributed SnO2 nanosheets connect with each other to construct an interlaced electron transport network on the substrate. However, the modulation mechanism of this type of transport network is not efficient because of the same energy band structure in the pure SnO2 NSAs. In other words, the Ra of the pure SnO2 NSA-based sensor is rather low (Figure 5(d)), which is too difficult to obtain dramatic change, especially at low acetone concentrations.
| (2) |
In the case of α-Fe2O3/SnO2 HNAs, the sensor exhibits enhanced sensitivity toward acetone, this may be attributed to the following reasons: (1) In the formation of α-Fe2O3–SnO2 n–n heterostructures, by combining these two MOXs with different work functions (SnO2: 𝛷 = 4.9 eV; α-Fe2O3: 𝛷 = 5.88 eV) [40, 41], the free electrons tend to transfer from the higher side to the lower side, until the equilibrium Fermi level is reached (Figure 7(c)) [26, 42]. In this process, the SnO2 nanosheet near the heterostructure interface will lose more electrons, which leads to a broader conduction region in air (Figure 7(b)) [43]. Similar to other reports, the Ra of the α-Fe2O3/SnO2 HNAs in this work is much higher than that of the pure SnO2 NSAs.
(2) In the novel 1D/2D α-Fe2O3/SnO2 hybrid architectures, when the sensor is exposed to acetone, the stretched-out α-Fe2O3 NRs provide an extra surface area and active sites for the gas adsorption. Thus, more oxygen species and acetone molecules can be adsorbed on the surface of α-Fe2O3/SnO2 HNAs (Figure 7(b)), which provides more opportunities for Equation (2). The conduction region in SnO2 nanosheets will be broadened as well as a decrease in Rg. On the other hand, the free electrons generated on the surface of α-Fe2O3 NRs will flow to SnO2 NSAs and allow a dramatic decrease in the width of the electron depletion region at the interface of the α-Fe2O3/SnO2 heterostructure. It may further result in an increase of sensor response toward acetone. So the modulation mechanism of α-Fe2O3/SnO2 HNAs becomes more efficient than that of pure SnO2 NSAs. Additionally, much hard work is still needed to study the influence of ambient humidity, filter units, and clinical tests, making it more suitable for breath acetone analysis.
3. Conclusion
The α-Fe2O3/SnO2 HNA-based acetone sensor has been fabricated via a facile two-step on-chip growth (or CBD method) process. The results indicate that the as-prepared sensor presents a well-defined 1D/2D hybrid architecture, where the ultrathin α-Fe2O3 NRs (an average diameter ~12.7 nm) are distributed among the interconnected SnO2 NSAs. Gas sensing measurements show that the α-Fe2O3/SnO2HNA-based sensor exhibits superior acetone sensing properties (high sensitivity, good reproducibility, and selectivity), even at a sub-ppm level, compared with those of the pure SnO2 NSA- and α-Fe2O3 NR-based sensors. The improved acetone sensing performance may be due to the formed α-Fe2O3–SnO2 heterostructures and their unique hybrid nanostructures. Our work suggests that the α-Fe2O3/SnO2 HNAs can be a promising candidate for sub-ppm acetone detection in breath analysis.
4. Materials and Methods
4.1. Preparation of α-Fe2O3/SnO2 HNAs
In brief, 0.6 mmol SnCl2·2H2O and 0.8 mmol CO(NH2)2 were dissolved into 20 mL deionized water and stirred for 15 min at room temperature. Then a piece of chip with several Au electrodes was washed with acetone and ethanol and deionized water for several times, which was afterwards vertically dipped into the above solution and maintained at 95°C for 8 h. After washing and drying at 60°C in an oven, the prefabricated SnO2 NSAs were immersed in an aqueous solution (containing 0.1 M FeSO4·7H2O and 1.0 M CO(NH2)2) and kept at 80°C for 1 h. Similarly, the chip was washed and dried again at 60°C. The final chip was annealed at 400°C for 3 h in air to achieve α-Fe2O3/SnO2 HNAs.
In addition, the pure SnO2 NSAs were also annealed under the same conditions. For a pure α-Fe2O3 NR-based sensor, 0.1 M FeSO4·7H2O and 1.0 M CO(NH2)2 were mixed and maintained at 80°C for 1 h, and the collected precipitate was dip-coated on the Au electrodes and then annealed at 400°C in air for 3 h.
4.2. Characterization and Gas Sensing Measurements
The morphologies and compositions of as-prepared products were investigated by a scanning electron microscope (SEM, Zeiss Gemini 300) equipped with energy dispersive X-ray (EDX) spectroscope and a high-resolution transmission electron microscope (HRTEM, FEI Tecnai G2 F30). The chemical states of the surface species were determined by using X-ray photoelectron spectroscopy (XPS, ESCALB 250Xi). The gas sensing properties of sensors were performed on a commercial CGS-4TPs system (Beijing Elite Tech Co., Ltd., China). Gaseous acetone diluted with dry air was injected by a syringe. The operating temperature ranges from 280 to 380°C with a relative humidity around 20%.
Acknowledgments
The TEM characterization was performed in the Materials Characterization and Preparation Center, Southern University of Science and Technology. This work was supported in part by the Shenzhen Science and Technology Innovation Committee under Grant JCYJ20170412154426330; the Foundation for Distinguished Young Talents in Higher Education of Guangdong, China, under Grant 2018KQNX226; and Guangdong Natural Science Funds under Grants 2016A030306042 and 2018A050506001.
Contributor Information
Changhui Zhao, Email: zhaoch@sustech.edu.cn.
Fei Wang, Email: wangf@sustech.edu.cn.
Conflicts of Interest
All authors declare that there is no competing financial interest.
Authors' Contributions
Huimin Gong, Changhui Zhao, and Fei Wang designed the experiments and contributed to the manuscript. Gaoqiang Niu and Wei Zhang carried out the material characterizations. The initial draft was edited by Changhui Zhao and Fei Wang. All authors reviewed the final version.
Supplementary Materials
Figure S1: schematic drawing of the gas sensing measurement systems. Figure S2: SEM images of pure α-Fe2O3 NRs. Figure S3: transient response curve of α-Fe2O3 NRs toward different acetone concentrations at 340°C and the corresponding resistance curve. Figure S4: response/recovery time vs. acetone concentration (0.4-20 ppm) with SnO2 NSAs and α-Fe2O3/SnO2 HNAs at 340°C. Table S1: brief summary of results reported on exhaled breath analysis. Table S2: gas sensing properties of Fe2O3–SnO2 systems toward various gases.
References
- 1.Di Natale C., Paolesse R., Martinelli E., Capuano R. Solid-state gas sensors for breath analysis: a review. Analytica Chimica Acta. 2014;824:1–17. doi: 10.1016/j.aca.2014.03.014. [DOI] [PubMed] [Google Scholar]
- 2.Schmidt K., Podmore I. Current challenges in volatile organic compounds analysis as potential biomarkers of cancer. Journal of Biomarkers. 2015;2015:16. doi: 10.1155/2015/981458.981458 [DOI] [PMC free article] [PubMed] [Google Scholar]
- 3.Arakawa T., Suzuki T., Tsujii M., et al. Real-time monitoring of skin ethanol gas by a high-sensitivity gas phase biosensor (bio-sniffer) for the non-invasive evaluation of volatile blood compounds. Biosensors and Bioelectronics. 2019;129:245–253. doi: 10.1016/j.bios.2018.09.070. [DOI] [PubMed] [Google Scholar]
- 4.Güntner A. T., Abegg S., Wegner K., Pratsinis S. E. Zeolite membranes for highly selective formaldehyde sensors. Sensors and Actuators B: Chemical. 2018;257:916–923. doi: 10.1016/j.snb.2017.11.035. [DOI] [Google Scholar]
- 5.Kim N.-H., Choi S.-J., Yang D.-J., Bae J., Park J., Kim I.-D. Highly sensitive and selective hydrogen sulfide and toluene sensors using Pd functionalized WO3 nanofibers for potential diagnosis of halitosis and lung cancer. Sensors and Actuators B: Chemical. 2014;193:574–581. doi: 10.1016/j.snb.2013.12.011. [DOI] [Google Scholar]
- 6.Chuang M.-Y., Chen C.-C., Zan H.-W., Meng H.-F., Lu C.-J. Organic gas sensor with an improved lifetime for detecting breath ammonia in hemodialysis patients. ACS Sensors. 2017;2(12):1788–1795. doi: 10.1021/acssensors.7b00564. [DOI] [PubMed] [Google Scholar]
- 7.Lee I., Choi S.-J., Park K.-M., et al. The stability, sensitivity and response transients of ZnO, SnO2 and WO3 sensors under acetone, toluene and H2S environments. Sensors and Actuators B: Chemical. 2014;197:300–307. doi: 10.1016/j.snb.2014.02.043. [DOI] [Google Scholar]
- 8.van den Broek J., Güntner A. T., Pratsinis S. E. Highly selective and rapid breath isoprene sensing enabled by activated alumina filter. ACS Sensors. 2018;3(3):677–683. doi: 10.1021/acssensors.7b00976. [DOI] [PubMed] [Google Scholar]
- 9.Marco E., Grimalt J. O. A rapid method for the chromatographic analysis of volatile organic compounds in exhaled breath of tobacco cigarette and electronic cigarette smokers. Journal of Chromatography A. 2015;1410:51–59. doi: 10.1016/j.chroma.2015.07.094. [DOI] [PubMed] [Google Scholar]
- 10.Olopade C. O., Zakkar M., Swedler W. I., Rubinstein I. Exhaled pentane levels in acute asthma. Chest. 1997;111(4):862–865. doi: 10.1378/chest.111.4.862. [DOI] [PubMed] [Google Scholar]
- 11.Xie Y., Xing R., Li Q., Xu L., Song H. Three-dimensional ordered ZnO–CuO inverse opals toward low concentration acetone detection for exhaled breath sensing. Sensors and Actuators B: Chemical. 2015;211:255–262. doi: 10.1016/j.snb.2015.01.086. [DOI] [Google Scholar]
- 12.Liang S., Li J., Wang F., Qin J., Lai X., Jiang X. Highly sensitive acetone gas sensor based on ultrafine α-Fe2O3 nanoparticles. Sensors and Actuators B: Chemical. 2017;238:923–927. doi: 10.1016/j.snb.2016.06.144. [DOI] [Google Scholar]
- 13.Li X., Lu D., Shao C., Lu G., Li X., Liu Y. Hollow CuFe2O4/α-Fe2O3 composite with ultrathin porous shell for acetone detection at ppb levels. Sensors and Actuators B: Chemical. 2018;258:436–446. doi: 10.1016/j.snb.2017.11.131. [DOI] [Google Scholar]
- 14.Dai M., Zhao L., Gao H., et al. Hierarchical assembly of α-Fe2O3 nanorods on multiwall carbon nanotubes as a high-performance sensing material for gas sensors. ACS Applied Materials & Interfaces. 2017;9(10):8919–8928. doi: 10.1021/acsami.7b00805. [DOI] [PubMed] [Google Scholar]
- 15.Wei K., Zhao S., Zhang W., et al. Controllable synthesis of Zn-doped α-Fe2O3 nanowires for H2S sensing. Nanomaterials. 2019;9(7):p. 994. doi: 10.3390/nano9070994. [DOI] [PMC free article] [PubMed] [Google Scholar]
- 16.Yamazoe N. New approaches for improving semiconductor gas sensors. Sensors and Actuators B: Chemical. 1991;5(1-4):7–19. doi: 10.1016/0925-4005(91)80213-4. [DOI] [Google Scholar]
- 17.Miller D. R., Akbar S. A., Morris P. A. Nanoscale metal oxide-based heterojunctions for gas sensing: a review. Sensors and Actuators B: Chemical. 2014;204:250–272. doi: 10.1016/j.snb.2014.07.074. [DOI] [Google Scholar]
- 18.Lee J.-H. Gas sensors using hierarchical and hollow oxide nanostructures: overview. Sensors and Actuators B: Chemical. 2009;140(1):319–336. doi: 10.1016/j.snb.2009.04.026. [DOI] [Google Scholar]
- 19.Li X., Wang C., Guo H., et al. Double-shell architectures of ZnFe2O4 nanosheets on ZnO hollow spheres for high-performance gas sensors. ACS Applied Materials & Interfaces. 2015;7(32):17811–17818. doi: 10.1021/acsami.5b04118. [DOI] [PubMed] [Google Scholar]
- 20.Niu G., Zhao C., Gong H., Yang Z., Leng X., Wang F. NiO nanoparticle-decorated SnO2 nanosheets for ethanol sensing with enhanced moisture resistance. Microsystems & Nanoengineering. 2019;5(1, article 21) doi: 10.1038/s41378-019-0060-7. [DOI] [PMC free article] [PubMed] [Google Scholar]
- 21.Lu P., Zhou W., Li Y., Wang J., Wu P. CuO nanosheets/ZnO nanorods synthesized by a template-free hydrothermal approach and their optical and magnetic characteristics. Ceramics International. 2017;43(13):9798–9805. doi: 10.1016/j.ceramint.2017.04.159. [DOI] [Google Scholar]
- 22.Park S., Cai Z., Lee J., Yoon J. I., Chang S.-P. Fabrication of a low-concentration H2S gas sensor using CuO nanorods decorated with Fe2O3 nanoparticles. Materials Letters. 2016;181:231–235. doi: 10.1016/j.matlet.2016.06.043. [DOI] [Google Scholar]
- 23.Sun P., Cai Y., Du S., et al. Hierarchical α-Fe2O3/SnO2 semiconductor composites: hydrothermal synthesis and gas sensing properties. Sensors and Actuators B: Chemical. 2013;182:336–343. doi: 10.1016/j.snb.2013.03.019. [DOI] [Google Scholar]
- 24.Yu Q., Zhu J., Xu Z., Huang X. Facile synthesis of α-Fe2O3@SnO2 core–shell heterostructure nanotubes for high performance gas sensors. Sensors and Actuators B: Chemical. 2015;213:27–34. doi: 10.1016/j.snb.2015.01.130. [DOI] [Google Scholar]
- 25.Sun P., Wang C., Liu J., et al. Hierarchical assembly of α-Fe2O3 nanosheets on SnO2 Hollow nanospheres with enhanced ethanol sensing properties. ACS Applied Materials & Interfaces. 2015;7(34):19119–19125. doi: 10.1021/acsami.5b04751. [DOI] [PubMed] [Google Scholar]
- 26.Yan S., Xue J., Wu Q. Synchronous synthesis and sensing performance of α-Fe2O3/SnO2 nanofiber heterostructures for conductometric C2H5OH detection. Sensors and Actuators B: Chemical. 2018;275:322–331. doi: 10.1016/j.snb.2018.07.079. [DOI] [Google Scholar]
- 27.Chen Y.-J., Zhu C.-L., Wang L.-J., Gao P., Cao M.-S., Shi X.-L. Synthesis and enhanced ethanol sensing characteristics of α-Fe2O3/SnO2 core–shell nanorods. Nanotechnology. 2008;20(4, article 045502) doi: 10.1088/0957-4484/20/4/045502. [DOI] [PubMed] [Google Scholar]
- 28.Zhao C., Hu W., Zhang Z., Zhou J., Pan X., Xie E. Effects of SnO2 additives on nanostructure and gas-sensing properties of α-Fe2O3 nanotubes. Sensors and Actuators B: Chemical. 2014;195:486–493. doi: 10.1016/j.snb.2014.01.084. [DOI] [Google Scholar]
- 29.Choi K. S., Park S., Chang S.-P. Enhanced ethanol sensing properties based on SnO2 nanowires coated with Fe2O3 nanoparticles. Sensors and Actuators B: Chemical. 2017;238:871–879. doi: 10.1016/j.snb.2016.07.146. [DOI] [Google Scholar]
- 30.Sun P., Zhou X., Wang C., Shimanoe K., Lu G., Yamazoe N. Hollow SnO2/α-Fe2O3 spheres with a double-shell structure for gas sensors. Journal of Materials Chemistry A. 2014;2(5):1302–1308. doi: 10.1039/C3TA13707D. [DOI] [Google Scholar]
- 31.Shan H., Liu C., Liu L., et al. Excellent toluene sensing properties of SnO2–Fe2O3 interconnected nanotubes. ACS Applied Materials & Interfaces. 2013;5(13):6376–6380. doi: 10.1021/am4015082. [DOI] [PubMed] [Google Scholar]
- 32.Patil L. A., Shinde M. D., Bari A. R., Deo V. V., Patil D. M., Kaushik M. P. Fe2O3 modified thick films of nanostructured SnO2 powder consisting of hollow microspheres synthesized from pyrolysis of ultrasonically atomized aerosol for LPG sensing. Sensors and Actuators B: Chemical. 2011;155(1):174–182. doi: 10.1016/j.snb.2010.11.043. [DOI] [Google Scholar]
- 33.Vuong D. D., Trung K. Q., Hung N. H., Hieu N. V., Chien N. D. Facile preparation of large-scale α-Fe2O3 nanorod/SnO2 nanorod composites and their LPG-sensing properties. Journal of Alloys and Compounds. 2014;599:195–201. doi: 10.1016/j.jallcom.2014.02.089. [DOI] [Google Scholar]
- 34.Gong H., Zhao C., Wang F. On-chip growth of SnO2/ZnO core–shell nanosheet arrays for ethanol detection. IEEE Electron Device Letters. 2018;39(7):1065–1068. doi: 10.1109/LED.2018.2832644. [DOI] [Google Scholar]
- 35.Shin J., Choi S.-J., Lee I., et al. Thin-wall assembled SnO2 fibers functionalized by catalytic Pt nanoparticles and their superior exhaled-breath-sensing properties for the diagnosis of diabetes. Advanced Functional Materials. 2013;23(19):2357–2367. doi: 10.1002/adfm.201202729. [DOI] [Google Scholar]
- 36.Yao M.-S., Tang W.-X., Wang G.-E., Nath B., Xu G. MOF thin film-coated metal oxide nanowire array: significantly improved chemiresistor sensor performance. Advanced Materials. 2016;28(26):5229–5234. doi: 10.1002/adma.201506457. [DOI] [PubMed] [Google Scholar]
- 37.Koo W.-T., Yu S., Choi S.-J., Jang J. S., Cheong J. Y., Kim I. D. Nanoscale PdO catalyst functionalized Co3O4 hollow nanocages using MOF templates for selective detection of acetone molecules in exhaled breath. ACS Applied Materials & Interfaces. 2017;9(9):8201–8210. doi: 10.1021/acsami.7b01284. [DOI] [PubMed] [Google Scholar]
- 38.Liu C., Zhao L., Wang B., et al. Acetone gas sensor based on NiO/ZnO hollow spheres: fast response and recovery, and low (ppb) detection limit. Journal of Colloid and Interface Science. 2017;495:207–215. doi: 10.1016/j.jcis.2017.01.106. [DOI] [PubMed] [Google Scholar]
- 39.Barsan N., Weimar U. Conduction model of metal oxide gas sensors. Journal of Electroceramics. 2001;7(3):143–167. doi: 10.1023/A:1014405811371. [DOI] [Google Scholar]
- 40.Li F., Gao X., Wang R., Zhang T., Lu G. Study on TiO2-SnO2 core-shell heterostructure nanofibers with different work function and its application in gas sensor. Sensors and Actuators B: Chemical. 2017;248:812–819. doi: 10.1016/j.snb.2016.12.009. [DOI] [Google Scholar]
- 41.Xu H., Li W., Han R., et al. Enhanced triethylamine sensing properties by fabricating Au@ SnO2/α-Fe2O3 core-shell nanoneedles directly on alumina tubes. Sensors and Actuators B: Chemical. 2018;262:70–78. doi: 10.1016/j.snb.2018.01.209. [DOI] [Google Scholar]
- 42.Wang B., Fu X., Liu F., Shi S. L., Cheng J. P., Zhang X. B. Fabrication and gas sensing properties of hollow core–shell SnO2/α-Fe2O3 heterogeneous structures. Journal of Alloys and Compounds. 2014;587:82–89. doi: 10.1016/j.jallcom.2013.10.176. [DOI] [Google Scholar]
- 43.Zhang B., Fu W., Meng X., Ruan A., Su P., Yang H. Enhanced ethanol sensing properties based on spherical-coral-like SnO2 nanorods decorated with α-Fe2O3 nanocrystallites. Sensors and Actuators B: Chemical. 2018;261:505–514. doi: 10.1016/j.snb.2018.01.133. [DOI] [Google Scholar]
Associated Data
This section collects any data citations, data availability statements, or supplementary materials included in this article.
Supplementary Materials
Figure S1: schematic drawing of the gas sensing measurement systems. Figure S2: SEM images of pure α-Fe2O3 NRs. Figure S3: transient response curve of α-Fe2O3 NRs toward different acetone concentrations at 340°C and the corresponding resistance curve. Figure S4: response/recovery time vs. acetone concentration (0.4-20 ppm) with SnO2 NSAs and α-Fe2O3/SnO2 HNAs at 340°C. Table S1: brief summary of results reported on exhaled breath analysis. Table S2: gas sensing properties of Fe2O3–SnO2 systems toward various gases.


