

Abstract
Background
There is an unmet need for antithrombotic treatments for venous thromboembolic disease that do not increase bleeding risk. Selectins are cell adhesion molecules that augment thrombosis by activating immune cells to initiate the coagulation cascade. GMI‐1271, a potent small‐molecule E‐selectin antagonist, has been shown in mouse models to decrease thrombus burden with a low risk of bleeding.
Methods
A first‐in‐human study of GMI‐1271 was conducted to assess its safety, tolerability, and pharmacokinetic (PK) profile. As a secondary end point, biomarkers of coagulation, cell adhesion, and leukocyte/platelet activation were evaluated. Aims 1 and 2 were performed in healthy volunteers and evaluated single and multiple doses of the study drug, respectively. Aim 3 included 2 patients with isolated calf‐level deep vein thrombosis (DVT).
Results
GMI‐1271 showed consistent PK parameters for doses ranging from 2 to 40 mg/kg. Plasma levels increased in a linear manner with respect to dose, while clearance, volume of distribution, and half‐life were not dose dependent. No accumulation was seen with multiple consecutive doses. No serious adverse events (grade 3 or 4) were reported. Biomarker analysis demonstrated a trend in reduction of soluble E‐selectin (sEsel) levels with GMI‐1271 exposure, while exposure did not impact laboratory testing of coagulation. Two patients with calf vein DVT were treated with GMI‐1271 and demonstrated rapid improvement of symptoms after 48 hours, with repeat ultrasound showing signs of clot resolution.
Conclusions
We demonstrate that GMI‐1271 is safe in healthy volunteers and provide proof of concept that an E‐selectin antagonist is a potential therapeutic approach to treat venous thrombosis.
Keywords: biomarkers, deep vein thrombosis, E‐selectin, therapeutics, venous thromboembolism
Essentials.
There is a current unmet need for antithrombotic treatment that does not increase bleeding potential.
Selectins, such as E‐selectin, are shown to augment thrombosis by interacting with immune cells.
As a first‐in‐human proof‐of‐concept study, E‐selectin inhibition with GMI‐1271 is safe in healthy volunteers and appears safe and effective for treatment of acute calf DVT in 2 patients.
GMI‐1271 showed consistent pharmacokinetic parameters without impacting key clinical measures of bleeding risk.
Future trials using selectin inhibition as a therapeutic option for venous thromboembolism are warranted.
1. INTRODUCTION
Over 200 000 new cases of venous thromboembolism (VTE) occur each year in the United States, which negatively impacts survival.1, 2 Treatment and prophylaxis of VTE commonly includes the use of low‐molecular‐weight heparin (LMWH) and direct oral anticoagulants (DOACs).3 All currently approved VTE treatment agents and several in development carry the risk of significant bleeding complications, as they all target various aspects of the coagulation cascade. When treating venous thrombosis, the incidence of major bleeding at 3 months using unfractionated heparin or enoxaparin is approximately 4.3% and 2.9%, respectively.4 The rate of major bleeding using warfarin for the treatment of VTE is also approximately 2% during the initial 3 months of anticoagulation.5 Apixaban and rivaroxaban (commonly used DOACs in the United States for the treatment of VTE) have a 3‐month major bleeding incidence of approximately 0.5%6 and 0.8% (during treatment follow‐up period),7 respectively. There is an unmet need for antithrombotic treatment that does not increase bleeding potential. We propose that one such potential therapeutic target is E‐selectin inhibition.
In recent years, the interrelation between inflammation and thrombosis has been further delineated.8 Activated venous endothelium generates signals that lead to leukocyte movement, adhesion, and activation. Leukocytes activate platelets and amplify thrombosis through the formation of neutrophil extracellular traps, interactions with red blood cells, and other procoagulant molecules.9 E‐selectin is a glycoprotein expressed on activated endothelium that facilitates thrombosis, directly modulating neutrophil and monocyte activity. Furthermore, E‐selectin has been identified as an important regulator of thrombus formation and fibrin content in a mouse venous thrombosis model.10, 11 Previous studies from our laboratory have shown that P/E‐selectin double‐knockout mice had less thrombus burden and less inflammation when thrombosis was induced,10 and E‐selectin knockout mice had decreased fibrin content of the thrombus and less vein wall inflammation and fibrosis.12, 13
GMI‐1271 (GlycoMimetics, Inc, Gaithersburg, MD, USA) is a potent small‐molecule E‐selectin antagonist. Preclinical mouse studies showed that inhibition of E‐selectin with GMI‐1271 significantly decreased venous thrombus weight and promoted vein recanalization with a lower risk of bleeding when compared to LMWH.14, 15
Here, we report the results from 2 clinical studies of GMI‐1271 that assessed its safety, tolerability, and pharmacokinetics. As a secondary end point, we also evaluated biomarkers of coagulation, cell adhesion, and leukocyte/platelet activation. The first was a phase 1 study performed in healthy volunteers, and the second was a phase 1/2 proof‐of‐concept study to evaluate GMI‐1271’s therapeutic impact on deep vein thrombosis (DVT). Given the current clinical equipoise regarding the need for therapeutic anticoagulation vs. observation with serial imaging in patients with calf‐level DVT,16, 17 patients with acute calf DVT were chosen as the study population to evaluate proof of principle of GMI‐1271’s therapeutic impact on DVT.
2. METHODS
These studies were single‐center, first‐in‐human investigations with 3 aims. Aims 1 and 2 were performed as part of the clinical trial entitled “A Randomized, Placebo Controlled Phase I Study to Assess the Safety and Pharmacokinetics of GMI‐1271 in Healthy Adult Subjects,” and Aim 3 was conducted as part of “A Randomized Phase I/II Study to Assess the Safety, Tolerability, and Efficacy of GMI‐1271 in Patients With Calf‐Level Deep‐Venous Thrombosis (DVT)” (NCT02168595 and NCT02744833, respectively).
Aim 1 was a single‐ascending‐dose study of GMI‐1271 in healthy subjects; Aim 2 was a multiple‐ascending‐dose study in healthy subjects; and Aim 3 evaluated GMI 1271 in multiple consecutive doses in patients with acute calf‐level DVT, in which we also sought to evaluate the effects of GMI‐1271 on thrombus resolution or stabilization as measured by serial Doppler ultrasound.
2.1. Patient eligibility
2.1.1. Aims 1 and 2
Eligible subjects were healthy male or female volunteers, 18 to 75 years old, body mass index (BMI) between 18 and 35 kg/m2, and no evidence of lower extremity DVT on baseline ultrasound. See Appendix S1 for additional inclusion and exclusion criteria.
2.1.2. Aim 3
Eligible patients were adults, 18 to 75 years old, with acute isolated calf vein thrombosis with or without calf muscular vein thrombosis. Patients were consented with intent to treat within 78 hours of DVT diagnosis and prior to anticoagulation. Patients on systemic anticoagulation were excluded. See Appendix S1 for additional inclusion and exclusion criteria.
All subjects signed an approved institutional review board (number for Aims 1 and 2, HUM00085767; Aim 3, HUM00112438) written informed consent prior to undergoing study‐related procedures. The GMI‐1271 and saline placebo treatment assignments were blinded as appropriate as per clinical protocol and analyzed by the principal investigators, coinvestigators, and GlycoMimetics Inc. All authors had access to the primary clinical trial data.
2.2. Study design and treatments
The predicted therapeutic range of GMI‐1271 was from 2 to 40 mg/kg, and dosing was chosen based on preclinical models and study results. Aim 1 subjects were enrolled in cohorts of 6 randomized 4:1:1 to receive GMI‐1271, normal saline (placebo), or enoxaparin, respectively. The ascending dose of GMI‐1271 for each cohort was 2, 5, 20, and 40 mg/kg intravenously (i.v.). In Aim 1, enoxaparin dosing for each cohort was 1 mg/kg subcutaneous (s.c.) injection. Aim 2 subjects were enrolled in cohorts of 4 randomized 3:1 to receive 5 consecutive days of either GMI‐1271 or enoxaparin, respectively. In Aim 2, dose of GMI‐1271 was 10 mg/kg or 20 mg/kg i.v. on days 1 through 5. Enoxaparin dosing was 1 mg/kg s.c. on days 1 through 5. Aim 1 and 2 subjects were followed for 14 days following drug administration. Dose‐limiting toxicities were defined as any grade 3 or higher adverse event related to GMI‐1271 or if 2 subjects in a cohort had any grade 2 toxicity reported as related to GMI‐1271. If no more than 1 serious adverse event (SAE) was seen, then the dose of GMI‐1271 was escalated after formal data review. The descriptions and grading scales can be found in the National Cancer Institute Common Terminology Criteria for Adverse Events version 4.03.
After review of safety data after each dose level from Aims 1 and 2, Aim 3 patients were randomized to receive either GMI‐1271 20 mg/kg i.v. daily × 5 days or enoxaparin 1.5 mg/kg/ s.c. daily × 5 days. Aim 3 compared GMI‐1271 with a standard therapeutic dose of enoxaparin, since patients had an acute thrombus. Patients were followed for 14 days following completion of drug administration. Repeat ultrasound was performed on days 8 and 19 to evaluate for thrombus resolution, stabilization, or propagation as per clinical guidelines (ultrasound examinations after weeks 1 and 2, or sooner if there is clinical concern).17 Maximum calf circumference was measured on treatment and follow‐up visits and if the circumference increased by 2 cm and/or the patient had worsening symptoms, then a same‐day Doppler ultrasound was performed.
For Aims 1, 2, and 3, randomizations were performed by the University of Michigan biostatistician and provided to the University of Michigan Investigation Drug Service. All investigators and study personnel were blinded to the assignment of patients enrolled in the GMI‐1271 and placebo groups.
2.3. Pharmacokinetic studies
Blood samples were obtained for PK analysis at the following time points:
Aim 1: prior to drug administration and at 10, 20, 25, 40, and 60 minutes and 1.5, 2, 3, 4, 5, 6, 8, 24, and 48 hours after drug administration. Aim 2: prior to drug administration on days 1 through 5, then at 10, 20, 45, and 60 minutes, 1.5, 2, 4, 6, and 8 hours after drug administration on days 1 and 5. Aim 3: No PK studies were drawn. Plasma concentrations of GMI‐1271 were measured using a validated liquid chromatography–tandem mass spectrometry method by Pyxant Laboratories (Colorado Springs, CO). All PK studies were performed by GlycoMimetics, Inc. Urine samples were obtained for PK analysis during Aims 1 and 2 and collected prior to drug administration and through 8 hours after drug administration on day 1.
2.4. Biomarker studies
To evaluate the biologic target of inhibiting cell adhesion and leukocyte activation, several biomarkers were analyzed. Whole blood was drawn and centrifuged based on company protocols. Plasma was drawn off, aliquoted, snap frozen, and stored at −80°C. One tube stored for ELISAs, one saved as backup, and one was sent to GlycoMimetics, Inc for PK analysis. Biomarkers analyzed by ELISA for protein determination included C‐reactive protein (CRP; US Biological, Salem, MA, USA); D‐dimer (Hyphen Biomed Neuville‐Sur‐oise, France); thrombin‐antithrombin complex (Abcam, Cambridge, MA); soluble E‐selectin (sEsel) and myeloperoxidase (MPO; Ebiosciences, now Thermo Fisher Scientific, Waltham, MA, USA); von Willebrand factor (VWF; Corgenix, Broomfield, CO, USA); prothrombin fragment F1.2 and soluble CD40 ligand (My Biosource, San Diego, CA, USA); and interleukin‐10, soluble ICAM‐1, soluble tissue factor, tumor necrosis factor‐α (TNFα), and soluble P‐selectin (sPsel; RndSystems, Minneapolis, MN). ELISA assays were performed using centrifuged citrated blood according to protocol. Circulating DNA is a whole blood assay performed on citrated blood collection run through a QIAmp spin column (Qiagen, German Town, MA, USA). The QIAmp column was used specifically to extract DNA from whole blood to allow for quantification without other interfering proteins or molecules. DNA was stained with a dye from the Quant iT Picogreen kit (Invitrogen, now Thermo Fisher Scientific, Waltham, MA, USA) and compared to dsDNA standard to determine concentration. Flow cytometry was used for phorbol 12‐myristate 13‐acetate (PMA), macrophage‐1 (MAC‐1), lymphocyte function–associated antigen 1 (LFA‐1), and CD44. Flow cytometry assays were performed on formalin fixed whole blood drawn in sodium citrate tubes. To the split whole blood tubes, single antibodies were added for PMAs, MAC‐1, LFA, and CD44 (BD Biosciences, San Jose, CA, USA) for staining and samples were fixed with BD FACS Lysis solution containing formalin. Fixed blood was stored at 4°C and run on a flow cytometer (MoFlo Astrios Sorter, Beckman Coulter Life Sciences, Brea, CA, USA) within 2 day of collection as per the manufacture protocol and to allow flexibility in the coordination and timing of patient sample collection.
Coagulation studies included prothrombin time (PT), international normalized ratio (INR), activated partial thromboplastin time (APTT), bleeding time, and thromboelastography (TEG), as there are some data supporting that TEG parameters predict bleeding.18 Bleeding time was performed at bedside by 1 of 2 trained research assistants. A Surgicutt device was used to make a uniform incision in the forearm while the arm was in a cuff inflated to 40 mm Hg. Time to bleeding cessation was measured in seconds. TEG was performed on citrated whole blood; 1 mL of citrated whole blood was mixed with kaolin and CaCl2, then loaded into the TEG 5000 machine (Haemonetics Corporation, Braintree, MA, USA). Within 90 minutes, a graph was generated from the formation of clot in the sample. Parameters measured included reaction time, clot formation time, angle of fibrin buildup, lysis of clot, and maximum amplitude. TEG testing was run within 1 hour of collection.
In Aim 1, biomarker values were measured at baseline, 8 and 24 hours after dosing. In Aim 2, biomarkers were measured at baseline and day 4. In the patients with calf vein thrombosis (Aim 3), biomarkers were drawn before dosing, 1 hour after dosing, and on day 4.
2.5. Venous Doppler studies
In Aims 1 and 2, color compression duplex ultrasounds were performed at baseline to ensure no DVT was present. In Aim 3, a color compression duplex ultrasound was performed as standard of care. To rule out symptomatic DVT progression, maximum calf circumference was measured on treatment and follow‐up visits, and if the circumference increased by 2 cm and/or the patient had worsening symptoms, then a same‐day compression ultrasound was performed by a trained sonographer. Repeat ultrasound was performed on days 8 and 19 as per clinical guidelines, which recommend follow‐up ultrasound examinations after week 1 or 2, or sooner if there is clinical concern. Ultrasound examinations were performed by the University of Michigan Diagnostic Vascular Unit by a trained technician in a blinded fashion assessing all venous segments of the lower extremity including the calf bilaterally. Thrombosis was determined by both venous compressibility, flow patterns, and echogenicity. All examinations were reviewed by the principal investigators.
2.6. Statistical methods
In Aim 1, a total of 24 subjects were accrued to the study with the initial sample size ranging from 11 to 44 subjects depending on tolerance or SAEs. Similarly, in Aim 2, a total of 8 subjects were accrued to the study. This sample size was chosen to provide typical numbers of subjects for phase 1 studies evaluating safety and PK in a single ascending dose and to provide small numbers to compare the drug to placebo and an active control. The sample size was not based on statistical power consideration.
The primary end points of the study were safety and tolerability. Descriptive statistics were calculated for quantitative safety data as well as change from baseline, when appropriate. Frequency counts were compiled for classification of qualitative safety data. Biomarker analysis was evaluated for trends at the collected time points and compared using unpaired nonparametric Mann‐Whitney test and Kruskal‐Wallis test by ranks for comparing ≥2 independent samples of equal or different sample sizes. For Aim 1, doses of GMI‐1271 were combined together for statistical analysis (“Aim 1 Pooled GMI‐1271 Cohorts”). Data for Appendix S1, Tables B, C, and D, had the mean, standard deviation, median, and IQRs reported from the set of observed numerical data. For Aim 2, enoxaparin values listed represent mean values of subjects treated in both cohorts. Multiple comparison analysis of biomarker data to decrease the false discovery rate and type 1 errors were performed using the Benjamini and Hochberg procedure. For Aim 2, enoxaparin values listed represent mean values of subjects treated in both cohorts. Statistical consultation was provided by the Center for Statistical Consultation and Research, University of Michigan. The statistical program used for the data in this study was GraphPad Prism 8.1.2 (GraphPad Software, Inc, La Jolla, CA, USA), with unpaired nonparametric Mann‐Whitney U test for direct comparisons and nonmatching nonparametric Kruskal‐Wallis test were used for group comparisons over time. Outlier evaluations were made using a Grubbs test. All tests had statistical significance was set at a P value of < .05. Levels of biomarkers observed for subjects treated with GMI‐1271 were compared with simple statistics to subjects treated with enoxaparin or placebo, as the study was not powered for this end point.
3. RESULTS
3.1. Subject characteristics
3.1.1. Aim 1
From November 2014 to November 2015, 50 subjects were screened for study. A total of 24 subjects met criteria and were enrolled into one of the dosing cohorts and randomized per study protocol. Reasons for ineligibility included abnormal laboratory findings, current medical issues, BMI > 35 kg/m2, and inability to return for study visits.
3.1.2. Aim 2
From November 2015 to February 2016, sixteen subjects were screened for study. Eight subjects met criteria and were enrolled into one of the 2 dosing cohorts.
3.1.3. Aim 3
From August 2016 through November 2016, over 1500 ultrasounds were reviewed and 258 (17.2%) acute and chronic lower extremity DVTs were identified, of which 40 had an acute distal calf vein DVT. Of these possible subjects, 30 did not meet eligibility criteria, 3 declined participation, 1 was a screen fail, and 4 were diagnosed at off‐site facilities where study procedures could not be obtained. Two subjects with calf vein thrombosis were enrolled and randomized per study protocol. Unfortunately, due to the accrual process and the National Institutes of Health contract mechanism that funded this study, only 2 patients were enrolled prior to the end of the funding contract.
Patient 1 was a 36‐year‐old man with no personal VTE history who sustained a closed left trimalleolar fracture occurring after a fall and treated with an immobilizing boot. Six days after the fall, he presented to the orthopedic clinic with worsening left leg swelling. Duplex ultrasound revealed that both left paired peroneal veins and one posterior tibial vein were occluded. He was enrolled and randomized to receive GMI‐1271. He reported improved pain and swelling after 48 hours of treatment and over the 19 days of follow‐up, the thrombosed posterior tibial vein remained occluded, but the length of occlusion decreased from 6 cm to 4.13 cm and 1 peroneal vein reopened (Figure 1).
Figure 1.

Patient 1: serial ultrasound results. (A) Baseline longitudinal ultrasound showing the thrombosed posterior tibial vein (arrow). Note the color flow showing the patent paired posterior tibial vein in blue. (B) Day 8 longitudinal ultrasound again demonstrating the thrombosed posterior tibial vein (arrow). Note the color showing the patent paired posterior tibial vein in blue. (C) Day 19 longitudinal ultrasound again demonstrating the thrombosed posterior tibial vein (arrow). Note the color showing the patent paired posterior tibial vein in blue. (D) Baseline longitudinal ultrasound showing the thrombosed paired peroneal veins (arrows). (E) Day 8 longitudinal ultrasound now showing 1 peroneal vein now open (arrow). The open posterior tibial vein is also seen (*), along with the thrombosed posterior tibial vein (+). (F) Day 19 longitudinal ultrasound showing now both peroneal veins open in the proximal calf (white arrows). Patient 2: serial ultrasound results. (A) Baseline transverse ultrasound showing thrombosis of one of the 2 paired posterior tibial veins, without (WO) compression and with (W) compression. Arrows demonstrate the thrombus. (B) Day 8 longitudinal ultrasound showing the thrombosed PT vein (arrow). Note the color flow showing the patent paired posterior tibial vein in blue. (C) Day 19 longitudinal ultrasound now showing that both posterior tibial veins are patent. Note the reopened posterior tibial vein (arrow) and the second patent posterior tibial vein in blue
Patient 2 was a 55‐year‐old man with no personal VTE history who developed persistent left posterior calf pain over a 2‐week duration following a long car ride. Duplex ultrasound revealed total occlusion of one of the paired posterior tibial veins. He was enrolled and randomized to receive GMI‐1271. He reported improvement of pain and swelling after 48 hours of treatment and over the 19 days, his posterior tibial vein completely recanalized (Figure 1).
General subject characteristics at baseline are detailed in Appendix S1, Table S1.
3.2. Safety analysis
All subjects in Aims 1 and 2 completed safety visits and no clinically significant findings in laboratory analysis, vital signs, ECGs or physical exams were observed. GMI‐1271 administration did not result in any changes in bleeding time or coagulation parameters (PT/INR, aPTT) or result in any moderate or serious adverse events related to study drug. Appendix S1, Table S2 depicts the adverse events reported in Aims 1 and 2.
In addition, no clinically significant findings in laboratory analysis, vital signs, electrocardiograms (ECGs), or physical exam were observed in the 2 patients with calf vein VTE who received GMI‐1271. No SAEs were reported (Appendix S1, Table S3).
3.3. Pharmacokinetic profile
3.3.1. Aim 1
In the single‐ascending‐dose study, the plasma concentrations, maximum serum concentration (Cmax), and area under the curve (AUC) increased in a consistent dose‐related manner. The drug clearance (CLr), volume of distribution (VZ), and half‐life t½ were not dose dependent, and t½ ranged between 1.4 and 1.9 hours. A majority (~66%) of the drug was excreted unchanged (Figure 2A).
Figure 2.
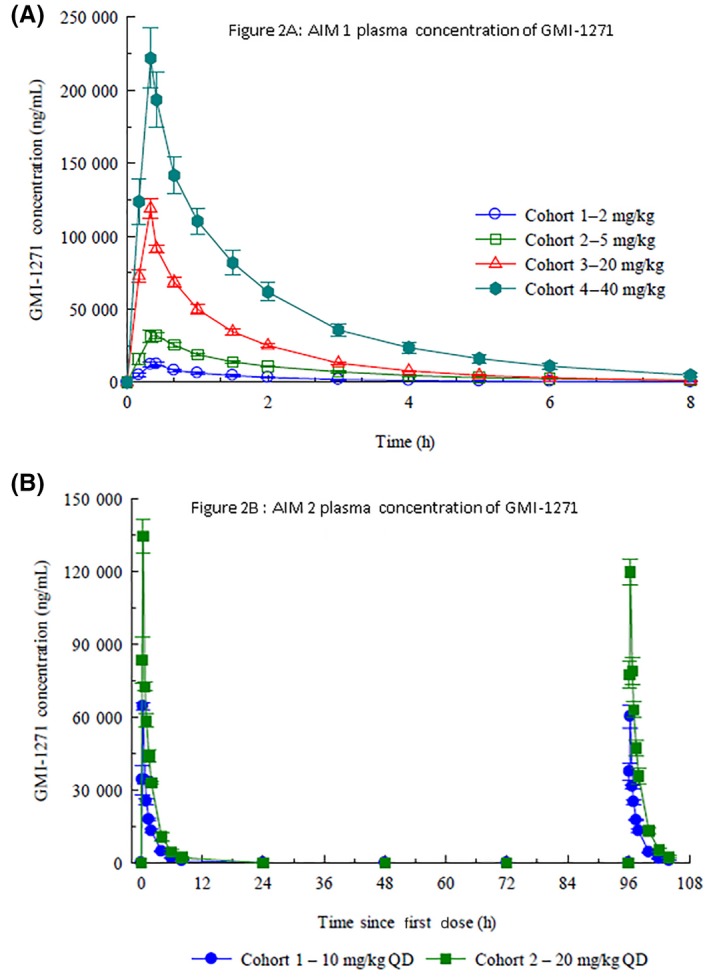
(A) Plasma concentration after a single dose of GMI‐1271. (B) Plasma concentrations after 5 consecutive intravenous doses of GMI‐1271
3.3.2. Aim 2
Similar to Aim 1, Cmax and AUC increased as expected with dose escalation (Figure 2B). CLr, VZ, and t1/2 were not dose dependent, and no accumulation was seen with multiple dosing. The t1/2 is approximately 1.5 hours in both the 10 and 20 mg/kg cohorts. See Appendix S1, Table A for pharmacokinetic details.
3.4. Biomarker analysis
3.4.1. TEG
In Aim 1, we found a statistically significant difference for increased R (time of latency from start of test to initial fibrin formation; P = .0002; Figure 3A), and K (time taken to achieve a certain level of clot strength (P = .007; Figure 3B) between enoxaparin (higher values) and GMI‐1271. Angle A, which measures the speed at which fibrin buildup and crosslinking takes place, was not statistically different between enoxaparin and GMI‐1271 (Figure 3C), while there was a higher level of Ly30 (which measures the degree of fibrinolysis) in GMI‐1271 as compared to enoxaparin (P = .046; Figure 3D). In Aim 2, there was a trend to increased R, K, and Ly30 and a decreased A in the enoxaparin group (Figure 3 E‐H). TEG R, K, and A data for those treated with saline mirrored subjects treated with GMI‐1271.
Figure 3.
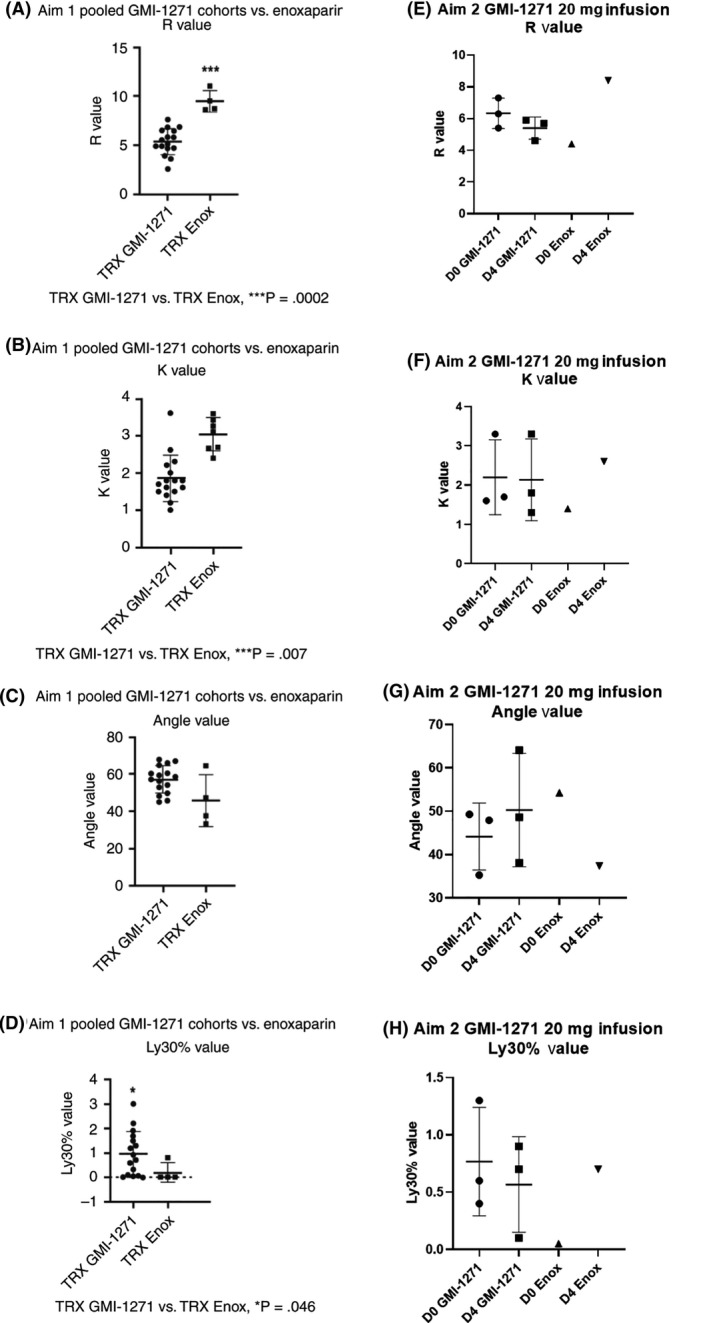
Aim 1 and Aim 2 TEG results comparing GMI‐1271 vs. enoxaparin. D0, baseline; D4, day 4; Enox, enoxaparin; TRX, treatment
3.4.2. sEsel protein determination
In Aim 1, analysis revealed a trend to decreased sEsel protein in those treated with GMI‐1271 (day 0 vs. treatment day; Figure 4A). There was no change in sEsel seen with enoxaparin (Figure 4B) or placebo (Figure 4C). In Aim 2, there was a trend for sEsel to decrease between day 0 and day 4 in those treated with GMI‐1271 (Figure 4D; Appendix S1, Table C). The trend to lower sEsel in GMI‐1271 treated subjects suggests appropriate on‐target effects.
Figure 4.
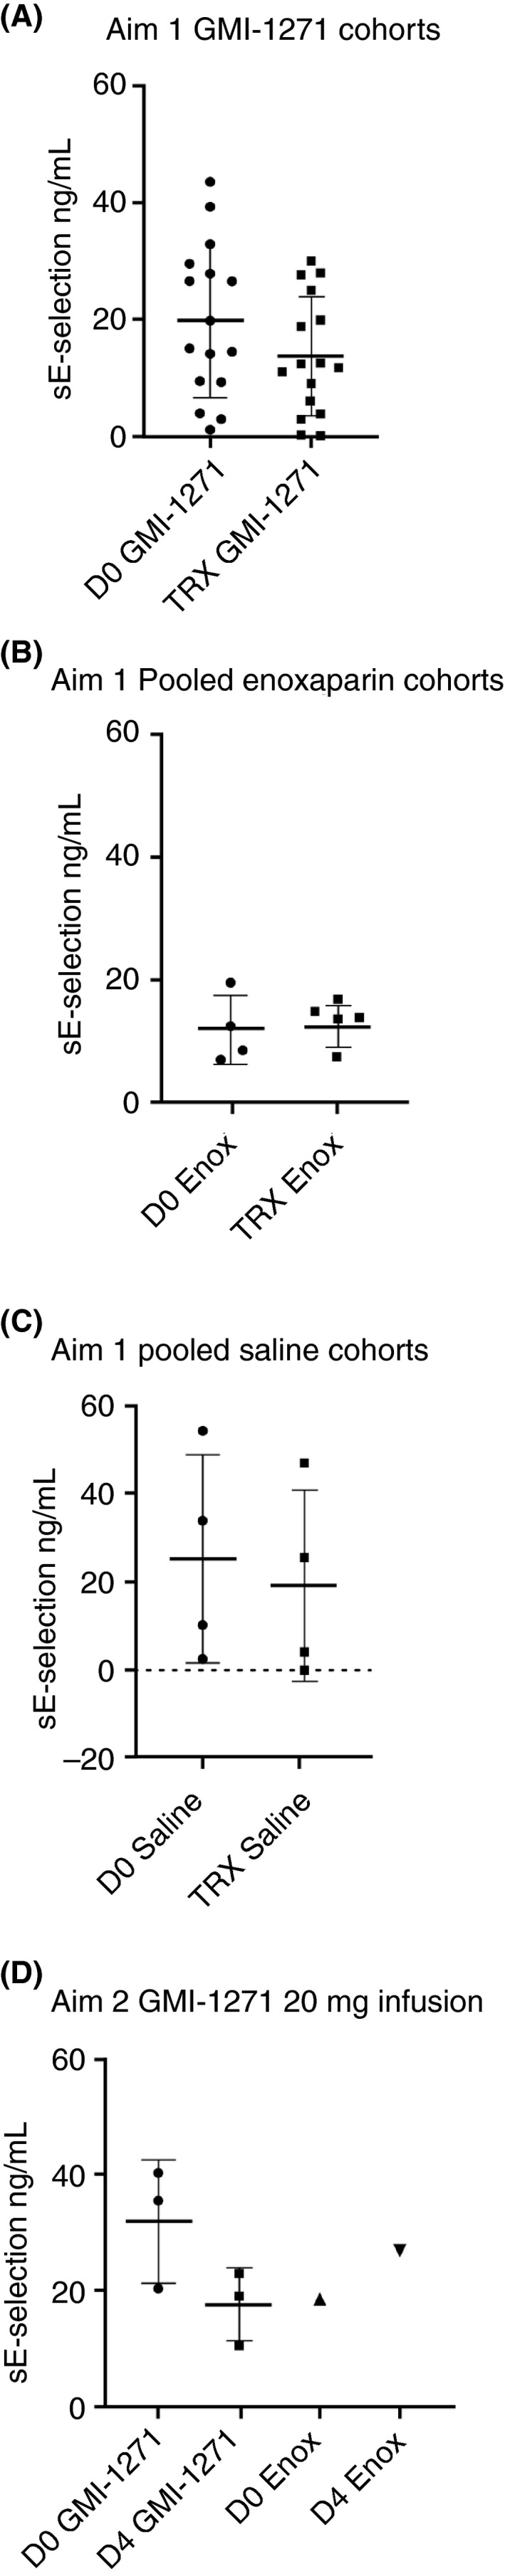
Soluble‐E Selectin values for Aim 1 and Aim 2. D0, baseline; TRX, treatment; Enox, enoxaparin. Note: Figure 4C, both groups had a single outlier evaluated using a Grubbs test. Both data points were furthest from the rest, but not a significant outlier (P > .05)
3.4.3. MAC‐1, MPO, sPsel, tissue factor, and other protein determination
In Aim 1, there was a trend for an increases in MAC‐1 between GMI‐1271 and placebo saline at 8 hours after treatment, with a higher level of MAC‐1 in the saline group (Figure 5A), while in Aim 2, there was a trend for MAC‐1 to decrease between baseline and day 4 in GMI‐1271–treated subjects (Figure 5B). In Aim 1, there was a difference in MPO between GMI‐1271 and enoxaparin, with MPO levels being higher in the enoxaparin group (Figure 5C), while the measurement of MPO was similar between saline and GMI‐1271–treated subjects (Appendix S1, Table B). In Aim 2, there was a trend for enoxaparin to raise MPO levels compared to GMI‐1271 (Figure 5D; Appendix S1, Table C). These comparisons of MAC‐1 and MPO suggest lower leukocyte and platelet activation in GMI‐1271–treated volunteers compared with enoxaparin. In Aim 1, when comparing the 24‐hour posttreatment biomarker samples, sPsel was significantly lower in the saline‐treated cohort, P = .03 (Figure 6A). Tissue factor in Aim 1 was higher in the 24‐hour posttreatment saline placebo samples when compared to GMI‐1271 (Figure 6B). No other notable trends were seen in the other biomarkers measured.
Figure 5.
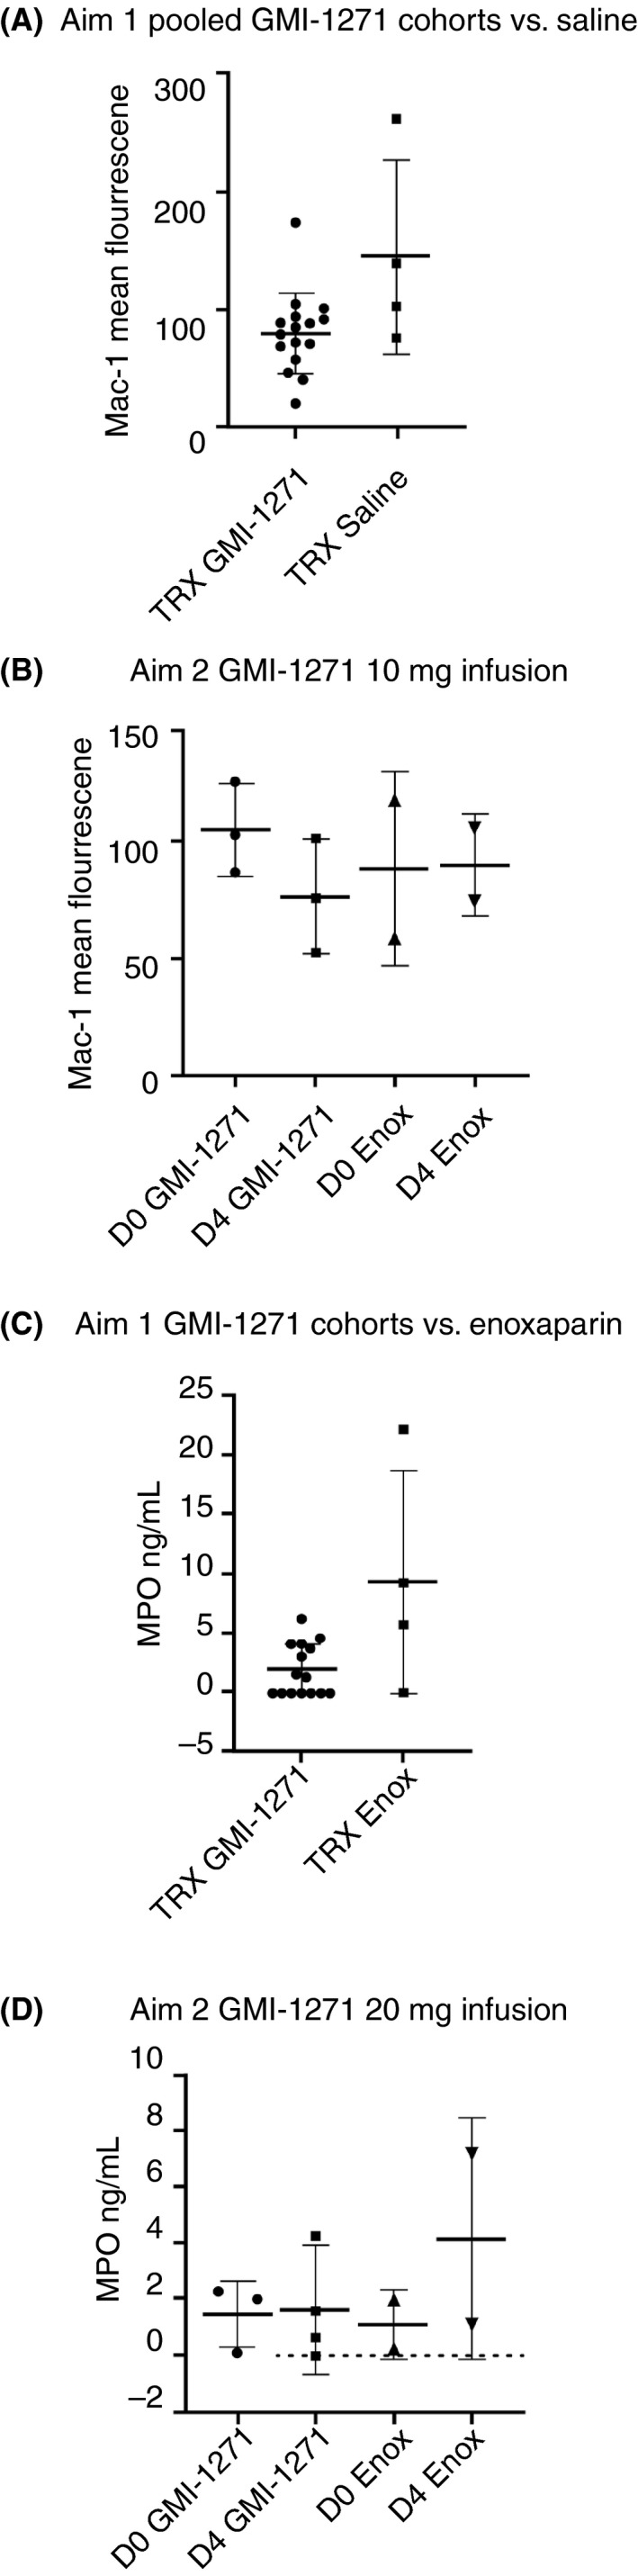
MAC‐1 and MPO values for Aim 1 and Aim 2. TRX, treatment; Enox, enoxaparin; D0 = Baseline; D4 = Day 4. Note: Figure 5A, Saline and Figure 5C, Enoxaparin, had outliers evaluated using a Grubbs test. Both data points were furthest from the rest, but not a significant outlier (P > .05)
Figure 6.
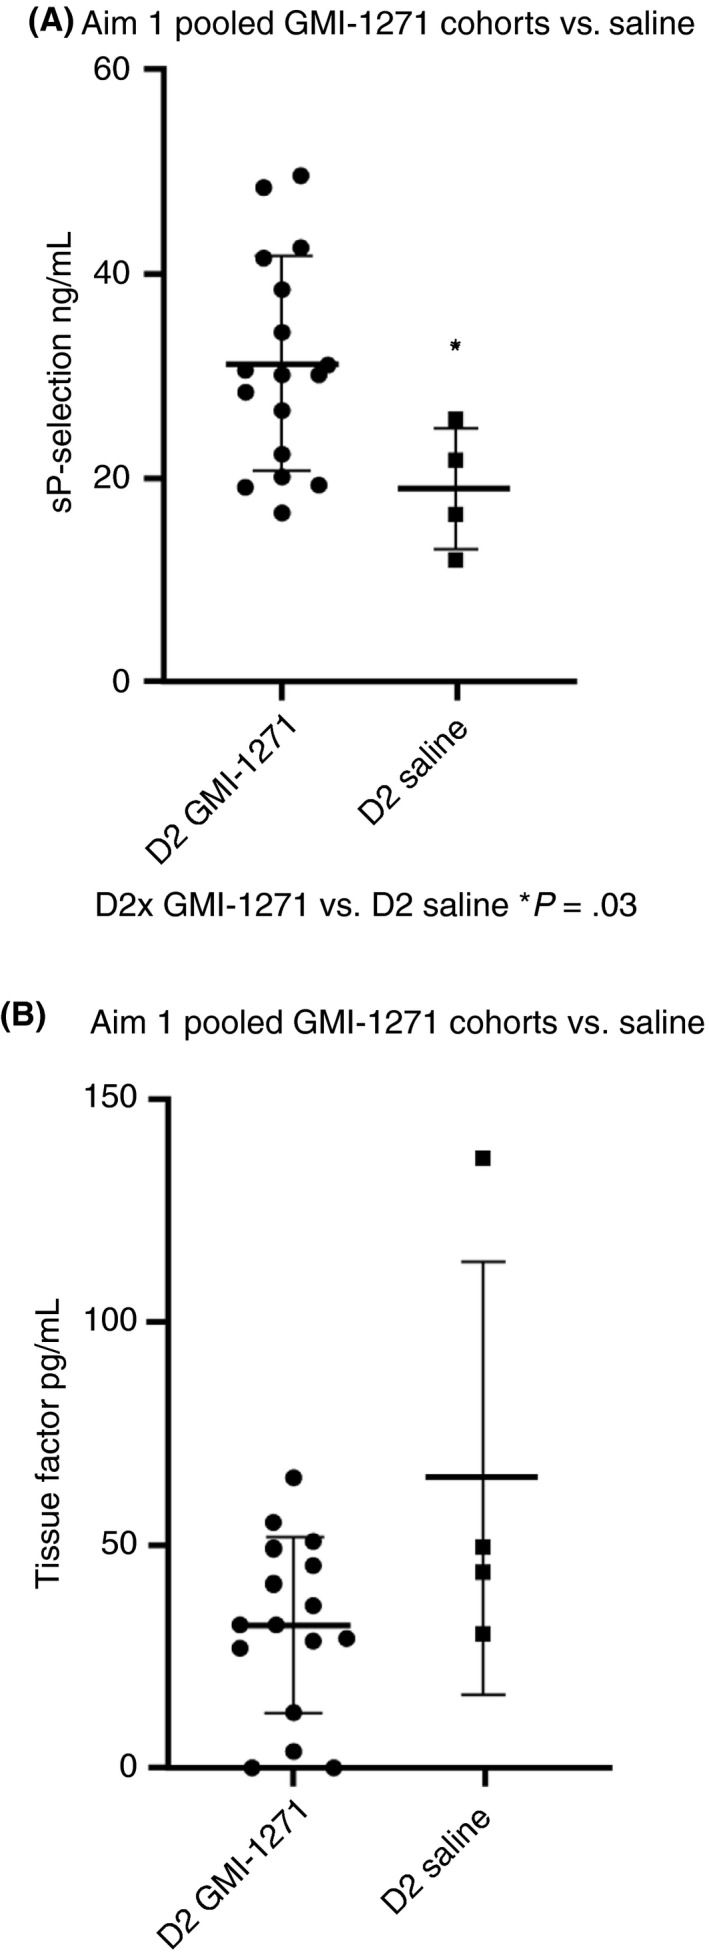
Soluble P‐selectin and tissue factor for Aim 2 pooled GMI‐1271 cohorts vs. saline. D2, day 2. Note: Figure 6B‐Tissue Factor, had an outlier evaluated using a Grubbs test. The single data point was furthest from the rest, but not a significant outlier (P > .05)
3.4.4. Biomarker data in patients with calf vein thrombosis treated with GMI‐1271 (Aim 3)
We found that LFA‐1 rose slightly from baseline to 1 hour after treatment (Figure 7A) and TNFα decreased from day 0 to day 4 (Figure 7B). CRP, D‐dimer, and tissue factor all trended lower after treatment with GMI‐1271 (Figure 7C,D,E).
Figure 7.
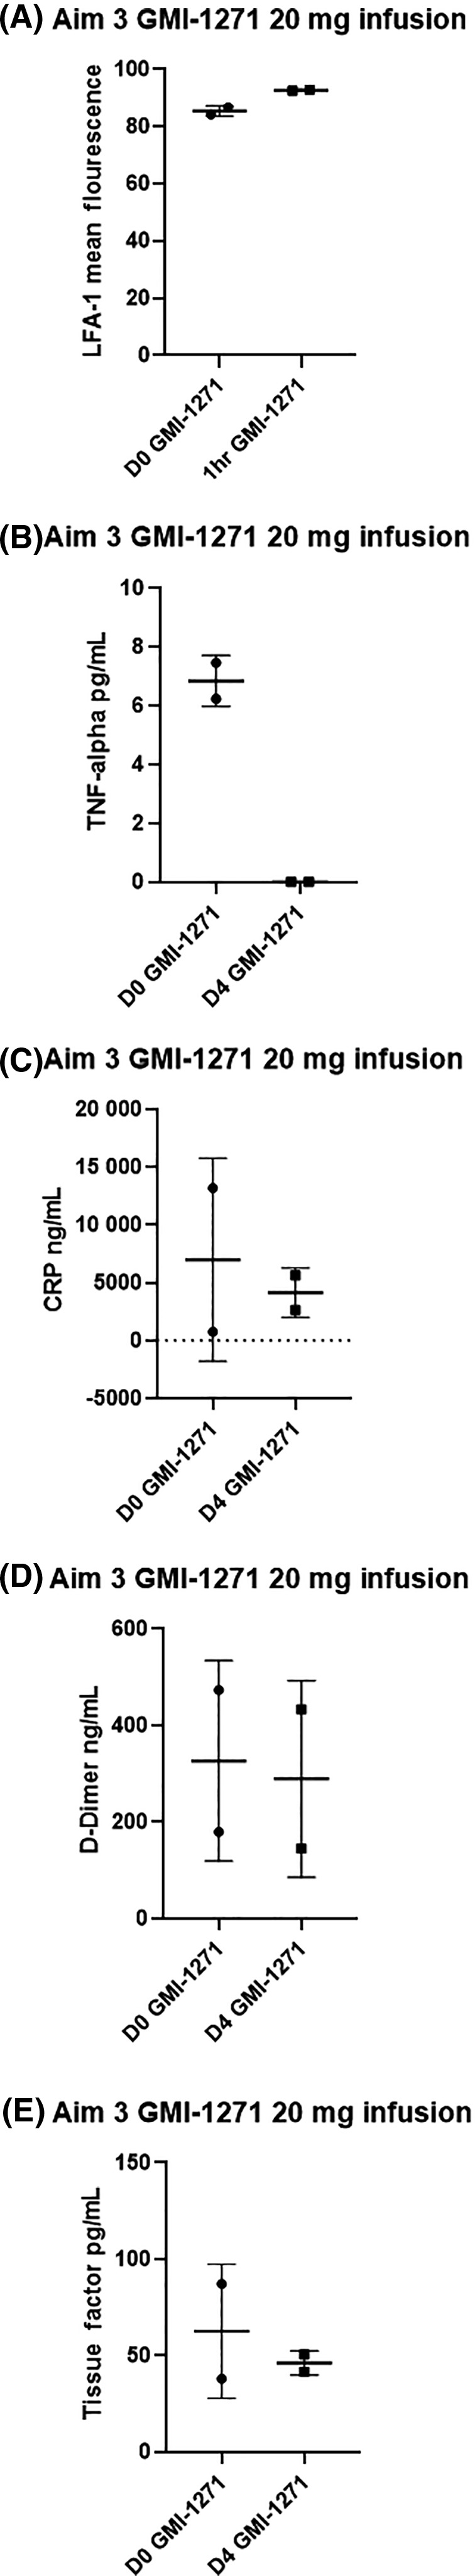
Aim 3 biomarker results for LFA, TNFα, CRP, D‐dimer, and tissue factor. D0, baseline; D4, day 4
See Appendix S1, Tables B, C, and D, for select detailed biomarker values for Aims 1, 2, and 3.
4. DISCUSSION
These 2 studies represent the first report of clinical trials administering GMI‐1271, an E‐selectin antagonist, in doses >10 mg/kg in a single ascending dose, and the first trial to use multiple ascending doses in healthy volunteers. We also report on the first 2 patients with DVT to receive treatment with a selectin antagonist to show proof of principle.
We found that GMI‐1271 showed an acceptable safety profile in healthy volunteers and in patients with calf vein thrombosis. GMI‐1271 was well tolerated when administered as a single intravenous dose or as multiple intravenous doses over consecutive days. There were no clinically significant findings seen in laboratory analysis, vital signs, ECGs, or physical exams. Adverse events for single‐ascending‐dose evaluation seen in >1 participant were mild/Grade 1 and included headache, skin irritation, vessel puncture‐site bruising, and dizziness. Similar events were seen in the multiple ascending dose evaluation. One event was grade 2 in the multiple dose analysis and was considered unrelated to GMI‐1271. Generally, the frequency and severity of events did not change with multiple dosing. There were no moderate or serious adverse events considered related to GMI‐1271 by the study investigators.
GMI‐1271 showed consistent pharmacokinetic parameters for doses ranging from 2 mg/kg to 40 mg/kg. Plasma levels increased in a linear manner with respect to dose, while clearance, volume of distribution, and half‐life were not dose dependent. Furthermore, no accumulation was seen with multiple consecutive doses. Biomarker analysis demonstrated a trend in reduction of sEsel levels with GMI‐1271 exposure, indicating on‐target activity, while exposure of GMI‐1271 did not impact key clinical measures of bleeding risk. Several biomarkers measured in Aims 1 and 2 showed differences between groups (MAC‐1, MPO, sEsel, sPsel, and TF). However, it is important to consider the possibility of type I and type II error, as the biomarkers were analyzed as secondary end points, and the study was not powered for these analyses. Despite this limitation, the biomarker trends suggest GMI‐1271 has a lower bleeding potential compared to enoxaparin. Our 2 patients with calf DVT treated with GMI both had improvement of symptoms after 48 hours with repeat ultrasound showing signs of clot resolution.
There is a clinical demand for antithrombotic treatment strategies that do not increase the risk of bleeding and also limit fibrosis. In addition, the ATTRACT trial19 and SOX trial20 demonstrate that thrombolysis or compression does not decrease the rate of postthrombotic syndrome (PTS). Given the mechanism of PTS, an agent that decreases vein wall fibrosis has the potential of limiting PTS. The need for new agents is clear,21 and GMI‐1271 is an exciting new agent that may fill this important need.
Notable limitations of our study include slow accrual to Aim 3 with only 2 patients with acute calf vein thrombosis being enrolled prior to funding cessation. In addition, GMI‐1271 is administered intravenously, which limit daily use; future studies will use a subcutaneous formulation of GMI‐1271, which may ease administration. Our study was also not powered to analyze biomarker end points and, as such, our findings represent notable trends and larger studies are needed to confirm these results.
To our knowledge, these are the first studies looking at E‐selectin inhibition as treatment in VTE in humans. This exciting mechanism of action and favorable side effect profile may open a new treatment paradigm for the treatment of VTE. Our research group is now evaluating the combination of GMI‐1271 with lower doses of enoxaparin in primates through the NHLBI Vascular Interventions/Innovations and Therapeutic Advances (VITA) Program. This research should drive future human studies and demonstrate proof of concept for the potential for selectin inhibition to be used as a frontline therapeutic option for VTE, either as stand‐alone therapy or combined with standard therapy at lower doses.
RELATIONSHIP DISCLOSURES
The following authors had no competing financials interests: SD, DEA, SB, AH, DDM, JKSD, and SLS. TWW is a nonpaid consultant for Selexys, Corp. MH is an employee of GlycoMimetics. JLM is cofounder, an employee, owns stock in, and is on the Board of Directors of GlycoMimetics Inc. HMT is an employee of and owns stock in GlycoMimetics.
AUTHOR CONTRIBUTIONS
SD:coinvestigator, study design, wrote and edited article; DEA: coinvestigator, study design, wrote and edited article; SB: research coordinator and edited article; AH: processed and analyzed biomarker data; DDM: preclinical mouse studies, edited article, and statistical analysis; JKS: coinvestigator, edited article; MH: study design and edited article; JLM: study design and edited article; HMT: study design and edited article; SLS: principal investigator, study design, and edited article; TWW: principal investigator, study design, and edited article.
Supporting information
ACKNOWLEDGMENTS
This work was supported by the contract HHSN268201400012C, part of the National Heart, Lung, and Blood Institute Vascular Interventions/Innovations and Therapeutic Advances (VITA) Program. The study drug, GMI‐1271, and pharmacokinetic analysis were provided by GlycoMimetics, Inc The authors thank the members of the University of Michigan VITA team: Daniel Clauw, MD, and Thomas Braun, PhD, for their help with study design and analysis; Study Coordinators: Nicole Gervais, RN, Satwinder Grewal, MBBS, MPH, Jacquelyn Madden, and Cheryl Novak, RN; Cardiologists: Geoff Barnes, MD, and James Froehlich, MD, MPH; and for their help in identifying and enrolling subjects: Benjamin Jacobs, MD, Andrew Kimball, MD, Danielle Sutzko, MD, Huiting (Tina) Chen, MD, Clare Harris, NP, Ann Eschelbach, NP, Elaine Fellows, NP, Elizabeth Andraska, Jennifer Angell, Anthony Hage, Laura Fitzgerald, and Walaa Tout. We also thank the members of the GlycoMimetics, Inc team for their assistance with study coordination and design: Christine Nietubicz, William E. Parker, Curt Wolfgang Ph, Yu‐Ling Li, MS, MD, William Kramer, PhD and Henry Flanner, MS. We thank the University of Michigan Diagnostic Vascular Unit for their help in performing the ultrasound studies for our patients.
Devata S, Angelini DE, Blackburn S, et al. Use of GMI‐1271, an E‐selectin antagonist, in healthy subjects and in 2 patients with calf vein thrombosis. Res Pract Thromb Haemost. 2020;4:193–204. 10.1002/rth2.12279
Handling Editor: Cihan Ay
Sumana Devata and Dana E. Angelini are designated co‐first authors
Contributor Information
Thomas W. Wakefield, https://twitter.com/ThomasWakefield.
Suman L. Sood, Email: sumisood@med.umich.edu.
REFERENCES
- 1. Heit JA, Silverstein MD, Mohr DN, et al. The epidemiology of venous thromboembolism in the community. Thromb Haemost. 2001;86(1):452–63. [PubMed] [Google Scholar]
- 2. Heit JA, Spencer FA, White RH. The epidemiology of venous thromboembolism. J Thromb Thrombolysis. 2016;41(1):3–14. [DOI] [PMC free article] [PubMed] [Google Scholar]
- 3. Garcia DA, Baglin TP, Weitz JI, Samama MM. American College of Chest P. Parenteral anticoagulants: Antithrombotic Therapy and Prevention of Thrombosis, American College of Chest Physicians Evidence‐Based Clinical Practice Guidelines. Chest. 2012;141(2 Suppl):e24S–43S. [DOI] [PMC free article] [PubMed] [Google Scholar]
- 4. Mismetti P, Quenet S, Levine M, Merli G, Decousus H, Derobert E, et al. Enoxaparin in the treatment of deep vein thrombosis with or without pulmonary embolism: an individual patient data meta‐analysis. Chest. 2005;128(4):2203–10. [DOI] [PubMed] [Google Scholar]
- 5. Linkins LA, Choi PT, Douketis JD. Clinical impact of bleeding in patients taking oral anticoagulant therapy for venous thromboembolism: a meta‐analysis. Ann Intern Med. 2003;139(11):893–900. [DOI] [PubMed] [Google Scholar]
- 6. Agnelli G, Buller HR, Cohen A, Curto M, Gallus AS, Johnson M, et al. Oral apixaban for the treatment of acute venous thromboembolism. N Engl J Med. 2013;369(9):799–808. [DOI] [PubMed] [Google Scholar]
- 7. Investigators E, Bauersachs R, Berkowitz SD, et al. Oral rivaroxaban for symptomatic venous thromboembolism. N Engl J Med. 2010;363(26):2499–510. [DOI] [PubMed] [Google Scholar]
- 8. Saha P, Humphries J, Modarai B, Mattock K, Waltham M, Evans CE, et al. Leukocytes and the natural history of deep vein thrombosis: current concepts and future directions. Arterioscler Thromb Vasc Biol. 2011;31(3):506–12. [DOI] [PMC free article] [PubMed] [Google Scholar]
- 9. Diaz JA, Fuchs TA, Jackson TO, Kremer Hovinga JA, Lämmle B, Henke PK, et al. Plasma DNA is elevated in patients with deep vein thrombosis. J Vasc Surg Venous Lymphat Disord. 2013;1(4):341–8. [DOI] [PMC free article] [PubMed] [Google Scholar]
- 10. Myers D, Farris D, Hawley A, Wrobleski S, Chapman A, Stoolman L, et al. Selectins influence thrombosis in a mouse model of experimental deep venous thrombosis. J Surg Res. 2002;108(2):212–21. [DOI] [PubMed] [Google Scholar]
- 11. Sullivan VV, Hawley AE, Farris DM, Knipp BS, Varga AJ, Wrobleski SK, et al. Decrease in fibrin content of venous thrombi in selectin‐deficient mice. J Surg Res. 2003;109(1):1–7. [DOI] [PubMed] [Google Scholar]
- 12. Ramacciotti E, Myers DD, Wrobleski SK, Deatrick KB, Londy FJ, Rectenwald JE, et al. P‐selectin/PSGL‐1 inhibitors versus enoxaparin in the resolution of venous thrombosis: a meta‐analysis. Thromb Res. 2010;125(4):e138–42. [DOI] [PMC free article] [PubMed] [Google Scholar]
- 13. Diaz JA, Wrobleski SK, Alvarado CM, Hawley AE, Doornbos NK, Lester PA, et al. P‐selectin inhibition therapeutically promotes thrombus resolution and prevents vein wall fibrosis better than enoxaparin and an inhibitor to von Willebrand factor. Arterioscler Thromb Vasc Biol. 2015;35(4):829–37. [DOI] [PMC free article] [PubMed] [Google Scholar]
- 14. Culmer DL, Dunbar ML, Hawley AE, Sood S, Sigler RE, Henke PK, et al. E‐selectin inhibition with GMI‐1271 decreases venous thrombosis without profoundly affecting tail vein bleeding in a mouse model. Thromb Haemost. 2017;117(6):1171–81. [DOI] [PubMed] [Google Scholar]
- 15. Myers DD, Culmer DL, Diaz JA, Hawley AE, Henke PK, Sood SL, et al. Novel E-selectin antagonist GMI-1271 decreases venous thrombosis without increased bleeding potential in a mouse model. Blood. 2012;120(21):3422–3422. [Google Scholar]
- 16. Righini M, Galanaud J‐P, Guenneguez H, Brisot D, Diard A, Faisse P, et al. Anticoagulant therapy for symptomatic calf deep vein thrombosis (CACTUS): a randomised, double‐blind, placebo‐controlled trial. Lancet Haematol. 2016;3(12):e556–62. [DOI] [PubMed] [Google Scholar]
- 17. Kearon C, Akl EA, Ornelas J, Blaivas A, Jimenez D, Bounameaux H, et al. Antithrombotic therapy for VTE disease: CHEST guideline and expert panel report. Chest. 2016;149(2):315–52. [DOI] [PubMed] [Google Scholar]
- 18. Zia AN, Chitlur M, Rajpurkar M, Ozgonenel B, Lusher J, Callaghan JH, et al. Thromboelastography identifies children with rare bleeding disorders and predicts bleeding phenotype. Haemophilia. 2015;21(1):124–32. [DOI] [PubMed] [Google Scholar]
- 19. Vedantham S, Goldhaber SZ, Julian JA, Kahn SR, Jaff MR, Cohen DJ, et al. Pharmacomechanical catheter‐directed thrombolysis for deep‐vein thrombosis. N Engl J Med. 2017;377(23):2240–52. [DOI] [PMC free article] [PubMed] [Google Scholar]
- 20. Kahn SR, Shapiro S, Wells PS, Rodger MA, Kovacs MJ, Anderson DR, et al. Compression stockings to prevent post‐thrombotic syndrome: a randomised placebo‐controlled trial. Lancet. 2014;383(9920):880–8. [DOI] [PubMed] [Google Scholar]
- 21. Vedantham S, Jaff MD. Deep Vein Thrombisis ‐ Putting Patients First. Paper presented at: Society of Interventional Radiology; March 6, 2017; Washington, DC.
Associated Data
This section collects any data citations, data availability statements, or supplementary materials included in this article.
Supplementary Materials