

Abstract
ATPase enzymes utilize the free energy stored in adenosine triphosphate to catalyze a wide variety of endergonic biochemical processes in vivo that would not occur spontaneously. These proteins are crucial for essentially all aspects of cellular life, including metabolism, cell division, responses to environmental changes and movement. The protocol presented here describes a nicotinamide adenine dinucleotide (NADH)-coupled ATPase assay that has been adapted to semi-high throughput screening of small molecule ATPase inhibitors. The assay has been applied to cardiac and skeletal muscle myosin II’s, two actin-based molecular motor ATPases, as a proof of principle. The hydrolysis of ATP is coupled to the oxidation of NADH by enzymatic reactions in the assay. First, the ADP generated by the ATPase is regenerated to ATP by pyruvate kinase (PK). PK catalyzes the transition of phosphoenolpyruvate (PEP) to pyruvate in parallel. Subsequently, pyruvate is reduced to lactate by lactate dehydrogenase (LDH), which catalyzes the oxidation of NADH in parallel. Thus, the decrease in ATP concentration is directly correlated to the decrease in NADH concentration, which is followed by change to the intrinsic fluorescence of NADH. As long as PEP is available in the reaction system, the ADP concentration remains very low, avoiding inhibition of the ATPase enzyme by its own product. Moreover, the ATP concentration remains nearly constant, yielding linear time courses. The fluorescence is monitored continuously, which allows for easy estimation of the quality of data and helps to filter out potential artifacts (e.g. arising from compound precipitation or thermal changes).
Keywords: ATPase assay, NADH, fluorescence, semi high-throughput screening, inhibitory constant, myosin
SHORT ABSTRACT:
A nicotinamide adenine dinucleotide (NADH)-coupled ATPase assay has been adapted to semi-high throughput screening of small molecule myosin inhibitors. This kinetic assay is run in a 384 well microplate format with total reaction volumes of only 20μl per well. The platform should be applicable to virtually any ADP producing enzyme.
INTRODUCTION:
Myosins are mechanochemical energy transducers that hydrolyze ATP (adenosine triphosphate) to generate directional movement along the filaments of the actin cytoskeleton in eukaryotes1,2. They have both structurally and kinetically adapted to their various intracellular functions, such as the transport of organelles, muscle contraction or the generation of cytoskeletal tension1,2. The myosin superfamily is represented by ~40 myosin genes belonging to ~12 distinct myosin classes in the human genome3,4. Members of the myosin classes play various roles in a highly diverse set of disorders, such as several cancers, neurological disorders, skeletal myopathies, and hypertrophic cardiomyopathy5,6. Given the large number of physiological and pathological functions of these molecular motors, it is not surprising that they are becoming increasingly recognized as drug targets for a variety of conditions7. Significant progress has been made recently in the discovery of new myosin inhibitors8–10 and activators11, and to improve the properties of existing ones12–15.
The NADH-coupled ATPase assay has long been used to measure the ATPase activity of various enzymes, such as the sarcoplasmic reticulum Ca2+ pump ATPase16, the DNA repair ATPase Rad5417, the AAA+ ATPase p9718 or the microtubule motor kinesin19. The assay employs an ATP regeneration cycle. The ADP (adenosine diphosphate) generated by the ATPase is regenerated to ATP by pyruvate kinase (PK), which transforms one molecule of phosphoenolpyruvate (PEP) to pyruvate in parallel. Subsequently, pyruvate is reduced to lactate by lactate dehydrogenase (LDH). That, in turn, oxidizes one molecule of NADH to NAD. Therefore, the decrease in NADH concentration as a function of time equals the ATP hydrolysis rate. The ATP regeneration cycle keeps the ATP concentration nearly constant and the ADP concentration low as long as PEP is available. This results in linear time courses, making it simple to determine the initial reaction rates and helps to avoid product inhibition by ADP19. Although the NADH-coupled ATPase assay has already been adapted to a 96 well format20, the high reaction volumes (~150 μl) make it relatively expensive due to the high demand of reagents, rendering it less amenable to rapid screening of large numbers of compounds. Alternative methods, such as the malachite green assay19,21, which relies on the detection of the phosphate produced by the ATPase enzyme, were proven more suitable for miniaturization and high-throughput screening22–24. However, an endpoint assay is more likely to be affected by several artifacts (discussed below), which may remain undiscovered in the absence of full time courses.
Here, the NADH-coupled ATPase assay has been optimized for semi-high throughput screening of small molecule inhibitors. Skeletal and cardiac muscle myosin II’s and the myosin inhibitors blebbistatin8, para-aminoblebbistatin13 and para-nitroblebbistatin12 are used to demonstrate the power of the assay, which relies on NADH fluorescence as a readout. This protocol is amenable to screening projects focused on any ADP producing enzymes.
PROTOCOL:
2.75 pages of highlighted text for filming. (Highlighted in gray)
1. Prepare stock solutions and reagents
-
1.1.
Prepare DTT stock solution by dissolving crystalline DTT in distilled water to a final concentration of 1000 mM. Adjust the pH to 7.0 with 1M NaOH solution. Aliquot and store at −20 °C.
-
1.2.
Prepare ATP stock solution by dissolving crystalline ATP in distilled water to a final concentration of 100 mM. Adjust the pH to 7.0 with 1 M NaOH solution. Aliquot and store at −20 °C.
-
1.3.
Prepare 10x NADH Buffer containing 70 mM MOPS, 10 mM MgCl2, 0.9 mM EGTA, and 3 mM NaN3. Adjust the pH to 7.0 with 1 M NaOH solution. Store at 4 °C.
-
1.4.
Prepare 1x Myosin Buffer containing 10 mM MOPS and 0.1 mM EGTA. Adjust the pH to 7.0 with 1 M NaOH solution. Store at 4 °C. Add BSA and DTT to a final concentration of 0.1 % (w/v %) and 1 mM, respectively, before use.
-
1.5.
Prepare 1x Actin Buffer containing 4 mM MOPS, 0.1 mM EGTA, 2 mM MgCl2, and 3 mM NaN3. Adjust the pH to 7.0 with 1 M NaOH solution. Store at 4 °C. Add BSA and DTT to a final concentration of 0.1 % (w/v %) and 1 mM, respectively, before use.
-
1.6.
Prepare NADH stock solution by dissolving crystalline NADH in 10x NADH Buffer to a final concentration of 5.5 mM. Aliquot and store at −20 °C.
-
1.7.
Prepare PEP stock solution by dissolving crystalline PEP in 10x NADH Buffer to a final concentration of 50 mM. Aliquot and store at −20 °C.
-
1.8.
Prepare LDH stock solution by dissolving lyophilized LDH powder in a mixture of glycerol and 10x NADH Buffer (50–50 %) to a final concentration of 2000 U/ml. Centrifuge the solution to remove any undissolved protein present (7197 g, 20 °C, 10 min). Transfer the supernatant into a clean centrifuge tube carefully. Aliquot and store at −20 °C.
-
1.9.
Prepare PK stock solution by dissolving lyophilized PK powder in a mixture of glycerol and 10x NADH Buffer (50–50 %) to a final concentration of 10000 U/ml. Centrifuge the solution to remove any undissolved protein present (7197 g, 20 °C, 10 min). Transfer the supernatant into a clean centrifuge tube carefully. Aliquot and store at −20 °C.
-
1.10.
Reconstitute the lyophilized cardiac and skeletal muscle myosin II samples by adding 100 μl Milli-Q water to obtain 10 mg/ml stock solutions corresponding to ~37.9 μM and ~40.8 μM myosin concentrations (monomeric), respectively. For further details, see manufacturer’s instructions.
-
1.11.
Prepare F-Actin from Rabbit Muscle Acetone Powder as described by Pardee and Spudich25.
2. Measure ATPase activities and inhibitory effects of small molecule inhibitorsPrepare compound plate
-
2.2.1.
Dissolve compounds of interest in high-quality DMSO.
-
2.2.2.
Create fifteen-step serial 1:2 dilutions starting from 10 mM compound concentration in DMSO.
-
2.2.3.
Transfer the samples to a 384 well polypropylene plate in triplicates (12.5 μl each) using a multichannel pipette. Use two rows on the compound plate for one compound (instead of three columns) to minimize the number of wells potentially affected by edge effects. Use the last three wells in the second row for each compound as negative control (DMSO only). Do not use the first and the last row on the plate for compound dilutions.
-
2.2.4.
Transfer pure DMSO into the wells of the first row (reserved for NADH calibration).
-
2.2.5.
Use the last row for positive control. (Para-aminoblebbistatin at 4 mM concentration in DMSO was used here.)
-
2.2.
Prepare 4500 μl of 20 μM diluted actin solution for each assay plate (384 well black-wall polystyrene microplate). Mix the solution thoroughly by pipetting up and down 30 times using a 5 ml pipette to reduce viscosity and heterogeneity by breaking actin filaments. Centrifuge the solution to remove any precipitated protein present (7197 g, 20 °C, 10 min). Carefully transfer the supernatant into a clean centrifuge tube.
-
2.3.
Prepare master mix containing LDH and PK enzymes (“Enzyme mix”). For each assay plate, combine 171.4 μl LDH solution, 171.4 μl PK solution and 3189.3 μl or 3252.9 μl myosin buffer for assays involving cardiac or skeletal muscle myosin II’s, respectively, in a 15 ml conical centrifuge tube. Do not add any myosin at this point to avoid aggregation and precipitation.
-
2.4.
Prepare master mix containing all substrates (“Substrate mix”). For each plate, combine 162.1 μl ATP, 162.1 μl PEP and 324.1 μl NADH solution in a 15 ml conical centrifuge tube. Do not add actin at this point to avoid aggregation and precipitation.
-
2.5.
Create seven-step serial 1:2 dilutions of NADH for calibration starting from 250 μM.
-
2.5.1.
Mix 12.3 μl of NADH stock solution with 257.7 μl of myosin buffer in a 1.5 ml microcentrifuge tube.
-
2.5.2.
Aliquot 135 μl of myosin buffer into seven 1.5 ml microcentrifuge tubes.
-
2.5.3.
Transfer 135 μl of solution from the first tube into the second and mix by pipetting. Repeat until reaching the 7th tube.
-
2.5.4.
Use the last tube as no-NADH control (buffer only).
-
2.6.
Using an 8-channel pipette, transfer 20 μl of the NADH calibration solutions into the first row of the assay plate in triplicates.
-
2.7.
Add 68 μl cardiac / 4.2 μl skeletal muscle myosin II to the Enzyme mix. Vortex briefly.
-
2.8.
Except the first row, dispense 8.4 ul of Enzyme mix into each well of the assay plate.
-
2.9.
Transfer 100 nl of solutions from the compound plate to the assay plate containing enzyme mix using the Biomek NXP Automated Workstation equipped with a 100 nl Pin tool head.
-
2.10.
Shake the assay plate for 1 minute at room temperature at 1200 RPM using a microplate shaker.
-
2.11.
Add 4052 μl actin to the Substrate mix. Vortex briefly.
-
2.12.
Dispense 11.6 ul of Substrate mix into each well of the assay plate (except first row) to start the enzymatic reaction.
-
2.13.
Shake the assay plate for 1 minute at room temperature at 1200 RPM using a microplate shaker.
-
2.14.
Centrifuge the assay plate at 101 g for 30 s.
-
2.15.
Make sure that the temperature of the chamber of the EnVision 2104 Multilabel Plate Reader has been stabilized at 25°C. Load the plate and shake for another 30 s. This shaking step is necessary to make the shape of the liquid surface similar in each well and allows time for the plate to reach measurement temperature.
-
2.16.
Record NADH fluorescence for 30 minutes scanning the plate in 45 s intervals. Use a 380 nm, 10 nm bandwidth excitation filter and a 470 nm, 24 nm bandwidth emission filter in conjunction with a 425 nm cut off dichroic mirror. Run the measurement in high-concentration mode. Optimize the number of flashes, detector gain, plate dimensions and measurement height before running the assays.
-
2.17.
Final assay conditions are 300 nM cardiac/ 20 nM skeletal muscle myosin II, 10 μM actin, 40 U/ml LDH, 200 U/ml PK, 220 μM NADH, 1 mM PEP, 1 mM ATP in a buffer containing 10 mM 3-(N-morpholino)propanesulfonic acid (pH = 7.0), 2 mM MgCl2, 0.15 mM ethylene glycol-bis(β-aminoethyl ether)-N,N,N’,N’-tetraacetic acid, 0.1 mg/mL bovine serum albumin, 0.5 % (V/V) dimethyl sulfoxide (DMSO) and 1 mM dithiothreitol. The total volume is 20 μl/well. The highest final compound concentration is 50 uM. 20 μM para-aminoblebbistatin in 0.5% DMSO serves as the positive control and 0.5% DMSO alone is the negative control. All measurements are carried out in triplicates.
3. Analyze dataPlot the observed fluorescence intensity against time for each well.
-
3.2.
Perform simple linear regression to determine the slope and intercept of the fluorescence responses for each well. The slope is proportional to the ATP (NADH) consumption rate, while the intercept is proportional to the NADH concentration at the beginning of the measurement (t = 0 s).
-
3.3.
Construct a calibration curve for NADH by plotting the intercepts obtained for the first row of the plate against the concentration of NADH. Make sure that the intercepts depend linearly on the NADH concentration. Note that the intercepts estimate the real fluorescence intensities at t = 0 s with much more confidence than the average of the raw fluorescence intensity reads at t ≈ 0 s.
-
3.4.
Perform simple linear regression to obtain the slope and intercept of the NADH calibration line. The intercept describes the fluorescence background signal (no NADH present), while the slope corresponds to the extrapolated/theoretical fluorescence intensity of a 1 M NADH solution in that particular experiment.
-
3.5.
Divide the slope of the fluorescence response obtained for the rest of the wells by the slope of the NADH calibration line to convert fluorescence changes to ATP consumption rates.
-
3.6.
Plot the ATP consumption rates against the concentration of the inhibitor.
-
3.7.
To determine inhibitory constants, use appropriate statistical software to fit the dose-response data to the following quadratic equation corresponding to a simple one-to-one binding equilibrium model:
where Y is the ATP consumption rate, Ymin is the ATP consumption rate int the absence of inhibitor, Ymax is the theoretical ATP consumption rate at 100% inhibition, KI is the inhibitory constant, [E]t and [I]t are the total concentration of the enzyme (myosin) and inhibitor, respectively.
REPRESENTATIVE RESULTS:
The typical plate layout map used for screening experiments is shown in Figure 1. The first and last rows are reserved for NADH calibration and positive control (20 uM para-aminoblebbistatin, 0.5% DMSO), respectively. The remaining rows (B to O) are used to test the inhibitory activity of compounds. Here, fifteen-step serial 1:2 dilutions starting from 10 mM compound concentration in DMSO are prepared and transferred from the compound plate to the assay plate, such that the highest final compound concentration is 50 μM (in 0.5% DMSO) on the assay plate. Two rows are used to obtain a dose-response curve for one compound (48 datapoints/compound). Note that the plate layout maps can be re-designed to support the specific aims of a given project. For example, if the goal were to obtain single-point screening data for a large number of compounds, one could test 112 compounds on a single 384-well plate using the same layout for positive control and NADH calibration (calculating with triplicates for each compound). It is always advised to have a minimum of 3 datapoints for one compound (or for each concentration) and to avoid using only the wells along the edges of the plate for one compound, as these datapoints may be influenced by edge effects. To estimate the importance of edge effects, always run a full plate with negative control only first.
Figure 1. Assay plate layout.
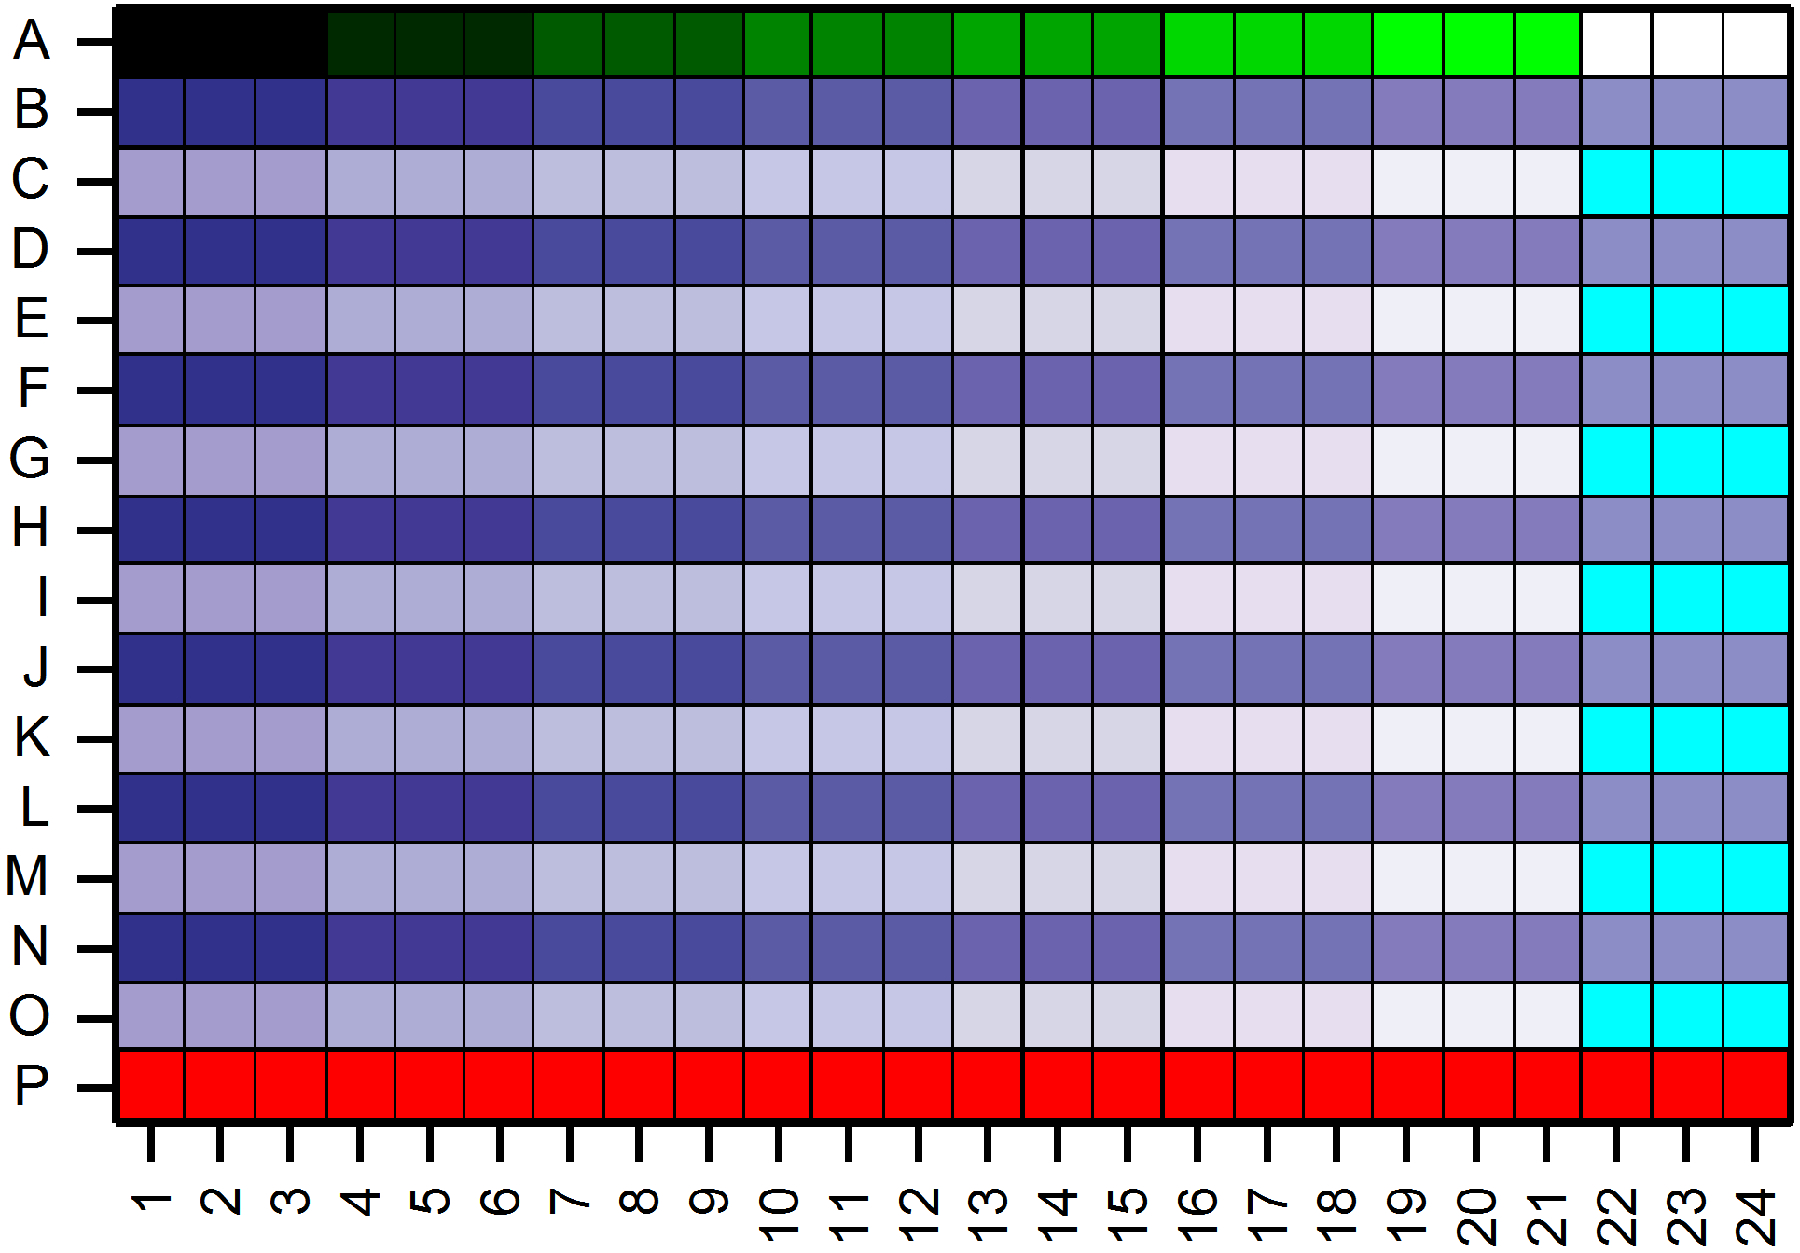
Seven-step serial 1:2 dilutions of NADH starting from 250 μM concentration is prepared and subsequently dispensed into row A in triplicate for calibration (black to green color gradient). The last three wells of row A contain myosin buffer only (no NADH control, white). The last row (P) is used for the positive control (20 μM para-aminoblebbistatin; red). A typical dose-response experiment requires two rows (e.g. B and C). Therefore, 7 dose-response experiments can be run in parallel on a single 384 well plate (represented by blue to white color gradients). Every sample is loaded as triplicates. Here, the highest final compound concentrations start at 50 μM (in 0.5% DMSO). The last three wells of every second row are reserved for the negative control (no compound, 0.5% DMSO only; cyan).
The fluorescence intensities have a linear dependence on the concentration of NADH as shown in Figure 2A. The slope of the linear fit is used during data analysis to convert fluorescence changes to reaction rates. Note that the raw fluorescence intensity trace obtained for each well of the NADH calibration is analyzed by linear regression first (a similar analysis is shown in Figure 2B and 2C for compound data). These traces are expected to show exponential decay over time due to photobleaching of the fluorophore. However, photobleaching is very slow and therefore, the raw data can be analyzed by linear fits. The slope and intercept of these fits correspond to the initial rate of photobleaching and the fluorescence intensity at t = 0 s, respectively. The intercepts of these linear fits are used instead of the average of the raw fluorescence reads at t = 0 s to construct the NADH calibration curve because the intercepts are estimated based on more data and, therefore, the associated errors are much smaller.
Figure 2. Representative ATPase data.

(A) A two-fold dilution series of NADH is prepared and transferred into the first row of each measurement plate. Fluorescence intensity is recorded for 30 minutes and the raw data is analyzed by simple linear regression. The intercept of each regression line is plotted against the concentration of NADH. Note that in an ideal case, the fluorescence intensity at t = 0 s could simply be used to obtain the calibration line. However, while the raw fluorescence data is very noisy, the intercepts give an accurate estimate of the fluorescence intensity at t = 0 s and their associated standard error (shown as error bars) is very small. (B-C) Representative fluorescence intensity traces of the skeletal (B) and cardiac (C) muscle myosin II ATPase reactions were recorded in the presence of various levels (see insets) of paraaminoblebbistatin. For simplicity, data points and error bars represent the average of three independent measurements and the associated standard deviation, respectively. Simple linear regression was performed (solid lines) to obtain reaction rates. Note that a typical dose-response experiment is comprised of 15 different inhibitor concentrations and negative control in triplicates on the measurement plate (see Fig 1) and the linear regression is performed individually for each fluorescence intensity trace. For simplicity, only 3 different concentrations are shown here. (D-E) Basal (red) and actin-activated (blue) ATPase rates were determined for various skeletal (D) and cardiac (E) muscle myosin II concentrations. The ATPase rates show linear dependency on the myosin concentration. (F) Positive (red) and negative (blue) controls (half plate each) were run in parallel on a 384 well assay plate and the Z-factor (Z`) was calculated to assess the quality of the ATPase assay. A Z’ = 0.78 indicates a reliable assay with very well separated positive and negative controls.
Figure 2B and 2C demonstrate that regardless of the myosin used or the presence of the inhibitor, the time courses are linear in the time window of the measurements. The highest (50 μM) and lowest (0 μM) inhibitor concentrations here correspond to ~100 % and 0 % inhibition, respectively. Note that due to the amount of raw data, the actual analysis would appear chaotic if shown on a single panel. Therefore, these panels have been simplified to better visualize the process. The average of the raw fluorescence intensity reads was calculated for all of the parallel experiments (triplicates for each concentration) and converted to NADH concentrations here. Only 3 inhibitor concentrations are shown. In the real analysis, each raw fluorescence intensity trace (48/compound tested) is analyzed by linear regression first, and subsequently, the slopes are converted to ATP consumption rates.
It is always advisable to demonstrate that the reaction rates change linearly with the enzyme concentration, as shown in Figure 2D and 2E for skeletal and cardiac muscle myosin II’s, respectively. Based on the linear fits, the final assay concentration of the enzyme can be easily estimated. For example, a reaction rate of ~5×10⁻⁸ Ms−1 is recommended for 30 min time courses. If an activator is used in the reaction mixtures (such as actin here), it is recommended to run the experiments both in the presence and absence of the activator to ensure that the expected effect (activation) is present. The conditions and the procedure must follow the final protocol as closely as possible. Here, a dilution series of myosin was prepared in myosin buffer in eight microcentrifuge tubes first. Subsequently, a mix of LDH and PK enzymes were added. Finally, the reactions were started by adding substrate mix to each tube in parallel, using a multichannel pipette. Reaction mixes were immediately transferred to one row of the assay plate in triplicates. If actin was absent, actin buffer was used instead. No other parameters were changed (see paragraph 2.17 in the protocol for final assay conditions).
Figure 2E shows ATP consumption rates obtained for multiple negative and positive control reactions (half plate each). These data can be compared based on the Z` value or “screening window coefficient”26, which is a widely used statistical parameter to estimate the quality of high-throughput assays. It compares the positive and negative controls by taking both the means and the standard deviations into account:
where σn, σp and μn, μp are the standard deviations and means of the negative and positive controls, respectively. The two populations are well separated if the Z` value falls between 0.5 and 1. A Z`=0.78 obtained here shows that the assay can be considered as excellent26.
To demonstrate that the assay can be used to determine inhibitory constants, the small molecule myosin inhibitor blebbistatin8 and two analogues, para-nitroblebbistatin12 and para-aminoblebbistatin13 have been chosen here, as shown in Figure 3A and 3B. Blebbistatin is an uncompetitive, allosteric myosin inhibitor27,28. One molecule of blebbistatin binds to one motor domain of myosin and blocks the ATPase cycle by stabilizing the myosin-ADP-phosphate complex27,28. Therefore, the inhibitory effects of blebbistatin derivatives was modelled using a simple, one-to-one binding model here (see paragraph 3.7 in the protocol above). Note that this model may not have been applicable if the ATP consumption rates had not shown linear dependency on myosin concentration (see Figure 2D and 2E). The kinetic aqueous solubility of blebbistatin, para-nitroblebbistatin and para-aminoblebbistatin has been reported to be 426 μM, 3.6 μM and 9.3 μM, respectively13. No abnormalities in the signal were observed at or below the reported solubilities in our experiments, however, several artifacts appeared when either blebbistatin or para-nitroblebbistatin were used above their reported solubility values, as shown in Figure 4. Therefore, the signal recorded at concentrations higher than the solubility was excluded from the data analysis in these cases. Para-aminoblebbistatin is highly soluble, therefore, solubility was not a limiting factor in that case.
Figure 3. Dose-response curves and analysis of inhibitory constants.
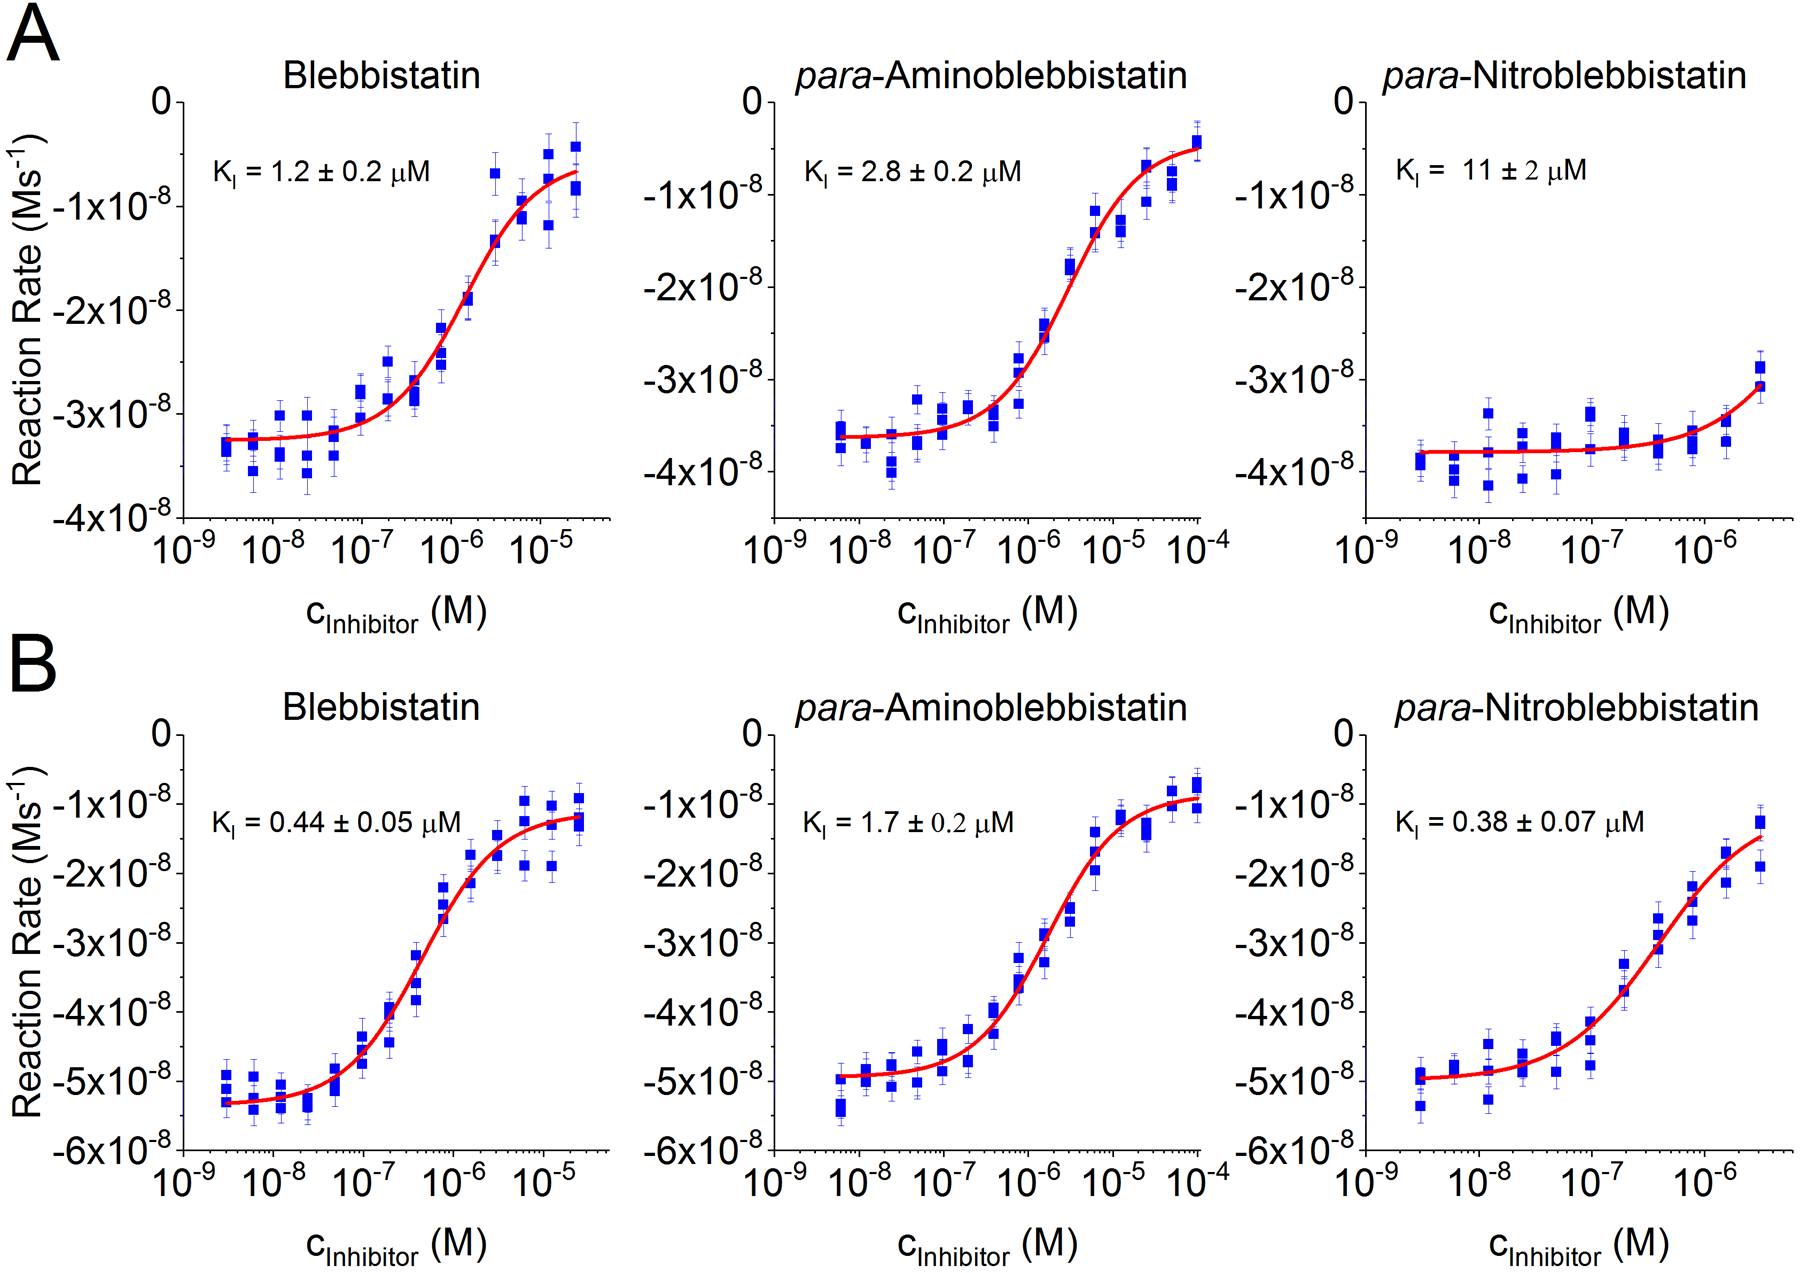
Cardiac (A) and skeletal (B) muscle myosin II’s were used to test the inhibitory activity of blebbistatin, para-aminoblebbistatin and para-nitroblebbistatin. ATPase rates (blue) were obtained by applying simple linear regression to the raw fluorescence data. Error bars represent the standard error of fitting and were used as weighting factors during fitting a quadratic equation (see paragraph 3.7 in the protocol) representing a simple equilibrium binding model (red). Data obtained above solubility was influenced by artifacts and excluded from analysis.
Figure 4. Solubility-related artifacts.

(A) Fluorescence intensity traces for blebbistatin obtained in an ATPase assay using skeletal muscle myosin II show linearly decreasing signal depending on the amount of inhibitor present (blue). However, when blebbistatin was used above solubility (50 μM initial blebbistatin concentration), an increase in the signal was observed (red), most likely due to the formation of brightly fluorescent blebbistatin crystals13. (B) In the case of para-nitroblebbistatin, which is a non-fluorescent analog of blebbistatin12, the raw fluorescence intensity traces appeared normal (decreasing). However, the highest level of inhibition was much lower than expected (based on the positive control). Therefore, only the reaction rates obtained below solubility (blue) were included in data analysis. Reaction rates obtained above solubility (red) diverge from the determined dose-response curve (green), as precipitation limits the amount (concentration) of the inhibitor remaining in solution.
DISCUSSION:
Critical steps in the protocol.
Optimize plate layout by running several plates with negative control only (ATPase reaction with no inhibitor). Inspect the results carefully for patterns in reaction rates. For example, these may arise from edge effects and/or imperfections in the hydrophilic surface coating of “non-binding” plates. If a pattern is observed, change plate type and/or plate layout to minimize the artifacts. For example, a typical dose-response curve (16 concentrations with triplicates, 48 points total) can be either arranged in three columns or two rows on a 384 well plate. These arrangements yield 6 and 4 datapoints, respectively, that are likely affected by edge effects. Therefore, the row arrangement is always preferred.
Modifications and troubleshooting
Note that the observed fluorescence responses must be linear throughout the full time-course of the reaction. Non-linearities may occur in the first few minutes due to thermal changes or in the last few minutes due to reaching equilibrium. If non-linearities are present, one can either adjust reaction parameters (e.g. dilute myosin, change measurement temperature) or simply limit the analysis to the linear part of the data. Note that longer runs than 2 hours may lead to non-linearities due to solvent evaporation and/or protein precipitation.
Non-linearities may also be present at the beginning of the reactions if the binding of the inhibitor to the ATPase enzyme is slow (occurring over minutes). In this case, the reaction is expected to slow down over time as the enzyme-inhibitor complex accumulates. Incubate the assay plate before adding the substrate mix as necessary to avoid this problem.
The assay conditions must be chosen in such a way that the linear part of reactions is longer than 15 minutes. Shorter linear parts correspond to less useful datapoints (<20, as the scanning of the whole plate takes ~45 seconds). Therefore, the linear fits yield less reliable slopes (reaction rates) with much higher standard errors. On the other hand, it is not recommended to obtain kinetic reads longer than ~120 minutes. Such experiments might be affected by protein denaturation or concentration changes due to solvent evaporation. These criteria can be met most easily by adjusting the myosin concentration.
It is always recommended to exclude any observed ATPase rates obtained above the solubility of the inhibitor from the data analysis. As the solubility depends on the temperature, purity of the compound, and differences in the composition of the solution, it is highly recommended to measure it under conditions that are highly similar to the actual conditions (temperature, buffer, etc.) under which the ATPase assay is carried out. Attempting to use small molecule inhibitors above solubility may result in precipitation that could influence the results (see Figure 4). Precipitation limits the concentration of the compound at or near solubility. Therefore, the ATPase rates cannot be reduced further by adding more inhibitor. Using a good positive control that shows ~100 % inhibition, therefore, can help to identify such anomalies in the signal, even if the solubility is unknown. A high difference between the observed reaction rate of the positive control and the reaction rate belonging to the maximal inhibition level (Imax) determined by fitting is always a good indication of the problem. Gradually excluding more and more data from the analysis and/or using the positive control as Imax and keeping it fixed during the fitting process until a better fit is obtained is recommended in such cases. Inhibitor precipitation might also result in strong light scattering and may also change the optical properties of the inhibitor, leading to abnormally high observed signal intensities at the beginning of reactions and/or increasing signals over time. Raw data must always be carefully inspected, and the affected concentrations must be excluded from the analysis.
Limitations of the method.
The final assay concentration for ATPases with a low turnover number (e.g. cardiac muscle myosin II) must be high (several hundred nM) to achieve measurable reaction rates within time window of the assay (30–120 minutes). Therefore, it might be important to use the quadratic binding model for the analysis of dose-response curves. Other binding models (hyperbolic, Hill) are typically not suitable for the analysis of such data. Moreover, the concentration of the ATPase sets a lower limit to the range of measurable inhibitory constants because the dose response curves get indistinguishable in practice due to the presence of experimental errors if the KI is close to or less than the concentration of the ATPase.
Any compound inhibiting PK or LDH would give a false positive signal in the NADH-coupled ATPase assay. Some of these false positives can be identified by running the assay with an unrelated ADP producing enzyme. (In this case, no inhibition for real positive hits can be expected, unless the inhibitor is an ATP analogue binding to both enzymes.) Alternatively, a different functional assay specific to the enzyme of interest, or a different ATPase assay not employing PK and LDH can be run to distinguish between real and false positive hits.
Measurement and analysis of the kinetics of the fluorescence intensity in all wells requires a plate reader fast enough to scan the whole plate in less than ~90–60 seconds.
Significance of the method with respect to existing/alternative methods.
Opposed to the “traditional” absorbance-based readout16–20, the modified NADH-coupled ATPase assay presented here relies on NADH fluorescence. This makes the assay more sensitive, allowing the user to reduce excitation light intensity and thereby protect NADH or the inhibitors against photochemical decomposition.
Although the assay has been generally considered as not suitable for handling large number of samples29, the small reaction volumes achieved here (20 ul) in a 384 well format makes it amenable for semi-high throughput screening applications, especially if the determination of inhibitory constants is considered.
Alternative methods usually rely on the detection of the inorganic phosphate produced by the ATPase enzyme. For example, [γ−32P]ATP can be used as a substrate for the ATPase and subsequently, the liberated inorganic phosphate can be measured based on its radioactivity. The assay is sensitive; however, it requires the handling of radioactive substances and the remaining ATP must be separated from the inorganic phosphate (e.g. by adsorption of ATP on charcoal)30. In the above-mentioned malachite green assay, phosphate reacts with molybdate under acidic conditions and the resulting phosphomolybdate complex binds the malachite green dye causing a shift in its absorption spectrum19,21–24. This method also requires quenching of the ATPase reaction; therefore, it is mostly used as an endpoint-assay, especially in high throughput format. In contrast to the continuous monitoring of the ATPase reaction in the NADH-coupled assay, an endpoint assay simply assumes linear time courses and cannot reveal artifacts leading to non-linearities. Compounds interacting with malachite green or the complex formed may also lead to artifacts21. Moreover, the malachite green assay is very sensitive to phosphate contamination24. In contrast, the NADH-coupled assay is not sensitive to ADP contamination as ADP (which is always present at various levels in ATP samples) is quickly transformed to ATP by PK at the beginning of the reaction. There is no need for quenching or separation of the products. Another fluorometric assay for the measurement of ATPase rates has already been developed by coupling the ATP hydrolysis to the reaction catalyzed by nucleoside phosphorylase31. However, that assay does not utilize an ATP regeneration cycle, therefore the determination of initial reaction rates can be much more challenging.
Future applications or directions of the method.
Many enzymes relying on ATPase activity have been explored as potential drug targets. These include cytoskeletal motor proteins belonging to the kinesin32 and dynein families33 and the DNA helicases34, all of which are the terminal effectors in diverse signaling pathways. The assay described here can be easily optimized for drug discovery and development projects involving any enzyme catalyzing a reaction in which ADP is a product.
ACKNOWLEDGMENTS:
This work was supported by a grant from the National Institute of Neurological Disorders and Stroke and National Institute on Drug Abuse NS096833 (CAM).
Footnotes
DISCLOSURES:
The authors have nothing to disclose.
REFERENCES:
- 1.Heissler SM & Sellers JR Kinetic Adaptations of Myosins for Their Diverse Cellular Functions. Traffic. 17 (8), 839–859, (2016). [DOI] [PMC free article] [PubMed] [Google Scholar]
- 2.Hartman MA & Spudich JA The myosin superfamily at a glance. J Cell Sci. 125 (Pt 7), 1627–1632, (2012). [DOI] [PMC free article] [PubMed] [Google Scholar]
- 3.Berg JS, Powell BC & Cheney RE A millennial myosin census. Mol Biol Cell. 12 (4), 780–794, (2001). [DOI] [PMC free article] [PubMed] [Google Scholar]
- 4.Sebe-Pedros A, Grau-Bove X, Richards TA & Ruiz-Trillo I Evolution and classification of myosins, a paneukaryotic whole-genome approach. Genome Biol Evol. 6 (2), 290–305, (2014). [DOI] [PMC free article] [PubMed] [Google Scholar]
- 5.Newell-Litwa KA, Horwitz R & Lamers ML Non-muscle myosin II in disease: mechanisms and therapeutic opportunities. Dis Model Mech. 8 (12), 1495–1515, (2015). [DOI] [PMC free article] [PubMed] [Google Scholar]
- 6.He YM & Gu MM Research progress of myosin heavy chain genes in human genetic diseases. Yi Chuan. 39 (10), 877–887, (2017). [DOI] [PubMed] [Google Scholar]
- 7.Rauscher AA, Gyimesi M, Kovacs M & Malnasi-Csizmadia A Targeting Myosin by Blebbistatin Derivatives: Optimization and Pharmacological Potential. Trends Biochem Sci. 43 (9), 700–713, (2018). [DOI] [PubMed] [Google Scholar]
- 8.Straight AF et al. Dissecting temporal and spatial control of cytokinesis with a myosin II Inhibitor. Science. 299 (5613), 1743–1747, (2003). [DOI] [PubMed] [Google Scholar]
- 9.Sirigu S et al. Highly selective inhibition of myosin motors provides the basis of potential therapeutic application. Proc Natl Acad Sci U S A. 113 (47), E7448–E7455, (2016). [DOI] [PMC free article] [PubMed] [Google Scholar]
- 10.Green EM et al. A small-molecule inhibitor of sarcomere contractility suppresses hypertrophic cardiomyopathy in mice. Science. 351 (6273), 617–621, (2016). [DOI] [PMC free article] [PubMed] [Google Scholar]
- 11.Morgan BP et al. Discovery of omecamtiv mecarbil the first, selective, small molecule activator of cardiac Myosin. ACS Med Chem Lett. 1 (9), 472–477, (2010). [DOI] [PMC free article] [PubMed] [Google Scholar]
- 12.Kepiro M et al. para-Nitroblebbistatin, the non-cytotoxic and photostable myosin II inhibitor. Angew Chem Int Ed Engl. 53 (31), 8211–8215, (2014). [DOI] [PubMed] [Google Scholar]
- 13.Varkuti BH et al. A highly soluble, non-phototoxic, non-fluorescent blebbistatin derivative. Sci Rep. 6 26141, (2016). [DOI] [PMC free article] [PubMed] [Google Scholar]
- 14.Verhasselt S et al. Discovery of (S)-3’-hydroxyblebbistatin and (S)-3’-aminoblebbistatin: polar myosin II inhibitors with superior research tool properties. Org Biomol Chem. 15 (9), 2104–2118, (2017). [DOI] [PubMed] [Google Scholar]
- 15.Verhasselt S, Roman BI, Bracke ME & Stevens CV Improved synthesis and comparative analysis of the tool properties of new and existing D-ring modified (S)-blebbistatin analogs. Eur J Med Chem. 136 85–103, (2017). [DOI] [PubMed] [Google Scholar]
- 16.Warren GB, Toon PA, Birdsall NJ, Lee AG & Metcalfe JC Reconstitution of a calcium pump using defined membrane components. Proc Natl Acad Sci U S A. 71 (3), 622–626, (1974). [DOI] [PMC free article] [PubMed] [Google Scholar]
- 17.Kiianitsa K, Solinger JA & Heyer WD Rad54 protein exerts diverse modes of ATPase activity on duplex DNA partially and fully covered with Rad51 protein. J Biol Chem. 277 (48), 46205–46215, (2002). [DOI] [PubMed] [Google Scholar]
- 18.Hanzelmann P & Schindelin H Structural Basis of ATP Hydrolysis and Intersubunit Signaling in the AAA+ ATPase p97. Structure. 24 (1), 127–139, (2016). [DOI] [PubMed] [Google Scholar]
- 19.Hackney DD & Jiang W Assays for kinesin microtubule-stimulated ATPase activity. Methods Mol Biol. 164 65–71, (2001). [PubMed] [Google Scholar]
- 20.Kiianitsa K, Solinger JA & Heyer WD NADH-coupled microplate photometric assay for kinetic studies of ATP-hydrolyzing enzymes with low and high specific activities. Anal Biochem. 321 (2), 266–271, (2003). [DOI] [PubMed] [Google Scholar]
- 21.Carter SG & Karl DW Inorganic phosphate assay with malachite green: an improvement and evaluation. J Biochem Biophys Methods. 7 (1), 7–13, (1982). [DOI] [PubMed] [Google Scholar]
- 22.Henkel RD, VandeBerg JL & Walsh RA A microassay for ATPase. Anal Biochem. 169 (2), 312–318, (1988). [DOI] [PubMed] [Google Scholar]
- 23.Rowlands MG et al. High-throughput screening assay for inhibitors of heat-shock protein 90 ATPase activity. Anal Biochem. 327 (2), 176–183, (2004). [DOI] [PubMed] [Google Scholar]
- 24.Rule CS, Patrick M & Sandkvist M Measuring In Vitro ATPase Activity for Enzymatic Characterization. J Vis Exp. 10.3791/54305 (114), (2016). [DOI] [PMC free article] [PubMed] [Google Scholar]
- 25.Pardee JD & Spudich JA Purification of muscle actin. Methods Cell Biol. 24 271–289, (1982). [DOI] [PubMed] [Google Scholar]
- 26.Zhang JH, Chung TD & Oldenburg KR A Simple Statistical Parameter for Use in Evaluation and Validation of High Throughput Screening Assays. J Biomol Screen. 4 (2), 67–73, (1999). [DOI] [PubMed] [Google Scholar]
- 27.Kovacs M, Toth J, Hetenyi C, Malnasi-Csizmadia A & Sellers JR Mechanism of blebbistatin inhibition of myosin II. J Biol Chem. 279 (34), 35557–35563, (2004). [DOI] [PubMed] [Google Scholar]
- 28.Allingham JS, Smith R & Rayment I The structural basis of blebbistatin inhibition and specificity for myosin II. Nat Struct Mol Biol. 12 (4), 378–379, (2005). [DOI] [PubMed] [Google Scholar]
- 29.Sehgal P, Olesen C & Moller JV ATPase Activity Measurements by an Enzyme-Coupled Spectrophotometric Assay. Methods Mol Biol. 1377 105–109, (2016). [DOI] [PubMed] [Google Scholar]
- 30.Solinger JA, Lutz G, Sugiyama T, Kowalczykowski SC & Heyer WD Rad54 protein stimulates heteroduplex DNA formation in the synaptic phase of DNA strand exchange via specific interactions with the presynaptic Rad51 nucleoprotein filament. J Mol Biol. 307 (5), 1207–1221, (2001). [DOI] [PubMed] [Google Scholar]
- 31.Banik U & Roy S A continuous fluorimetric assay for ATPase activity. Biochem J. 266 (2), 611–614, (1990). [PMC free article] [PubMed] [Google Scholar]
- 32.Xiao YX & Yang WX KIFC1: a promising chemotherapy target for cancer treatment? Oncotarget. 7 (30), 48656–48670, (2016). [DOI] [PMC free article] [PubMed] [Google Scholar]
- 33.See SK et al. Cytoplasmic Dynein Antagonists with Improved Potency and Isoform Selectivity. ACS Chem Biol. 11 (1), 53–60, (2016). [DOI] [PMC free article] [PubMed] [Google Scholar]
- 34.Datta A & Brosh RM Jr. New Insights Into DNA Helicases as Druggable Targets for Cancer Therapy. Front Mol Biosci. 5 59, (2018). [DOI] [PMC free article] [PubMed] [Google Scholar]