Abstract
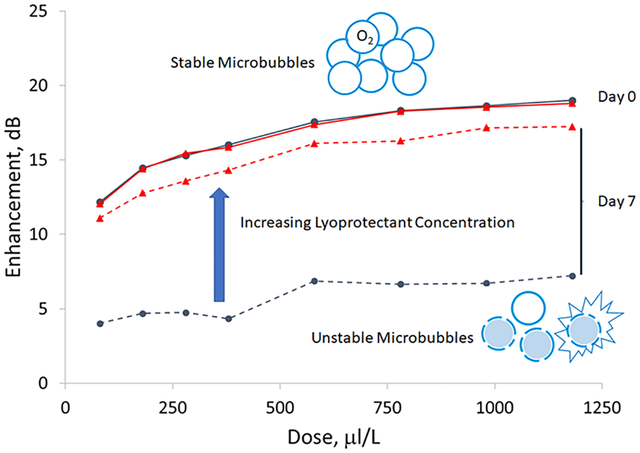
Ultrasound contrast agents consist of stabilized microbubbles. We are developing a surfactant-stabilized microbubble platform with a shell composed of Span 60 (Sorbitan monostearate) and an emulsifying agent, water-soluble vitamin E (α-tocopheryl poly(ethylene glycol) succinate, abbreviated as TPGS), named SE61. The microbubbles act both as an imaging agent and a vehicle for delivering oxygen to hypoxic areas in tumors. For clinical use, it is important that a platform be stable under storage at room temperature. To accomplish this, a majority of biologicals are prepared as freeze-dried powders, which also eliminates the necessity of a cold chain. The interfaces among the surfactants, gas, and liquids are subject to disruption in both the freezing and drying phases. Using thermocouples to monitor temperature profiles, differential scanning calorimetry to determine the phase transitions, and acoustic properties to gauge the degree of microbubble disruption, the effects of the freezing rate and the addition of different concentrations of lyoprotectants were determined. Slower cooling rates achieved by freezing the samples in a −20 °C bath were found to be reproducible and produce contrast agents with acceptable acoustical properties. The ionic strength of the solutions and the concentration of the lyoprotectant determined the glass-transition temperature (Tg′) of the frozen sample, which determines at what temperature samples can be dried without collapse. Crucially, we found that the shelf stability of surfactant-shelled oxygen microbubbles can be enhanced by increasing the lyoprotectant (glucose) concentration from 1.8 to 5.0% (w/v), which prevents the melt temperature (Tm) of the TPGS phase from rising above room temperature. The increase in glucose concentration results in a lowering of Tm of the emulsifying agent, preventing a phase change in the liquid-crystalline phase and allowing for more stable bubbles. We believe that preventing this phase change is necessary to producing stabilized freeze-dried microbubbles.
Graphical Abstract
INTRODUCTION
Ultrasound contrast agents have evolved dramatically since researchers first identified that the shadowing on an ultrasound scan upon injection of indocyanine green was from a swarm of tiny bubbles generated at the needle tip.1 Stabilized microbubbles now span a wide spectrum of chemical compositions and potential clinical applications, from conventional ultrasound imaging and nonlinear imaging through targeting and molecular imaging to multimodal imaging and drug and gene delivery.2,3 By virtue of the large differences in the acoustical impedance between the gas within these agents and the surrounding fluid (blood), substantial acoustic backscattering is created, which increases the overall contrast of the ultrasound image.4 For intravenous injection, the agents must be less than 6 μm in diameter to transit the pulmonary bed and must possess a stabilizing shell, usually a phospholipid, polymer, or surfactant. While a majority of reports involve phospholipid shells, others have included such compounds as poloximer, PEG-40-stearate, and poly(vinyl alcohol), used singly and in combination with lysozyme.5–8 We have investigated surfactant-stabilized microbubbles that are formed by the sonication of a dual surfactant solution that is saturated with a perfluorocarbon (PFC) gas. The mixed surfactants self-assemble around hydrophobic gas bubbles forced out of solution by cavitation. We are developing a surfactant-stabilized microbubble platform with a shell composed of sorbitan monostearate (Span 60) and water-soluble vitamin E (α-tocopheryl poly(ethylene glycol) succinate, abbreviated as TPGS), which we have named SE61. This is a second-generation agent in which we have employed highly versatile TPGS9 to replace the less biocompatible Tween 80 (polysorbate 80) used in the initial agent, ST68. The SE61 microbubbles are first generated in phosphate-buffered saline (PBS) purged with PFC gas (labeled SE61PFC) because the highly hydrophobic and dense gas produces the highest yields. Freeze-drying these bubbles gives the added advantage that they can be charged with a gas of choice, even one that would have produced a much diminished yield compared to that of the PFC. Our group has successfully investigated these microbubbles for oxygen delivery to hypoxic tumors.10,11
Two components are typically needed to form a monolayer shell of a stabilized microbubble: an insoluble matrix-forming component with a transition temperature above the working temperature and an emulsifying agent that promotes the self-assembly of the shell and forms a brush layer that shields against coalescence.12 In our case, Span 60 acts as the matrix-forming component and Tween 80 or TPGS acts as the emulsifying agent, which creates a monolayer that inhibits the encapsulated gas from diffusing across the shell, reduces surface tension, and prevents coalescence. Using a Langmuir trough, Span was found to exist in the solid-condensed (gel) phase at the collapse point, Tween was found to be a liquid-expanded phase at the interface, and a mixture of the two appeared to have multiple phases, leading to the conclusion that at the collapse pressure the shell was composed of a solid-condensed monolayer with the Tween headgroups squeezed out of the plane of the Span.13,14 The importance of the solid phase of the monolayer in inhibiting gas diffusion and reducing the Laplace surface tension was corroborated by later work on phospholipid bilayers.15–17 However, monolayer surfaces of stabilized microbubbles have been found not to be uniform but to have a polycrystalline domain microstructure with grain boundaries dependent on the transition temperature, with phase coexistence observed in lipid-stabilized microbubbles composed of condensed-phase lipid domains and the emulsifier in the expanded phase.18,19 This phase separation has been shown to be driven thermodynamically by the shell components opposed to the shell-formation process, with a single miscible phase formed near or above the main matrix phase-transition temperature and a two-phase coexistence observed below the main transition temperature.20,21
For clinical use, it is essential that the platform is stable under storage at room temperature. A majority of biologicals are prepared as freeze-dried powders, which extends the shelf life and avoids the necessity of a cold chain. Currently, the only freeze-dried ultrasound contrast agent approved, both centrally in Europe in 2001 to enhance the echogenicity of the blood and in the United States for use in the liver, is Sonovue (originally BR1). It is described as a pyrogen-free lyophilized product with a gas phase of sulfur hexafluoride. The lyophilizate is made up of a combination of pharmaceutical-grade poly(ethylene glycol) 4000 and phospholipids (distearoylphosphatidylcholine and dipalmitoylphosphatidylglycerol).22 Because the reported ingredients consist solely of phospholipid and poly(ethylene glycol) 4000, in this case the poly(ethylene glycol) 4000 appears to be acting as a lyoprotectant.23 Sonazoid, approved in Japan, Norway, and South Korea, is described as a powder for injection and consists of microspheres of perfluorobutane stabilized by a monomolecular membrane of hydrogenated egg phosphatidyl serine embedded in an amorphous sucrose structure and thus is reported to be stabilized by a sugar.24
With the use of SE61O2, our intention is to deliver oxygen to hypoxic areas of tumors prior to radiation therapy using ultrasound disruption of the intravenously injected microbubbles while focusing medical ultrasound on the hypoxic area.11,25 The tumor not only receives localized gas delivery but also is thrown into sharp contrast by the ultrasound-reflective microbubbles. We have shown that when filled with oxygen the platform is capable of raising the mean tumor oxygen partial pressure (pO2) to as much as 20 mmHg of oxygen, enough to restore radiation sensitivity, resulting in slowed tumor growth and increased survival time.26,27 Lampe et al. noted that understanding molecular events occurring at continuous and dispersed phase interfaces is of interest in many physiological, pathological, and technological processes.28 The fragile nature of a surfactant-stabilized microbubble at the gas–liquid interface when in a suspension and in the dry state presents challenges. The various stages of lyophilization–freezing (solidification and separation of ice crystals), primary drying (sublimation of the ice), and secondary drying (desorption of the remaining liquid water) can cause a loss of integrity of the surfactant monolayer by various mechanisms, including aggregation, fusion, and collapse.29
During freezing, ice crystals of pure water are formed, resulting in an increasing concentration of solutes in the remaining liquid. The suspending liquid containing additives and the surfactant-stabilized microbubbles becomes increasingly viscous, inhibiting further crystallization and leading to a mixed amorphous/crystalline phase containing bound, uncrystallized water. Mixtures will increase in concentration as freezing progresses until a temperature is reached at which further cooling does not change the concentration. This temperature is known as the glass-phase transition temperature (Tg′) of the maximally cryo-concentrated solution. The increase in concentration can encourage aggregation and fusion, while the formation of ice crystals can impart mechanical stress. To ameliorate these, cryoprotectants are added. Furthermore, the rate of cooling can impact the crystal formation. Rapid cooling (for example, supercooling with liquid nitrogen) creates smaller crystals which can reduce stress.30 Slower cooling, however, has been shown to improve freeze-drying and decrease the drying time.31 We have previously reported that microbubbles without cryoprotectant can be frozen and thawed without the loss of acoustic properties,32 indicating that damage due to ice crystallization is minimal; however, the effect of freezing rates on SE61 lyophilization has not been investigated.
Damage during the drying phase can be minimized by the addition of lyoprotectants such as sugars, which can stabilize the surfactant monolayer. The level of stabilization appears to be dependent on the concentration. For example, 5% (w/v) has been reported to maximally stabilize nanocapsules.29 Our laboratory has previously investigated various types and concentrations of sugars and determined that for ST68 a total solution of 1.8% (w/v) (100 mM) glucose preserved the acoustical properties of our stabilized bubbles.32 The mechanisms of how sugar lyoprotectants stabilize during drying have been explained by several theories. Sugars have been hypothesized to both hydrogen bond with the polar headgroups of the drying species (water-replacement hypothesis)33 and to form a stable glassy matrix that inhibits motion that can lead to a loss of structure (high-viscosity hypothesis).34,35 Another hypothesis is that rather than binding to the interface, sugars trap residual water at the interface by glass formation (water-entrapment hypothesis).36,37
The ability of sugars to stabilize dried liposomes, which share similarities to surfactant-stabilized microbubbles, has been extensively studied. The dehydration of phospholipids increases the liquid crystalline-to-gel melt transition temperature (Tm) so that temperatures normally resulting in the liquid crystalline phase are instead in the gel phase, and subsequently during rehydration, unprotected samples go through a transition back to the liquid-crystalline phase, causing liposome disruption.38 The addition of sugars in larger amounts can prevent this increase in Tm during drying and thus prevent liposome disruption during rehydration. This ability of sugars to reduce the phase-transition temperature of phospholipids has been shown to be largely due to the osmotic and volumetric properties of the sugars, including glucose and sorbitol.39,40 It has also been suggested that molecules positioned at the sugar–bilayer interface may behave differently than those in the glassy matrix by creating a mixed phase or accumulating water molecules.
The motivation for this study was that upon moving from the original ST68PFC platform to SE61O2 we experienced inconsistant results following the previously determined methods for freeze-drying developed for ST68PFC.32 One advantage of dealing with an ultrasound contrast agent is that the effects that various manipulations have on the integrity of the microbubbles can be monitored by conducting in vitro acoustic testing on the rehydrated samples because the reflection of the ultrasound requires the membrane of the microbubble to be intact. While we initially reported a maximum ultrasound enhancement of 17 dB at a dose of 880 mL/L, subsequent results were operator-dependent, sometimes with unsuitable maximum enhancement of less than 5 dB. Because consistent acoustic readings prior to freeze-drying yielded expected results, freeze-drying was identified as the critical step. Specifically, it was observed that slowing the rate of freezing of the microbubble solution by limiting the exposure to liquid nitrogen produced more intact microbubbles, as indicated by a better enhancement. We therefore quantified this new rate of freezing, determined a method to reliably reproduce it, and determined the acoustical and physical properties of SE61O2 created with this new process.
We also observed a loss of initial ultrasound enhancement during room-temperature storage of freeze-dried samples that exhibited acceptable initial acoustical properties. Shelf-life stability has not previously been tested for SE61O2 but has been reported as stable over several months for ST68PFC.32 In an initial investigation of 5.0% (w/v) solutions, glucose remained the lyoprotectant of choice, outperforming trehalose, poly(vinylpyrrolidone), and poly(vinyl alcohol) (unpublished results). We therefore investigated the shelf life of SE61O2 and the effect of increasing the concentration of glucose lyoprotectant. To investigate the stability of microbubble membranes at the interface during freeze-drying, we employed techniques including monitoring the freezing and drying temperature profiles, using differential scanning calorimetry (DSC) to determine the phase transitions during freezing and in dried samples, and using the acoustic response of the gas-filled and rehydrated agent with size and bubble counts to determine damage to the microbubble shell integrity.
EXPERIMENTAL SECTION
Materials.
Span 60 was obtained from Sigma-Aldrich (St. Louis, MO), and TPGS was obtained from Eastman Chemical Company (Kingsport, TN). d-(+)-Glucose anhydrous was obtained from Fluka BioChemica (Switzerland). Octafluoropropane (PFC) from Advanced Specialty Gasses (Reno, NV) and oxygen from Airgas (Radnor, PA) were passed through a 0.2 μm sterile filter before use. Countbright absolute counting beads (Life Technologies, Grand Island, NY, 0.54 × 10⁵ beads/50 μL) were used as a reference standard for the flow cytometer experiments. All other chemicals were analytical grade from Sigma-Aldrich (St. Louis, MO) and used as received.
Microbubble Fabrication.
Microbubble mixtures were fabricated on the basis of a previously reported method and then freeze-dried.10 Briefly, surfactant mixtures of TPGS and Span 60 with sodium chloride in PBS were autoclaved and then allowed to cool to room temperature under continuous stirring in order to form an intimate mixture and decrease the solid particle size. The cooled mixture was placed in a beaker in an ice bath and continuously sonicated at 20 kHz for 3 min at 110 W using a 0.5 in. probe horn (Misonix Inc., Farmingdale, NY). The solution was purged with a steady stream of PFC gas before and during the sonication. Microbubbles were separated from the mixture via gravity separation in a 250 mL glass separation funnel. While in the funnel, the solution forms three layers. The mixture was washed three times with cold (4 °C) PBS, with a 90 min separation after the first two washes and a 60 min separation after the final wash. During this separation time, the microbubbles collect in a middle band in the funnel, and after each wash, the bottom layer was discarded. After the third wash and separation, the middle microbubble fraction was collected after discarding the bottom layer. The collected microbubbles were then diluted 1:1 by volume with one of three lyoprotectant solutions, resulting in the following concentrations: 1.8% (w/v) glucose–PBS solution, 1.8% (w/v) glucose–water solution, and a 5.0% (w/v) glucose–water solution. Once mixed, 4 mL aliquots of SE61PFC solution were pipetted into 20 mL lyophilization vials obtained from West Pharmaceutical Services (Lionville, PA). Samples were frozen either by exposure to liquid nitrogen or by being placed in a recirculating chiller bath (Haake D1 and G, Germany) containing equal parts water and propylene glycol chilled to −20 °C. Once samples were frozen, lyophilization stoppers were placed on the vials to the first groove, the vials were placed on a previously chilled (−20 °C) shelf and dried for 18–20 h using a Virtis Benchtop freeze-dryer (Gardiner, NY) at pressures below 300 μbar and a condenser temperature of less than −70 °C. At the end of the cycle, prior to venting, a piston was lowered to seal the stoppers on the vials under vacuum.
Temperature Profiles.
To measure the temperature profile of samples during freezing and drying, type T thermocouples were placed in the vial, roughly in the center of the SE61PFC solution, and the temperature was recorded using an Omega (Norwalk, CT) HH147U data logger thermometer every second during freezing and once every 30 s during drying.
Sample Preparation.
Prior to acoustical testing, lyophilized samples were filled with oxygen, which was introduced via a needle through the stopper. Freeze-dried SE61O2 was then reconstituted by hand agitation with either 4 mL of DI water (glucose–PBS samples) or with 2 mL each of DI water and PBS (glucose–water samples) to create samples with identical salinity. All samples were stored at room temperature, approximately 22 °C.
Bubble Counting.
Particle counting was performed using an LSRII flow cytometer (BD Biosciences, San Jose, CA) at room temperature. Samples were prepared by adding 20 μL of reconstituted microbubbles to 0.5 mL of deionized water and 20 μL of UV Countbright absolute counting beads (containing 10 800 beads as a counting standard). Flow data were analyzed using FlowJo software (Tree Star, Inc. Ashland, OR, USA). Counting beads and SE61 microbubbles were first separated using forward scattering (FSC-A) and florescence (FITC-A gate), and then the remaining microbubbles were plotted using FSC-A vs side scattering (SSC-A) to observe changes in bubble populations and divided into four areas of interest based on the count density to obtain bubble counts. These quadrants were kept constant for all samples.
Microbubble Size Measurement.
The sizes of microbubbles were determined by dynamic light scattering measured using a Zetasizer Nano ZS (Malvern Inst., Worcestershire, U.K.). Samples of 50 μL were dispersed in 950 μL of PBS. Samples were measured at 25 °C using a backscattering angle of 173°, and the automatic measurement detection option was selected, resulting in a typical run time of 60 s. Samples were measured in triplicate, and particle sizes were reported as z averages based on the resultant intensity readings.
Acoustic Characterization.
To monitor acoustic behavior in vitro, we utilized a custom-built acoustic setup, which closely mimics in vivo conditions.41 Briefly, the setup consists of a pulsed A-mode ultrasound system fitted with an Olympus (Waltham, MA) 5 MHz transducer with a 12.7 mm diameter and a focal length of 49.3 mm. Acoustic pressure amplitudes were generated using a Panametrics pulser/receiver setup (model 5072 PR) using a pulse repetition frequency (PRF) of 100 Hz generating peak positive and negative pressures of 0.69 and 0.45 MPa, respectively. Received signals were amplified 40 dB and read using a digital oscilloscope (LeCroy 9350A, LeCroy Corp., Chestnut Ridge, NY), and the data were processed using LabView (National Instruments, Austin, TX). The transducer was focused through an acoustic window of a custom-made sample vessel submerged in a deionized water bath (37 °C), with the contents continuously stirred during testing. Cumulative dose response curves, that is signal returned to the transducer as a function of microbubble dose, were constructed by pipetting increments of SE61O2 into the sample chamber containing 50 mL of PBS at 37 °C while measuring the acoustic response. To examine the stability of SE61O2 while being exposed continuously to an ultrasound beam, a dose on the rise of the dose response curve, in this case 180 μL/L, was insonated over a 10 min period using the same acoustic parameters used for the dose response studies. Readings were taken every minute, starting at t = 0 (time immediately post injection), for a total of 11 readings, with data normalized by the initial dB value to allow for comparison.
Thermal Properties.
DSC scans of SE61PFC solutions and dried product were conducted using a T.A. Instruments Q2000 (New Castle, DE) differential scanning calorimeter. All samples started at 25 °C and were heated and cooled at a rate of 10 °C/min. For SE61 solutions, samples were cooled to −90 °C and then heated to 15 °C using a 20 μL sample. Dried SE61 samples were cooled to −20 °C and then heated to 80 °C using approximately a 3 mg sample.
Statistical Analysis.
All data are presented as a standard deviation about the mean. Acoustical data were measured from three microbubble lots, with each repeated three times (n = 3). Bubble counts and size data were obtained from one lot with each repeated three times (n = 1). Statistical significances between days for the acoustical stability study was determined via a multifactorial repeated measures ANOVA, while differences between size and bubble concentrations were determined using ANOVA and a Bonferroni post hoc (as needed), both using SPSS 25 (IBM, Armonk, NY).
RESULTS AND DISCUSSION
Determination of the Freezing Method.
During our previous in vivo studies, a method of freezing SE61 (1.8% (w/v) glucose in PBS) with liquid nitrogen was developed in which liquid nitrogen was slowly poured over agitated vials to gradually reduce the temperature. Measured temperature profiles of this method that produced viable echogenic microbubbles with a response higher than 15 dB, which we have determined is required for in vivo effectiveness,41 can be found in the solid lines in Figure 1 and show that the microbubble solution was brought to 0 °C over a period of around 1.5 min. The solution then remained at 0 °C for approximately 3 min as ice crystallization occurred and then was cooled rapidly by longer exposure to the liquid nitrogen. However, the exact freezing profile and resulting acoustic properties showed inter-batch variability. This was attributed to the high operator dependency of the pouring method. It was found that the successful freezing profile could be approximated reproducibly by utilizing a −20 °C chilled bath in which the vials were placed with mechanical agitation to keep the microbubbles suspended until frozen. The temperature profiles for samples frozen in the chilled bath, also in Figure 1, show a somewhat more rapid cooling followed by supercooling of the liquid before ice crystallization occurred after about 1 min. Mirroring the slow liquid nitrogen method, the microbubble solution remained at near 0 °C for approximately 2 to 3 min during ice crystallization and then slowly cooled to the bath temperature. After freezing by either method, the frozen samples were rapidly transferred to the stage of the freeze drier which had been cooled to −20 °C, and lyophilization was initiated.
Figure 1.
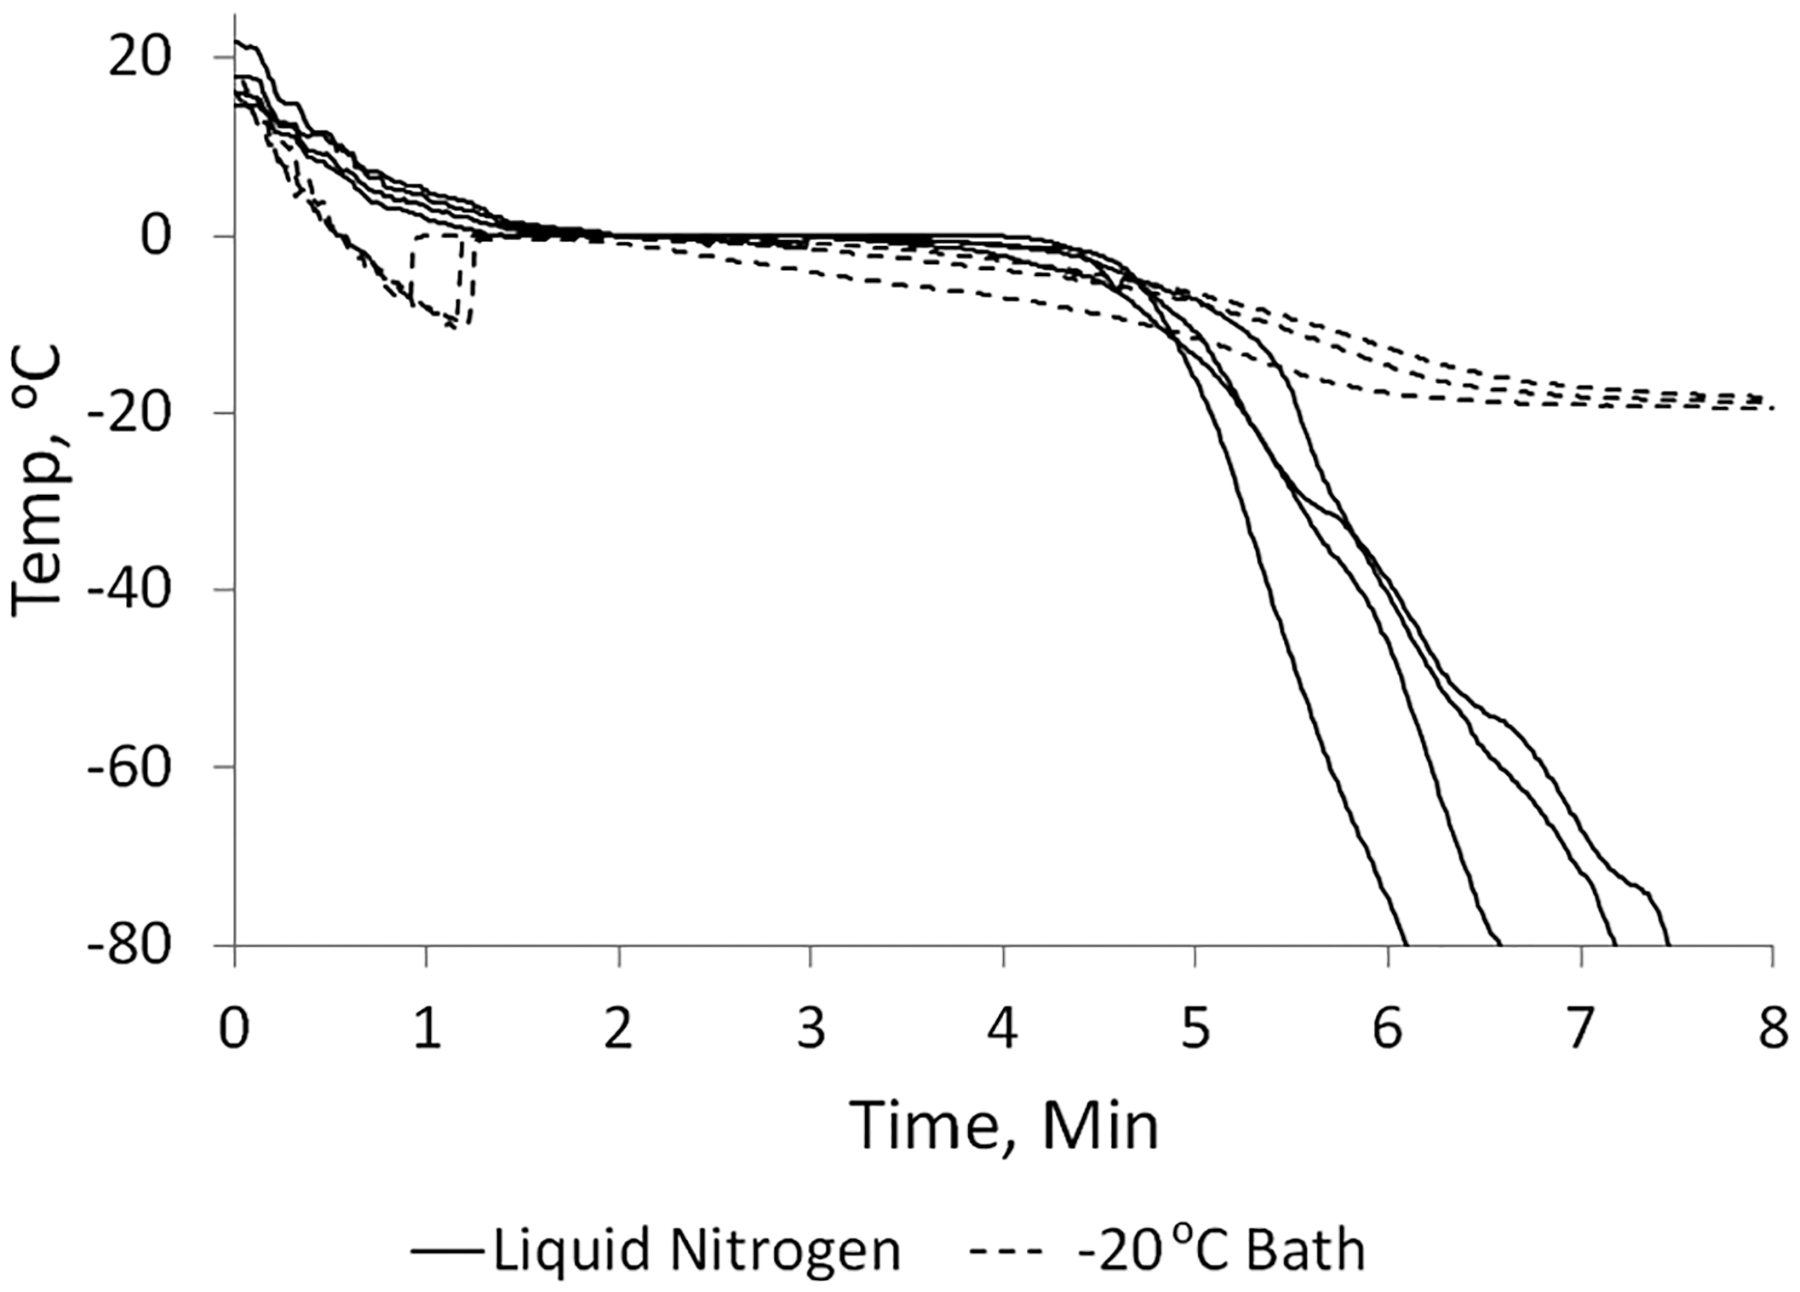
Typical temperature profiles of SE61PFC during freezing. Comparison of the use of liquid nitrogen or a −20 °C bath.
Acoustical Characterization.
Dose–response curves were conducted on SE61PFC samples prior to freezing (after diluting 1:1 with lyoprotectant), and SE61O2 was prepared with both freezing methods, charged with oxygen, and resuspended in water to give a final salt concentration equivalent to PBS. Recording of the SE61PFC echogenicity was continued until the profile was established. As Figure 2 shows, while freeze-drying results in a higher dose needed to achieve a echogenicity similar to that of the pre-freeze-dried samples, which have a value of 21.6 ± 0.4 dB at a smaller dose of 200 μL/L, both freezing methods produce SE61O2 with a reproducible enhancement equivalent to that previously reported.32 At a dose of 580 μL/L, the slow liquid nitrogen frozen and −20 °C bath samples have enhancements of 18.3 ± 0.5 and 20.2 ± 0.3 dB, respectively. Although statistically different (p < 0.01), both of these enhancements are greater than the 15 dB required for in vivo effectiveness;41 therefore, both methods were determined to produce suitable microbubbles. Freezing for the rest of the study was conducted using the −20 °C bath based on the ease of use and the potential to reduced operator variability. We believe that both methods, with reduced freezing rates compared to the previous method of immersing in liquid nitrogen, allowed the glucose to become more concentrated around the microbubbles, providing better protection during drying, as has been shown in the case of freeze-drying nanoparticles.31 The small improvement of using the −20 °C bath over the slow liquid nitrogen freezing is therefore a result of more control of the freezing profile, resulting in lower interlot variability.
Figure 2.
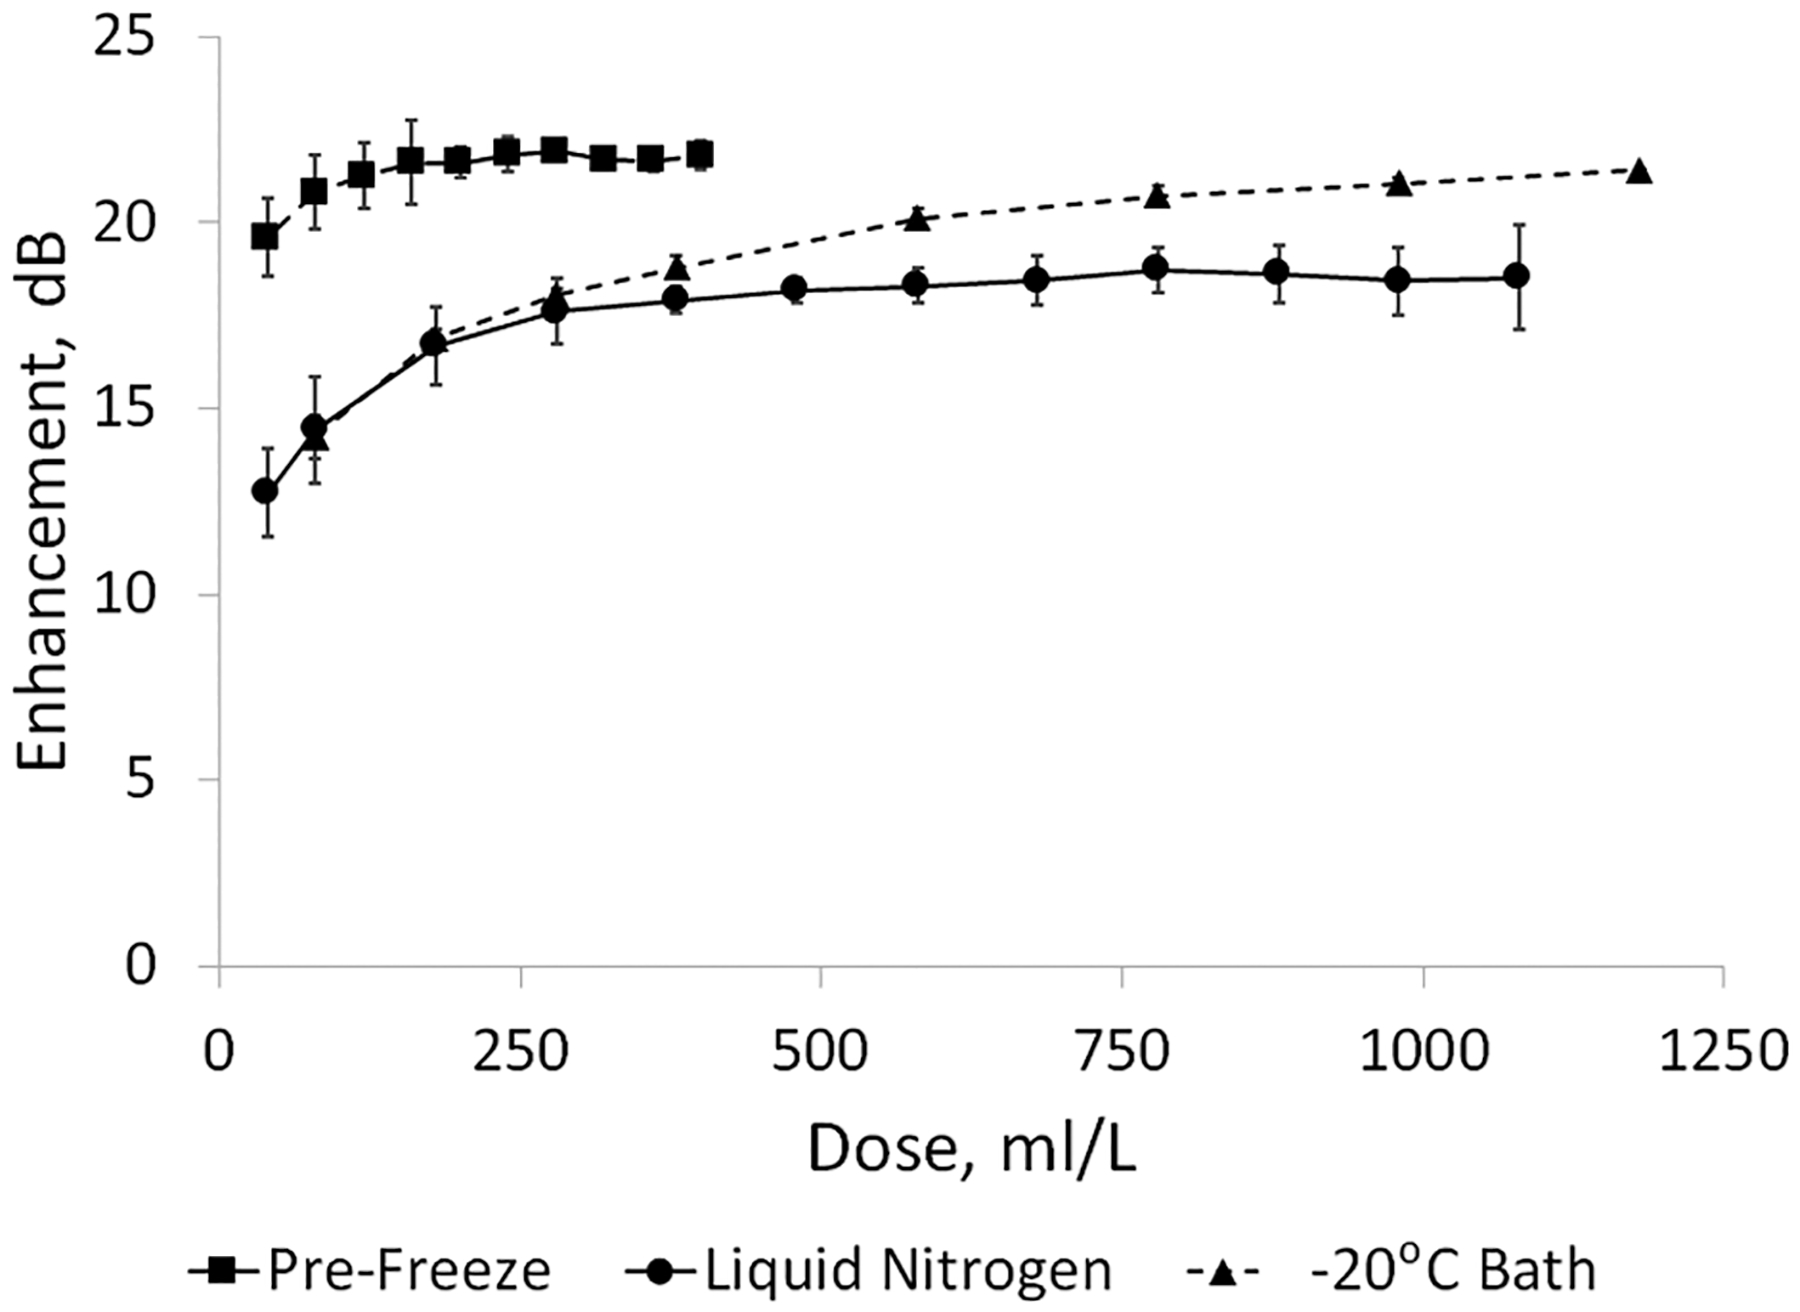
Dose–response curves of pre-freeze-dried SE61PFc and reconstituted SE61O2 as a function of the freezing method.
While the freeze-dried samples had a reduced enhancement and required a higher dose to achieve their maximum, these altered acoustical curves are in agreement with those reported with freeze-dried ST68.32 For a given bubble composition, acoustic enhancement is a function of bubble size and concentration, and these are summarized in Table 1. Prior to freezing SE61PFC bubbles were found to have an average size of 1.16 ± 0.2 μm and a concentration of (67.6 ± 4.3) × 107 bubbles/mL, while freeze-dried SE61O2 bubbles increased to 2.55 ± 0.4 μm (p < 0.01) with a decreased concentration of (17.8 ± 1.2) × 107 bubbles/mL (p < 0.01). The observed shift in the acoustical dose curve is a result of this decrease in bubble concentration. While bubbles are likely lost during drying, part of this decrease can be explained by the amount of solution used to reconstitute the freeze-dried bubbles. Historically, the amount of reconstitution fluid has equaled the amount of lyoprotectant and contrast bubbles (4 mL) added to the vials prior to freeze-drying. However, as half of that initial solution is microbubbles, which consist mainly of gas and not liquid, it follows that the freeze-dried samples are being reconstituted in a larger volume of liquid, potentially diluting the concentration.
Table 1.
Effect of Process Parameters on the Size and Bubble Count Dataa
| size | flow cytometery | ||||
|---|---|---|---|---|---|
| z average (μm) | total microbubbles/mL | microbubbles Q1 | microbubbles Q4 | ||
| prior to drying SE61PFC - 1.8% (w/v) glucose–PBS | day 0 | 1.16 ± 0.20 | (67.6 ± 4.3) × 107 | (29.6 ± 0.5) × 107 | (35.7 ± 3.5) × 107 |
| - 1.8% (w/v) glucose–PBS | day 0 | 2.55 ± 0.53 | (17.8 ± 1.2) × 107 | (3.6 ± 0.1) × 107 | (12.5 ± 1.2) × 107 |
| day 7 | 1.79 ± 0.23 | (9.6 ± 0.4) × 107 | (1.0 ± 0.0) × 107 | (7.5 ± 0.3) × 107 | |
| change | −29.7% | −45.9% | −72.8% | −40.2% | |
| - 1.8% (w/v) glucose–water | day 0 | 2.17 ± 0.40 | (22.8 ± 1.9) × 107 | (6.0 ± 1.1) × 107 | (14.6 ± 0.9) × 107 |
| day 7 | 1.39 ± 0.26 | (15.2 ± 0.9) × 107 | (1.9 ± 0.1) × 107 | (11.4 ± 0.7) × 107 | |
| change | −36.1% | −33.4% | −67.8% | −21.6% | |
| - 5.0% (w/v) glucose–water | day 0 | 1.47 ± 0.22 | (15.3 ± 2.4) × 107 | (3.1 ± 0.9) × 107 | (11.1 ± 1.3) × 107 |
| day 7 | 1.42 ± 0.16 | (11.8 ± 0.7) × 107 | (2.6 ± 0.4) × 107 | (8.1 ± 0.3) × 107 | |
| change | −3.3% | −22.5% | −18.0% | −26.9% | |
Conducted on single runs (n = 1) with samples run in triplicate.
Thermal Properties of SE61 Solutions.
During the drying cycle when samples were subjected to vacuum, frozen SE61 in a 1.8% (w/v) glucose–PBS solution could be observed to bubble and rise in the sample vials. After the completion of the freeze-drying cycle, meltback (collapse) of the final dried microbubble cake was also observed (Figure 3A) compared with intact cake in the 5.0% (w/v) glucose–PBS solution (Figure 3B) Therefore, the temperature profile of the sample during the drying step was determined, and DSC was conducted on the SE61PFC solutions prior to freeze-drying to determine melt and Tg′ properties. Typical recorded sample temperatures during freeze-drying are shown in Figure 4. Sample temperatures were between −15 and −20 °C by the end of shelf loading and then cooled due to sublimation after the application of vacuum, to between −40 and −45 °C. The samples remained at that temperature until the drying front approached the thermocouples at the base of the vial, about 4–6 h, rose past 0 °C as the front passed, and leveled off at room temperature once the entire sample had dried, at about 14–16 h. The reported collapse temperature of −42.7 °C for a 5% glucose solution,29 which is the maximum temperature that the product can withstand during primary drying without it melting or collapsing, is very close to the recorded sublimation temperature. For amorphous samples, collapse temperatures are near Tg′, which in the case of 5% glucose is −41.4 °C.29 This indicates that a stable freeze-dried product can likely be produced if the Tg′ of SE61 solution is similar to that reported for a 5% (w/v) glucose solution of nanoparticles.
Figure 3.
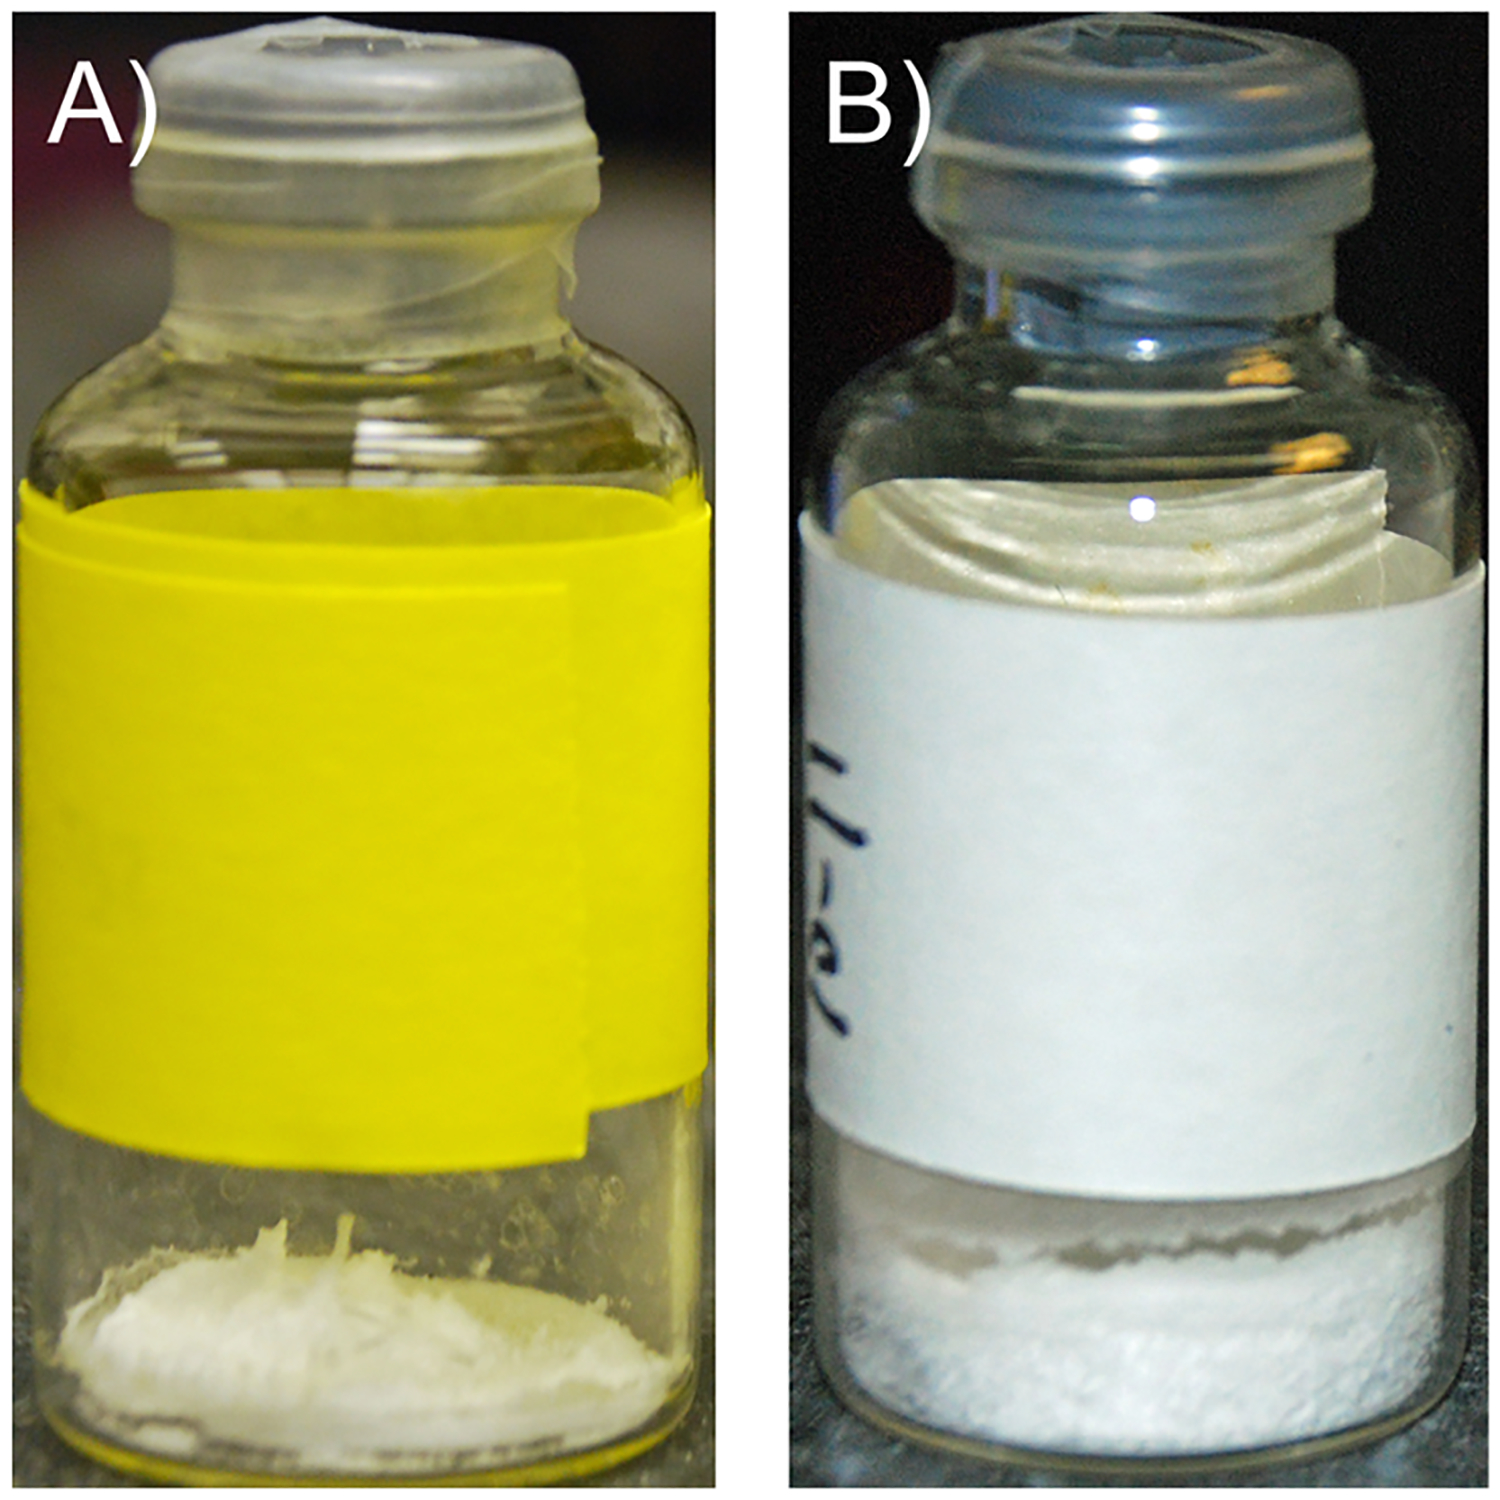
SE61 samples after freeze-drying prior to gas refilling. (A) SE61 in 1.8% (w/v) glucose–PBS showing product collapse. (B) SE61 in 5.0% (w/v) glucose–water showing an intact microbubble cake.
Figure 4.
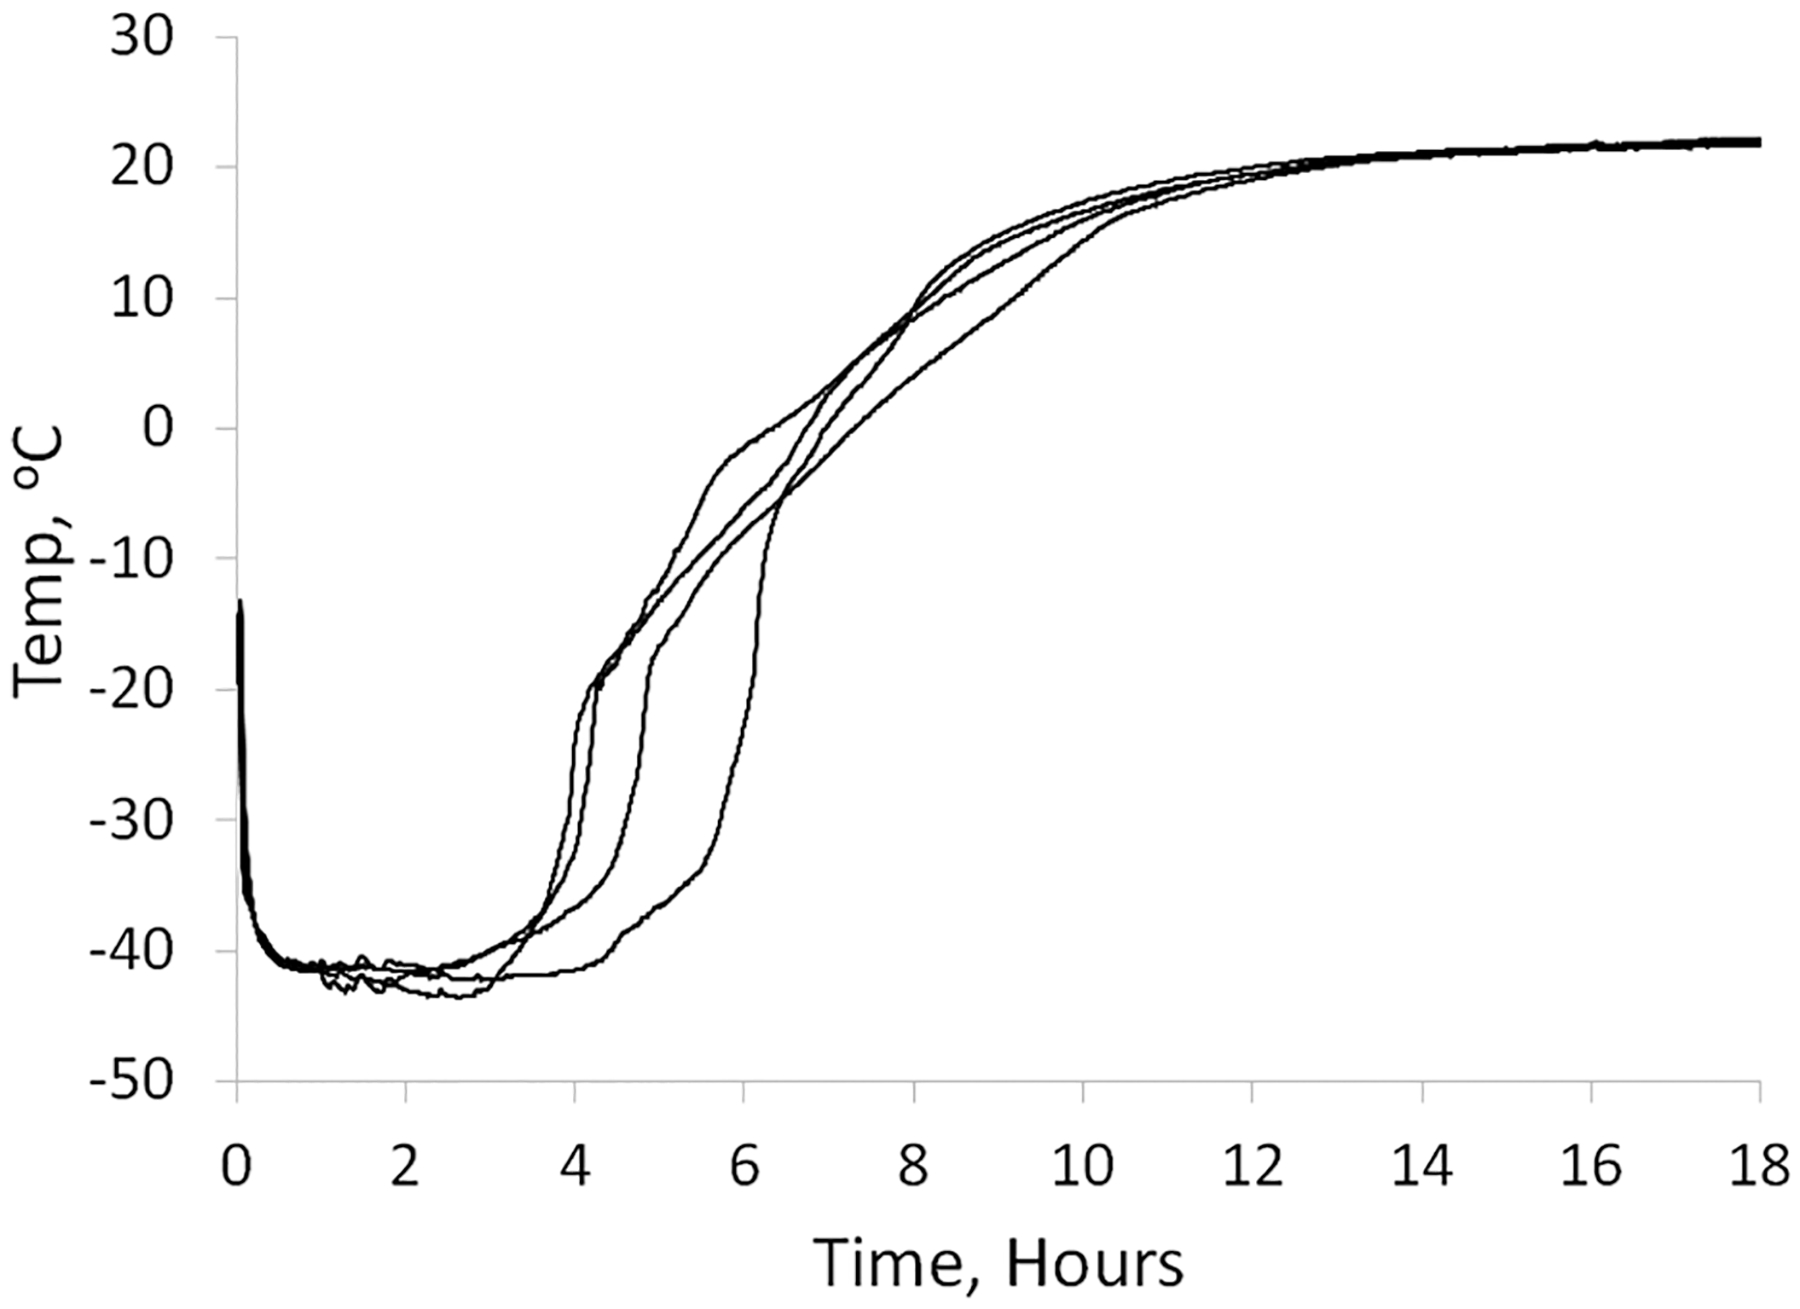
Typical SE61 sample temperatures during freeze-drying.
To further investigate the thermodynamic effects of the cryoprotectant, DSC was conducted on SE61PFC in three glucose solutions: 1.8% (w/v) glucose–PBS solution, 1.8% (w/v) glucose–water solution, and 5.0% (w/v) glucose–water solution. The results are shown in Figure 5. The effect of the lyoprotectant composition and concentration on the colligative properties can be seen in the overall DSC graphs (A). While all three samples have melt onsets near −15 °C and have similar melt peaks, 5% (w/v) glucose–water begins to melt at a lower temperature, while the 1.8% (w/v) glucose–water remains frozen at a slightly higher temperature. Differences in the crystallization temperature due to the different amounts of solutes were also observed during cooling (data not shown), with the PBS solution freezing near −20 °C, the 1.8% (w/v) glucose–water solution freezing at around −12 °C, and the 5.0% (w/v) glucose–water solution freezing at a temperature in between. This emphasizes that care needs to be taken during loading onto the freeze-drier to ensure that the temperature remains near or below −20 °C. All three glucose solutions showed two thermal transitions (B). SE61 in a 1.8% (w/v) glucose–PBS solution, the lyoprotectant used in the in vivo experiments,11 was found to have Tg′ values at −72 and −58 °C. Removing salts from the solution by replacing PBS with water resulted in the measured Tg′ values increasing to −68 and −51 °C. When the concentration of glucose was increased to 5.0% (w/v), the Tg′ values increased to −64 and −47 °C. These DSC data clearly show that the Tg′ is increased by removing salts and by increasing the glucose concentrations. However, in the absence of salt and with increasing glucose concentration, all three solutions present measured glass-transition temperatures lower than the temperature that is maintained by our freeze-drier, which would indicate that collapse might be expected during the drying phase. However, only samples made with glucose–PBS solutions were observed to suffer cake collapse and meltback after drying as glucose–water samples appeared intact (Figure 4B). Measured glass-transition temperatures can be affected by the rate of sample heating and cooling, with faster cooling and slower heating lowering the measured Tg′.42 Thus, the fact that intact samples were produced despite the measured Tg′ values for both glucose–water solutions being below the recorded sample temperature and the fact that the measured Tg′ for SE61 in 5.0% (w/v) glucose solution was below the reported collapse temperature can be explained by the fact that the DSC samples were not cooled in the same manner as the SE61 samples were frozen, as described above. The DSC analysis was intended to be used for comparison among lyoprotectants and is not a definitive measure. The creation of an intact, noncollapsed cake with glucose–water solutions also aligns with our laboratory’s initial development of the freeze-drying process, which utilized a 1.8% (w/v) glucose–water solution.32
Figure 5.
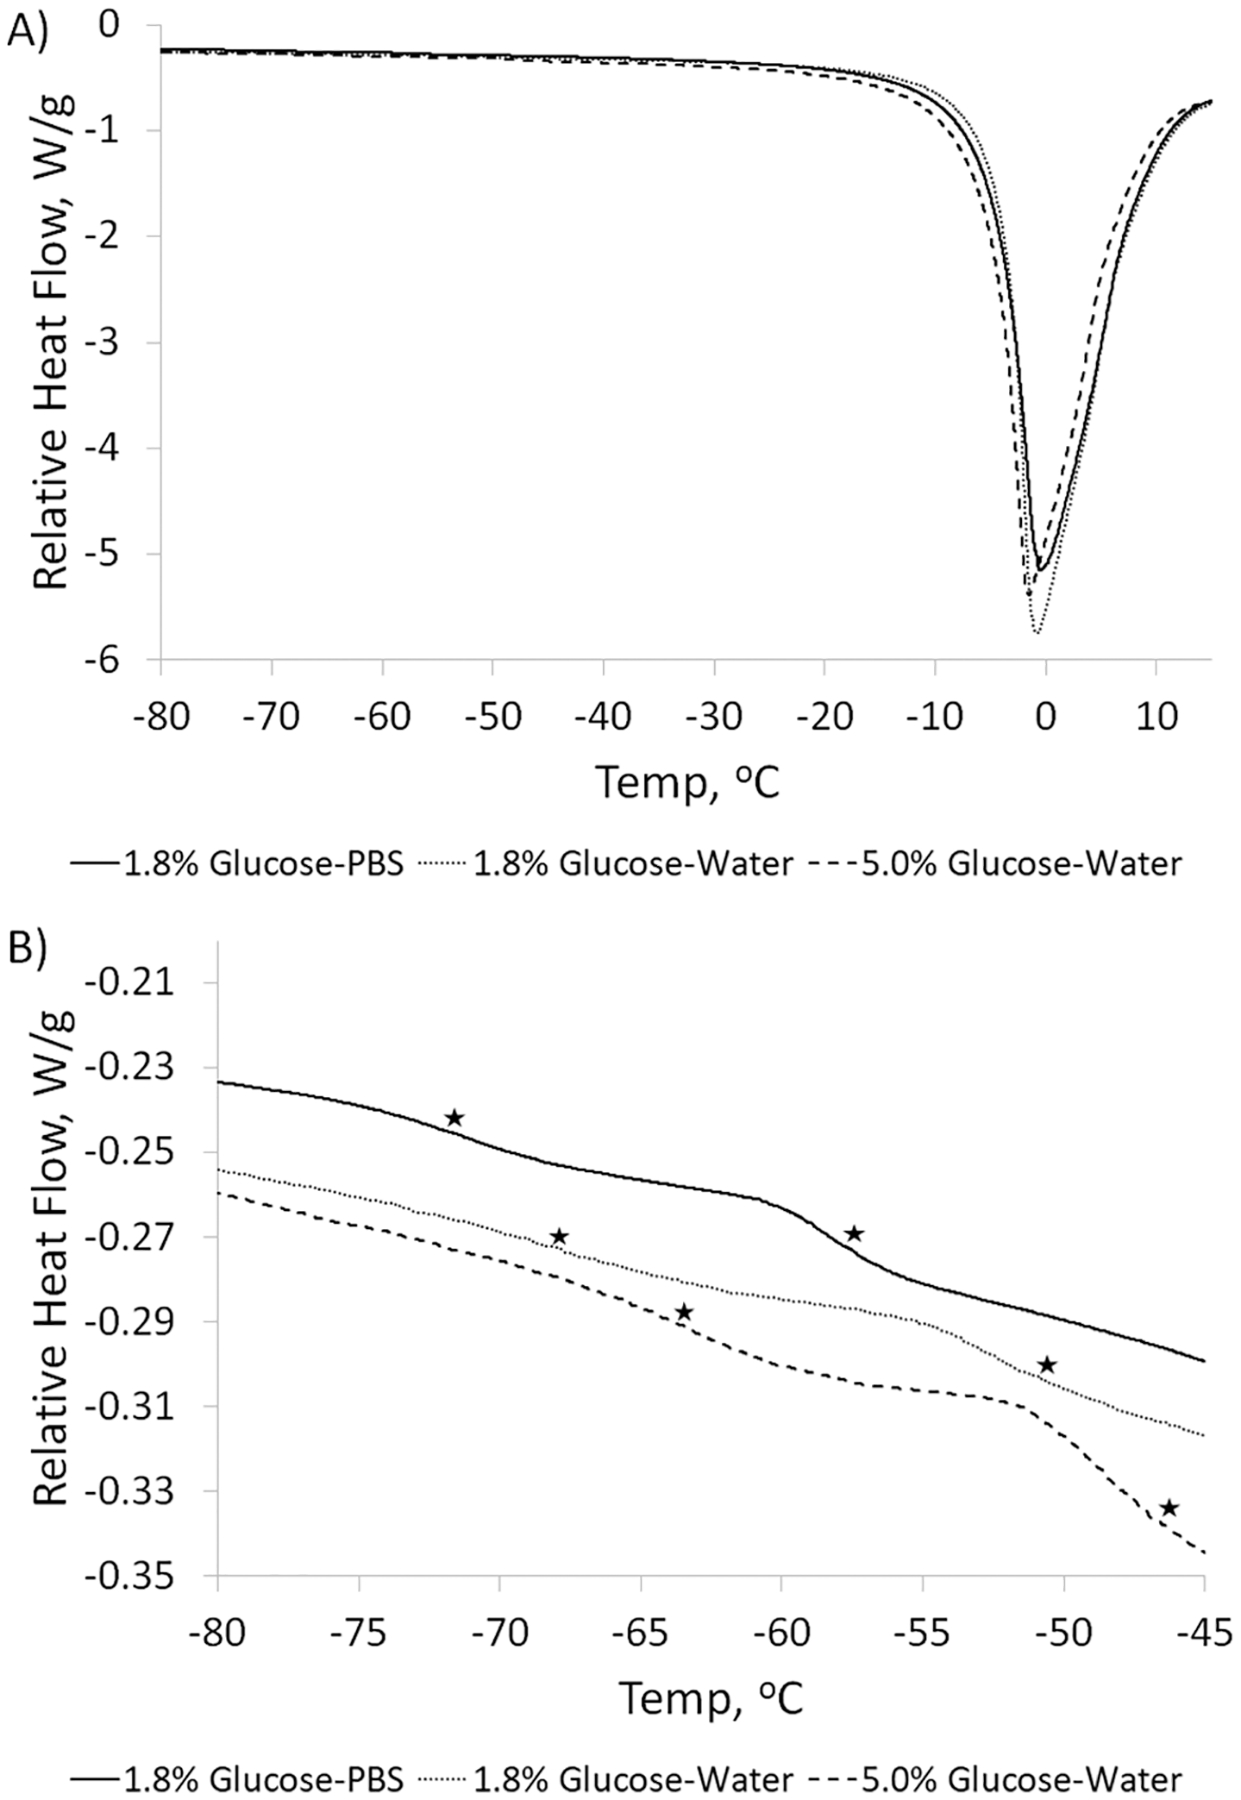
Differential scanning calorimetry curves of SE61PFC comprising the three lyoprotectants. (A) Overall curves showing the melt temperatures of the pure ice phase. (B) Detailed portion showing the Tg′ values of the solutions, marked with stars.
Shelf Life Study.
After observing a loss of enhancement due to storage at room temperature, a short-term shelf life study was conducted on SE61O2, with dose and time response curves constructed immediately after freeze-drying and after 7 days at room temperature. This study was conducted with SE61O2 created with the three lyoprotectant solutions tested by DSC. The acoustical evaluations are given in Figure 6. Curves for SE61O2 created with 1.8% (w/v) glucose–PBS (A and B) indicate a significant (p = 0.025) drop in the dose–response curve of approximately 7 to 8 dB across the curve, with enhancement at a dose of 580 mL/L decreasing from 21.4 ± 0.5 to 14.1 ± 1.6 dB. This loss was also observed in the time response, while not statistically significant (p = 0.075), in which at day = 0 the acoustical half-life (defined as the time at which the normalized echogenicity loses 50% of its initial value) was between 2 and 3 min but was approximately 1 for day = 7. This was then repeated with the use of 1.8% (w/v) glucose–water (C and D), which was reported to have a stable shelf life with ST68PFC. As with the PBS solution, removing the salts from the lyoprotectant did not result in initial shelf life stability for SE61O2, with significant decreases in both dose (p = 0.006) and time (p = 0.011) responses after 7 days. Thus, the addition of PBS to the SE61O2 solution was not responsible for the difference in shelf life compared to ST68PFC. The concentration of glucose was then increased to 5.0% (w/v) (E and F) to match the concentration reported in the literature to successfully stabilize nanocapsules. Although the dose response was slightly lower, no significant differences in the dose (p = 0.32) or the time (p = 0.89) responses were observed over the 7 days.
Figure 6.
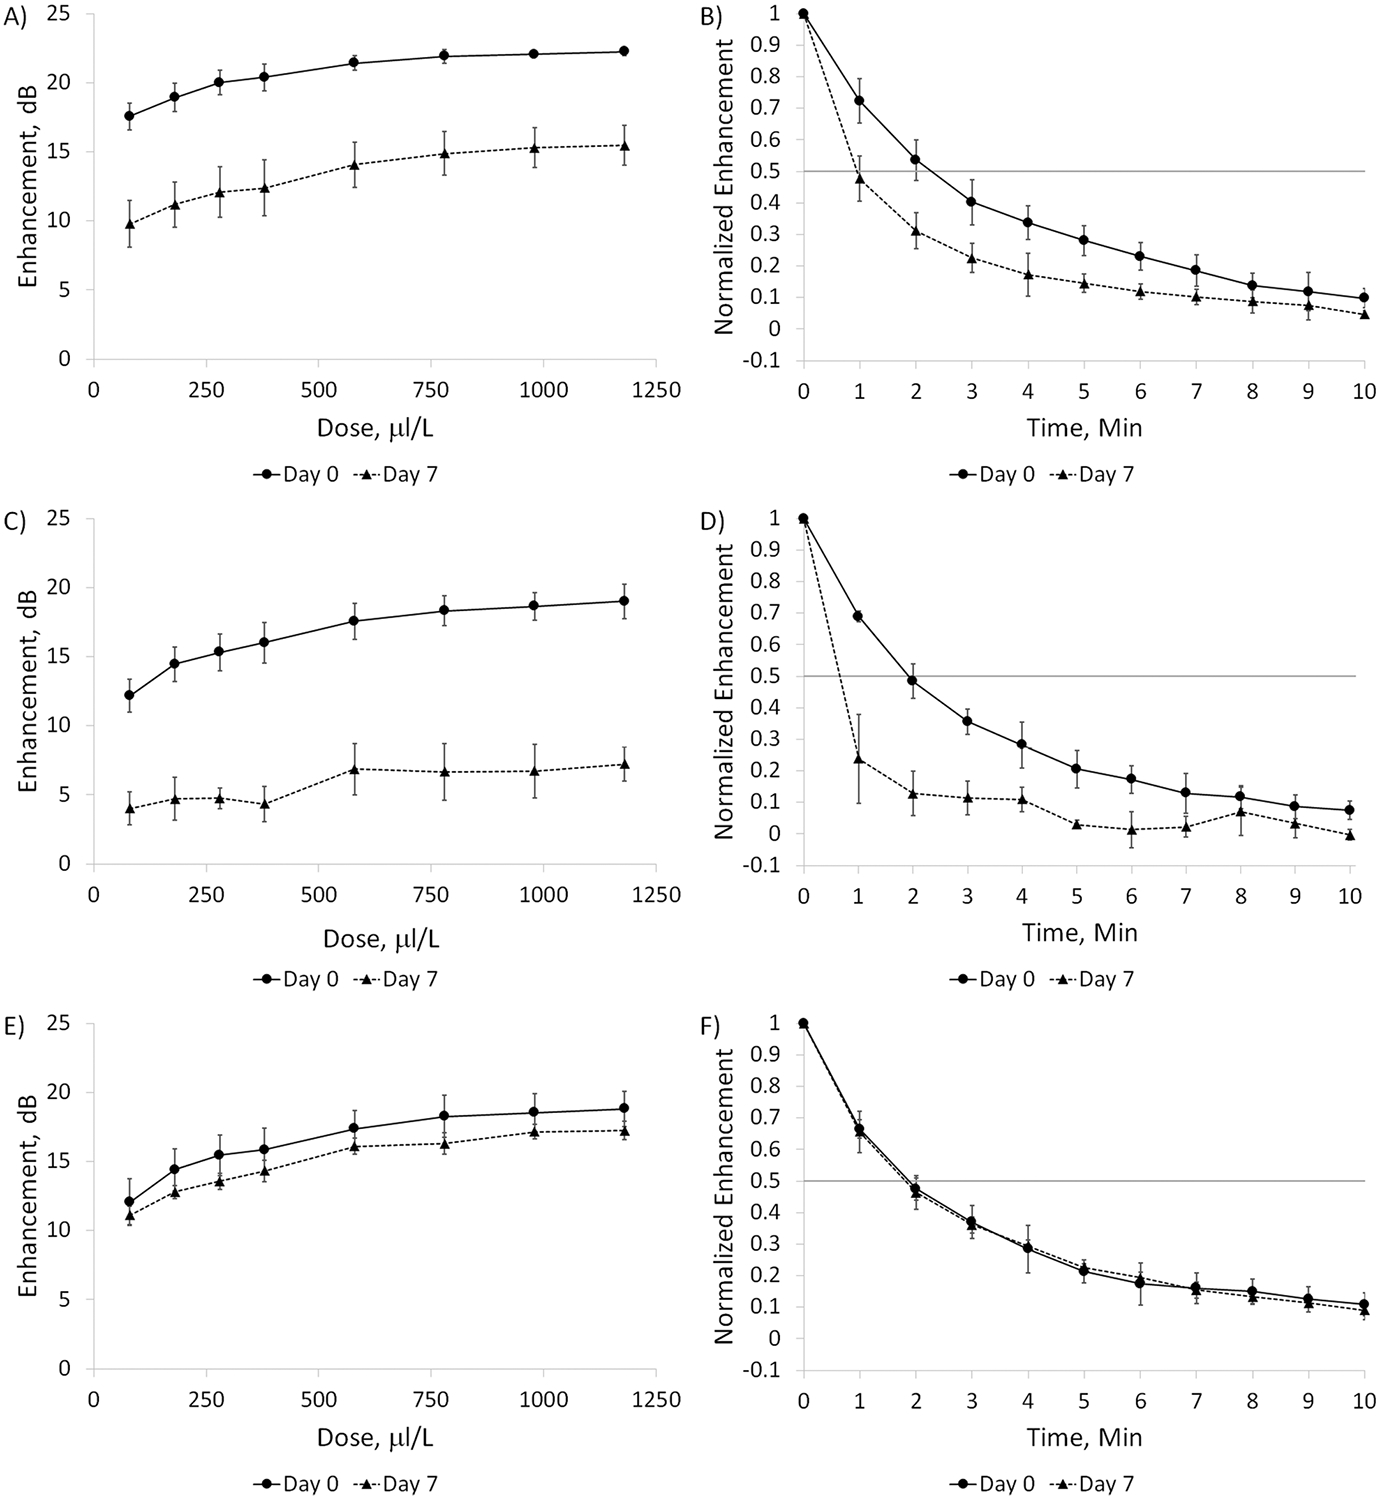
Dose and time response curves for SE61O2 at day = 0 and 7. (A) Dose and (B) time responses for SE61O2 with 1.8% (w/v) glucose–PBS. (C) Dose and (D) time responses for SE61O2 with 1.8% (w/v) glucose–water. (E) Dose and (F) time responses for SE61O2 with 5.0% (w/v) glucose–water.
Population Dynamics.
We also evaluated the bubble size using dynamic light scattering and the bubble count using flow cytometry for the three different lyoprotectants at day = 0 and 7, which can be found in Table 1 and Figure 7. The overall size averages for both SE61O2’s created with 1.8% (w/v) glucose–PBS and 1.8% (w/v) glucose–water lyoprotectants decreased between day = 0 and 7, from 2.55 ± 0.53 to 1.79 ± 0.23 μm (p = 0.121) and 2.1 ± 0.40 to 1.39 ± 0.26 μm (p = 0.046), along with the total microbubble concentration from (17.8 ± 1.2) × 107 to (9.6 ± 0.4) × 107 bubbles/mL (p = 0.024) and (22.8 ± 1.9) × 107 to (15.2 ± 0.9) × 107 bubbles/mL (p = 0.003). Interestingly, for both the 1.8% (w/v) glucose samples, when analyzed by quadrant, the percent losses of bubbles in quadrant 1 (Q1) were higher than the total percent loss and were lower in Q4, indicating a population change in addition to a loss of total bubbles. We believe that Q1 contains bubbles with substantial echogenicity while Q4 contains a proportion of smaller nonechogenic particles. This would also correspond to the reduction in size results at day = 7. Together, this indicates that the loss of enhancement found in the acoustical evaluations for both the 1.8% (w/v) glucose PBS and water samples is due to bubble loss. SE61O2 created with 5.0% (w/v) glucose–water differed in that there were nonsignificant changes in bubble size (1.47 ± 0.22 to 1.42 ± 0.16 μm, p = 0.773) and total microbubble concentration [(15.3 ± 2.4) × 107 to (11.8 ± 0.7) × 107 bubbles/mL, p = 0.070], and the change in each quadrant was similar to the overall changes, indicating that there was not a large change in relative bubble populations. Most importantly, the loss of bubbles in Q1, which we believe to contain mostly echogenic bubbles, was less than 20% compared to over 65% for both the 1.8% (w/v) glucose samples. This indicates that the 5.0% (w/v) glucose–water lyoprotectant is better at stabilizing microbubble acoustical properties by preventing the destruction of the microbubble population.
Figure 7.
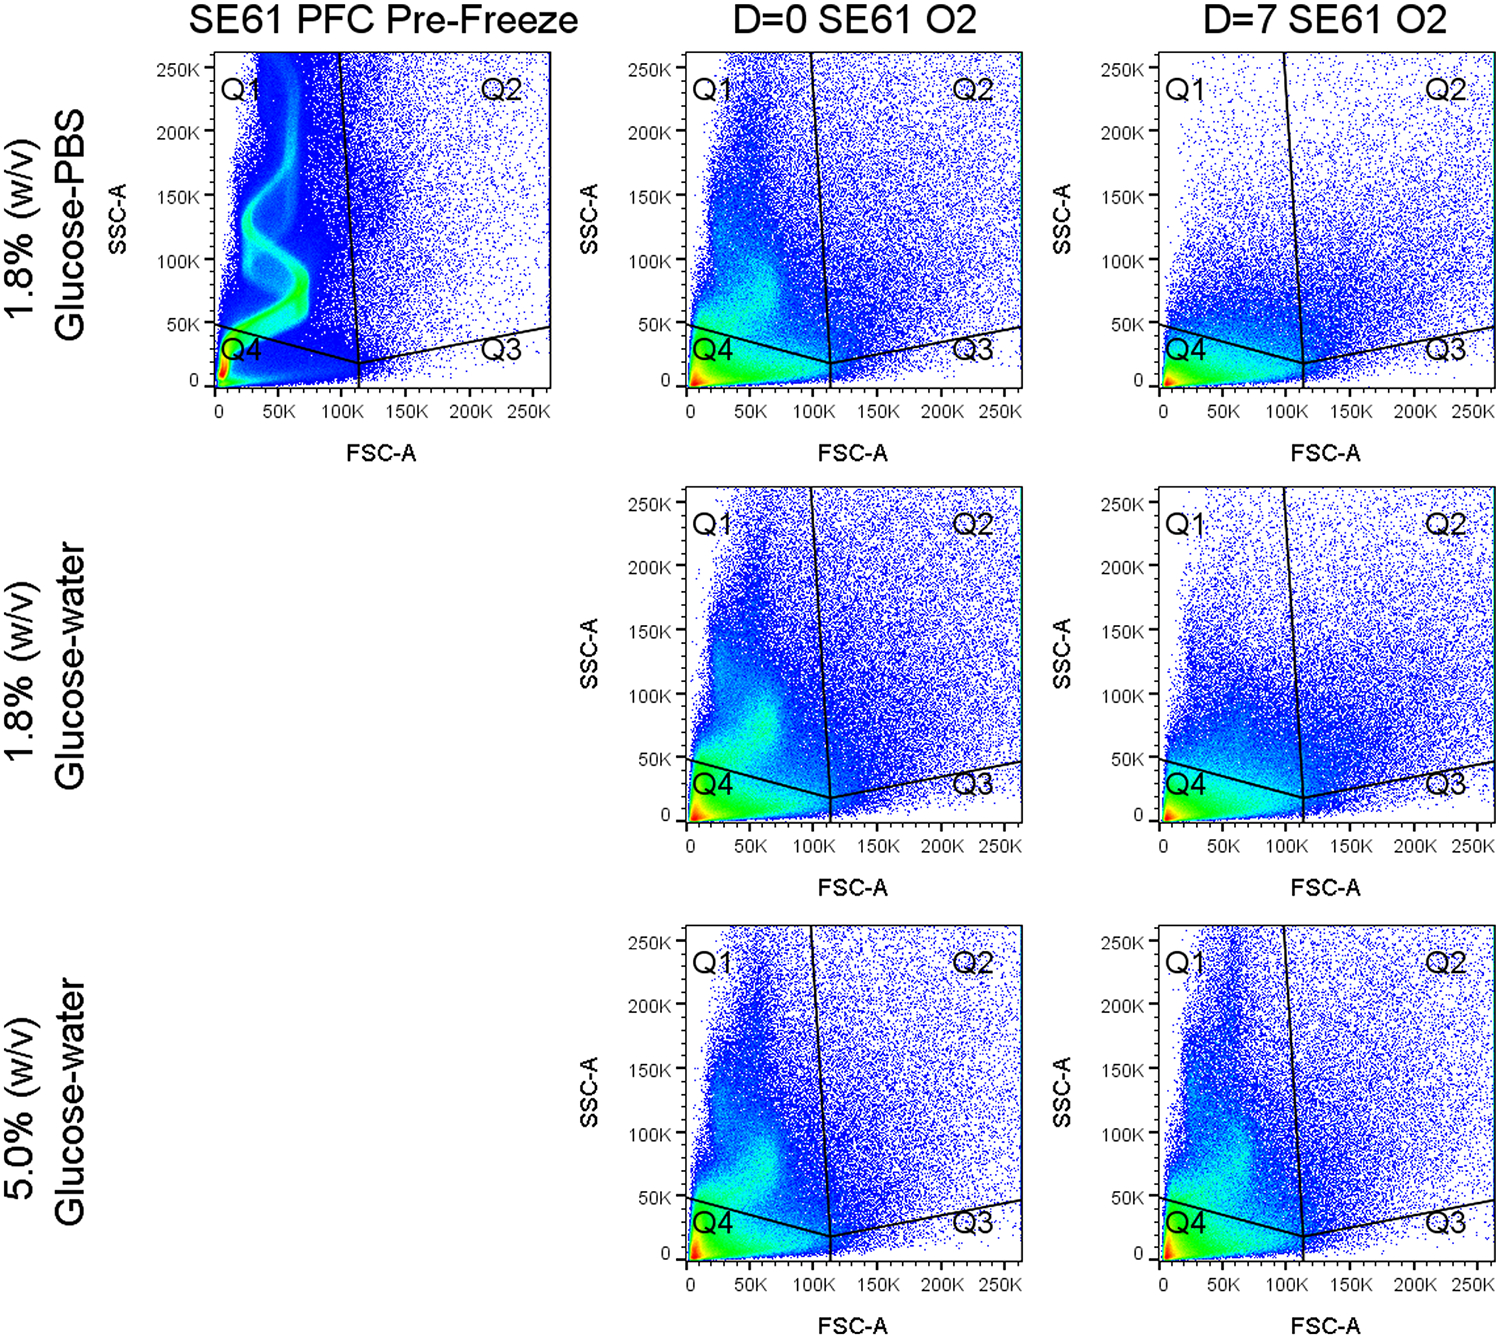
Flow cytometry representative data showing the count density. Plots are forward scattering (FSC-A) vs side scattering (SSC-A) for SE61 at various times for the different processing conditions.
Stability Studies.
DSC was then conducted on freeze-dried SE61O2, found in Figure 8, to determine why increasing the glucose solution from 1.8 to 5.0% (w/v) improved stability. One possibility is that the increase in glucose concentration raised the Tg′ of the dried glucose, reported to be around 23 °C, thus preventing the collapse of the dried cake.43 Another possibility is that a phase transition exists between a liquid-crystal phase and gel phase and that increasing the glucose solution concentration lowers the observed Tm, as is the case for liposomes. For SE61O2 freeze-dried in 1.8% (w/v) glucose–water, a phase transition can be seen between 24.4 and 31.3 °C along with a melt peak at 48.9 °C. While SE61O2 freeze-dried in 5.0% (w/v) glucose–water had a similar melt peak at 50.3 °C, the phase transition has shifted to a lower range, between 11.6 and 19.5 °C, supporting the theory that a phase transition exists between a liquid-crystalline phase and a gel phase. This shifting phase transition is likely associated with a change in the TPGS phase, while the higher peak is near the melt temperature of Span 60. This would be in agreement with the microbubble shell being polycrystalline with multiple phases. Increasing the concentration of glucose to 5.0% (w/v) shifts the transition temperature from above to below room temperature. This would prevent the sample from going through the transition during rehydration. However, if this was solely the cause of microbubble disruption, then differences in bubble integrity immediately after freeze-drying would be expected between glucose concentrations. One possibility is that SE61O2, unlike liposomes, can remain intact during a phase change caused by hydration but is more stable during storage in the liquid-crystalline phase. SE61O2 in a gel phase would likely be more rigid and fragile and less compatible with the glassy nature of the freeze-dried cake.
Figure 8.
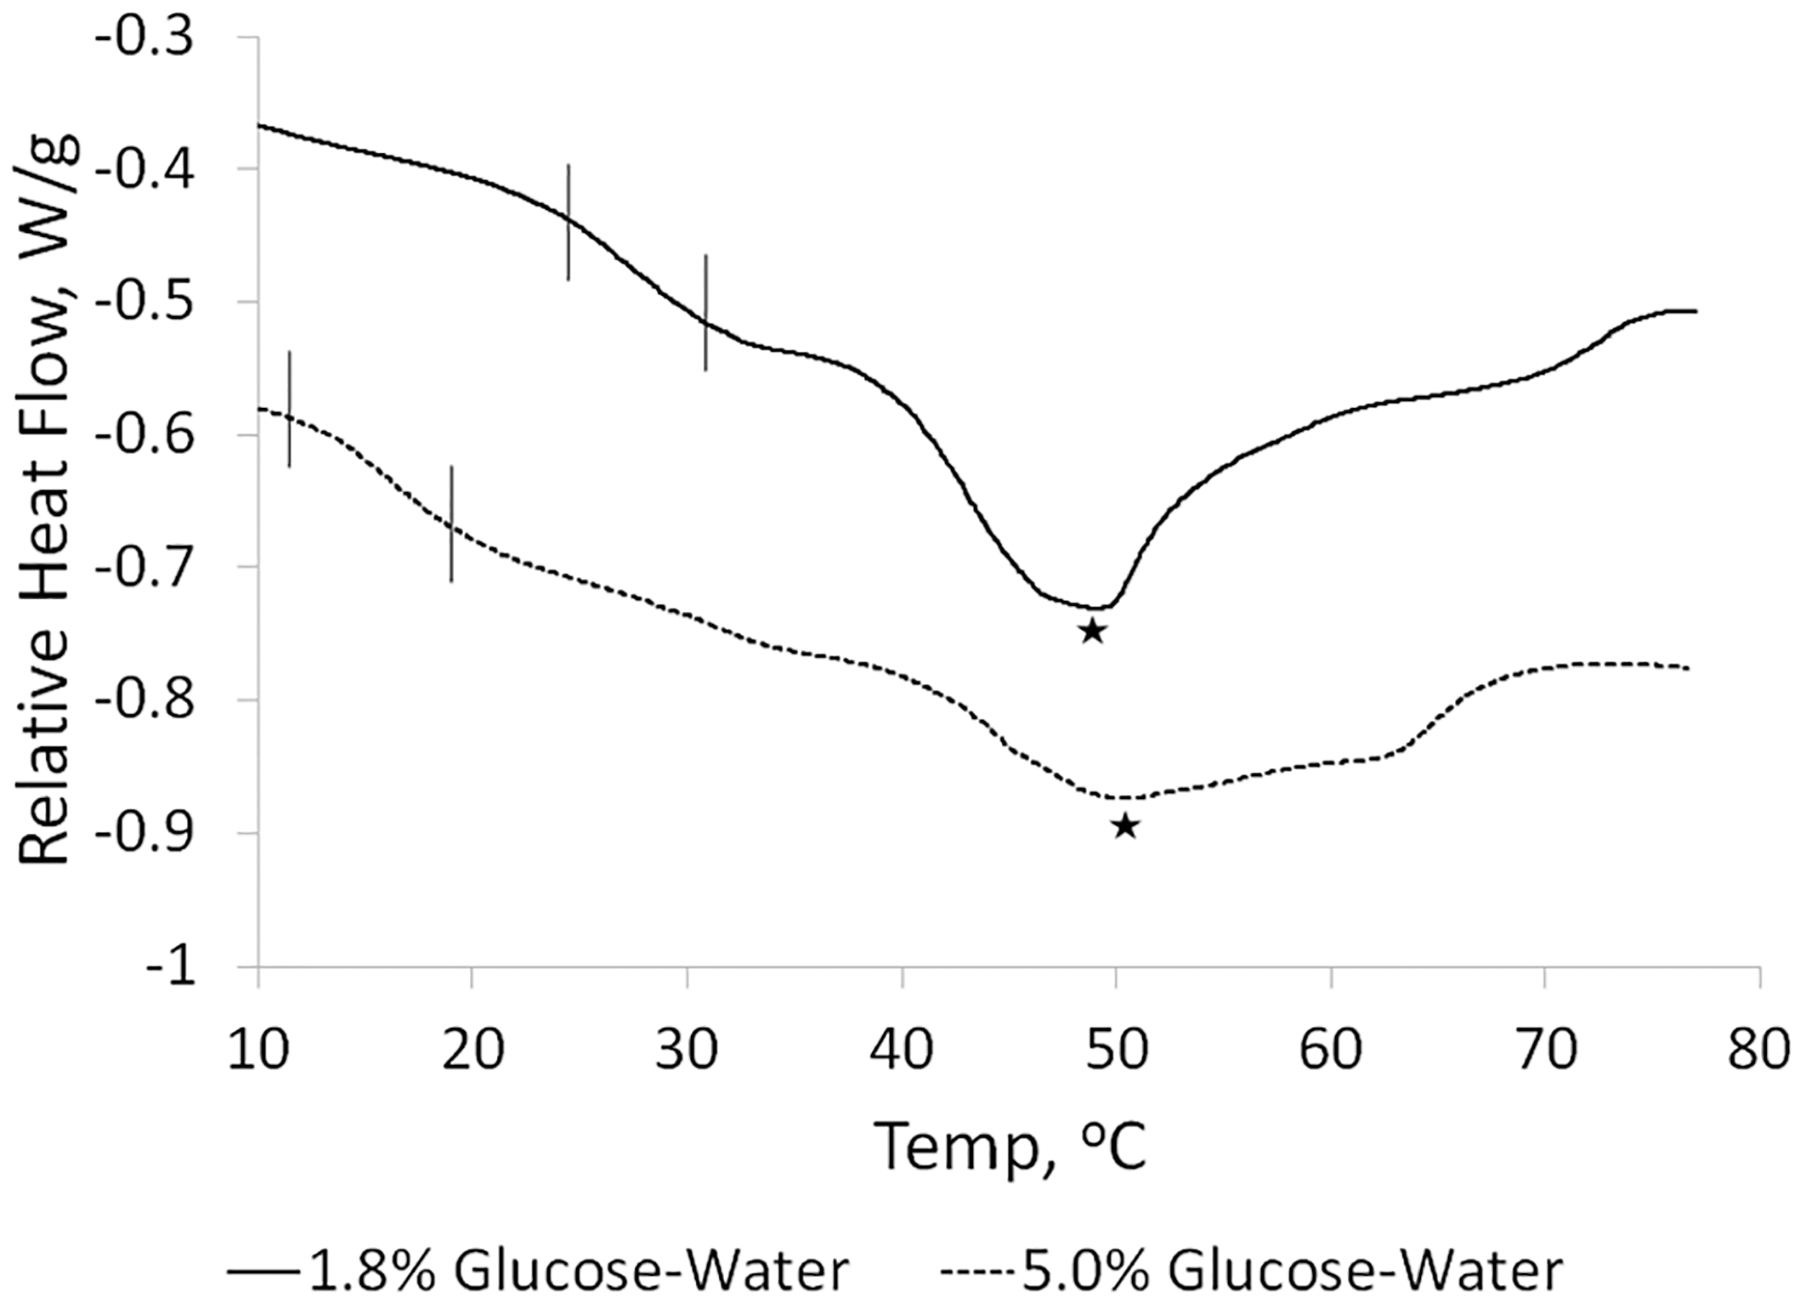
Differential scanning calorimetry curves of dried SE61O2 comprising 1.8 and 5.0% (w/v) glucose. Brackets indicate shifts in the Tm, and stars indicates the measured melt temperature.
The findings that SE61O2 created in a 1.8% (w/v) glucose solution is not shelf-stable at room temperature contradict the published stability of dried ST68PFC using the same concentration of lyoprotectant. The only difference between the two microbubble shells is the replacement of Tween 80 with TPGS. Importantly, Tween 80 is a liquid at room temperature while TPGS is a solid; therefore, ST68PFC likely has a lower Tm when dry than SE61O2, and the transition remains below room temperature when lyophilized in a 1.8% (w/v) glucose solution. When DSC was conducted on dried SE61 and ST68 without any lyoprotectant, a Tm associated with TPGS was detected near 33 °C in the former, while no peak was observed to be associated with Tween 80 in the later. Both had an observed peak near 50 °C associated with the common ingredient Span 60. Therefore, unlike ST68, which appears to be stabilized by being entrapped by the glassy sugar matrix,32 it appears that the stability of SE61O2 is also dependent on the bubble–sugar interface to lower the Tm. The hydrophilic headgroup of the TPGS exposed on the bubble–sugar interface is composed of an aromatic ring with 1 PEG chain with 1000 repeat units. This longer PEG chain on TPGS may require a higher concentration of glucose molecules for hydrogen bonding in order to provide stability or, on the basis of the water entrapment hypothesis, to trap more water closer to the bubble surface, leading to a lower Tm. When secondary drying during lyophilization was increased to try to remove additional bound water to produce a more stable sugar cake, we observed a decrease in the initial acoustical enhancement, suggesting that trapped water is important.
This study highlights the importance of ensuring that there is no phase change in the liquid-crystalline phase of the emulsifying agent during freeze-drying. The underlying physics of freeze-drying a microbubble shell is likely universal for all types of stabilized microbubble shells, including lipid shells. In our experience, in addition to this, each microbubble formulation has its own unique requirements for freeze-drying dictated by the shell composition, as evidenced by our reported conditions for ST68 differing from those for SE61.32 Therefore, the ability of glucose to lower the melt temperature with SE61 may not be universal due to unique interactions with the monolayer, and other lyoprotectants may be better suited for other shell stabilizers. This is not unexpected and is seen in other membranes. For example, it is reported in the liposome literature that glucose showed different cryoprotective effects between dioleoylphosphatidylcholine or egg yolk phosphatidylcholine liposomes and liposomes composed of dipalmitoylphosphatidylcholine.44
CONCLUSIONS
This study shows the important influences of the many different steps in freeze-drying on the stability of the microbubble interface. A slower freezing rate of the microbubbles results in better preservation of the acoustical properties after drying and can be achieved using a −20 °C bath. This slow freeze results in larger ice crystals being formed, allowing for a higher concentration of glucose around the microbubble, which becomes even more important with a higher concentration of sugars. We have also shown that the ionic strength of the suspending medium and the concentration of the lyoprotectant determine the Tg′ of the frozen sample, which in turn determines at what temperatures samples can be dried without collapse. The addition of PBS to the lyoprotectant solution causes the dried microbubble cake to collapse due to a decrease in Tg′ below our sample cooling abilities. Most importantly, we have shown that the shelf stability of the SE61O2 microbubble can be enhanced by increasing the glucose concentration to 5.0% (w/v). This increase lowers the microbubbles emulsifier’s Tm, with stable microbubbles existing in a liquid-crystalline phase at room temperature. The changes in properties compared to SE68PFC are due to the differences in the molecular structure of the surfactants used to stabilize the bubble interface, with TPGS replacing Tween 80. While the use of glucose to achieve the shift in Tm may be unique to SE61, the shift in Tm is likely important for the stable freeze-drying of any stabilized microbubble shell. In the future, samples of SE61O2 should be frozen at the slower rate with a 5.0% (w/v) glucose–water solution to maximize bubble stability during drying and storage.
ACKNOWLEDGMENTS
Drexel University STAR program (Iman Ayaz), NIH R01 EB026881 and R25 EB013038 The authors would like to express their thanks to Dr. Christopher Li and Mark Staub of the Department of Materials Science and Engineering, Drexel University for valuable assistance with running the DSC. We thank Drs. Amir Yarmahmoodi and Lei Yu from Thomas Jefferson University’s Flow Cytometry Core Facility for assistance with the flow cytometry system.
Footnotes
The authors declare no competing financial interest.
REFERENCES
- (1).Nanda NC History of echocardiographic contrast agents. Clin. Cardiol 1997, 20 (S1), 7–11. [DOI] [PubMed] [Google Scholar]
- (2).Chong WK; Papadopoulou V; Dayton PA Imaging with ultrasound contrast agents: current status and future. Abdom. Radiol 2018, 43 (4), 762–772. [DOI] [PubMed] [Google Scholar]
- (3).Li Y; Chen Y; Du M; Chen Z-Y Ultrasound technology for molecular imaging: from contrast agents to multimodal imaging. ACS Biomater. Sci. Eng 2018, 4 (8), 2716–2728. [DOI] [PubMed] [Google Scholar]
- (4).Hoff L Acoustic properties of ultrasonic contrast agents. Ultrasonics 1996, 34 (2–5), 591–593. [Google Scholar]
- (5).Ando Y; Tabata H; Sanchez M. l.; Cagna A; Koyama D; Krafft MP Microbubbles with a self-assembled poloxamer shell and a fluorocarbon inner gas. Langmuir 2016, 32 (47), 12461–12467. [DOI] [PubMed] [Google Scholar]
- (6).Cavalieri F; El Hamassi A; Chiessi E; Paradossi G Stable polymeric microballoons as multifunctional device for biomedical uses: synthesis and characterization. Langmuir 2005, 21 (19), 8758–8764. [DOI] [PubMed] [Google Scholar]
- (7).Mahalingam S; Raimi-Abraham BT; Craig DQ; Edirisinghe M Formation of protein and protein–gold nanoparticle stabilized microbubbles by pressurized gyration. Langmuir 2015, 31 (2), 659–666. [DOI] [PubMed] [Google Scholar]
- (8).Owen J; Kamila S; Shrivastava S; Carugo D; Bernadino de la Serna J; Mannaris C; Pereno V; Browning R; Beguin E; McHale AP The Role of PEG-40-stearate in the Production, Morphology, and Stability of Microbubbles. Langmuir 2018, DOI: 10.1021/acs.langmuir.8b02516. [DOI] [PubMed] [Google Scholar]
- (9).Tan S; Zou C; Zhang W; Yin M; Gao X; Tang Q Recent developments in d-α-tocopheryl polyethylene glycol-succinate-based nanomedicine for cancer therapy. Drug Delivery 2017, 24 (1), 1831–1842. [DOI] [PMC free article] [PubMed] [Google Scholar]
- (10).Eisenbrey JR; Albala L; Kramer MR; Daroshefski N; Brown D; Liu J-B; Stanczak M; O’Kane P; Forsberg F; Wheatley MA Development of an ultrasound sensitive oxygen carrier for oxygen delivery to hypoxic tissue. Int. J. Pharm 2015, 478 (1), 361–367. [DOI] [PMC free article] [PubMed] [Google Scholar]
- (11).Eisenbrey JR; Shraim R; Liu J-B; Li J; Stanczak M; Oeffinger B; Leeper DB; Keith SW; Jablonowski LJ; Forsberg F Sensitization of Hypoxic Tumors to Radiation Therapy Using Ultrasound-Sensitive Oxygen Microbubbles. Int. J. Radiat. Oncol., Biol., Phys 2018, 101 (1), 88–96. [DOI] [PMC free article] [PubMed] [Google Scholar]
- (12).Klibanov AL, Ultrasound Contrast Agents: Development of the Field and Current Status Contrast Agents II; Springer: 2002; pp 73–106. [Google Scholar]
- (13).Singhal S; Moser C; Wheatley M Surfactant-stabilized microbubbles as ultrasound contrast agents: stability study of Span 60 and Tween 80 mixtures using a Langmuir trough. Langmuir 1993, 9 (9), 2426–2429. [Google Scholar]
- (14).Wang W; Moser CC; Wheatley MA Langmuir trough study of surfactant mixtures used in the production of a new ultrasound contrast agent consisting of stabilized microbubbles. J. Phys. Chem 1996, 100 (32), 13815–13821. [Google Scholar]
- (15).Borden MA; Longo ML Dissolution behavior of lipid monolayer-coated, air-filled microbubbles: Effect of lipid hydrophobic chain length. Langmuir 2002, 18 (24), 9225–9233. [Google Scholar]
- (16).Duncan PB; Needham D Test of the Epstein– Plesset Model for gas microparticle dissolution in aqueous media: effect of surface tension and gas undersaturation in solution. Langmuir 2004, 20 (7), 2567–2578. [DOI] [PubMed] [Google Scholar]
- (17).Lum JS; Dove JD; Murray TW; Borden MA Single microbubble measurements of lipid monolayer viscoelastic properties for small-amplitude oscillations. Langmuir 2016, 32 (37), 9410–9417. [DOI] [PMC free article] [PubMed] [Google Scholar]
- (18).Borden MA; Pu G; Runner GJ; Longo ML Surface phase behavior and microstructure of lipid/PEG-emulsifier monolayer-coated microbubbles. Colloids Surf., B 2004, 35 (3–4), 209–223. [DOI] [PubMed] [Google Scholar]
- (19).Kim DH; Costello MJ; Duncan PB; Needham D Mechanical properties and microstructure of polycrystalline phospholipid monolayer shells: Novel solid microparticles. Langmuir 2003, 19 (20), 8455–8466. [Google Scholar]
- (20).Borden MA; Martinez GV; Ricker J; Tsvetkova N; Longo M; Gillies RJ; Dayton PA; Ferrara KW Lateral phase separation in lipid-coated microbubbles. Langmuir 2006, 22 (9), 4291–4297. [DOI] [PubMed] [Google Scholar]
- (21).Pu G; Borden MA; Longo ML Collapse and shedding transitions in binary lipid monolayers coating microbubbles. Langmuir 2006, 22 (7), 2993–2999. [DOI] [PubMed] [Google Scholar]
- (22).Schneider M; Arditi M; Barrau M-B; Brochot J; Broillet A; Ventrone R; Yan F BR1: a new ultrasonographic contrast agent based on sulfur hexafluoride-filled microbubbles. Invest. Radiol 1995, 30 (8), 451–457. [DOI] [PubMed] [Google Scholar]
- (23).SonoVue (sulfur hexafluoride microbubbles) Injection, https://www.asecho.org/wp-content/uploads/2015/11/LUMASON-NDA-203684-FDA-3-30-2016-final-clean.pdf.
- (24).Sontum PC Physicochemical characteristics of Sonazoid, a new contrast agent for ultrasound imaging. Ultras. Med. Biol 2008, 34 (5), 824–833. [DOI] [PubMed] [Google Scholar]
- (25).Albala L; Ercan UK; Joshi SG; Eisenbrey JR; Teraphongphom N; Wheatley MA Preservation of imaging capability in sensitive ultrasound contrast agents after indirect plasma sterilization. Int. J. Pharm 2015, 494 (1), 146–151. [DOI] [PubMed] [Google Scholar]
- (26).Brown JM Tumor hypoxia in cancer therapy. Methods Enzymol. 2007, 435, 295–321. [DOI] [PubMed] [Google Scholar]
- (27).Hodgkiss R; Roberts I; Watts M; Woodcock M Rapid-mixing studies of radiosensitivity with thiol-depleted mammalian cells. Int. J. Radiat. Biol. Relat. Stud. Phys., Chem. Med 1987, 52 (5), 735–744. [DOI] [PubMed] [Google Scholar]
- (28).Lampe JW; Liao Z; Dmochowski IJ; Ayyaswamy PS; Eckmann DM Imaging macromolecular interactions at an interface. Langmuir 2010, 26 (4), 2452–2459. [DOI] [PMC free article] [PubMed] [Google Scholar]
- (29).Abdelwahed W; Degobert G; Stainmesse S; Fessi H Freeze-drying of nanoparticles: formulation, process and storage considerations. Adv. Drug Delivery Rev 2006, 58 (15), 1688–1713. [DOI] [PubMed] [Google Scholar]
- (30).Searles JA; Carpenter JF; Randolph TW The ice nucleation temperature determines the primary drying rate of lyophilization for samples frozen on a temperature-controlled shelf. J. Pharm. Sci 2001, 90 (7), 860–871. [DOI] [PubMed] [Google Scholar]
- (31).Lee MK; Kim MY; Kim S; Lee J Cryoprotectants for freeze-drying of drug nano-suspensions: effect of freezing rate. J. Pharm. Sci 2009, 98 (12), 4808–4817. [DOI] [PubMed] [Google Scholar]
- (32).Solis C; Forsberg F; Wheatley MA Preserving enhancement in freeze-dried contrast agent ST68: Examination of excipients. Int. J. Pharm 2010, 396 (1–2), 30–38. [DOI] [PMC free article] [PubMed] [Google Scholar]
- (33).Carpenter JF; Crowe JH An infrared spectroscopic study of the interactions of carbohydrates with dried proteins. Biochemistry 1989, 28 (9), 3916–3922. [DOI] [PubMed] [Google Scholar]
- (34).Green JL; Angell CA Phase relations and vitrification in saccharide-water solutions and the trehalose anomaly. J. Phys. Chem 1989, 93 (8), 2880–2882. [Google Scholar]
- (35).Mensink MA; Frijlink HW; van der Voort Maarschalk K; Hinrichs WL How sugars protect proteins in the solid state and during drying (review): mechanisms of stabilization in relation to stress conditions. Eur. J. Pharm. Biopharm 2017, 114, 288–295. [DOI] [PubMed] [Google Scholar]
- (36).Belton P; Gil A IR and Raman spectroscopic studies of the interaction of trehalose with hen egg white lysozyme. Biopolymers 1994, 34 (7), 957–961. [DOI] [PubMed] [Google Scholar]
- (37).Cordone L; Cottone G; Giuffrida S Role of residual water hydrogen bonding in sugar/water/biomolecule systems: a possible explanation for trehalose peculiarity. J. Phys.: Condens. Matter 2007, 19 (20), 205110. [Google Scholar]
- (38).Crowe LM; Crowe JH; Rudolph A; Womersley C; Appel L Preservation of freeze-dried liposomes by trehalose. Arch. Biochem. Biophys 1985, 242 (1), 240–247. [DOI] [PubMed] [Google Scholar]
- (39).Koster KL; Webb MS; Bryant G; Lynch DV Interactions between soluble sugars and POPC (1-palmitoyl-2-oleoylphosphatidylcholine) during dehydration: vitrification of sugars alters the phase behavior of the phospholipid. Biochim. Biophys. Acta, Biomembr 1994, 1193 (1), 143–150. [DOI] [PubMed] [Google Scholar]
- (40).van Winden EC; Crommelin DJ Short term stability of freeze-dried, lyoprotected liposomes. J. Controlled Release 1999, 58 (1), 69–86. [DOI] [PubMed] [Google Scholar]
- (41).Wheatley MA; Forsberg F; Oum K; Ro R; El-Sherif D Comparison of in vitro and in vivo acoustic response of a novel 50:50 PLGA contrast agent. Ultrasonics 2006, 44 (4), 360–367. [DOI] [PubMed] [Google Scholar]
- (42).Moynihan CT; Easteal AJ; De BOLT MA; Tucker J Dependence of the fictive temperature of glass on cooling rate. J. Am. Ceram. Soc 1976, 59 (1–2), 12–16. [Google Scholar]
- (43).Simperler A; Kornherr A; Chopra R; Bonnet PA; Jones W; Motherwell WS; Zifferer G Glass transition temperature of glucose, sucrose, and trehalose: an experimental and in silico study. J. Phys. Chem. B 2006, 110 (39), 19678–19684. [DOI] [PubMed] [Google Scholar]
- (44).Suzuki T; Komatsu H Effects of glucose and its oligomers on the stability of freeze-dried liposomes. Biochim. Biophys. Acta, Biomembr 1996, 1278 (2), 176–182. [DOI] [PubMed] [Google Scholar]


