

Abstract
Background:
Vitamin D inadequacy, assessed by 25-hydroxyvitamin D [25(OH)D], affects around 50% of adults in the United States and is associated with numerous adverse health outcomes. Blood 25(OH)D concentrations are influenced by genetic factors that may determine how much vitamin D intake is required to reach optimal 25(OH)D. Despite large genome-wide association studies (GWASs), only a small portion of the genetic factors contributing to differences in 25(OH)D has been discovered. Therefore, knowledge of a fuller set of genetic factors could be useful for risk prediction of 25(OH)D inadequacy, personalized vitamin D supplementation, and prevention of downstream morbidity and mortality.
Methods:
Using PRSice and weights from published African- and European-ancestry GWAS summary statistics, ancestry-specific polygenic scores (PGSs) were created to capture a more complete set of genetic factors in those of European (n=9,569) or African ancestry (n=2,761) from three cohort studies.
Results.
The PGS for African ancestry was derived using all input SNPs (a p-value cut-off of 1.0) and had an R2 of 0.3%; for European ancestry, the optimal PGS used a p-value cut-off of 3.5×10⁻⁴ in the target/tuning dataset and had an R2 of 1.0% in the validation cohort. Those with highest genetic risk had 25(OH)D that was 2.8–3.0 ng/ml lower than those with lowest genetic risk (p=0.0463 to 3.2×10⁻¹³), requiring an additional 467 to 500 IU of vitamin D intake to maintain equivalent 25(OH)D.
Conclusions.
PGSs are a powerful predictive tool that could be leveraged for personalized vitamin D supplementation to prevent the negative downstream effects of 25(OH)D inadequacy.
Keywords: Genetics, ancestry, vitamin D, diet, polygenic risk score, heritability
Introduction
Vitamin D inadequacy, using the Institute of Medicine definition of a 25-hydroxyvitamin D [25(OH)D] concentration less than 20 ng/mL, affects almost 50% of adults in the United States, with higher prevalence in those with darker skin tones (Forrest and Stuhldreher; Medicine 2011; Wang et al. 2010). Observational studies show associations between low vitamin D concentrations and numerous adverse health outcomes, including autoimmune diseases, migraines, hypertension, dyslipidemia, cardiovascular events, and cardiovascular mortality (Arshi et al. 2014; Holick, 2007; Kheiri et al. 2018; Medicine 2011; Mirhosseini et al. 2017; Song et al. 2018; Wang et al. 2010). These studies are supported by recent Mendelian randomization studies which provide evidence for a causal relationship between low vitamin D concentrations and increased risk of obesity, ovarian cancer, hypertension, lower cognitive function during aging, multiple sclerosis, and all cause and cancer mortality (Afzal et al. 2014; Kueider et al. 2016; Kunutsor et al. 2014; Mokry et al. 2015; Ong et al. 2016; Vimaleswaran et al. 2013; Vimaleswaran et al. 2014). Furthermore, some clinical trials have shown that vitamin D and calcium supplementation are important in the prevention of fractures and cardiovascular risk factors, while vitamin D supplementation alone may lower risk of cancers, diabetes and depression and may reduce inflammation and improve lung function in patients with cystic fibrosis (Arshi et al. 2014; Barry et al. 2017; Bertone-Johnson et al. 2011; Bischoff-Ferrari et al. 2005; Boonen et al. 2007; Jorde et al. 2008; Lappe et al. 2007; Pincikova et al. 2016; Schnatz et al. 2017; Weaver et al. 2016). Recent results from the Vitamin D and Omega-3 Trial (VITAL) showed null associations between vitamin D supplementation and cancer or cardiovascular disease. However, study design limits the interpretability of these findings; for example individuals with adequate 25(OH)D concentrations were included, and outside use of vitamin D before and during the trial were not restricted (Manson et al. 2018). Avoiding vitamin D inadequacy is important, however, as 25(OH)D concentrations over 50 ng/mL have been associated with increased morbidity and mortality (Medicine 2011; Melamed and Manson 2011). Clinical trials of vitamin D have shown that individual response to vitamin D supplementation is highly variable (Aloia et al. 2008; Binkley et al. 2015). 25(OH)D concentrations are influenced by genetic factors and genetic variants may determine how much vitamin D intake is required to reach an optimal 25(OH)D blood concentration (Engelman et al. 2008; Engelman et al. 2013; Nimitphong et al. 2013; Wjst 2017). Therefore, knowledge of the genetic determinants of 25(OH)D concentrations could be useful for prediction of risk for vitamin D inadequacy, personalized vitamin D supplementation, and subsequent prevention of vitamin D associated morbidity and mortality due to 25(OH)D deficiency.
Variation in or near twelve genes (A2BP1, AMDHD1, ANO6/ARID2, CYP2R1, CYP24A1, DAB1, DHCR7, GC, GPR114, HTR2A, KIF4B, and SEC23A) has been associated with serum 25(OH)D at genome-wide levels of significance through published genome-wide association studies (GWASs) in those of European or African ancestry (Ahn et al. 2010; Engelman et al. 2010; Hong et al. 2018; Jiang et al. 2018; Wang et al. 2010). However, only single nucleotide polymorphisms (SNPs) in or near four of these genes have been replicated (CYP2R1, CYP24A1, DHCR7, and GC), and together account for a small portion of the variation in 25(OH)D concentrations, about 2.8% compared to the estimated 20–40% heritability (Engelman et al. 2008; Jiang et al. 2018; Wang et al. 2010). Such “missing heritability” is common in complex traits, and could, in part, be attributed to many SNPs with small effects that do not reach a stringent genome-wide significance threshold (Manolio et al. 2009). A polygenic score (PGS), by comprising the weighted sum of trait-associated alleles, may capture more trait variation than individual SNPs alone. PGSs have been shown to be more powerful than individual SNP-based testing, are used in a wide variety of statistical techniques (e.g., Mendelian randomization), and have shown clinical promise, predicting Alzheimer’s disease incidence before the onset of symptoms that would result in a clinical diagnosis, and for dosing of antifibrinolytic drugs based on activated partial thromboplastin time (aPTT) risk scores (Desikan et al. 2017; Dudbridge 2013; Mormino et al. 2016; Tang et al. 2012).
Yet challenges remain with developing PGS. Analyses suggest that only including SNPs reaching genome-wide significance in a PGS fails to capture much of the heritable variation and reduces the PGS’s prediction accuracy. However, deciding on a p-value threshold for including SNPs a priori is challenging. Recently, software has been developed which addresses this challenge, using summary statistics from GWAS to calculate a number of PGSs across a wide range of p-value thresholds for SNP inclusion and model fit statistics to determine the optimal threshold for predicting traits in a testing dataset, which is often less stringent than the genome-wide level (Euesden et al. 2015).
To date, only a handful of studies have calculated PGSs for vitamin D concentrations, generally using only SNPs in genes that reached the stringent p-value threshold in existing vitamin D GWASs, therefore missing much of the genetic contribution to the phenotype (Chandler et al. 2018; Engelman et al. 2013; Nissen et al. 2014; Shao et al.; Zhang et al. 2013). Given that several studies have reported genetic dependent response to vitamin D supplementation, PGSs hold predictive and preventive promise in relation to vitamin D concentrations (Didriksen et al. 2013; Mazahery and von Hurst 2015; Nimitphong et al. 2013).
The goal of the current study was to calculate ancestry-specific PGSs for 25(OH)D in individuals of European or African ancestry based on the results from a recent multi-ethnic GWAS meta-analysis (Hong et al. 2018), and to validate the PGS performance in an independent sample. Additionally, the proportion of SNP heritability captured by the PGS was quantified, using GCTA, and compared to that captured by the genome-wide significant SNPs.
Methods
GWAS summary statistics
The TRANS-ethniC Evaluation of vitamiN D GWAS consortium (TRANSCEN-D), performed the largest multi-ethnic vitamin D GWAS meta-analysis to date and included 13 cohorts (9 of African ancestry, 3 of Hispanic ancestry and the SUNLIGHT discovery cohort, a consortium of 15 European cohorts) (Hong et al. 2018). Here, ancestry-specific summary statistics from the African- and European-ancestry cohorts of TRANSCEN-D were leveraged for weighting of each SNP included in the PGS (Hong et al. 2018). This is referred to as the base dataset.
Target/tuning dataset for calculation of PGS
Using weights from the base dataset, PGSs were developed in an ancestry-specific manner for subsets of European- and African-ancestry samples from the Atherosclerosis in Communities (ARIC) study, which contains European- and African- ancestry participants (INVESTIGATORS 1989). These ARIC subsets are referred to as the target/tuning datasets. ARIC data were obtained through dbGaP Study Accession: phs000090.v4.p1. ARIC data were selected as the target/tuning dataset as they included both sexes and had dense genotyping, essential for development of a comprehensive and generalizable PGS. ARIC is a prospective epidemiologic study conducted across four United States sites: Wake Forest Baptist Medical Center, Winston-Salem, NC; University of Mississippi Medical Center, Jackson, MS; University of Minnesota, Minneapolis, MN; Johns Hopkins University, Baltimore, MD. ARIC includes 15,792 participants aged 45–64 at baseline, of which 9,086 have data required for this analysis (genomic data, 25(OH)D, age, sex, body mass index (BMI), location and month of blood draw) which were ascertained at ARIC visit 2 (1990–1992). Of these 9,086 participants, 7,178 are of European ancestry. A random sample of 1,000 participants were chosen from the 7,178 eligible European-ancestry participants for tuning the optimal PGS model, the remaining samples were used to validate the PGS. From the 1,908 eligible participants of African ancestry from ARIC, only data from 57 participants had not been included in the TRANSCEN-D meta-analysis; these were used as the base dataset. Therefore, to ensure independence between the base and target/tuning datasets only these 57 African-ancestry participants were selected into the target/tuning dataset. Of note, ARIC European samples were not included in TRANSCEN-D, therefore all 9,086 participants were independent of TRANSCEN-D and eligible for the present study.
PGS validation cohort
PGS validation was done using data combined across participants from three multi-ethnic cohorts: ARIC, the Multi-ethnic Study of Atherosclerosis (MESA) and the Women’s Health Initiative (WHI), analyzed in an ancestry-specific manner. As above, ARIC provided data on 6,178 participants of European ancestry for the validation cohort. MESA is a prospective study of men and women ages 45–84 who were recruited by Columbia University, New York, NY; Johns Hopkins University, Baltimore, MD; Northwestern University, Chicago, IL; University of Minnesota, Minneapolis, MN; University of California at Los Angeles, Los Angeles, CA and Wake Forest University, Winston-Salem, NC. Serum 25(OH)D was measured at MESA exam 1 (July 2000-August 2002). MESA data were obtained through dbGaP Study Accession: phs000209.v13.p3. MESA provided data on 1,936 European- and 342 African-ancestry participants who maintained independence from TRANSCEN-D for the validation cohort. Women participating in WHI were recruited from 40 clinical centers in the United States. Serum 25(OH)D was measured as part of the Calcium and Vitamin D (CaD) Trial (Anderson et al. 2003). WHI data were obtained through dbGaP Study Accession: phs000200.v11.p3. Participants were included if they had the minimum set of variables: genome-wide data, serum 25(OH)D, age, sex, BMI, and month of blood draw. WHI provided data on 455 European- and 700 African-ancestry participants for the validation cohort. Thus, together, in the validation cohort, the European-ancestry sample included 8,569 participants and the African-ancestry sample included 1,042 participants.
MESA and WHI were used as validation sets because neither MESA nor WHI were optimal tuning datasets for developing a comprehensive PGS. MESA used 50K genotyping, and had much sparser coverage post-imputation compared to the ARIC dataset that was selected as the tuning dataset. WHI only included women, which could limit the generalizability of the PGS.
Datasets used for heritability estimation
Heritability estimates were calculated using eligible participants (N=8,838) of both European (n=7,119) and African (n=1,719) ancestry from ARIC.
Participant consent was previously obtained for each study providing data; additionally, IRB approval was granted for this specific mega-analysis.
Data Quality Control
Data cleaning for phenotypic data included winsorizing 25(OH)D in the MESA and WHI samples to account for outliers (Kwak and Kim 2017). In the WHI sample, participants with 25(OH)D values far above the maximum level of detection (150 ng/mL), none of which had extreme vitamin D intake (including supplement use) or sun exposure, were removed from the sample; this included 68 participants of European ancestry and 119 participants of African ancestry. All 25(OH)D values were log transformed to improve the normality of the distribution in each cohort.
Genotyping methods are available in Supplemental Table 1 and described in more detail elsewhere (Anderson; Cornelis et al. 2010; Manichaikul et al. 2012; Matise et al. 2011; Musunuru et al. 2010). In summary, QC removed: sex mismatches, samples and SNPs with high missingness (>5%), SNPs with low minor allele count (MAC<10), and SNPs out of Hardy-Weinberg equilibrium (HWE<0.05/number of SNPs; Bonferroni adjusted cut-off). Datasets were imputed using the Michigan Imputation Server (Das et al. 2016; Loh et al. 2016). European samples were imputed to the Haplotype Reference Consortium (HRC) and African samples were imputed to the Consortium on Asthma among African-ancestry Populations in the Americas (CAAPA) (Johnston et al. 2017; Loh et al. 2016). Post imputation QC included: removing SNPs with a low quality score (<0.8) or MAF (<0.1%). Additionally, sample and SNP level missingness as well as HWE cutoffs were rechecked. Supplemental Figures 1–2 and Supplemental Table 1 give specifics on quality control for each cohort. QC was performed using PLINK v1.9 and vcfTools (Danecek et al. 2011; Purcell et al. 2007). Ancestry was determined by selfreported data and confirmed with principal components analysis (PCA) in PLINK using 1000 Genomes data as anchoring populations (The Genomes Project et al. 2012).
Measurement of 25(OH)D
Blood 25(OH)D concentration was measured by the studies using different assay types. WHI used the DiaSorin LIASON chemiluminescence, while both MESA and ARIC used liquid chromatographymass spectrometry (LCMS), which is considered the gold standard for 25(OH)D measurement (McKibben et al. 2016; Robinson-Cohen et al. 2013). Vitamin D concentration [25(OH)D] was log transformed to improve normality of the distribution. To control for differences in vitamin D concentrations due to different assays, 25(OH)D concentrations were converted to z-scores within studies for combined cohort analyses.
Measurement of vitamin D intake
Dietary data were collected via questionnaire. Each study used their own questionnaire. WHI used the Food Frequency Questionnaire supplemented with interview questions. ARIC and MESA both used their own implementation of a food intake questionnaire. From the questionnaire data, each study created a derived variable of typical vitamin D intake (measured in IU or mcg). All values were converted to IU for analysis. Additionally, WHI collected data on vitamin D supplement use at the same visit that 25(OH)D was assessed. The sum of vitamin D intake from food and supplements was calculated and used for supplemental and sensitivity analyses, otherwise dietary intake alone was used.
Calculation of available UV radiation
Available UV radiation was calculated based on the month of blood draw and location; participants were assigned continuous available UV radiation values. Available UV radiation values assigned were an average UV-index for the month prior to blood draw (the relevant exposure period). UV data come from the National Weather Service Climate Prediction Center historical database. When available, UV radiation values corresponded to the exact location and year of the participant’s blood draw. When exact cities or years were not available, averages across nearby locations or years were used. See Supplemental Tables 2–4 for specific month, year and location values used. Descriptive statistics for available UV radiation values by site and month are also presented in Supplemental Tables 5–7; the UV radiation values ranged from 0.7 to 9.5 UV Index units.
Determining optimal PGS
An optimal p-value cutoff and corresponding PGS were determined by calculating PGSs across a wide range of p-value thresholds and testing the association between the PGS and log[25(OH)D] in the target/tuning dataset. First, summary statistics were attained from TRANSCEN-D, the base dataset (Hong et al. 2018; Wang et al. 2010), which included SNPS with MAF > 0.01 and tested them for association with log[25(OH)D] using an additive genetic model adjusting for age, sex, BMI, UV index and principal components (PCs) 1 −10. PGSs were then calculated in PRSice v2, which computes the sum of reference allele counts at each SNP weighted by the effect size (β) for that SNP from the TRANSCEN-D consortium (Euesden et al. 2015). The reference allele could be the risk (lower 25(OH)D) or protective (higher 25(OH)D) allele. PGS weights came from ancestry-specific z-scores from TRANSCEN-D that were converted to betas with the deterministic relationship: β = z/(sqrt(2p(1 −p) * N)), where p is the allele frequency for the reference SNP (Zhu et al. 2016). One tuning parameter in PGS development is the LD cutoff used for clumping to prevent SNPs in one correlated region from dominating the PGS. Here, PGSs were calculated in the target/tuning dataset using two different LD cut-offs, r2 ≥ 0.5 or ≥ 0.2, keeping the SNP with the strongest effect (largest z-score and lowest p-value) in the base dataset. SNPs in LD with one another were clumped, using the --clump-r2 option in PRSice v2. The LD cutoff that yielded the PGS that explains the most variance in 25(OH)D was used in downstream analyses. Given the small African-ancestry sample, a reference panel (remaining ARIC African-ancestry dataset n= 1,900) was used to determine LD.
To determine which set of SNPs to include in the PGS, SNPs at or below a given p-value threshold in the base dataset were included in the PGS and tested in a linear regression model for association with log[25(OH)D] in the target/tuning dataset. P-value thresholds from 5×10⁻⁵−0.5 were tested incrementing by 5×10⁻⁵ at each iteration (supplemental testing using a p-value threshold of 1.0 was performed). All testing was done using PRSice v2 (Euesden et al. 2015). The threshold with the PGS explaining the most variance in log[25(OH)D] was selected as the most optimal PGS. R2, or the coefficient of determination, was calculated to measure the proportion of phenotypic variance explained by the model. Linear regression models were used to calculate the R2 of a given PGS while controlling for participant age, sex, BMI, available UV radiation, and PCs for ancestry. Two PCs were controlled for in the African-ancestry and European-ancestry models, as determined based on the ‘elbow’ of cohort- and ancestry-specific scree plots. Sensitivity analysis was performed including dietary intake in the model, as dietary intake is a strong predictor of 25(OH)D concentrations. However, with the inclusion of dietary intake in the model, the optimal PGS (and p-value cutoff) remained the same for the both cohorts, but reduced sample size substantially in the African-ancestry cohort. Therefore, to maintain sample size, dietary intake was not included in the model to determine the optimal p-value cutoff (Supplemental Table 8).
PGS performance validation
PGS performance was validated in an ancestry-specific manner using participants in validation cohorts, which were combined cohorts of samples from ARIC, MESA, and WHI that maintained independence from TRANSCEN-D and PGS development samples. The PGS was applied to the participants in the validation dataset in accordance with the ancestry specific p-value cutoff. The relationship between PGS quantile and 25(OH)D was tested using a linear regression model controlling for age, sex, BMI, available UV radiation, and PCs for ancestry. Quantile plots were created depicting the relationship between PGS decile and 25(OH)D concentration. PGS and 25(OH)D concentration were normalized within each cohort. This was done to minimize the effects of different SNP sets used to discern the PGS (i.e. many missing SNPs in MESA) and different 25(OH)D assays used between cohorts. Sensitivity analyses were performed to ensure that the study design of the WHI CaD randomized control trial was not biasing the results.
Supplemental PGS Analyses
The African-ancestry target/tuning cohort was small (n=57) due to limited genome-wide data in those of African ancestry. To explore if the small sample reduced prediction for those of African ancestry, a PGS was created from all independent SNPs (p-value cutoff = 1.0; r2 cutoff = 0.5) in the full independent sample of African-ancestry participants which maintained independence from TRANSCEN-D (n=1,099) (Ware et al. 2017). Additionally, to test the importance of ancestrally-matched base and target sets, this PGS was also created using European-ancestry GWAS summary statistics for weighting of the PGS.
Heritability Estimation
Heritability estimates were calculated using GCTA v1.26 (Yang et al. 2011). Heritability was estimated several ways: (1) ancestry-specific overall SNP heritability, (2) ancestry-specific SNP heritability of the PGS (where sample size allowed) and (3) ancestry-specific SNP heritability of previous replicated GWAS findings in CYP2R1, CYP24A1, DHCR7, and GC (Ahn et al. 2010; Hong et al. 2018; Wang et al. 2010). In each case, the model was adjusted for age, sex, BMI, available UV, and dietary vitamin D intake.
SNP heritability estimates were calculated using all genotyped and imputed SNPs for both the European and African ancestry populations from ARIC; this was 8,315,761 and 9,335,785 SNPS, respectively. Partitioned heritability estimates were discerned paralleling methodology described by the SUNLIGHT consortium (Jiang et al. 2018). To estimate heritability captured by the PGS, heritability was calculated twice; once using the clumped set of SNPs used to determine the PGS (228,867 SNPs for European ancestry and 850,697 for African ancestry) and a second time using the clumped set of SNPs with SNPs included in the PGS removed (228,526 SNPs for European ancestry and 818,428 for African ancestry). The difference in heritability estimates between these two models was the heritability explained by the PGS. Heritability could not be directly calculated from the SNPs in the PGS because one of the assumptions made by the GCTA modeling is an average null effect of the SNPs on the outcome. Of note, the African-ancestry sample was too small for this analysis to be valid, so heritability attributed to the PGS was only calculated in those of European ancestry. In discerning the heritability captured by previous replicated GWAS studies, heritability was calculated using a reduced set of SNPs: the full genotyped and imputed set with top GWAS findings (and SNPs in the surrounding LD block) removed (Jiang et al. 2018; Johnson et al. 2008). The difference between this estimate and the overall heritability estimates was the heritability attributed to previous replicated GWAS findings. Additionally, a second heritability estimate was calculated that included novel findings. This included SNPs from AMDHD1 and SEC23A in those of European ancestry and SNPs from KIF4B, HTR2A and ANO6/ARID2 in those of African ancestry (Hong et al. 2018; Jiang et al. 2018). Table 1 summarizes the SNPs and LD blocks removed in each scenario. LD block size was determined using the Plots mode of the SNAP tool by the Broad (Johnson et al. 2008). All models were fit separately for European and African ancestry samples. All models were fit separately for European and African ancestry samples.
Table 1:
Previous GWAS SNPs
| SNP ID | Chromosome | Positione | Gene | EU LD block size | AFA LD block size |
|---|---|---|---|---|---|
| rs2282679 | 4 | 72608383 | GC | 1200 kb | 2 kb |
| rs79666294a | 5 | 155047146 | KIF4B | NAc | 200 kb |
| rs10741657 | 11 | 14893332 | CYP2R1 | 480 kb | 300 kb |
| rs12785878 | 11 | 71456403 | NADSYN1/DHCR7 | 120 kb | 84 kb |
| rs719700 | 12 | 45635426 | ANO6/ARID2 | NAc | 2 kb |
| rs10745742 | 12 | 95964751 | AMDHD1 | 50 kb | NAd |
| rs1410656 | 13 | 46968386 | HTR2A | NAc | 28 kb |
| rs8018720 | 14 | 39086981 | SEC23A | 180 kb | NAd |
| rs6013897b | 20 | 54125940 | CYP24A1 | 10 kb | 4 kb |
Abbreviations: SNP, single nucleotide polymorphism; EU, European-ancestry; AFA, African-ancestry; LD, linkage disequilibrium
not in ARIC African-ancestry imputed data; using the RAGGR tool by USC, SNP rs17570361 was found to be a good proxy (r2 0.94)
not in ARIC African-ancestry imputed data; no proxy for rs6013897, so SNPs within 2kb of its position (52742479) were removed
Novel African ancestry SNP
Novel European ancestry SNP
Build 37
Results
Determining the optimal PGS
Table 2 shows sample characteristics for each analysis. Table 3 shows statistics for the best performing PGS for each ancestry in the target/tuning and validation datasets while controlling for age, sex, BMI, available UV radiation, and PCs for ancestry. In both ancestries, the PGS using the LD cut-off of 0.5 was more strongly associated with and explained more of the variance in log[25(OH)D] than did the PGS using the LD cut-off of 0.2 (Supplemental Table 9). Therefore, this was the LD cutoff utilized going forward. In the European-ancestry analyses, the optimal PGS explained 1.4% of the variance in log[25(OH)D] (p=9.3×10⁻⁵) in the target/tuning dataset and 1.0% of the variance (p=1.1×10⁻²³) in the validation cohort. In the African-ancestry analyses, the PGS explained 2.9% of the variance in log[25(OH)D] (p=0.11) in the target/tuning dataset and 0.2% of the variance (p=0.15) in the validation cohort. Of note, the optimally performing PGS in the African-ancestry target/tuning dataset contained many more SNPs than that from the European-ancestry dataset, mostly due to the less stringent p-value cutoff, but also because a larger number of SNPs remained post clumping (850,697 vs 228,867) due to smaller LD blocks in the African-ancestry sample and more input SNPs from the TRANSCEN-D summary statistics (8.4 million in the African-ancestry vs 1.2 million in the European-ancestry sample). Figure 1 depicts the results visually, where a taller bar corresponds to a larger percent of the phenotypic variance explained by the PGS.
Table 2.
Sample characteristics
| Sample | Metric | European-ancestry set | African-ancestry set |
|---|---|---|---|
| PGS development sample (from ARIC) | Sample Size | 1,000 | 57 |
| % Female | 53.2% | 49.1% | |
| Mean Age (SD) [years] | 57.1(5.7) | 55.6 (6.2) | |
| Mean BMI (SD) [kg/m2] | 27.3 (4.8) | 28.6 (5.7) | |
| Mean Available UV radiation (SD) [units] | 5.0 (2.5) | 7.1 (2.4) | |
| Mean Vitamin D Intake (SD) [IU] | 219.2 (135.2) | 221.2 (137.3) | |
| Mean 25(OH)D (SD) [ng/ml] | 25.7 (8.7) | 20.9 (7.8) | |
| PGS validation sample (from ARIC, MESA and WHI)a | Sample Size | 8,569 | 1,042 |
| % Female | 56.1% | 84%b | |
| Mean Age (SD) [years[ | 58.9 (7.7) | 62.0 (8.5) | |
| Mean BMI (SD) [kg/m2] | 27.5 (5.0) | 30.8 (6.3) | |
| Mean Available UV radiation (SD) [units] | 4.9 (2.5) | 5.4 (2.5) | |
| Mean Vitamin D Intake (SD) [IU] | 172.3 (157.0) | 99.7 (126.1) | |
| Mean 25(OH)D (SD) [ng/ml] | 26.5 (9.7) | 19.2 (13.6) | |
| Heritability estimation sample (from ARIC) | Sample Size | 7,119 | 1,719 |
| % Female | 53.6% | 63.5% | |
| Mean Age (SD) [years[ | 57.1 (5.7) | 56.4 (5.8) | |
| Mean BMI (SD) [kg/m2] | 27.3 (4.8) | 30.2 (6.2) | |
| Mean Available UV radiation (SD) [units] | 5.0 (2.5) | 6.9 (2.3) | |
| Mean Vitamin D Intake (SD) [IU] | 222.8 (144.4) | 215.7 (150.3) | |
| Mean 25(OH)D (SD) [ng/ml] | 25.9 (8.8) | 19.1 (7.1) |
Abbreviations: PGS, polygenic score; SD, standard deviation; BMI, body mass index; UV, ultraviolet
MANOVA global test (performed in SAS (version 9.4) revealed differences in one or more variables by cohort, therefore cohort was adjusted for in all models that included multiple cohorts
Notably greater % Female than other sets, because this set includes independent samples in MESA (n=342) and WHI (n=700)
Table 3:
Performance of optimal PGS in each ancestry
| Ancestry | p-value cut-off | # SNPs | Cohort | PGS R2 (model R2) | p-valuea |
|---|---|---|---|---|---|
| European | 0.00035 | 341 | Tuning (n=1,000) | 0.014 (0.14) | 9.3×10⁻⁵ |
| Validation (n=8,569) | 0.0098 (0.17) | 1.1×10⁻²³ | |||
| African | 0.01265 | 32,269 | Tuning (n=57) | 0.029 (0.49) | 0.11 |
| Validation (n=1,042) | 0.002 (0.03) | 0.15 | |||
| African | 1.0 | NAb | Full-Independent (n=1,099) | 0.003 (0.04) | 0.05 |
Abbreviations: SNPs, single nucleotide polymorphism; PGS, polygenic score
p-value for association between PGS and log[25(OH)D]
this PGS was created via mega-analysis of three cohorts; # SNPs varies by cohort
Figure 1. The polygenic score (PGS) performance in those of European or African ancestry.

The x-axis displays selected p-value thresholds for single nucleotide polymorphisms (SNPs) included in the PGS. The y-axis displays the proportion of phenotypic variance captured by the PGS. Yellow bars correspond to a strong association (more significant p-value) between the PGS and log(25(OH)D than do blue bars. In panel A, the most optimally performing PGS has the tallest bar (p-value threshold = 0.00035) and captures 1.4% of the variance in log[25(OH)D]. In panel B, the most optimally performing PGS has the tallest bar (p-value threshold = 0.01265) and captures 2.9% of the variance in log[25(OH)D].
In supplementary analyses for the African-ancestry cohort, the optimal PGS from the 2-stage analysis was compared to the PGS using the full African-ancestry sample that was independent from TRANSCEN-D (n=1,099; p-value cutoff = 1.0; r2 cutoff = 0.5), using the same underlying comparison that was used to determine the optimal PGS in the 2-stage design. The PGS using the full African-ancestry sample that was independent from TRANSCEN-D (n=1,099; p-value cutoff = 1.0; r2 cutoff = 0.5) explained more variance (0.31% vs 0.2%) and had a stronger association (p=0.0545 vs 0.15) than the optimal PGS determined from PRSice using the small tuning cohort (n=57) and larger validation cohort (n=1042), therefore this PGS was chosen as most optimal and used moving forward. In additional analyses to test the importance of ancestrally-matched base and target sets, the PGS (p-value cutoff = 1.0; r2 cutoff = 0.5) developed from European-ancestry TRANSCEN-D summary statistics only explained 0.14% of the variance (p=0.1897; worse performance than the PGS developed from African-ancestry TRANSCEN-D summary statistics that explained 0.31% of the variance in 25(OH)D [p=0.0545]). Results are shown in Table 3 and Supplemental Table 10.
After the optimal, ancestry-specific PGS was discerned, the relationship between the PGS and 25(OH)D was investigated using ancestry-specific combined cohorts of samples from ARIC, MESA and WHI, which maintained independence from the TRANSCEN-D (and tuning, for those of European ancestry) samples. Characteristics of these samples are summarized in Table 2. Figures 2 and 3 show ancestry-specific plots for 25(OH)D by decile of the PGS. In general, those with greater genetic risk (lower PGS and quantile) have lower 25(OH)D concentrations. For a clinically-based interpretation, in the European validation cohort (Figure 2, n=8,569), those with the lowest PGS have vitamin D concentrations 3.0 ng/ml lower than those with the highest PGS (p=3.2×10⁻¹³). Figure 3 shows the trend for those of African ancestry (n=1,099; combined tuning and validation samples from Table 2); those with the lowest PGS have vitamin D concentrations 2.8 ng/ml lower than those with the highest PGS (p=0.0463). Results from the PGS determined using the separate tuning and validation cohorts are included in Supplemental Figure 3.
Figure 2. Visual representation of the association between polygenic score (PGS) decile and normalized vitamin D concentrations in the validation cohort those of European ancestry (n=8,569).

The x-axis is the PGS decile, where lower decile means more risk of low vitamin D concentrations The y-axis is vitamin D concentrations (normalized for comparison between cohorts). The trend is that when the PGS decreases (i.e. higher genetic risk) 25(OH)D concentrations decrease. Moving from the lowest risk to the highest risk decile decreases vitamin D concentrations by 3.0 ng/ml.
Figure 3. Visual representation of the association between polygenic score (PGS) decile and normalized vitamin D concentrations in those of African ancestry (n=1,099).

The x-axis is the PGS decile, where lower decile means more risk of low vitamin D concentration. The y-axis is vitamin D concentrations (normalized for comparison between cohorts). The trend is that when the PGS decreases (i.e. higher genetic risk) 25(OH)D concentrations decrease. Moving from the lowest risk to the highest risk quintile decreases vitamin D concentrations by 2.8 ng/ml (p=0.0463).
Sensitivity analyses showed there was no significant difference in 25(OH)D concentration between participants on the treatment arm compared to the placebo arm in the participants from WHI. Additionally, there was no significant difference in PGS-25(OH)D trend in WHI compared to the other cohorts.
Heritability estimation
Participant characteristics are summarized in Table 2. Overall and stratified SNP heritability estimates for those of European or African ancestry are summarized in Figure 4 and Supplemental Figure 4, respectively. SNP heritability is 32% in the African-ancestry cohort and 22% in the European-ancestry cohort (standard errors 17.8 and 5.2, respectively). In those of European ancestry, the PGS accounts for 17.1% (3.7/21.6) of the SNP heritability of 25(OH)D concentrations and previous replicated GWAS findings (i.e., SNPs from CYP2R1, CYP24A1, DHCR7 and GC) account for 6.9% (1.5/21.6) of the total SNP heritability (Ahn et al. 2010; Hong et al. 2018; Wang et al. 2010). In those of African ancestry, these same top GWAS findings accounted for only 1.6% (0.5/32.2) of the total SNP heritability. Heritability accounted for by previous GWAS findings remained unchanged when ancestry-specific novel findings were included in the heritability estimations (3.7% for European ancestry, and 0.5% for African ancestry) (Ahn et al. 2010; Hong et al. 2018; Jiang et al. 2018; Wang et al. 2010). African-ancestry sample size was too small to calculate heritability accounted for by the PGS.
Figure 4. Overall single nucleotide polymorphism (SNP) heritability, polygenic score (PGS) SNP heritability and replicated genome-wide assocation study (GWAS) SNP heritability in those of European ancestry.
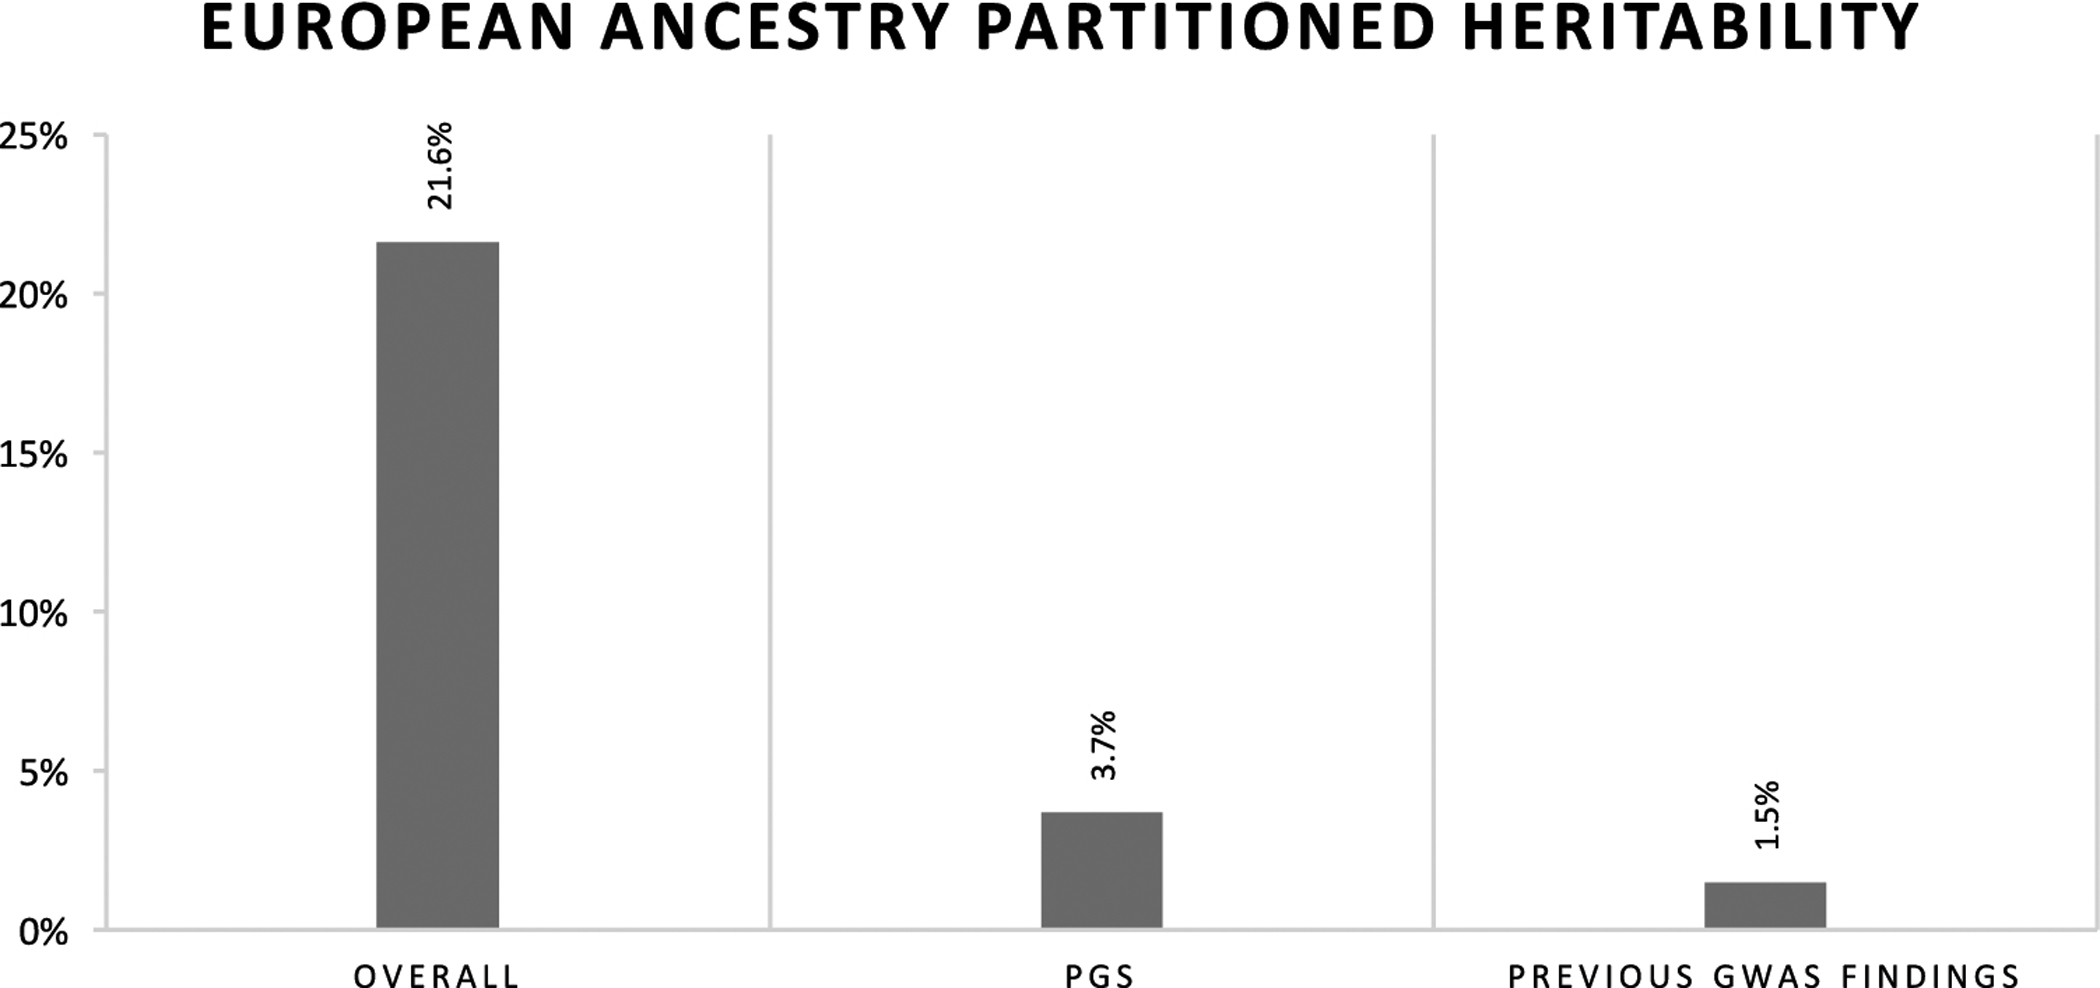
Where sample allowed for calcuation, the PGS explains more heritability than previous replicated GWAS findings, albeit leaving much of the heritability unexplained.
Discussion
Vitamin D inadequacy is a pervasive health problem, with a strong genetic basis. However, to date, much of the heritability of 25(OH)D remains unexplained. Furthermore, there is a tremendous gap in the research carried out in minority ancestries compared to European ancestry. Filling these knowledge gaps is critical in preventive care to manage 25(OH)D concentration, especially as we move towards precision medicine, and development of an ancestry-specific PGS is one way to address these gaps. To date, across all phenotypes, most PGS have been calculated in those of European ancestry. A handful of studies have begun to explore ancestry-specific PGS, however, none of these approaches utilize an entirely ancestry-specific approach as was undertaken here (Coram et al. 2017; Marquez-Luna et al. 2017; Vassos et al. 2017). Given the underlying genetic difference between ancestries (i.e., different LD patterns and allele frequencies), an ancestry-specific approach is more appropriate. Calculating PGSs using GWAS summary statistics from an ancestry-matched population accounts for differences in linkage disequilibrium (LD) and allele frequencies that exist between ancestral groups leading to differences in allele effect sizes, which are used as weights in the PGS calculation. Here, optimal PGSs were discerned and validated in an ancestry-specific manner. Heritability explained by the PGS and previous GWAS findings was compared to overall SNP heritability.
The relationship between the PGS and 25(OH)D concentrations was consistent across ancestries in the validation cohorts, albeit modest variance was explained by the PGS; those with the lowest PGS (most risk) had the lowest 25(OH)D concentrations. Moving from the highest to lowest quantile changed 25(OH)D concentrations by 2.8–3.0 ng/ml, a statistically significant and clinically meaningful difference. One study reported that for each additional 100 IU of vitamin D consumed, serum 25(OH)D levels increased by 0.6 ng/ml (Cranney et al. 2007). Using this conversion, compared to those with lowest genetic risk, those with highest genetic risk could require an additional 467 to 500 IU of vitamin D to maintain comparable levels. While the small sample used to determine the p-value cut-off in those of African ancestry could have led to overfitting of the model, the consistent direction of effect between PGS quantile and 25(OH)D concentrations suggests clinical utility for a 25(OH)D PGS to inform vitamin D supplementation in those with high genetic risk for 25(OH)D inadequacy.
The portion of phenotypic variance explained by the PGS was modest due to many concurrent influences. First, the PGS did not include rare variants (MAF < 0.01) as they were removed from the base set (TRANSCEN-D). Common SNPs account for only a small proportion of genetic variance in complex traits (Manolio et al. 2009). Future PGSs that include rare variants will likely account for a greater portion of the variance. Additionally, the variance that the PGS can capture is limited by the input SNPs. In the best-case scenarios (i.e. densest chips), the overlap between the SNPs in the base and target datasets was 3,520,049 and 1,026,643 SNPs, for African and European ancestries, respectively. While over 1 million SNPs can be very informative, much of the genome was not included. Thirdly, PRSice implements clumping which keeps only the SNP with the strongest association for SNPs in LD (r2 >0.5 used here) in any given 500kb window, thus reducing the maximum variability that could be captured by a PGS.
Supplementary analyses performed in the full independent sample of African ancestry participants (n=1,099) demonstrated (1) the importance of a large tuning sample and (2) the importance of ancestrally-matched base and target sets. Comparing the results from the small tuning sample (n=57) and the analysis using the full independent sample of African-ancestry participants (n=1,099), more variance, 0.3% compared to 0.2%, was accounted for, and the association between PGS and 25(OH)D was stronger (p=0.0545 vs 0.15) using the PGS developed in the full sample (n=1,099). Additionally, variance accounted for dropped to 0.14% (compared to 0.31%) and the PGS-25(OH)D association became non-significant (p=0.19) when using mismatched summary statistics, reiterating the importance of ancestry-specific analyses as to not exacerbate health disparities (Martin et al. 2019).
Not surprisingly, the heritability investigation provided further evidence that PGSs using a less stringent p-value threshold account for a higher portion of the heritability than genome-wide significant SNPs from previous GWAS. Here, the PGS explained more of the SNP heritability than did previous GWAS findings, 17.1% compared to 6.9% in those of European ancestry (sample size was too small for PGS heritability calculations in those of African ancestry). However, neither the PGS nor previous GWAS findings explain a large portion of total SNP heritability, promoting the need for genetic studies with larger sample sizes and more dense SNP data that include low frequency variants to fully understand the genetic determinants of 25(OH)D concentrations and, therefore, inform the most effective vitamin D supplementation practices. Additionally, there was higher missing heritability in the African ancestry compared to the European ancestry. A possible mechanism behind this is the difference in LD structure between the ancestries. Given that the African-ancestry population is older than the European ancestry population, with more generations for recombination to occur and break up the genome, the African-ancestry population has more and smaller LD regions. Therefore, it is plausible that each GWAS tagging SNP captures large regions and more functional variants in individuals of European ancestry, but captures fewer small regions, missing additional regions with functional variants, in those of African ancestry.
This study calculated a PGS with a moderate R2, a consistent relationship to 25(OH)D concentrations and that explained more heritability of 25(OH)D than previous GWAS findings, reiterating the importance of capturing genetic risk by PGS which can be used for clinical predictions. Additionally, this study contributes in-depth multi-ethnic investigation into 25(OH)D heritability by ancestry, teasing apart genetic underpinnings of 25(OH)D concentrations. However, the study does come with some limitations. To maintain independence from TRANSCEN-D, which provided ancestry-specific weights for the PGSs, the sample size used in this analysis was relatively small, especially for the African-ancestry cohort. The sample size issues experienced for the African-ancestry cohort emphasize the importance of obtaining more diverse samples (i.e. in initiatives like All of Us) (Haskins 2018). Through the TRANSCEN-D GWAS meta-analysis and the analysis here, nearly all of the publicly available African-ancestry samples with relevant data have been exhausted and sample sizes for other racial/ethnic groups remain limited. The limited amount of diverse data led to a small African-ancestry training set. A small training set limits discrimination of risk groups which could explain the less significant findings for those of African ancestry (Dudbridge 2013). Furthermore, the genotyping performed did not capture rare variants, limiting the variance that could be captured by the PGS. While GCTA allows for the calculation of heritability in non-related participants, which avoids overestimation due to shared environment, it only accounts for additive SNP effects, potentially underestimating total heritability which also could include gene-by-gene interactions. Finally, while adjusting for available UV radiation is more precise than season, it is not a perfect proxy for time spent outside and does not consider the amount of skin exposed, sunscreen use or skin pigmentation. These limitations leave room for future studies and replication that should be performed. For example, future PGSs could be developed implementing the recent cross-prediction method developed by Mak et,al; this method allows and corrects for overlap between the base and target dataset that would have allowed for a much larger African-ancestry sample (Mak et al. 2018). Additionally, in the future, the PGS could be utilized as an independent variable to predict health outcomes.
In conclusion, this study showed that PGSs are a powerful predictive tool for determining 25(OH)D concentrations. Given the association between the optimal PGS and 25(OH)D concentrations, PGSs could be leveraged for personalized vitamin D supplementation, which could prevent the negative downstream effects of 25(OH)D inadequacy. Additionally, through an in-depth investigation of 25(OH)D SNP heritability, it was shown that the PGS explains more heritability than do GWAS findings to date. This provides additional evidence that many SNPs that function through small effect sizes influence 25(OH)D concentrations, yielding further understanding of the genetic architecture of 25(OH)D. However much of the heritability remains to be explained, therefore, more research is warranted along the quest to effectively and efficiently preventing 25(OH)D inadequacy through personalized supplementation.
Supplementary Material
Acknowledgments
We thank the researchers and participants of Atherosclerosis in Communities (ARIC), Multi-Ethnic Study of Atherosclerosis and the Women’s Health Initiative (WHI) for making this data publicly available.
ARIC
The Atherosclerosis Risk in Communities Study is carried out as a collaborative study supported by National Heart, Lung, and Blood Institute contracts (HHSN268201100005C, HHSN268201100006C, HHSN268201100007C, HHSN268201100008C, HHSN268201100009C, HHSN268201100010C, HHSN268201100011C, and HHSN268201100012C). The authors thank the staff and participants of the ARIC study for their important contributions.
Funding for GENEVA was provided by National Human Genome Research Institute grant U01HG004402 (E. Boerwinkle). Vitamin D assays in ARIC were funded by R01 HL103706 (P. Lutsey).
MESA
MESA and the MESA SHARe project are conducted and supported by the National Heart, Lung, and Blood Institute (NHLBI) in collaboration with MESA investigators. Support for MESA is provided by contracts HHSN268201500003I, N01-HC-95159, N01-HC-95160, N01-HC-95161, N01-HC-95162, N01-HC-95163, N01-HC-95164, N01-HC-95165, N01-HC-95166, N01-HC-95167, N01-HC-95168, N01-HC-95169, UL1-TR-000040, UL1-TR-001079, UL1-TR-001420, UL1-TR-001881, and DK063491.
The MESA CARe data used for the analyses described in this manuscript were obtained through Genetics (accession numbers). Funding for CARe genotyping was provided by NHLBI Contract N01-HC-65226.
Funding support for the Vitamin D dataset was provided by grant HL096875
WHI
The WHI program is funded by the National Heart, Lung, and Blood Institute, National Institutes of Health, U.S. Department of Health and Human Services through contracts HHSN268201600018C, HHSN268201600001C, HHSN268201600002C, HHSN268201600003C, and HHSN268201600004C. This manuscript was not prepared in collaboration with investigators of the WHI, has not been reviewed and/or approved by the Women’s Health Initiative (WHI), and does not necessarily reflect the opinions of the WHI investigators or the NHLBI.
WHI PAGE is funded through the NHGRI Population Architecture Using Genomics and Epidemiology (PAGE) network (Grant Number U01 HG004790). Assistance with phenotype harmonization, SNP selection, data cleaning, meta-analyses, data management and dissemination, and general study coordination, was provided by the PAGE Coordinating Center (U01HG004801-01).
Funding support for WHI GARNET was provided through the NHGRI Genomics and Randomized Trials Network (GARNET) (Grant Number U01 HG005152). Assistance with phenotype harmonization and genotype cleaning, as well as with general study coordination, was provided by the GARNET Coordinating Center (U01 HG005157). Assistance with data cleaning was provided by the National Center for Biotechnology Information. Funding support for genotyping, which was performed at the Broad Institute of MIT and Harvard, was provided by the NIH Genes, Environment and Health Initiative [GEI] (U01 HG004424).
The datasets used for the analyses described in this manuscript were obtained from dbGaP at http://www.ncbi.nlm.nih.gov/sites/entrez?db=gap through dbGaP accession phs000200.v11.p3.
Funding for WHI SHARe genotyping was provided by NHLBI Contract N02- HL-64278.
KEH was supported by an NLM training grant to the Computation and Informatics in Biology and Medicine Training Program (NLM 5T15LM007359). Computational resources were supported by a core grant to the Center for Demography and Ecology at the University of Wisconsin-Madison (P2C HD047873).
Footnotes
Publisher's Disclaimer: This Author Accepted Manuscript is a PDF file of an unedited peer-reviewed manuscript that has been accepted for publication but has not been copyedited or corrected. The official version of record that is published in the journal is kept up to date and so may therefore differ from this version.
Conflict of Interest: The authors declare that they have no conflict of interest.
Ethical approval: All procedures performed in studies involving human participants were in accordance with the ethical standards of the University of Wisconsin-Madison IRVB 2017–0332 and with the 1964 Helsinki declaration and its later amendments or comparable ethical standards.
Informed consent: “Informed consent was obtained from all individual participants included in the study.”
References
- 1.Afzal S, Br∅ndum-Jacobsen P, Bojesen SE and Nordestgaard BG (2014). “Genetically low vitamin D concentrations and increased mortality: mendelian randomisation analysis in three large cohorts.” BMJ 349. [DOI] [PMC free article] [PubMed] [Google Scholar]
- 2.Ahn J, Yu K, Stolzenberg-Solomon R, Simon KC, McCullough ML, Gallicchio L, Jacobs EJ, Ascherio A, Helzlsouer K, Jacobs KB, Li Q, Weinstein SJ, Purdue M, Virtamo J, Horst R, Wheeler W, Chanock S, Hunter DJ, Hayes RB, Kraft P and Albanes D (2010). “Genome-wide association study of circulating vitamin D levels.” Human Molecular Genetics 19(13): 2739–2745. [DOI] [PMC free article] [PubMed] [Google Scholar]
- 3.Aloia JF, Patel M, DiMaano R, Li-Ng M, Talwar SA, Mikhail M, Pollack S and Yeh JK (2008). “Vitamin D intake to attain a desired serum 25-hydroxyvitamin D concentration.” The American Journal of Clinical Nutrition 87(6): 1952–1958. [DOI] [PubMed] [Google Scholar]
- 4.Anderson G. “WHI Harmonized and Imputed GWAS Data” dbGaP Study Accession: phs000746.v2.p3. Retrieved April 3, 2018. [Google Scholar]
- 5.Anderson GL, Manson J, Wallace R, Lund B, Hall D, Davis S, Shumaker S, Wang C-Y, Stein E and Prentice RL (2003). “Implementation of the women’s health initiative study design.” Annals of Epidemiology 13(9, Supplement): S5–S17. [DOI] [PubMed] [Google Scholar]
- 6.Arshi S, Fallahpour M, Nabavi M, Bemanian MH, Javad-Mousavi SA, Nojomi M, Esmaeilzadeh H, Molatefi R, Rekabi M, Jalali F and Akbarpour N (2014). “The effects of vitamin D supplementation on airway functions in mild to moderate persistent asthma.” Annals of Allergy, Asthma & Immunology 113(4): 404–409. [DOI] [PubMed] [Google Scholar]
- 7.Barry EL, Peacock JL, Rees JR, Bostick RM, Robertson DJ, Bresalier RS and Baron JA (2017). “Vitamin D Receptor Genotype, Vitamin D(3) Supplementation, and Risk of Colorectal Adenomas: A Randomized Clinical Trial.” JAMA oncology 3(5): 628–635. [DOI] [PMC free article] [PubMed] [Google Scholar]
- 8.Bertone-Johnson ER, Powers SI, Spangler L, Brunner RL, Michael YL, Larson JC, Millen AE, Bueche MN, Salmoirago-Blotcher E, Liu S, Wassertheil-Smoller S, Ockene JK, Ockene I and Manson JE (2011). “Vitamin D intake from foods and supplements and depressive symptoms in a diverse population of older women.” The American Journal of Clinical Nutrition 94(4): 1104–1112. [DOI] [PMC free article] [PubMed] [Google Scholar]
- 9.Binkley N, Lappe J, Singh RJ, Khosla S, Krueger D, Drezner MK and Blank RD (2015). “Can vitamin D metabolite measurements facilitate a “treat-to-target” paradigm to guide vitamin D supplementation?” Osteoporosis international : a journal established as result of cooperation between the European Foundation for Osteoporosis and the National Osteoporosis Foundation of the USA 26(5): 1655–1660. [DOI] [PMC free article] [PubMed] [Google Scholar]
- 10.Bischoff-Ferrari HA, Willett WC, Wong JB, Giovannucci E, Dietrich T and Dawson-Hughes B (2005). “Fracture prevention with vitamin d supplementation: A meta-analysis of randomized controlled trials.” JAMA 293(18): 2257–2264. [DOI] [PubMed] [Google Scholar]
- 11.Boonen S, Lips P, Bouillon R, Bischoff-Ferrari HA, Vanderschueren D and Haentjens P (2007). “Need for Additional Calcium to Reduce the Risk of Hip Fracture with Vitamin D Supplementation: Evidence from a Comparative Metaanalysis of Randomized Controlled Trials.” The Journal of Clinical Endocrinology & Metabolism 92(4): 1415–1423. [DOI] [PubMed] [Google Scholar]
- 12.Chandler PD, Tobias DK, Wang L, Smith-Warner SA, Chasman DI, Rose L, Giovannucci EL, Buring JE, Ridker PM, Cook NR, Manson JE and Sesso HD (2018). “Association between Vitamin D Genetic Risk Score and Cancer Risk in a Large Cohort of U.S. Women.” Nutrients 10(1): 55. [DOI] [PMC free article] [PubMed] [Google Scholar]
- 13.Coram MA, Fang H, Candille SI, Assimes TL and Tang H (2017). “Leveraging Multi-ethnic Evidence for Risk Assessment of Quantitative Traits in Minority Populations.” American Journal of Human Genetics 101(2): 218–226. [DOI] [PMC free article] [PubMed] [Google Scholar]
- 14.Cornelis MC, Agrawal A, Cole JW, Hansel NN, Barnes KC, Beaty TH, Bennett SN, Bierut LJ, Boerwinkle E, Doheny KF, Feenstra B, Feingold E, Fornage M, Haiman CA, Harris EL, Hayes MG, Heit JA, Hu FB, Kang JH, Laurie CC, Ling H, Manolio TA, Marazita ML, Mathias RA, Mirel DB, Paschall J, Pasquale LR, Pugh EW, Rice JP, Udren J, van Dam RM, Wang X, Wiggs JL, Williams K and Yu K (2010). “The Gene, Environment Association Studies Consortium (GENEVA): Maximizing the Knowledge Obtained from GWAS by Collaboration Across Studies of Multiple Conditions.” Genetic epidemiology 34(4): 364–372. [DOI] [PMC free article] [PubMed] [Google Scholar]
- 15.Cranney A, Horsley T, O’Donnell S, Weiler H, Puil L, Ooi D, Atkinson S, Ward L, Moher D, Hanley D, Fang M, Yazdi F, Garritty C, Sampson M, Barrowman N, Tsertsvadze A and Mamaladze V (2007). “Effectiveness and safety of vitamin D in relation to bone health.” Evidence Report/Technology Assessment(158): 1–235. [PMC free article] [PubMed] [Google Scholar]
- 16.Danecek P, Auton A, Abecasis G, Albers CA, Banks E, DePristo MA, Handsaker RE, Lunter G, Marth GT, Sherry ST, McVean G and Durbin R (2011). “The variant call format and VCFtools.” Bioinformatics 27(15): 2156–2158. [DOI] [PMC free article] [PubMed] [Google Scholar]
- 17.Das S, Forer L, Schonherr S, Sidore C, Locke AE, Kwong A, Vrieze SI, Chew EY, Levy S, McGue M, Schlessinger D, Stambolian D, Loh P-R, Iacono WG, Swaroop A, Scott LJ, Cucca F, Kronenberg F, Boehnke M, Abecasis GR and Fuchsberger C (2016). “Next-generation genotype imputation service and methods.” Nat Genet 48(10): 1284–1287. [DOI] [PMC free article] [PubMed] [Google Scholar]
- 18.Desikan RS, Fan CC, Wang Y, Schork AJ, Cabral HJ, Cupples LA, Thompson WK, Besser L, Kukull WA, Holland D, Chen C-H, Brewer JB, Karow DS, Kauppi K, Witoelar A, Karch CM, Bonham LW, Yokoyama JS, Rosen HJ, Miller BL, Dillon WP, Wilson DM, Hess CP, Pericak-Vance M, Haines JL, Farrer LA, Mayeux R, Hardy J, Goate AM, Hyman BT, Schellenberg GD, McEvoy LK, Andreassen OA and Dale AM (2017). “Genetic assessment of age-associated Alzheimer disease risk: Development and validation of a polygenic hazard score.” PLoS Medicine 14(3): e1002258. [DOI] [PMC free article] [PubMed] [Google Scholar]
- 19.Didriksen A, Grimnes G, Hutchinson M, Kjærgaard M, Svartberg J, Joakimsen R and Jorde R (2013). The serum 25-hydroxyvitamin D response to vitamin D supplementation is related to genetic factors, BMI, and Baseline levels. [DOI] [PubMed]
- 20.Dudbridge F (2013). “Power and Predictive Accuracy of Polygenic Risk Scores.” PLOS Genetics 9(3): e1003348. [DOI] [PMC free article] [PubMed] [Google Scholar]
- 21.Engelman CD, Fingerlin TE, Langefeld CD, Hicks PJ, Rich SS, Wagenknecht LE, Bowden DW and Norris JM (2008). “Genetic and environmental determinants of 25-hydroxyvitamin D and 1,25-dihydroxyvitamin D levels in Hispanic and African Americans.” J Clin Endocrinol Metab 93. [DOI] [PMC free article] [PubMed] [Google Scholar]
- 22.Engelman CD, Meyers KJ, Iyengar SK, Liu Z, Karki CK, Igo RP, Truitt B, Robinson J, Sarto GE, Wallace R, Blodi BA, Klein ML, Tinker L, LeBlanc ES, Jackson RD, Song Y, Manson JE, Mares JA and Millen AE (2013). “Vitamin D Intake and Season Modify the Effects of the GC and CYP2R1 Genes on 25-Hydroxyvitamin D Concentrations.” The Journal of Nutrition 143(1): 17–26. [DOI] [PMC free article] [PubMed] [Google Scholar]
- 23.Engelman CD, Meyers KJ, Ziegler JT, Taylor KD, Palmer ND, Haffner SM, Fingerlin TE, Wagenknecht LE, Rotter JI, Bowden DW, Langefeld CD and Norris JM (2010). “Genome-wide association study of vitamin D concentrations in Hispanic Americans: The IRAS Family Study.” The Journal of steroid biochemistry and molecular biology 122(4): 186–192. [DOI] [PMC free article] [PubMed] [Google Scholar]
- 24.Euesden J, Lewis CM and O’Reilly PF (2015). “PRSice: Polygenic Risk Score software.” Bioinformatics 31(9): 1466–1468. [DOI] [PMC free article] [PubMed] [Google Scholar]
- 25.Forrest KYZ and Stuhldreher WL “Prevalence and correlates of vitamin D deficiency in US adults.” Nutrition Research 31(1): 48–54. [DOI] [PubMed] [Google Scholar]
- 26.Haskins J (2018). “Wanted: 1 million people to help transform precision medicine: All of Us program open for enrollment.” The Nation’s Health 48(5): 1–16. [Google Scholar]
- 27.Holick MF “High Prevalence of Vitamin D Inadequacy and Implications for Health.” Mayo Clinic Proceedings 81(3): 353–373. [DOI] [PubMed] [Google Scholar]
- 28.Holick MF (2007). “Vitamin D Deficiency.” New England Journal of Medicine 357(3): 266–281. [DOI] [PubMed] [Google Scholar]
- 29.Hong J, Hatchell KE, Bradfield JP, Andrew B, Alessandra C, Chao-Qiang L, Langefeld CD, Lu L, Lu Y, Lutsey PL, Musani SK, Nalls MA, Robinson-Cohen C, Roizen JD, Saxena R, Tucker KL, Ziegler JT, Arking DE, Bis JC, Boerwinkle E, Bottinger EP, Bowden DW, Gilsanz V, Houston DK, Kalkwarf HJ, Kelly A, Lappe JM, Liu Y, Michos ED, Oberfield SE, Palmer ND, Rotter JI, Sapkota B, Shepherd JA, Wilson JG, Basu S, de Boer IH, Divers J, Freedman BI, Grant SFA, Hakanarson H, Harris TB, Kestenbaum BR, Kritchevsky SB, Loos RJF, Norris JM, Norwood AF, Ordovas JM, Pankow JS, Psaty BM, Sanhgera DK, Wagenknecht LE, Zemel BS, Meigs J, Dupuis J, Florez JC, Wang T, Liu C-T, Engelman CD and Billings LK (2018). “Trans-ethnic Evaluation Identifies Novel Low Frequency Loci Associated with 25-Hydroxyvitamin D Concentrations.” The Journal of Clinical Endocrinology & Metabolism: jc.2017–01802-jc.2017–01802. [DOI] [PMC free article] [PubMed] [Google Scholar]
- 30.INVESTIGATORS TA (1989). “THE ATHEROSCLEROSIS RISK IN COMMUNIT (ARIC) STUI)Y: DESIGN AND OBJECTWES.” American Journal of Epidemiology 129(4): 687–702. [PubMed] [Google Scholar]
- 31.Jiang X, O’Reilly PF, Aschard H, Hsu Y-H, Richards JB, Dupuis J, Ingelsson E, Karasik D, Pilz S, Berry D, Kestenbaum B, Zheng J, Luan J, Sofianopoulou E, Streeten EA, Albanes D, Lutsey PL, Yao L, Tang W, Econs MJ, Wallaschofski H, Völzke H, Zhou A, Power C, McCarthy MI, Michos ED, Boerwinkle E, Weinstein SJ, Freedman ND, Huang W-Y, Van Schoor NM, van der Velde N, Groot LCPGMd, Enneman A, Cupples LA, Booth SL, Vasan RS, Liu C-T, Zhou Y, Ripatti S, Ohlsson C, Vandenput L, Lorentzon M, Eriksson JG, Shea MK, Houston DK, Kritchevsky SB, Liu Y, Lohman KK, Ferrucci L, Peacock M, Gieger C, Beekman M, Slagboom E, Deelen J, Heemst Dv, Kleber ME, Marz W, de Boer IH, Wood AC, Rotter JI, Rich SS, Robinson-Cohen C, den Heijer M, Jarvelin M-R, Cavadino A, Joshi PK, Wilson JF, Hayward C, Lind L, Michaelsson K, Trompet S, Zillikens MC, Uitterlinden AG, Rivadeneira F, Broer L, Zgaga L, Campbell H, Theodoratou E, Farrington SM, Timofeeva M, Dunlop MG, Valdes AM, Tikkanen E, Lehtimaki T, Lyytikäinen L-P, Kähönen M, Raitakari OT, Mikkilä V, Ikram MA, Sattar N, Jukema JW, Wareham NJ, Langenberg C, Forouhi NG, Gundersen TE, Khaw K-T, Butterworth AS, Danesh J, Spector T, et al. (2018). “Genome-wide association study in 79,366 European-ancestry individuals informs the genetic architecture of 25-hydroxyvitamin D levels.” Nature Communications 9(1): 260. [DOI] [PMC free article] [PubMed] [Google Scholar]
- 32.Johnson AD, Handsaker RE, Pulit SL, Nizzari MM, O’Donnell CJ and de Bakker PIW (2008). “SNAP: a web-based tool for identification and annotation of proxy SNPs using HapMap.” Bioinformatics 24(24): 2938–2939. [DOI] [PMC free article] [PubMed] [Google Scholar]
- 33.Johnston HR, Hu Y-J, Gao J, O’Connor TD, Abecasis GR, Wojcik GL, Gignoux CR, Gourraud P-A, Lizee A, Hansen M, Genuario R, Bullis D, Lawley C, Kenny EE, Bustamante C, Beaty TH, Mathias RA, Barnes KC, Qin ZS and Consortium C (2017). “Identifying tagging SNPs for African specific genetic variation from the African Diaspora Genome.” Scientific Reports 7: 46398. [DOI] [PMC free article] [PubMed] [Google Scholar]
- 34.Jorde R, Sneve M, Figenschau Y, Svartberg J and Waterloo K (2008). “Effects of vitamin D supplementation on symptoms of depression in overweight and obese subjects: randomized double blind trial.” Journal of Internal Medicine 264(6): 599–609. [DOI] [PubMed] [Google Scholar]
- 35.Kheiri B, Abdalla A, Osman M, Ahmed S, Hassan M and Bachuwa G (2018). “Vitamin D deficiency and risk of cardiovascular diseases: a narrative review.” Clinical Hypertension 24: 9. [DOI] [PMC free article] [PubMed] [Google Scholar]
- 36.Kueider AM, Tanaka T, An Y, Kitner-Triolo MH, Palchamy E, Ferrucci L and Thambisetty M (2016). “State- and trait-dependent associations of vitamin-D with brain function during aging.” Neurobiology of Aging 39: 38–45. [DOI] [PMC free article] [PubMed] [Google Scholar]
- 37.Kunutsor SK, Burgess S, Munroe PB and Khan H (2014). “Vitamin D and high blood pressure: causal association or epiphenomenon?” European Journal of Epidemiology 29(1): 1–14. [DOI] [PubMed] [Google Scholar]
- 38.Kwak SK and Kim JH (2017). “Statistical data preparation: management of missing values and outliers.” Korean Journal of Anesthesiology 70(4): 407–411. [DOI] [PMC free article] [PubMed] [Google Scholar]
- 39.Lappe JM, Travers-Gustafson D, Davies KM, Recker RR and Heaney RP (2007). “Vitamin D and calcium supplementation reduces cancer risk: results of a randomized trial.” The American Journal of Clinical Nutrition 85(6): 1586–1591. [DOI] [PubMed] [Google Scholar]
- 40.Loh P-R, Danecek P, Palamara PF, Fuchsberger C, Reshef YA, Finucane HK, Schoenherr S, Forer L, McCarthy S, Abecasis GR, Durbin R and Price AL (2016). “Reference-based phasing using the Haplotype Reference Consortium panel.” Nature genetics 48(11): 1443–1448. [DOI] [PMC free article] [PubMed] [Google Scholar]
- 41.Mak T, Porsch RM, Choi SW and Sham PC (2018). “Polygenic scores for UK Biobank scale data.” bioRxiv. [Google Scholar]
- 42.Manichaikul A, Palmas W, Rodriguez CJ, Peralta CA, Divers J, Guo X, Chen W-M, Wong Q, Williams K, Kerr KF, Taylor KD, Tsai MY, Goodarzi MO, Sale MM, Diez-Roux AV, Rich SS, Rotter JI and Mychaleckyj JC (2012). “Population Structure of Hispanics in the United States: The Multi-Ethnic Study of Atherosclerosis.” PLoS Genetics 8(4): e1002640. [DOI] [PMC free article] [PubMed] [Google Scholar]
- 43.Manolio TA, Collins FS, Cox NJ, Goldstein DB, Hindorff LA, Hunter DJ, McCarthy MI, Ramos EM, Cardon LR and Chakravarti A (2009). “Finding the missing heritability of complex diseases.” Nature 461. [DOI] [PMC free article] [PubMed] [Google Scholar]
- 44.Manson JE, Cook NR, Lee IM, Christen W, Bassuk SS, Mora S, Gibson H, Gordon D, Copeland T, D’Agostino D, Friedenberg G, Ridge C, Bubes V, Giovannucci EL, Willett WC and Buring JE (2018). “Vitamin D Supplements and Prevention of Cancer and Cardiovascular Disease.” New England Journal of Medicine. [DOI] [PubMed] [Google Scholar]
- 45.Marquez-Luna C, Loh P-R and Price AL (2017). “Multiethnic polygenic risk scores improve risk prediction in diverse populations.” Genetic Epidemiology 41(8): 811–823. [DOI] [PMC free article] [PubMed] [Google Scholar]
- 46.Martin AR, Kanai M, Kamatani Y, Okada Y, Neale BM and Daly MJ (2019). “Clinical use of current polygenic risk scores may exacerbate health disparities.” Nature Genetics 51(4): 584–591. [DOI] [PMC free article] [PubMed] [Google Scholar]
- 47.Matise TC, Ambite JL, Buyske S, Carlson CS, Cole SA, Crawford DC, Haiman CA, Heiss G, Kooperberg C, Marchand LL, Manolio TA, North KE, Peters U, Ritchie MD, Hindorff LA and Haines JL (2011). “The Next PAGE in Understanding Complex Traits: Design for the Analysis of Population Architecture Using Genetics and Epidemiology (PAGE) Study.” American Journal of Epidemiology 174(7): 849–859. [DOI] [PMC free article] [PubMed] [Google Scholar]
- 48.Mazahery H and von Hurst PR (2015). “Factors Affecting 25-Hydroxyvitamin D Concentration in Response to Vitamin D Supplementation.” Nutrients 7(7): 5111–5142. [DOI] [PMC free article] [PubMed] [Google Scholar]
- 49.McKibben RA, Zhao D, Lutsey PL, Schneider ALC, Guallar E, Mosley TH and Michos ED (2016). “Factors Associated With Change in 25-Hydroxyvitamin D Levels Over Longitudinal Follow-Up in the ARIC Study.” The Journal of clinical endocrinology and metabolism 101(1): 33–43. [DOI] [PMC free article] [PubMed] [Google Scholar]
- 50.Medicine Io (2011). Dietary Reference Intakes for Calcium and Vitamin D. Washington, DC, The National Academies Press. [PubMed] [Google Scholar]
- 51.Melamed ML and Manson JE (2011). “Vitamin D and cardiovascular disease and cancer: not too much and not too little? The need for clinical trials.” Women’s health (London, England) 7(4): 419–424. [DOI] [PMC free article] [PubMed] [Google Scholar]
- 52.Mirhosseini N, Vatanparast H and Kimball SM (2017). “The Association between Serum 25(OH)D Status and Blood Pressure in Participants of a Community-Based Program Taking Vitamin D Supplements.” Nutrients 9(11): 1244. [DOI] [PMC free article] [PubMed] [Google Scholar]
- 53.Mokry LE, Ross S, Ahmad OS, Forgetta V, Smith GD, Leong A, Greenwood CMT, Thanassoulis G and Richards JB (2015). “Vitamin D and Risk of Multiple Sclerosis: A Mendelian Randomization Study.” PLoS Med 12(8): e1001866. [DOI] [PMC free article] [PubMed] [Google Scholar]
- 54.Mormino EC, Sperling RA, Holmes AJ, Buckner, De Jager, Smoller, Sabuncu and I Alzheimer’s Dis Neuroimaging (2016). “Polygenic risk of Alzheimer disease is associated with early- and late-life processes.” Neurology 87(5): 481–488. [DOI] [PMC free article] [PubMed] [Google Scholar]
- 55.Musunuru K, Lettre G, Young T, Farlow DN, Pirruccello JP, Ejebe KG, Keating BJ, Yang Q, Chen MH, Lapchyk N, Crenshaw A, Ziaugra L, Rachupka A, Benjamin EJ, Cupples LA, Fornage M, Fox ER, Heckbert SR, Hirschhorn JN, Newton-Cheh CH, Nizzari MM, Paltoo DN, Papanicolaou GJ, Patel SR, Psaty BM, Rader DJ, Redline S, Rich SS, Rotter JI, Taylor HA, Tracy RP, Vasan RS, Wilson JG, Kathiresan S, Fabsitz RR, Boerwinkle E and Gabriel SB (2010). “Candidate Gene Association Resource (CARe): Design, Methods, and Proof of Concept.” Circulation. Cardiovascular genetics 3(3): 267–275. [DOI] [PMC free article] [PubMed] [Google Scholar]
- 56.Nimitphong H, Saetung S, Chanprasertyotin S, Chailurkit L-o and Ongphiphadhanakul B (2013). “Changes in circulating 25-hydroxyvitamin D according to vitamin D binding protein genotypes after vitamin D3 or D2supplementation.” Nutrition Journal 12(1): 39. [DOI] [PMC free article] [PubMed] [Google Scholar]
- 57.Nissen J, Rasmussen LB, Ravn-Haren G, Andersen EW, Hansen B, Andersen R, Mejborn H, Madsen KH and Vogel U (2014). “Common Variants in CYP2R1 and GC Genes Predict Vitamin D Concentrations in Healthy Danish Children and Adults.” PLOS ONE 9(2): e89907. [DOI] [PMC free article] [PubMed] [Google Scholar]
- 58.Ong J-S, Cuellar-Partida G, Lu Y, Fasching PA, Hein A, Burghaus S, Beckmann MW, Lambrechts D, Van Nieuwenhuysen E, Vergote I, Vanderstichele A, Doherty J Anne, Rossing M Anne, Chang-Claude J, Eilber U, Rudolph A, Wang-Gohrke S, Goodman MT, Bogdanova N, Dork T, Durst M, Hillemanns P, Runnebaum IB, Antonenkova N, Butzow R, Leminen A, Nevanlinna H, Pelttari LM, Edwards RP, Kelley JL, Modugno F, Moysich KB, Ness RB, Cannioto R, Høgdall E, Høgdall CK, Jensen A, Giles GG, Bruinsma F, Kjaer SK, Hildebrandt MAT, Liang D, Lu KH, Wu X, Bisogna M, Dao F, Levine DA, Cramer DW, Terry KL, Tworoger SS, Stampfer M, Missmer S, Bjorge L, Salvesen HB, Kopperud RK, Bischof K, Aben KKH, Kiemeney LA, Massuger LFAG, Brooks-Wilson A, Olson SH, McGuire V, Rothstein JH, Sieh W, Whittemore AS, Cook LS, Le ND, Gilks CB, Gronwald J, Jakubowska A, Lubiński J, Kluz T, Song H, Tyrer JP, Wentzensen N, Brinton L, Trabert B, Lissowska J, McLaughlin JR, Narod SA, Phelan C, Anton-Culver H, Ziogas A, Eccles D, Campbell I, Gayther SA, Gentry-Maharaj A, Menon U, Ramus SJ, Wu AH, Dansonka-Mieszkowska A, Kupryjanczyk J, Timorek A, Szafron L, Cunningham JM, Fridley BL, Winham SJ, Bandera EV, Poole EM, Morgan TK, et al. (2016). “Association of vitamin D levels and risk of ovarian cancer: a Mendelian randomization study.” International Journal of Epidemiology 45(5): 1619–1630. [DOI] [PMC free article] [PubMed] [Google Scholar]
- 59.Pincikova T, Paquin-Proulx D, Sandberg JK, Flodström-Tullberg M and Hjelte L (2016). “Clinical impact of vitamin D treatment in cystic fibrosis: a pilot randomized, controlled trial.” European Journal Of Clinical Nutrition 71: 203. [DOI] [PubMed] [Google Scholar]
- 60.Purcell S, Neale B, Todd-Brown K, Thomas L, Ferreira MAR, Bender D, Maller J, Sklar P, de Bakker PIW, Daly MJ and Sham PC (2007). “PLINK: a tool set for whole-genome association and population-based linkage analyses.” American journal of human genetics 81(3): 559–575. [DOI] [PMC free article] [PubMed] [Google Scholar]
- 61.Robinson-Cohen C, Hoofnagle AN, Ix JH and et al. (2013). “Racial differences in the association of serum 25-hydroxyvitamin d concentration with coronary heart disease events.” JAMA 310(2): 179–188. [DOI] [PMC free article] [PubMed] [Google Scholar]
- 62.Schnatz PF, Jiang X, Aragaki AK, Nudy M, O’Sullivan DM, Williams M, LeBlanc ES, Martin LW, Manson JE, Shikany JM, Johnson KC, Stefanick ML, Payne ME, Cauley JA, Howard BV and Robbins J (2017). “Effects of Calcium, Vitamin D, and Hormone Therapy on Cardiovascular Disease Risk Factors in the Women’s Health Initiative: A Randomized Controlled Trial.” Obstetrics and gynecology 129(1): 121–129. [DOI] [PMC free article] [PubMed] [Google Scholar]
- 63.Shao B, Jiang S, Muyiduli X, Wang S, Mo M, Li M, Wang Z and Yu Y “Vitamin D pathway gene polymorphisms influenced vitamin D level among pregnant women.” Clinical Nutrition. [DOI] [PubMed] [Google Scholar]
- 64.Song T-J, Chu M-K, Sohn J-H, Ahn H-Y, Lee SH and Cho S-J (2018). “Effect of Vitamin D Deficiency on the Frequency of Headaches in Migraine.” Journal of Clinical Neurology (Seoul, Korea) 14(3): 366–373. [DOI] [PMC free article] [PubMed] [Google Scholar]
- 65.Tang W, Schwienbacher C, Lopez Lorna M, Ben-Shlomo Y, Oudot-Mellakh T, Johnson Andrew D, Samani Nilesh J, Basu S, Gögele M, Davies G, Lowe Gordon D, Tregouet D-A, Tan A, Pankow James S, Tenesa A, Levy D, Volpato Claudia B, Rumley A, Gow Alan J, Minelli C, Yarnell John W, Porteous David J, Starr John M, Gallacher J, Boerwinkle E, Visscher Peter M, Pramstaller Peter P, Cushman M, Emilsson V, Plump Andrew S, Matijevic N, Morange P-E, Deary Ian J, Hicks Andrew A and Folsom Aaron R (2012). “Genetic Associations for Activated Partial Thromboplastin Time and Prothrombin Time, their Gene Expression Profiles, and Risk of Coronary Artery Disease.” American Journal of Human Genetics 91(1): 152–162. [DOI] [PMC free article] [PubMed] [Google Scholar]
- 66.The Genomes Project, C, McVean GA, Altshuler DM, Durbin RM, Abecasis GR, Bentley DR, Chakravarti A, Clark AG, Donnelly P, Eichler EE, Flicek P, Gabriel SB, Gibbs RA, Green ED, Hurles ME, Knoppers BM, Korbel JO, Lander ES, Lee C, Lehrach H, Mardis ER, Marth GT, McVean GA, Nickerson DA, Schmidt JP, Sherry ST, Wang J, Wilson RK, Gibbs RA, Dinh H, Kovar C, Lee S, Lewis L, Muzny D, Reid J, Wang M, Wang J, Fang X, Guo X, Jian M, Jiang H, Jin X, Li G, Li J, Li Y, Li Z, Liu X, Lu Y, Ma X, Su Z, Tai S, Tang M, Wang B, Wang G, Wu H, Wu R, Yin Y, Zhang W, Zhao J, Zhao M, Zheng X, Zhou Y, Lander ES, Altshuler DM, Gabriel SB, Gupta N, Flicek P, Clarke L, Leinonen R, Smith RE, Zheng-Bradley X, Bentley DR, Grocock R, Humphray S, James T, Kingsbury Z, Lehrach H, Sudbrak R, Albrecht MW, Amstislavskiy VS, Borodina TA, Lienhard M, Mertes F, Sultan M, Timmermann B, Yaspo M-L, Sherry ST, McVean GA, Mardis ER, Wilson RK, Fulton L, Fulton R, Weinstock GM, Durbin RM, Balasubramaniam S, Burton J, Danecek P, Keane TM, Kolb-Kokocinski A, McCarthy S, et al. (2012). “An integrated map of genetic variation from 1,092 human genomes.” Nature 491: 56. [DOI] [PMC free article] [PubMed] [Google Scholar]
- 67.Vassos E, Di Forti M, Coleman J, Iyegbe C, Prata D, Euesden J, O’Reilly P, Curtis C, Kolliakou A, Patel H, Newhouse S, Traylor M, Ajnakina O, Mondelli V, Marques TR, Gardner-Sood P, Aitchison KJ, Powell J, Atakan Z, Greenwood KE, Smith S, Ismail K, Pariante C, Gaughran F, Dazzan P, Markus HS, David AS, Lewis CM, Murray RM and Breen G (2017). “An Examination of Polygenic Score Risk Prediction in Individuals With First-Episode Psychosis.” Biological Psychiatry 81(6): 470–477. [DOI] [PubMed] [Google Scholar]
- 68.Vimaleswaran KS, Berry DJ, Lu C, Tikkanen E, Pilz S, Hiraki LT, Cooper JD, Dastani Z, Li R, Houston DK, Wood AR, Michaëlsson K, Vandenput L, Zgaga L, Yerges-Armstrong LM, McCarthy MI, Dupuis J, Kaakinen M, Kleber ME, Jameson K, Arden N, Raitakari O, Viikari J, Lohman KK, Ferrucci L, Melhus H, Ingelsson E, Byberg L, Lind L, Lorentzon M, Salomaa V, Campbell H, Dunlop M, Mitchell BD, Herzig K-H, Pouta A, Hartikainen A-L, c the Genetic Investigation of Anthropometric Traits, Streeten EA, Theodoratou E, Jula A, Wareham NJ, Ohlsson C, Frayling TM, Kritchevsky SB, Spector TD, Richards JB, Lehtimäki T, Ouwehand WH, Kraft P, Cooper C, März W, Power C, Loos RJF, Wang TJ, Järvelin M-R, Whittaker JC, Hingorani AD and Hypponen E (2013). “Causal Relationship between Obesity and Vitamin D Status: Bi-Directional Mendelian Randomization Analysis of Multiple Cohorts.” PLoS Medicine 10(2): e1001383. [DOI] [PMC free article] [PubMed] [Google Scholar]
- 69.Vimaleswaran KS, Cavadino A, Berry DJ, i LifeLines Cohort Study, Jorde R, Dieffenbach AK, Lu C, Alves AC, Heerspink HJL, Tikkanen E, Eriksson J, Wong A, Mangino M, Jablonski KA, Nolte IM, Houston DK, Ahluwalia TS, van der Most PJ, Pasko D, Zgaga L, Thiering E, Vitart V, Fraser RM, Huffman JE, de Boer RA, Schöttker B, Saum K-U, McCarthy MI, Dupuis J, Herzig K-H, Sebert S, Pouta A, Laitinen J, Kleber ME, Navis G, Lorentzon M, Jameson K, Arden N, Cooper JA, Acharya J, Hardy R, Raitakari O, Ripatti S, Billings LK, Lahti J, Osmond C, Penninx BW, Rejnmark L, Lohman KK, Paternoster L, Stolk RP, Hernandez DG, Byberg L, Hagström E, Melhus H, Ingelsson E, Mellstrom D, Ljunggren Ö, Tzoulaki I, McLachlan S, Theodoratou E, Tiesler CMT, Jula A, Navarro P, Wright AF, Polasek O, CfH International Consortium for Blood Pressure, GBPGc Aging Research in Genomic Epidemiology consortium, Hayward C, Wilson JF, Rudan I, Salomaa V, Heinrich J, Campbell H, Price JF, Karlsson M, Lind L, Michaëlsson K, Bandinelli S, Frayling TM, Hartman CA, Sørensen TIA, Kritchevsky SB, Langdahl BL, Eriksson JG, Florez JC, Spector TD, Lehtimaki T, Kuh D, Humphries SE, Cooper C, Ohlsson C, Marz W, de Borst MH, Kumari M, Kivimaki M, Wang TJ, Power C, Brenner H, Grimnes G, et al. (2014). “Association of vitamin D status with arterial blood pressure and hypertension risk: a mendelian randomisation study.” The lancet. Diabetes & endocrinology 2(9): 719–729. [DOI] [PMC free article] [PubMed] [Google Scholar]
- 70.Wang TJ, Zhang F, Richards JB, Kestenbaum B, van Meurs JB, Berry D, Kiel D, Streeten EA, Ohlsson C, Koller DL, Palotie L, Cooper JD, O’Reilly PF, Houston DK, Glazer NL, Vandenput L, Peacock M, Shi J, Rivadeneira F, McCarthy MI, Anneli P, de Boer IH, Mangino M, Kato B, Smyth DJ, Booth SL, Jacques PF, Burke GL, Goodarzi M, Cheung C-L, Wolf M, Rice K, Goltzman D, Hidiroglou N, Ladouceur M, Hui SL, Wareham NJ, Hocking LJ, Hart D, Arden NK, Cooper C, Malik S, Fraser WD, Hartikainen A-L, Zhai G, Macdonald H, Forouhi NG, Loos RJF, Reid DM, Hakim A, Dennison E, Liu Y, Power C, Stevens HE, Jaana L, Vasan RS, Soranzo N, Bojunga J, Psaty BM, Lorentzon M, Foroud T, Harris TB, Hofman A, Jansson J-O, Cauley JA, Uitterlinden AG, Gibson Q, Jarvelin M-R, Karasik D, Siscovick DS, Econs MJ, Kritchevsky SB, Florez JC, Todd JA, Dupuis J, Hypponen E and Spector TD (2010). “Common genetic determinants of vitamin D insufficiency: a genome-wide association study.” Lancet 376(9736): 180–188. [DOI] [PMC free article] [PubMed] [Google Scholar]
- 71.Ware EB, Schmitz LL, Faul JD, Gard A, Mitchell C, Smith JA, Zhao W, Weir D and Kardia SL (2017). “Heterogeneity in polygenic scores for common human traits.” bioRxiv: 106062. [Google Scholar]
- 72.Weaver CM, Alexander DD, Boushey CJ, Dawson-Hughes B, Lappe JM, LeBoff MS, Liu S, Looker AC, Wallace TC and Wang DD (2016). “Calcium plus vitamin D supplementation and risk of fractures: an updated meta-analysis from the National Osteoporosis Foundation.” Osteoporosis International 27(1): 367–376. [DOI] [PMC free article] [PubMed] [Google Scholar]
- 73.Wjst M (2017). “Linking vitamin D, the microbiome and allergy.” Allergy 72(3): 329–330. [DOI] [PubMed] [Google Scholar]
- 74.Yang J, Lee SH, Goddard ME and Visscher PM (2011). “GCTA: A Tool for Genome-wide Complex Trait Analysis.” American Journal of Human Genetics 88(1): 76–82. [DOI] [PMC free article] [PubMed] [Google Scholar]
- 75.Zhang Z, He J-W, Fu W-Z, Zhang C-Q and Zhang Z-L (2013). “An analysis of the association between the vitamin D pathway and serum 25-hydroxyvitamin D levels in a healthy Chinese population.” Journal of Bone and Mineral Research 28(8): 1784–1792. [DOI] [PubMed] [Google Scholar]
- 76.Zhu Z, Zhang F, Hu H, Bakshi A, Robinson MR, Powell JE, Montgomery GW, Goddard ME, Wray NR, Visscher PM and Yang J (2016). “Integration of summary data from GWAS and eQTL studies predicts complex trait gene targets.” Nature Genetics 48: 481. [DOI] [PubMed] [Google Scholar]
Associated Data
This section collects any data citations, data availability statements, or supplementary materials included in this article.