Grey et al. discover a mechanism by which the epithelial-specific ER stress sensor IRE1β acts as a negative regulator of IRE1α. IRE1β interacts directly with IRE1α to suppress XBP-1 splicing and modify the unfolded protein response to endoplasmic reticulum stress in intestinal epithelial cells.
Abstract
IRE1β is an ER stress sensor uniquely expressed in epithelial cells lining mucosal surfaces. Here, we show that intestinal epithelial cells expressing IRE1β have an attenuated unfolded protein response to ER stress. When modeled in HEK293 cells and with purified protein, IRE1β diminishes expression and inhibits signaling by the closely related stress sensor IRE1α. IRE1β can assemble with and inhibit IRE1α to suppress stress-induced XBP1 splicing, a key mediator of the unfolded protein response. In comparison to IRE1α, IRE1β has relatively weak XBP1 splicing activity, largely explained by a nonconserved amino acid in the kinase domain active site that impairs its phosphorylation and restricts oligomerization. This enables IRE1β to act as a dominant-negative suppressor of IRE1α and affect how barrier epithelial cells manage the response to stress at the host–environment interface.
Introduction
All mammalian cell types have three sensors in the ER, IRE1α, ATF6, and PERK, which detect imbalances in protein folding and trigger an integrated set of signaling pathways to restore normal proteostasis. This is called the unfolded protein response (UPR). If protein folding in the ER remains unresolved, prolonged UPR signaling induces cell death (Chang et al., 2018; Hetz and Papa, 2018; Lu et al., 2014; Walter and Ron, 2011). Epithelial cells lining the intestine and other mucosal surfaces that interface with the environment are unique in that they express an additional ER stress sensor called IRE1β (ERN2 gene; Bertolotti et al., 2001; Iwawaki et al., 2001; Martino et al., 2013; Tsuru et al., 2013; Wang et al., 1998). IRE1β is a close paralogue of the ubiquitously expressed IRE1α (Tirasophon et al., 1998). Both are dual kinase/endonucleases that splice XBP1 mRNA to produce the transcription factor XBP1, which functions to induce the UPR (Calfon et al., 2002; Lee et al., 2002; Yoshida et al., 2001). Both IRE1α and IRE1β can also degrade other mRNA sequences targeted to the ER for translation, termed regulated IRE1-dependent decay of mRNA (or RIDD; Hollien et al., 2009; Hollien and Weissman, 2006; Imagawa et al., 2008; Iwawaki et al., 2001; Tsuru et al., 2013), including for IRE1α the ability to autoregulate its own expression by degrading its own mRNA (Tirasophon et al., 2000). Despite the high degree of sequence homology between the two molecules, IRE1β and IRE1α appear to have distinct enzymatic activities, and how IRE1β functions in the ER stress response remains inconclusively defined. In cell culture, some studies show that IRE1β can sense ER stress and activate the UPR by splicing XBP1 transcripts (Tirasophon et al., 2000; Wang et al., 1998), but other reports suggest it is less effective than IRE1α at splicing XBP1 and signals through other mechanisms to mitigate ER stress (Imagawa et al., 2008; Iwawaki et al., 2001).
In vivo, under normal physiological conditions, the intestine and colon of mice lacking IRE1β (IRE1β−/−) show evidence of an elevated UPR compared with WT controls, including increased levels of spliced XBP1 transcript indicative of IRE1α activation (Bertolotti et al., 2001; Tschurtschenthaler et al., 2017; Tsuru et al., 2013). The phenotype suggests that IRE1β may function to suppress IRE1α activity and perhaps other elements of the UPR. Such a role for IRE1β in diminishing ER stress in the intestine was most recently implicated in mice conditionally lacking both the IRE1α substrate XBP1 and the autophagy factor ATG16L1 (Tschurtschenthaler et al., 2017). At the molecular level, activation of IRE1α by ER stress appears to require homo-oligomerization and autophosphorylation (Bertolotti et al., 2000; Li et al., 2010). Given the close homology between the two proteins, we became interested in testing the hypothesis that IRE1β may modulate the UPR by interacting and assembling directly with IRE1α. We examined IRE1β function in intestinal epithelial cells, HEK293 cells, and in vitro using purified proteins. Our cell and biochemical data show that IRE1β dampens the UPR to ER stress. IRE1β restricts ER stress–induced IRE1α endonuclease activity, as assessed by XBP1 splicing, and it reverses the increases in IRE1α and XBP1 expression expected for the UPR. We define structural features of the IRE1β kinase domain that contribute to these effects and enable IRE1β to act as a direct and dominant-negative suppressor of IRE1α signaling. This activity appears to have been evolutionarily conserved in epithelial cells lining the mucosa of vertebrates, perhaps, as proposed before (Bertolotti et al., 2001), to dampen amplified ER stress responses inherent to the host–environment interface.
Results
Cells expressing IRE1β exhibit attenuated UPR signaling
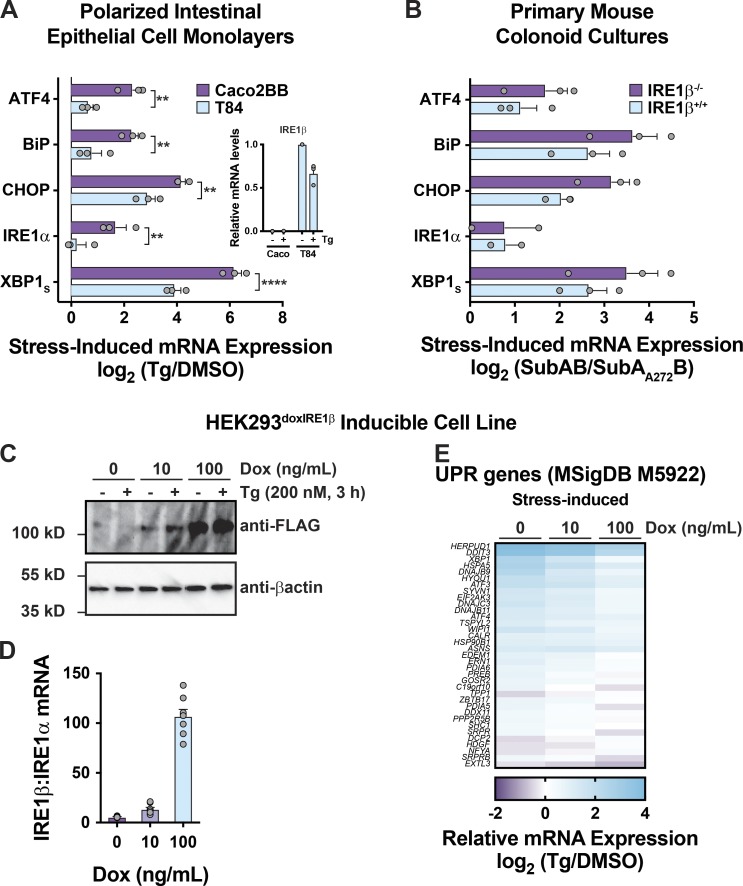
Previous studies suggest that IRE1β restricts IRE1α and UPR signaling in vivo under normal homeostatic conditions (Bertolotti et al., 2001; Tschurtschenthaler et al., 2017; Tsuru et al., 2013). To test this idea, we compared the UPR in polarized human intestinal epithelial cell lines expressing different levels of IRE1β. The human intestinal T84 cell line expresses IRE1β transcript, but the human intestinal Caco2 cell line does not (>500-fold difference; Fig. 1 A, inset). When treated with thapsigargin (Tg) to induce ER stress, Caco2 cells responded with robust activation of all three branches of the UPR, as seen by increases in mRNA for BiP, ATF4, CHOP/DDIT3, and spliced XBP1 (Fig. 1 A, purple bars). They also responded with increased IRE1α mRNA expression as expected for the UPR. In comparison, T84 cells had significantly reduced induction of mRNA for these genes (Fig. 1 A, light blue bars). Similar results were obtained using primary intestinal colonoids prepared from WT (IRE1β+/+) or IRE1β−/− mice (Fig. 1 B). In this case, ER stress was induced using subtilase cytotoxin (SubAB; Paton et al., 2006; Paton et al., 2004). Thus, in intestinal cells, IRE1β expression is correlated with reduced IRE1α and UPR signaling in response to ER stress.
Figure 1.
Cells expressing IRE1β exhibit attenuated UPR signaling. (A) Tg-induced mRNA expression of UPR genes assayed by qPCR for polarized Caco2 and T84 monolayers (log2 [Tg-treated/DMSO control], n = 3). (B) Subtilase cytotoxin-induced mRNA expression of UPR genes assayed by qPCR for IRE1β+/+ and IRE1β−/− mouse primary colonoids (log2 [SubAB-treated/SubAA272B-treated], n = 3). (C) IRE1β expression assayed by immunoblot (representative of three experiments). (D) IRE1β/IRE1α transcript ratio assayed by qPCR (n = 8). (E) Stress-induced differential expression of UPR markers (Tg compared with DMSO) was assayed by RNA-seq for HEK293doxIRE1β cells treated with Dox and Tg as indicated (n = 3). The anti-FLAG and anti-βactin immunoblots are duplicated in Fig. S1 B and Fig. 3 B, as the same experiment was used to assess expression in mock-transduced cells (Fig. S1 B) and IRE1α expression (Fig. 3 B). Bars and error bars represent mean values ± SEM; significance is indicated by asterisks (*, P < 0.05; **, P < 0.01; ***, P < 0.001; ****, P < 0.0001).
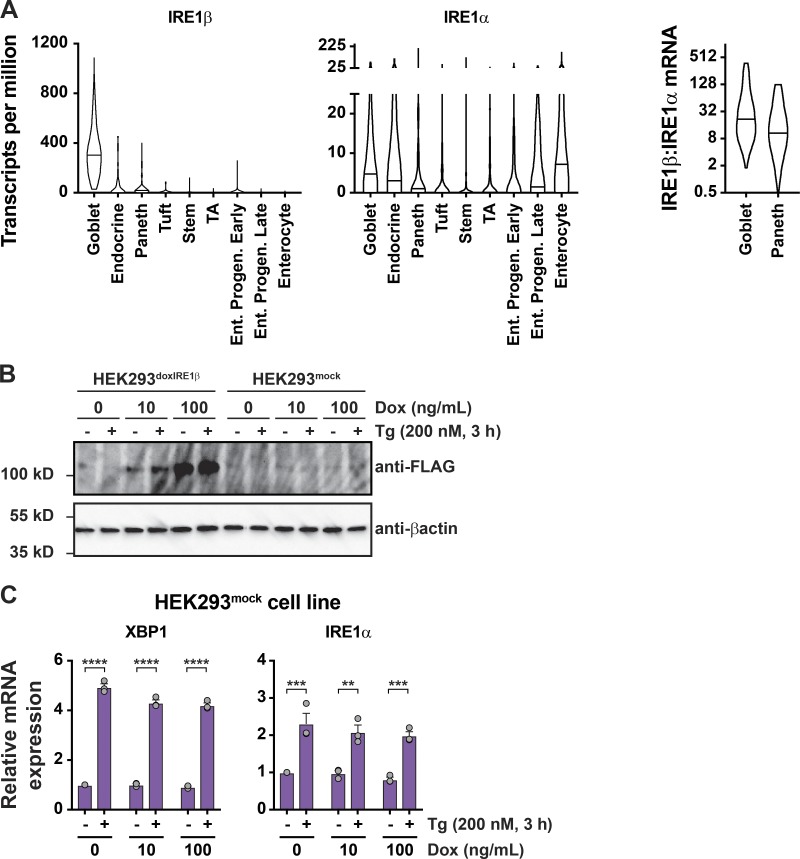
To test if IRE1β was sufficient to attenuate the UPR, we generated a HEK293 cell model with doxycycline (Dox)–inducible expression of FLAG-tagged IRE1β (HEK293doxIRE1β). Dox treatments induced IRE1β expression in a dose-dependent manner (Fig. 1 C). At the transcript level, this corresponded to ∼10- and 100-fold higher levels of IRE1β relative to endogenous IRE1α after treatments with 10 or 100 ng/ml Dox, respectively (Fig. 1 D). Similar levels of expression for IRE1β relative to IRE1α were observed in normal mouse small intestine (Haber et al., 2017). In goblet cells, for example, the IRE1β/IRE1α mRNA transcript ratios as measured in single cells ranged from 2:1 to 384:1, with a mean value of 51:1 (Fig. S1 A). In the absence of IRE1β (no Dox), Tg treatment of HEK293doxIRE1β cells caused the expected induction of a conventional UPR transcriptional program (Fig. 1 E and Data S1), including up-regulation of HSPA5, ATF4, DDIT3, XBP1, and IRE1α. When HEK293doxIRE1β cells were induced to express IRE1β by treatment with Dox, there was a dose-dependent reduction in stress-induced UPR gene expression and correspondingly less enrichment of differentially expressed genes in the UPR signature (reduced on average by 1.2-fold and 1.8-fold). Dox treatment on its own did not affect UPR signaling in mock-transduced cells (HEK293mock, Fig. S1, B and C). Thus, IRE1β can attenuate stress-induced UPR signaling.
Figure S1.
Expression of IRE1β in intestinal epithelial cells and cell models. Supports Fig. 1. (A) Violin plots for expression of IRE1β and IRE1α transcripts in transcriptionally defined cell populations from mouse small intestine. Lines indicated median values. Data are from GSE92332 (Haber et al., 2017). The ratio of IRE1β/IRE1α expression for individual cells is plotted for goblet and Paneth cell populations. (B) IRE1β protein expression (top) and XBP1 and IRE1α mRNA expression for HEK293mock cell line treated Dox and Tg as indicated (bottom; n = 3). The anti-FLAG and anti-βactin blots are duplicated from Fig. 1 C to include HEK293doxIRE1β cells and HEK293mock cells from the same experiment. Bars and error bars represent mean values ± SEM; significance is indicated by asterisks (*, P < 0.05; **, P < 0.01; ***, P < 0.001; ****, P < 0.0001).
IRE1β suppresses IRE1α-XBP1 signaling
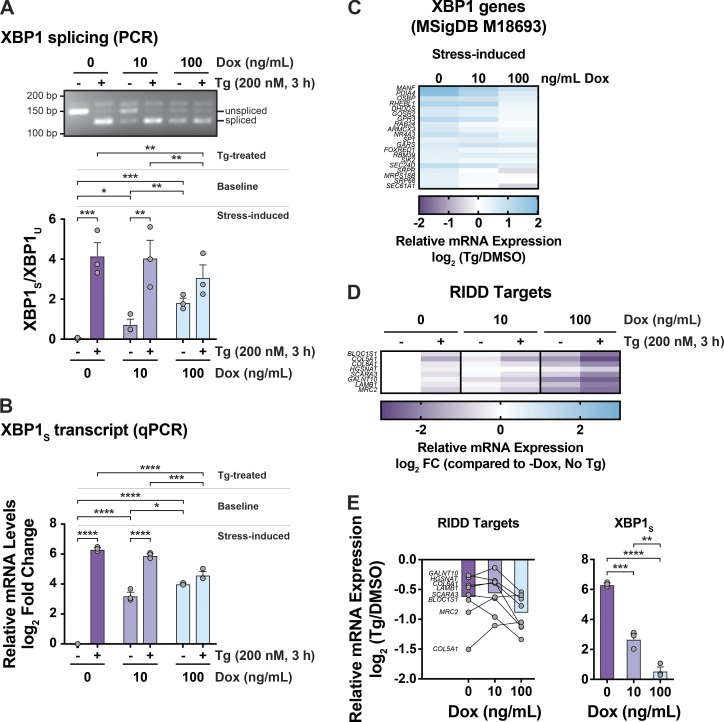
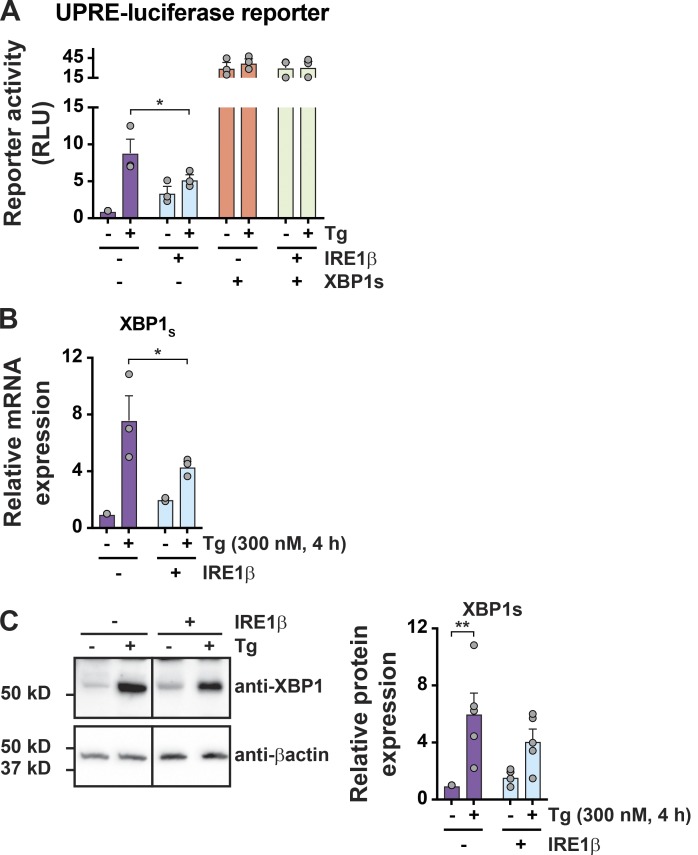
To study how IRE1β affects IRE1α signaling, we first measured splicing of XBP1 mRNA, a reaction specific to the IRE1-branch of the UPR. In HEK293doxIRE1β cells lacking IRE1β, Tg treatment resulted in the expected increase in XBP1 splicing as measured by the ratio of spliced to unspliced XBP1 transcript (Fig. 2 A, first two lanes and purple bars) and by quantitative PCR (qPCR; Fig. 2 B, purple bars). The induction of IRE1β expression dose-dependently increased the level of XBP1 splicing in cells at rest (no Tg treatment) compared with cells without Dox (Fig. 2, A and B, no Tg), consistent with XBP1 splicing by IRE1β itself or secondarily by activation of IRE1α. When treated with Tg to induce ER stress, however, the expression of IRE1β in HEK293doxIRE1β cells dose-dependently attenuated the further splicing of XBP1 (Fig. 2, A and B, + Tg), and cells expressing high levels of IRE1β have significantly less spliced XBP1 in response to ER stress compared with control cells (Fig. 2, A and B, 100 ng/ml Dox versus no Dox). This was associated with marked decreases in stress-induced expression of XBP1-dependent genes (Fig. 2 C). Consistent with this expression profile, IRE1β reduced XBP1 transcriptional activity, as seen in HEK293T cells expressing a UPRE-luciferase reporter (Wang et al., 2000; Fig. S2 A; the transient expression of IRE1β in HEK293T cells also reduced spliced XBP1 mRNA and protein as seen in HEK293doxIRE1β cells, Fig. S2, B and C). Coexpression of XBP1 protein in this model rescued UPRE reporter activity, indicating that IRE1β acts upstream of XBP1s. Thus, IRE1β impairs the stress response normally mediated by IRE1α-XBP1 signaling.
Figure 2.
IRE1β suppresses IRE1α–XBP1 signaling. (A and B) XBP1 splicing was assayed by (A) PCR and gel electrophoresis to detect spliced and unspliced XBP1 or (B) qPCR to detect spliced XBP1 transcript in HEK293doxIRE1β cells treated with Dox and Tg as indicated (n = 3). (C) Same as in A, with differential expression of XBP1 genes assayed by RNA-seq. Data are shown for stress-induced expression (Tg compared with DMSO, left panel) for all genes in signature that are differentially expressed for control cells (No Dox, n = 3). (D) Same as in C for indicated RIDD targets relative to control cells (No Dox) without stress treatment (No Tg). (E) Left: Stress-induced changes in expression of RIDD targets for cells treated with indicated concentrations of Dox. Bars represent the average fold change for all targets. The symbols represent the mean fold change for an individual target gene. Right: Stress-induced fold change in spliced XBP1 transcript replotted from qPCR data in B. Bars and error bars represent mean values ± SEM; significance is indicated by asterisks (*, P < 0.05; **, P < 0.01; ***, P < 0.001; ****, P < 0.0001).
Figure S2.
IRE1β suppresses XBP1 transcriptional activity. Supports Fig. 2. (A) HEK293T cells were cotransfected with UPRE-luciferase reporter and indicated plasmids, treated with Tg for 8 h, and assayed for luciferase activity. Activity is plotted relative to mock-transfected cells without Tg (n = 3). (B and C) Spliced XBP1 mRNA (B; n = 3) and XBP1 protein levels (C; n = 5) in HEK293T cells with control plasmid or IRE1β expression plasmid and treated with Tg for 4 h. Bars and error bars represent mean values ± SEM; significance is indicated by asterisks (*, P < 0.05; **, P < 0.01; ***, P < 0.001; ****, P < 0.0001).
The suppression of IRE1α signaling, however, was not apparent for RIDD signaling as measured by mRNA levels of known RIDD targets, including BLOC1S1 (Hollien et al., 2009). In control cells, in the absence of IRE1β, the induction of ER stress by Tg treatment resulted in decreased expression for all RIDD target genes as expected (Fig. 2 D, columns 1 versus 2; and Data S1). Expression of IRE1β in cells not treated with Tg (no ER stress) resulted in decreased expression of all RIDD targets (Data S1, compare columns 1, 3, and 5). And, following Tg treatment, mRNA levels were further decreased (lanes 3 vs. 4, and lanes 5 vs. 6). On average, the stress-induced fold-change for all RIDD targets tended to be greater in IRE1β expressing cells (Fig. 2 E, left panel bar graph), where six of the eight RIDD genes studied showed a more pronounced stress-induced response (Fig. 2 E, left panel individual gene plots), compared with control cells. Thus, unlike the attenuated stress-induced XBP1 splicing when IRE1β is expressed (Fig. 2 E, right panel), the stress-induced RIDD activity appears to remain largely intact and perhaps even enhanced.
Suppression of IRE1α expression does not explain how IRE1β affects the UPR
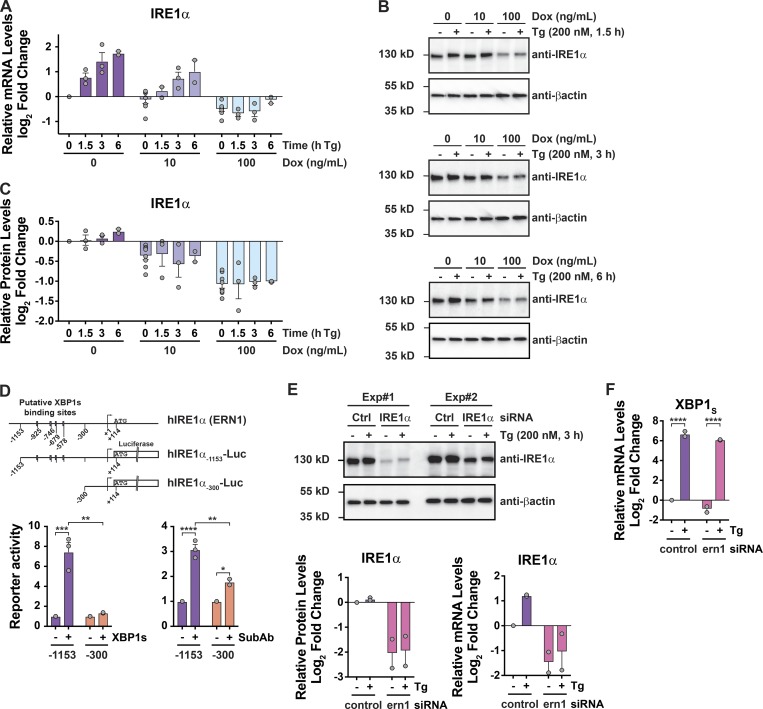
The UPR amplifies IRE1α expression in HEK293doxIRE1β cells (Fig. 3, A–C, no Dox purple bars; and Fig. S3 for HEK293T cells) as has been reported previously (Tsuru et al., 2016). We found this effect was mediated, at least in part, by XBP1s, where four putative XBP1 binding sites in the IRE1α promoter were responsive to both XBP1s transient expression or the induction of ER stress (Fig. 3 D and Data S2). However, when IRE1β expression was induced in HEK293doxIRE1β cells (or by transient transfection in HEK293T cells), we observed significantly reduced IRE1α mRNA and protein levels at rest (in the absence of Tg) and no detectable up-regulation of IRE1α after the induction of ER stress (Fig. 3, A–C, Dox treated; and Fig. S3). Both results are consistent with IRE1β suppression of IRE1a XBP1 splicing. Thus, one explanation for how IRE1β may reduce IRE1α–XBP1 signaling could be by transcriptional suppression of IRE1α. To test this possibility, we used siRNA to knockdown IRE1α in HEK293doxIRE1b cells. Both IRE1α mRNA and proteins levels were reduced more than fourfold compared with control cells transfected with nontargeting siRNA (Fig. 3 E). Nonetheless, these cells still responded to ER stress by splicing XBP1 at levels comparable to control cells (Fig. 3 F). We conclude that the lower levels of IRE1α expression seen in our model cannot fully explain the impaired ER stress response caused by IRE1β, suggesting other mechanisms of action.
Figure 3.
Suppression of IRE1α expression does not explain how IRE1β affects the UPR. (A–C) IRE1α expression was assayed by (A) qPCR for mRNA or (B) immunoblot for protein in HEK293doxIRE1β cells treated with Tg for indicated time points (immunoblots are representative of two or three independent experiments). The anti-βactin blot for the 3-h Tg treatment (fourth row down) is duplicated from Fig. 1 C, as the same experiment and membrane was used to probe for anti-FLAG (Fig. 1 C), anti-IRE1α, and anti-βactin. The actin normalized band intensities are plotted in C. For A and C, data are plotted as log2 fold change relative to 0 ng/ml Dox without Tg. Each experiment for a given time point included a control sample without Tg. (D) Top: Schematic of human IRE1α gene (ERN1) promoter region and luciferase reporter constructs. Putative XBP1 binding sites are indicated as boxes. (Bottom panel) IRE1α-Luc reporter activity in HEK293T cells (left) cotransfected with either control vector or XBP1 expression vector or (right) treated with SubAA272B or SubAB (100 ng/ml) for 8 h (n = 3). (E) IRE1α protein and mRNA levels in HEK293doxIRE1β cells transfected with IRE1α siRNA or control siRNA and treated with Tg (n = 2). (F) Same as in E for spliced XBP1 mRNA. Bars and error bars represent mean values ± SEM; significance is indicated by asterisks (*, P < 0.05; **, P < 0.01; ***, P < 0.001; ****, P < 0.0001).
Figure S3.
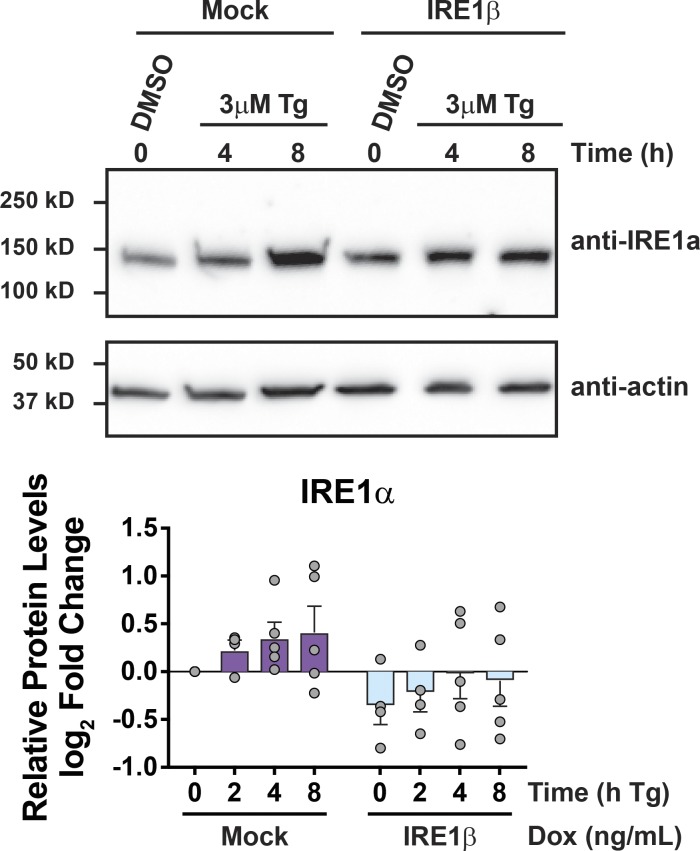
IRE1β restricts stress-induced IRE1α expression. Supports Fig. 3. Top: IRE1α protein detected by immunoblot for HEK293T cells transiently transfected with control plasmid or IRE1β expression plasmid and treated with Tg for indicated time points. Bottom: Actin-normalized band intensities from immunoblots plotted as log2 fold change compared with untreated (no Tg) mock-transfected cells (n = 5). Bars and error bars represent mean values ± SEM.
IRE1β enzymatic activities are not required
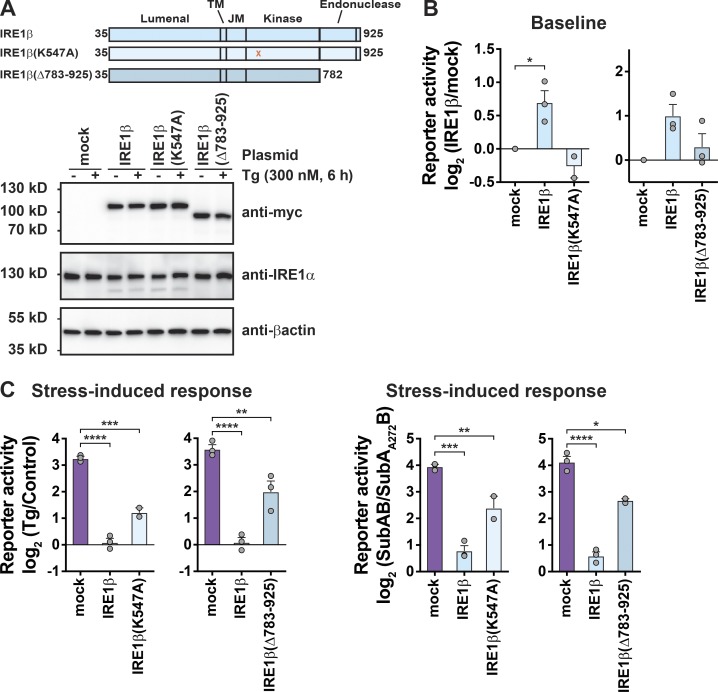
Like IRE1α, IRE1β has cytosolic kinase and endonuclease domains. To test if these enzymatic activities are required to suppress XBP1 splicing, we prepared IRE1β expression constructs with inactivating point mutation in the kinase domain (IRE1βK574A) or with deletion of the endonuclease domain (IRE1β(Δ783–925); Fig. 4 A). Full-length IRE1β or mutant IRE1β was then coexpressed along with a luciferase reporter for XBP1 splicing (Iwawaki and Akai, 2006) in HEK293T cells that contain endogenous IRE1α. All IRE1β constructs were expressed at similar protein levels (Fig. 4 A, bottom panel). ER stress was induced using Tg or SubAB or its enzymatically inactive mutant (SubAA272B) as control (Paton et al., 2006; Paton et al., 2004). In cells at rest (baseline, Fig. 4 B), expression of WT IRE1β caused an increase in XBP1 splicing (luciferase reporter activity) as we saw before in HEK293doxIRE1β cells. But expression of the IRE1β mutants lacking kinase activity or the endonuclease domain did not. Thus, in cells expressing IRE1β, the increased levels of XBP1s at baseline are explained by the endonuclease activity of IRE1β and not by secondary activation of ER stress. In the presence of ER stress, however, transfection of WT IRE1β or either mutant protein significantly reduced XBP1 splicing (measured as reporter activity; Fig. 4 C), indicating that enzymatic activities are not required.
Figure 4.
IRE1β enzymatic activity is not required to suppress stress-induced XBP1 splicing. (A) Schematic of IRE1β constructs. All constructs have C-terminal Myc tag. Expression of constructs in HEK293T cells was assayed by immunoblot with anti-Myc antibody. (B and C) XBP1 splicing activity was measured using a luciferase reporter in HEK293T cells cotransfected with indicated IRE1β expression plasmids and stimulated with either Tg or SubAB. Luciferase activity is plotted (B) as the fold change relative to mock-transfected, control-treated cells at baseline or (C) as the stress-induced fold change relative to control for a given IRE1β construct (n = 3). Bars and error bars represent mean values ± SEM; significance is indicated by asterisks (*, P < 0.05; **, P < 0.01; ***, P < 0.001; ****, P < 0.0001).
IRE1β can assemble with IRE1α
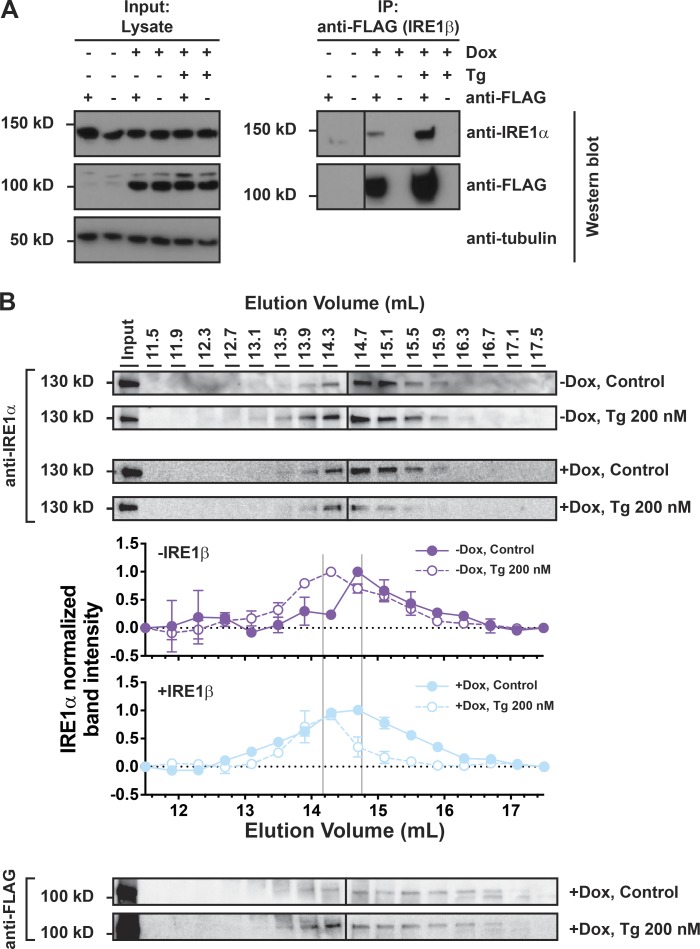
We next wanted to test if IRE1β interacts directly with IRE1α. We first used HEK293doxIRE1β cells for coimmunoprecipitation studies. In Dox-treated cells expressing IRE1β (FLAG tagged), immunoprecipitation of IRE1β from total cell lysates using anti-FLAG antibody coimmunoprecipitated endogenous IRE1α as assessed by immunoblot (Fig. 5 A). Notably, IRE1α and IRE1β were coimmunoprecipitated in the absence of Tg, suggesting that IRE1β may constitutively interact with IRE1α. Similar results were obtained using HEK293 cells transiently transfected with FLAG-tagged IRE1β (Fig. S4). Thus, IRE1β appears to physically interact with IRE1α. As an additional test of interaction between IRE1α and IRE1β, we fractionated HEK293doxIRE1β cell lysates by gel filtration chromatography and assayed for IRE1α and IRE1β elution. In cells lacking IRE1β, the induction of ER stress shifted the elution of IRE1α from ∼15 ml in untreated cells to ∼14 ml in Tg-treated cells (Fig. 5 B, top two blots and graph with purple lines/symbols). This is consistent with the formation of higher-order oligomers associated with IRE1α activation (Bertolotti et al., 2000; Li et al., 2010). Expression of IRE1β, on the other hand, shifted IRE1α elution to higher apparent molecular weight even in the absence of ER stress (no Tg); this was more pronounced following Tg treatment (Fig. 5 B, bottom two blots and graph with light blue lines/symbols). IRE1β coeluted with IRE1α under these conditions (Fig. 5 B, anti-FLAG immunoblots). These results suggest that IRE1β and IRE1α may form mixed oligomeric species.
Figure 5.
IRE1β interacts with IRE1α. (A) IRE1α and IRE1β proteins were assayed by immunoblot with anti-IRE1α or anti-FLAG antibodies, respectively, for lysates or samples immunoprecipitated with anti-FLAG from HEK293doxIRE1β cells treated with Dox and Tg as indicated. Blots are representative of three independent experiments. (B) Oligomerization of endogenous IRE1α was assayed by gel filtration fractionation of lysates from HEK293doxIRE1β cells and immunoblot with anti-IRE1α antibody. Fraction band intensities are plotted relative to the band intensity for the input sample, which was included on each gel, and normalized to fractions with the highest relative intensity (assigned a value of 1) and lowest relative intensity (assigned a value of 0). Symbols represent mean ± range for two independent experiments.
Figure S4.
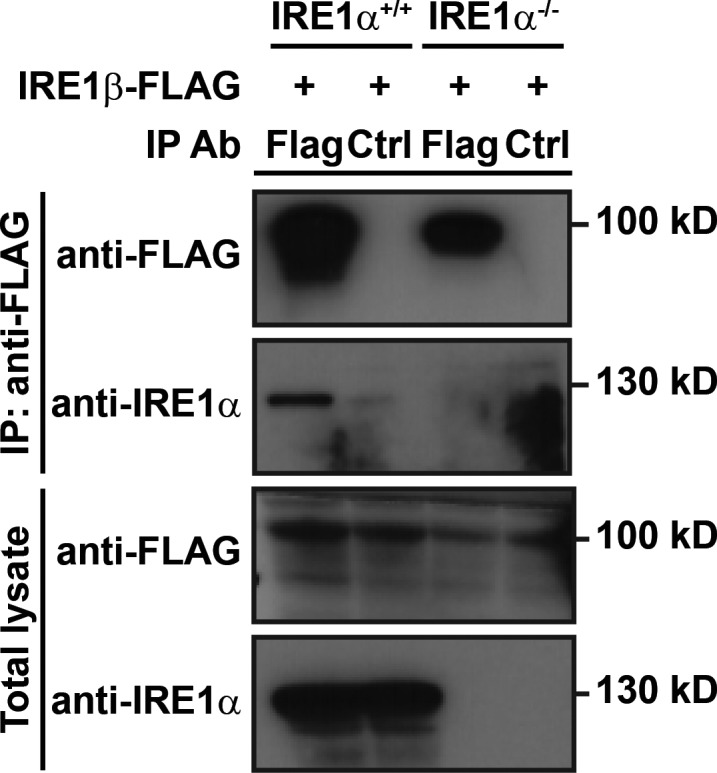
IRE1β interacts with IRE1α. Supports Fig. 5. IRE1α and IRE1β protein detected by immunoblot of anti-FLAG immunoprecipitated (IP) samples or total lysates from HEK293 or HEK293/IRE1αKO cells transfected with IRE1β-FLAG expression construct. Endogenous IRE1α was detected with anti-IRE1α antibody and IRE1β was detected with anti-FLAG antibody. Blots are representative of three independent experiments.
IRE1β inhibits IRE1α endonuclease activity in vitro
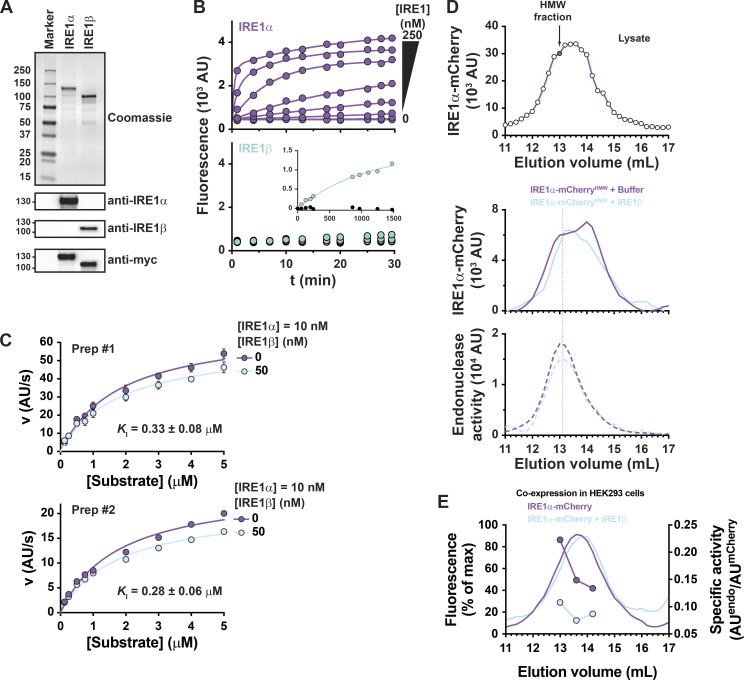
To test if this physical interaction inhibits IRE1α function, we used recombinant proteins in vitro. Full-length Myc-tagged IRE1α and IRE1β were expressed and purified from Expi293 cells (Fig. 6 A) and confirmed by immunoblot and mass spectrometry. Endonuclease activity of the purified proteins was measured in vitro using the XBP1 reporter substrate (Wiseman et al., 2010). Incubation of the reporter substrate with purified full-length IRE1α resulted in a robust increase in fluorescence on the time scale of minutes, consistent with enzymatic cleavage of the reporter substrate (Fig. 6 B, top). Reactions with purified full-length IRE1β, on the other hand, showed no detectable increase in fluorescence on the same time scale (Fig. 6 B, bottom). The purified IRE1β protein was nonetheless active, though with much weaker endonuclease activity and slower kinetics (Fig. 6 B, bottom panel inset). Similarly, IRE1β exhibited weaker XBP1 splicing activity than IRE1α when expressed in HEK293/IRE1αKO cells (Fig. S5, A and B) as described previously (Imagawa et al., 2008). When the purified proteins were assayed in vitro under steady-state conditions, IRE1α exhibited classical Michaelis–Menten kinetics for cleavage of the XBP1 reporter with reproducibly similar Michaelis constant (KM) values from different batches of protein (preparation 1: KM = 1.9 ± 0.3 µM; preparation 2: KM = 2.0 ± 0.3 µM). When assayed in the presence of IRE1β (at fivefold molar excess), the maximal reaction velocity was reduced by 15–25% (Fig. 6 C, light blue curves). The change in maximum velocity (Vmax) was reproduced in multiple experiments and with two independently prepared batches of purified protein. When analyzed using a noncompetitive inhibitor model, the reduction in Vmax corresponded to an inhibitory constant of KI ≈ 300 nM. It is unlikely at these concentrations that IRE1β affects Vmax by binding and sequestering substrate (only a few percent of substrate would be affected), and even if so, this would have a negligible effect on the analysis using the noncompetitive inhibitor model. Thus, IRE1β can interact directly with IRE1α to inhibit its function.
Figure 6.
IRE1β inhibits IRE1α endonuclease activity in vitro. (A) Samples of affinity-purified full-length IRE1α and IRE1β were separated on SDS-PAGE and stained with Coomassie blue or assayed by immunoblot with anti-IRE1α, anti-IRE1β, or anti-Myc antibodies. (B) In vitro endonuclease activity was assayed by monitoring cleavage of fluorescent reporter substrate (10 nM) over time for indicated concentrations of (top, purple) IRE1α or (bottom) IRE1β. Bottom, inset: Endonuclease activity monitored over 24 h for 250 nM IRE1β (light green) or buffer control (black circles). (C) Steady-state kinetics were assayed by measuring progress curves for 10 nM IRE1α or 10 nM IRE1α + 50 nM IRE1β as a function of reporter substrate concentration. Kinetic data are plotted as initial reaction velocity versus substrate concentration. Data were measured for two independent preparations of purified protein, with symbols representing mean ± SEM for three independent measures for preparation 1 (Prep#1) or values from a single measurement for preparation 2 (Prep#2). Solid lines represent best fit of a noncompetitive inhibitor model to the kinetic data. (D) Top: Gel filtration chromatogram for lysate of HEK293 cells expressing IRE1α-mCherry. A high-molecular-weight (HMW) fraction (indicated by filled symbol in top panel) was incubated with either buffer (purple traces) or purified IRE1β (100 nM, light blue traces), reinjected on gel filtration, and assayed for mCherry fluorescence (middle panel) and endonuclease activity (bottom panel). (E) Gel filtration chromatograms for lysates of HEK293 cells expressing IRE1α-mCherry alone or coexpressing IRE1α-mCherry and IRE1β-MycHis. IRE1α-mCherry elution was assayed by mCherry fluorescence (solid lines), and endonuclease activity (symbols, dashed lines) was measured for individual fractions with model XBP1 reporter substrate. Endonuclease activity is plotted as a.u. min−1 mCherry−1.
Figure S5.
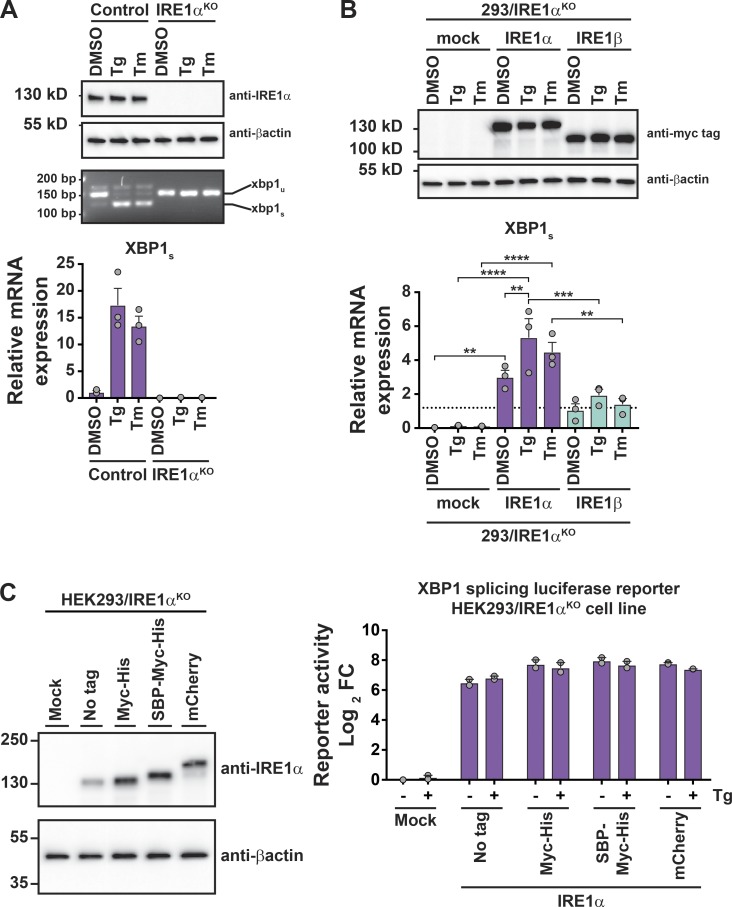
Expression and XBP1 splicing activity of IRE1 constructs. Supports Fig. 6. (A) IRE1α protein was assayed by immunoblot (top), spliced and unspliced XBP1 transcript was assayed by PCR and gel electrophoresis (middle), and spliced XBP1 transcript was assayed by qPCR (bottom) for HEK293 or HEK293/IRE1αKO cells treated with DMSO, Tg, or tunicamycin (Tm; n = 3). (B) IRE1 protein expression was assayed by immunoblot (top), and spliced XBP1 transcript was assayed by qPCR (bottom) for HEK293/IRE1αKO cells transfected with indicated expression vector and treated with DMSO, Tg, or tunicamycin (n = 3). (C) XBP1 splicing luciferase reporter activity for IRE1α constructs transfected in HEK293/IRE1αKO cells. Activity is plotted relative to the untreated (no Tg), mock-transfected cells. Bars represent mean of two independent experiments. Bars and error bars represent mean values ± SEM; significance is indicated by asterisks (*, P < 0.05; **, P < 0.01; ***, P < 0.001; ****, P < 0.0001).
We also tested this by adding purified IRE1β to lysates of cells expressing IRE1α-mCherry. The placement of a C-terminal mCherry tag did not impair XBP1 splicing compared with untagged IRE1α when overexpressed in HEK293/IRE1αKO cells; both were similarly active even in the absence of Tg when assayed using the XBP1 splicing luciferase reporter (Fig. S5 C). In the absence of IRE1β, IRE1α-mCherry eluted from gel filtration as a broad peak between 13 and 14 ml elution volume (Fig. 6 D, top panel). When the fraction at 13 ml (shaded symbol in Fig. 6 D, top panel) was reinjected on gel filtration, IRE1α-mCherry eluted as a lower-molecular-weight species at 14 ml and higher-molecular-weight species at 13 ml, suggesting that these species are in dynamic equilibrium (Fig. 6 D, middle panel, purple trace). Endonuclease activity predominantly coeluted with the higher-molecular-weight species (Fig. 6 D, bottom panel, purple trace), suggesting this is the active form of IRE1α-mCherry. When the same 13-ml fraction was incubated with purified IRE1β and reinjected on gel filtration, IRE1α-mCherry had a similar elution profile (Fig. 6 D, middle panel, light blue trace) but with less endonuclease activity coeluting with the higher-molecular-weight species (Fig. 6 D, bottom panel, compare light blue and purple traces). Similar results were obtained in HEK293 cells coexpressing IRE1α-mCherry and IRE1β. IRE1β expression was associated with less specific endonuclease activity coeluting in the higher-molecular-weight fractions (Fig. 6 E). Thus, IRE1β appears to inhibit IRE1α endonuclease activity by physical interaction.
IRE1β has impaired autophosphorylation and does not form higher-order oligomers
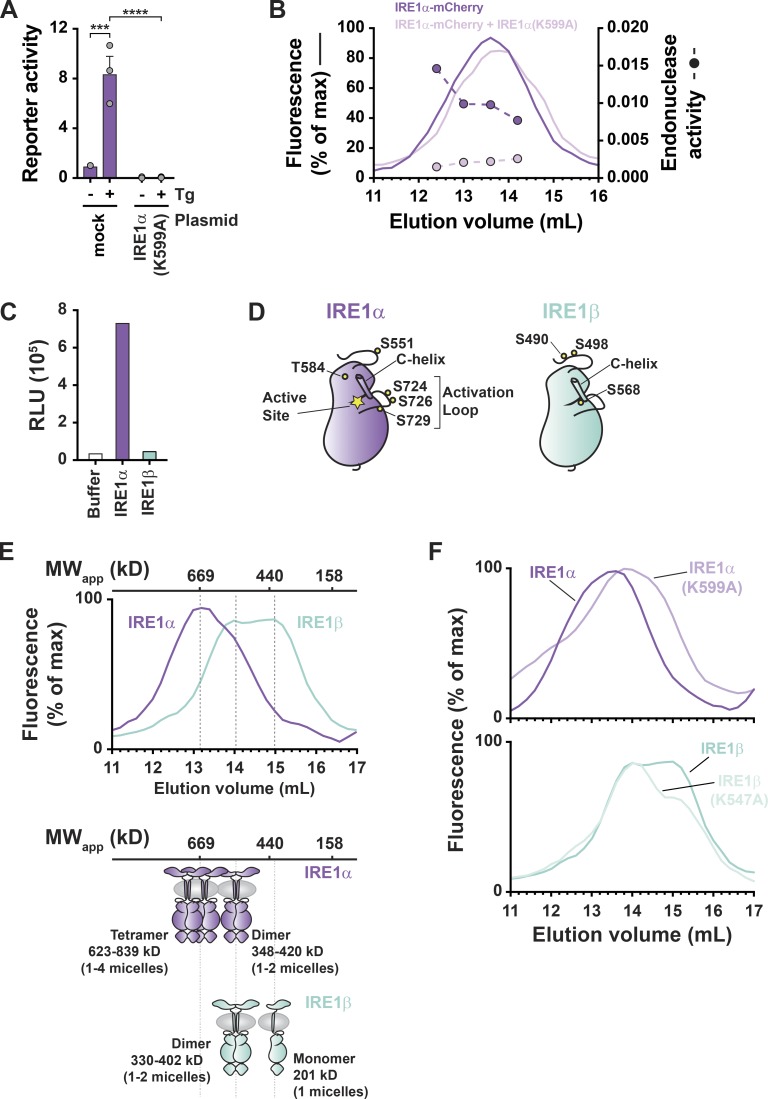
We next wanted to understand what mechanisms dictate the distinct enzymatic outputs. To a large extent, IRE1β behaved in these studies similarly to a kinase-dead version of IRE1α, which also has weak endonuclease function and has been shown to act as a dominant-negative inhibitor of endogenous IRE1α XBP1 splicing (Tirasophon et al., 1998). In our hands, overexpression of the kinase-dead IRE1α(K599A) mutant in HEK293 cells blocked stress-induced XBP1 splicing reporter activity (Fig. 7 A). When the IRE1α(K599A) kinase-dead mutant was coexpressed with fluorescently tagged WT IRE1α-mCherry in HEK293 cells, the gel filtration elution profile of IRE1α-mCherry was shifted slightly to lower-molecular-weight fractions (perhaps reflecting assembly of mixed oligomers) with a concomitant loss of in vitro endonuclease activity in each fraction (Fig. 7 B). This result phenocopied our results with IRE1β (Fig. 6 E) and underscores the biological plausibility that IRE1β, like the kinase-dead IRE1α(K599A) mutant, may act in a dominant-negative manner to suppress stress-induced IRE1α signal transduction.
Figure 7.
IRE1β has impaired phosphorylation and does not form higher-order oligomers. (A) XBP1 splicing luciferase reporter activity measured for HEK293T cells cotransfected with reporter and control vector or IRE1α(K599A) expression vector. Bars and error bars represent mean values ± SEM; significance is indicated by asterisks (*, P < 0.05; **, P < 0.01; ***, P < 0.001; ****, P < 0.0001). (B) Gel filtration chromatograms for lysates of HEK293 cells transfected with IRE1α-mCherry or IRE1α-mCherry + IRE1α(K599A). IRE1α elution was monitored by mCherry fluorescence (solid lines) and endonuclease activity was measured for indicated fractions (symbols and dashed lines). (C) In vitro kinase activity measured for purified full-length IRE1α and IRE1β using ADP-Glo luciferase assay. Bars represent values from a single experiment. Results are representative of two independent experiments that have variable baseline (buffer control) luminescence (RLU, relative luminescence). (D) Schematic of IRE1α and IRE1β kinase domains illustrates positions of phosphorylation sites detected by mass spectrometry. Indicated sites were detected in two independent preparations of purified protein. (E) Gel filtration chromatograms for lysates of HEK293 cells transfected with IRE1α-mCherry or IRE1β-mCherry expression vectors, with IRE1 elution monitored by mCherry fluorescence. Chromatograms are representative of more than five independent experiments. Elution positions of proteins with known molecular weight are indicated above chromatogram. Schematic of putative IRE1 oligomerization states are shown below chromatograms. (F) Same as in E for expression and analysis IRE1α-mCherry, IRE1α(K599A)-mCherry, IRE1β-mCherry, and IRE1β(K547A)-mCherry constructs.
The similar molecular phenotypes for the kinase-dead IRE1α(K599A) mutant and WT IRE1β suggested that IRE1β function might be explained by deficient kinase activity and impaired (or altered) autophosphorylation in native IRE1β. To test this idea, we first applied our purified proteins to an autophosphorylation assay in vitro. IRE1β had comparatively weaker kinase activity than IRE1α (Fig. 7 C), and, when assessed by mass spectrometry, IRE1α and IRE1β isolated from HEK293 cells had different patterns of phosphorylation. In two independent preparations, IRE1α had phosphorylation on S724, S726, and S729 in the activation loop of the kinase domain, phosphorylation sites that are associated with increased IRE1α endonuclease activity (Prischi et al., 2014). Phosphorylation was not detected for the equivalent activation loop Ser residues in IRE1β (Fig. 7 D and Data S3).
We also found that IRE1β failed to form higher-order oligomers when expressed in HEK293 cells. Oligomerization of IRE1β and IRE1α was compared using mCherry-tagged constructs and gel filtration chromatography. As described above, IRE1α-mCherry eluted from gel filtration as a mix of species with elution peaks of ∼13.0 ml and 14.0 ml (Fig. 7 E, purple tracing). Based on elution of molecular weight standards, we propose that these correspond to tetramer and dimer configurations, respectively; and, endonuclease activity predominantly coeluted with the higher-molecular-weight tetramer species (Fig. 6, D and E). The enzymatically active higher molecular weight form of IRE1α appeared to be phosphorylation dependent, as the kinase-dead IRE1α(K599A) mutant eluted from gel filtration in the lower-molecular-weight fractions (Fig. 7 F, top panel). IRE1β-mCherry on the other hand, eluted from gel filtration considerably later than IRE1α at 14 ml and 15 ml, which we propose are dimeric and monomeric configurations, respectively (Fig. 7 E, light green tracing), similar to the kinase-dead version of IRE1α. Consistent with the weaker kinase activity seen in WT IRE1β, rendering the kinase domain inactive (by K547A mutation) had no further effect on the elution profile. Thus, IRE1β has impaired kinase activity with a different pattern of autophosphorylation and impaired oligomerization compared with IRE1α. We suggest that the tendency to form lower-order oligomers explains the weaker XBP1 splicing activity seen in IRE1β.
A nonconserved amino acid in the kinase domain active site regulates IRE1 endonuclease activity
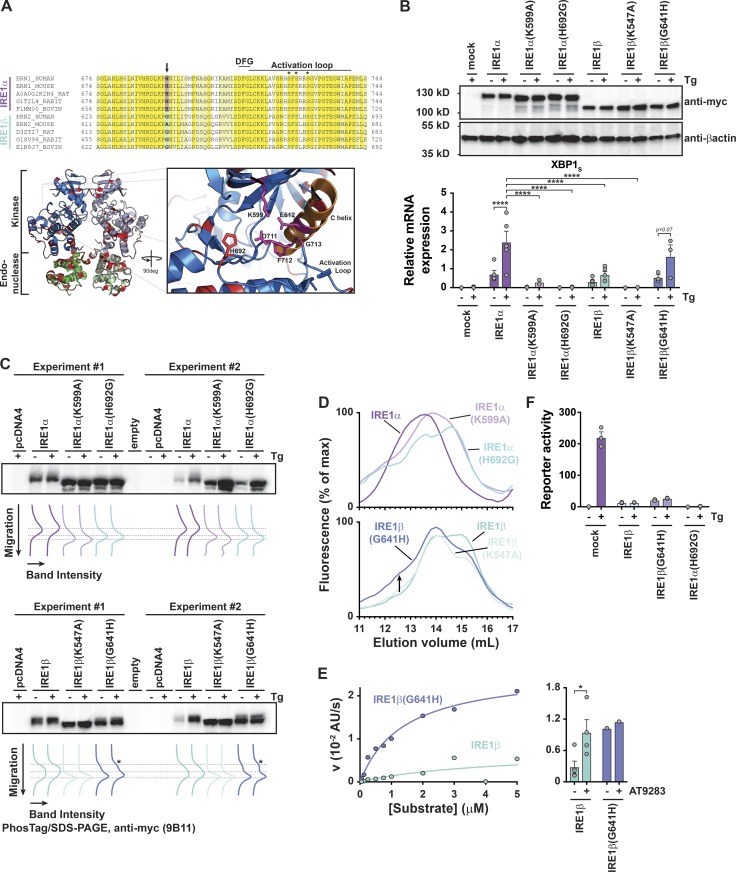
To identify structural features that underlie the differential kinase, phosphorylation, and oligomerization features of the two IRE1 homologues, we analyzed the primary structure of IRE1α and IRE1β kinase domains. The kinase domains share 80% sequence similarity, including conservation of key catalytic and regulatory residues. One divergent site that stood out was H692 in the kinase domain active site of human IRE1α that is a glycine (G641) in IRE1β (Fig. 8 A, arrow). In other Ser/Thr kinases, Gln, Glu, or His typically occupy this position (Singh, 1994) and contribute side chains that in some instances make contact with the β-phosphate group of bound nucleotide. In the apo, active configuration of IRE1α, the side chain of H692 is oriented toward the flipped-in conformation of the conserved DFG motif (H692 NE2 is 4.8 Å from D711 OD2; Feldman et al., 2016). Thus, this position may be important for either stabilizing an active configuration of IRE1α or enabling nucleotide binding. In either case, any favorable side chain interactions in IRE1α would be lost with a glycine at this position in IRE1β.
Figure 8.
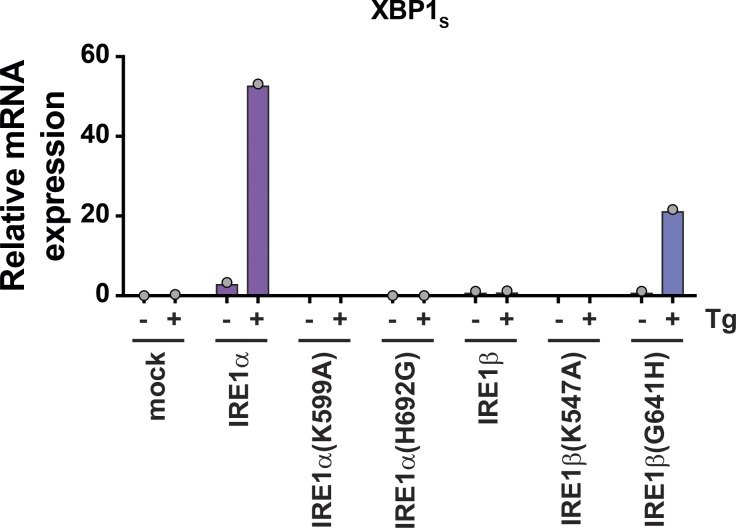
A nonconserved amino acid in the kinase domain active site regulates IRE1 endonuclease activity. (A) Top: Sequence alignment for IRE1α and IRE1β active site and activation loop residues. Conserved sequences are colored yellow (identical) and light yellow (similar). Bottom, left: Ribbon diagram of human IRE1α kinase and endonuclease domains (PDB 5HGI; Feldman et al., 2016). Residue positions that are not conserved between IRE1α and IRE1β are colored red. Bottom, right: Cartoon illustrates close-up view of kinase domain active site and position of H692 side chain. (B) IRE1 expression was assayed by immunoblot (anti-Myc; top) and expression of spliced qPCR transcript was assayed by qPCR for HEK293/IRE1αKO cells transfected with indicated construct (bottom). (C) Samples from B (two independent experiments) were assayed for phosphorylation status by PhosTag/SDS-PAGE and immunoblot with anti-Myc antibody. Band migration position and intensity are plotted under the blot. Lines indicate the migration position of different phosphorylation species. (D) Gel filtration chromatograms for lysates of HEK293 cells transfected with indicated IRE1-mCherry constructs. Chromatograms are representative of at least two independent experiments. (E) Left: In vitro endonuclease activity measured for affinity-purified IRE1β and IRE1β(G641H) under steady-state conditions. Reaction velocities were measured as a function of substrate concentration using 10 nM enzyme. Lines show best fit of Michaelis–Menten equation with KM = 4 ± 8 µM and Vmax = 0.007 ± 0.008 a.u. s−1 for IRE1β and KM = 1.4 ± 0.2 µM and Vmax = 0.027 ± 0.001 a.u. s−1 for IRE1β(G641H). Right: In vitro endonuclease activity measured for 10 nM enzyme and 1 µM XBP1 reporter substrate in the presence or absence of 100 µM AT9283 kinase inhibitor. (F) XBP1 splicing luciferase reporter activity for HEK293 cells were transfected with indicated IRE1 constructs and treated with Tg (300 nM for 4 h, n = 3). In B, E, and F, bars and error bars represent mean values ± SEM; significance is indicated by asterisks (*, P < 0.05; **, P < 0.01; ***, P < 0.001; ****, P < 0.0001).
To test if the nonconserved His/Gly in the kinase domain regulates XBP1 splicing, we prepared IRE1α(H692G) and IRE1β(G641H) mutant constructs, expressed them in HEK293IRE1αKO cells, and assayed for XBP1 splicing, phosphorylation, and oligomerization. The mutant versions of IRE1α and IRE1β were each expressed at similar levels as their WT counterparts (Fig. 8 B, top panel). Strikingly, the H692G mutation in IRE1α completely abolished both basal and stress-induced XBP1 splicing (Fig. 8 B). This was associated with a faster migrating species on PhosTag SDS-PAGE that was similar to the kinase-dead IRE1α(K599A) mutant (Fig. 8 C), suggesting that the H692G mutation impaired receptor phosphorylation. Impaired phosphorylation also blocked IRE1α(H692G) oligomerization, as IRE1α(H692G)-mCherry eluted from gel filtration of cell lysates at lower apparent molecular weight, much like the IRE1α(K599A) mutant and WT IRE1β (Fig. 8 D).
The reversed G641H mutation in IRE1β, on the other hand, partially rescued stress-stimulated XBP1 splicing (Fig. 8 B, dark blue bars on far right; and Fig. S6), and IRE1β phosphorylation, as evidenced by slower migrating species on PhosTag SDS-PAGE (Fig. 8 C). The G641H mutation in IRE1β also partially promoted formation of a higher-molecular-weight species eluting from gel filtration (Fig. 8 D, bottom panel) and enabled higher levels of IRE1β endonuclease activity in vitro (Fig. 8 E, left panel). Interestingly, an IRE1-specific kinase inhibitor that stabilizes an active kinase domain conformation and promotes endonuclease activity (Feldman et al., 2016) was able to stimulate IRE1β endonuclease activity to a similar extent as the G641H mutation (Fig. 8 E, right panel), suggesting that the His at this position may stabilize an active kinase domain configuration. The IRE1β(G641H) mutant, however, was still considerably less active than IRE1a in vitro (Vmax for IRE1β(G641H) was ∼103-fold lower than IRE1α). When expressed in HEK293 cells, the IRE1βG641H mutant increased the baseline level of XBP1 splicing compared with IRE1β-transfected cells, but it did not significantly restore the endogenous IRE1α stress response compared with WT IRE1β (Fig. 8 F). This implies that other molecular features must also contribute. The reverse IRE1α(H692G) mutant, on the other hand, much like the kinase-dead IRE1α(K599A) mutant, completely abolished stress-induced XBP1 splicing by endogenous IRE1α. Together, these data implicate G641 in IRE1β and H692 in IRE1α as a critical residue linking the IRE1 kinase domain active site with autophosphorylation, oligomer assembly, and endonuclease activity. IRE1β and IRE1α variants that are impaired in these functions are, thus able to modify the UPR by dominant-negative interaction with IRE1α.
Figure S6.
IRE1β-G641H mutant rescues XBP1 splicing. Supports Fig. 8 B. Spliced XBP1 transcript assayed by qPCR for HEK293/IRE1αKO cells transfected with indicated IRE1 constructs and treated with Tg. Bars represent a single independent experiment. These data were not included in Fig. 8 B because the response measured for IRE1α- and IRE1β(G641H)-transfected cells in this experiment was ∼10-fold greater in magnitude than any of the other experiments. Although not included in the analysis in Fig. 8 B, the results from this experiment further support the conclusion that IRE1α(H692G) abolishes XBP1 splicing and IRE1β(G641H) rescues stress-induced XBP1 splicing activity.
Discussion
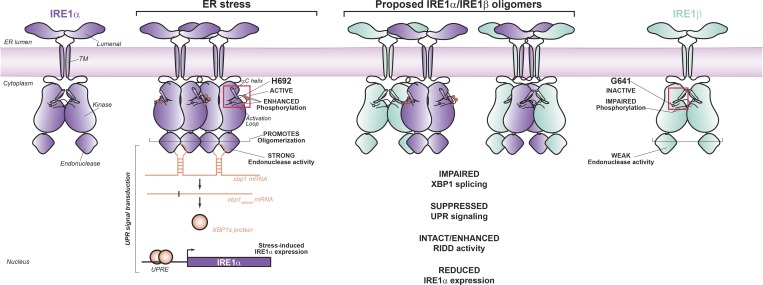
Our results delineate a mechanism for down-regulation of the UPR that is unique to epithelial cells lining mucosal surfaces. The ER of these cells contains IRE1β, which under conventional conditions of ER stress interferes with IRE1α signaling by assembling with IRE1α to inhibit XBP1 splicing (Fig. 9). We propose that this occurs in a dominant-negative manner, where IRE1β itself has comparatively weaker XBP1 splicing activity than IRE1α. A single nonconserved residue in the kinase domain active site of IRE1β and IRE1α explains, at least in part, the different endonuclease activities by tuning phosphorylation and oligomer assembly. As such, IRE1β blocks expression of genes regulated by XBP1s, including stress-induced expression of IRE1α itself. Disrupting this stress-induced autofeedback loop may further enable the down-regulatory effects of IRE1β on IRE1α to affect the UPR. These results support the idea that IRE1β has been evolutionarily conserved to dampen the amplified ER stress responses expected of the host–environment interface and required for mucosal host defense (Bertolotti et al., 2001).
Figure 9.
IRE1β functions as a dominant-negative suppressor of IRE1α signaling. Schematic illustrates model for IRE1β interacting with IRE1α oligomers in a manner to suppress stress-induced XBP1 splicing.
Steady-state kinetic measurements using full-length detergent solubilized proteins provide direct evidence that IRE1β can inhibit IRE1α enzymatic activity. In vitro, purified full-length IRE1β causes an ∼15–25% decrease in IRE1α-dependent cleavage of XBP1 substrate (Vmax) under steady-state conditions. This calculates to a submicromolar inhibitory constant using a noncompetitive inhibition model. Testing the model at higher concentrations of IRE1β was not possible in our hands. Still, the result implicates physiological relevance, as evidenced by our studies in intact cells. If in vivo some intestinal cells express IRE1β and IRE1α at 50:1 ratios, as measured by single-cell RNA sequencing (RNA-seq), this could correspond to >60% inhibition of IRE1α activity (in vitro) based on the calculated KI of 300 nM. In reality, it is hard to predict how the steady-state kinetic measurements translate to an in vivo cellular context, where the relative stoichiometries of IRE1β and IRE1α proteins in the ER membrane are unknown, or how substrate levels and IRE1 clustering may affect turnover under conditions of ER stress. Further studies are needed to better define the kinetic mechanism, using better-behaved IRE1 fragments and/or model membrane systems, and define the enzyme activity directly in the cellular context.
IRE1β appears to interact directly with IRE1α to inhibit XBP1 cleavage. Evidence for such a direct interaction includes (1) the enzymatic activities of IRE1β are not required to suppress IRE1α signaling, suggesting a structural interaction mechanism; (2) IRE1β coimmunoprecipitates with endogenous IRE1α under basal and stress-stimulated conditions; and (3) in biochemical assays using purified proteins at physiologically relevant stoichiometries, IRE1β noncompetitively inhibits the endonuclease activity of IRE1α. Given the overall sequence similarity of IRE1β and IRE1α it is possible that IRE1β could form a heterodimer with IRE1α that mimics an IRE1α homodimer, or dimers of heterodimers, although this is likely a weaker interaction than between IRE1α(K599A) and IRE1α, which suppresses XBP1 splicing to a greater extent. Alternatively, IRE1α homodimers may assemble with IRE1β homodimers. In either model, incorporation of IRE1β into IRE1α oligomers appears to reduce the functional capacity for XBP1 splicing in response to ER stress. It appears that all domains of IRE1β are likely involved in assembling with IRE1α, as we still find inhibition of IRE1α by IRE1β lacking the endonuclease domain or lacking both the endonuclease and kinase domains together (data not shown). This suggests that the lumenal domain, which contributes to IRE1α oligomerization (Karagöz et al., 2017), may make an important contribution.
The comparatively weaker XBP1 splicing activity exhibited by IRE1β enables the protein to act in a dominant-negative manner to suppress IRE1α XBP1 splicing. We identified one molecular feature that contributes to the different endonuclease activities for the two proteins, a nonconserved amino acid in the kinase domain active site that links autophosphorylation and oligomerization with XBP1 cleavage activity. Exactly how the G641 residue regulates IRE1β kinase activity and ultimately endonuclease outputs, however, remains inconclusively explained. Since the small-molecule kinase inhibitor AT9283 acts to stimulate the endonuclease activity of IRE1β to a similar extent as the G641H mutation, presumably by stabilizing the active conformation of the kinase domain as it does in IRE1α (Feldman et al., 2016), we propose that G641 acts to disable the conformational stability of the kinase domain. As the conformation of the kinase domain active site has been linked to receptor assembly and signal transduction outputs in some contexts (Mi et al., 2011), it is possible that a destabilized kinase domain active site conformation in IRE1β impairs oligomerization and confers weaker endonuclease and XBP1 splicing activity. Rescue of the G641 residue by substitution with His, however, does not completely revert IRE1β to full IRE1α-like activity. It is possible that phosphorylation of Ser/Thr residues outside of the activation loop affect IRE1β oligomerization. There are other notable structural differences between the two proteins, such as in the lumenal, transmembrane, and cytosolic juxtamembrane domains, that also may affect protein function and assembly with IRE1α.
Remarkably, IRE1β does not appear to affect RIDD during ER stress. This could be because RIDD signaling during ER stress occurs from lower-order IRE1α oligomers, as proposed before (Tam et al., 2014), which are unaffected by IRE1β expression. In resting cells, however, many gene transcripts have lower expression when IRE1β is present. We also observe enhanced XBP1 transcript levels in cells at rest when expressing IRE1β. Thus, IRE1β might act as a constitutively active endonuclease cleaving RIDD substrates as well as contributing a baseline level of spliced XBP1 transcript. Further cell-based and structural studies are needed to define the IRE1β–IRE1α interaction and how distinct IRE1β/IRE1α assemblies confer preference for XBP1 cleavage versus RIDD activity. Likewise, other ER proteins (Amin-Wetzel et al., 2017; Bertolotti et al., 2000; Sepulveda et al., 2018; Sundaram et al., 2017) and mediators of apoptosis (Lisbona et al., 2009; Shemorry et al., 2019) also regulate IRE1α activity. How IRE1β affects these interactions and regulatory mechanisms also remain to be determined.
As a consequence of inhibiting IRE1α endonuclease activity, IRE1β attenuates the production of the well-described transcription factor XBP1 in response to ER stress. Since XBP1 binds promoters of genes throughout the genome, the effect of IRE1β on basal and stress-induced XBP1 splicing will likely have an impact on many gene expression programs, including those responsive to other arms of the UPR (Acosta-Alvear et al., 2007). This function of IRE1β to suppress IRE1α signaling may be fundamentally important for the physiology of the intestine and other mucosal surfaces. Surface epithelial cells face a diverse array of environmental factors that may cause cell damage and activate or modify cellular stress responses affecting the UPR. As unresolved ER stress and prolonged UPR signaling induces cell death, such responses left unchecked are likely harmful to mucosal barriers. Our results explain the mechanism of action and concur with the idea that IRE1β has been conserved to buffer IRE1α and XBP1 signal transduction against stimuli encountered by epithelial cells at the host–environment interface.
Materials and methods
Caco2 and T84 cell culture
Caco2BBE cells were maintained in DMEM supplemented with 15% FBS, and T84 cells were maintained in 1:1 DMEM/F12 media supplemented with 6% newborn calf serum. Cells were plated on 1-cm2 Transwell inserts (0.4-µm pore size polycarbonate membranes for Caco2 cells and 3-µm pore size polyester membranes for T84 cells) and allowed to polarize for 7 d. Transepithelial electrical resistance was measured using an epithelial volt/Ohm meter (EVOM; World Precision Instruments) to assess monolayer formation. Monolayers were treated with Tg (3 µM final) or DMSO as controls in apical and basolateral compartments for 2 h at 37°C. Cells were washed twice with ice-cold PBS and stored at −80°C.
Colonoid culture
All housing and procedures involving live vertebrate animals were reviewed and approved by Boston Children’s Hospital Institutional Animal Care and Use Committee. IRE1β+/+ and IRE1β−/− mice were euthanized. The colon was excised, fecal pellets were removed, and the tissue was flushed with 5 ml of ice-cold PBS. The colon was opened longitudinally and cut into several small (2- to 3-mm) pieces. Tissue pieces were washed two or three times in PBS and placed in PBS with 10 mM EDTA for 45 min with end-over-end rotation at 4°C. Crypts were dissociated by vigorous shaking for 5–7 min, and the supernatant was collected and diluted twofold with base media (Advanced DMEM/F12 supplemented with 20% FBS, 10 mM Hepes, 1× Glutamax, and 1× penicillin/streptomycin). Tissue pieces were incubated a second time with PBS/EDTA and dissociated cells were collected in the same manner. Collected cells were passed through a 100-µM strainer followed by a 40-µM strainer. Cells retained on the 40-µM strainer were washed with base media, collected with 10 ml base media, and spun down at 300 ×g for 3 min. Crypts were resuspended in Matrigel (on ice), and 30 µl drops were plated in 24-well plates. Plates were inverted and incubated at 37°C to polymerize Matrigel. Complete media (base media + 50% WRN-conditioned media prepared from L cells expressing Wnt/R-spondin/Noggin as described; Miyoshi and Stappenbeck, 2013) was added to each well and cultures were incubated at 37°C 5% CO2. Media was changed every other day. Cultures were passaged every 4–7 d as needed. Matrigel was dissolved using Cell Recovery Solution (Corning), cells were enzymatically dissociated with trypsin, and the cell pellet was resuspended in 1.5- to 2-fold more Matrigel than used in the previous plating. For experiments, colonoids were plated in triplicate. At 5 d after plating, colonoids were treated with SubAA272B or SubAB (100 ng/ml) for 24 h. Matrigel drops were collected and pooled, and colonoids were recovered using Cell Recovery Solution, washed once with PBS, and stored at −80°C.
HEK293doxIRE1β cell model
HEK293doxIRE1β cells were established by subsequent transduction of low-passage HEK293 cells (obtained from the European Collection of Authenticated Cell Cultures) with lentiviral particles encoding the pLenti3.3 Dox-controlled regulator and pLenti6.3/V5/ERN2-FLAG (Invitrogen). ERN2-FLAG coding sequence was introduced by Gateway cloning. All sequences were confirmed by sequencing. Transduction was performed with concentrated and tittered virus at multiplicity of infection (MOI) of 1 for pLenti3.3 and MOI of 2 for pLenti6.3, respectively. Cells were treated with Dox at 0, 10, or 100 ng/ml for 24 h to induce IRE1β expression followed by treatment with 200 nM Tg to induce ER stress for 1.5, 3, or 6 h as indicated. All time points included a DMSO control treatment. IRE1α knockdown experiments were performed using ERN1 TriFECTa RNAi Kit (hs.Ri.ERN1.13; Integrated DNA Technologies), which includes a nontargeting negative control. siRNAs were transfected using Lipofectamine RNAi Max according to the manufacturer’s protocol for 24 h, followed by treatment with 200 nM Tg for 3 h.
Overexpression of IRE1 constructs in HEK293 cells
General molecular biology reagents, including restriction enzymes, Phusion HF Mastermix, T4 PNK, CIP, Quick Ligation Kit, and DH5α competent cells, were from New England Biolabs. GeneJet DNA purification kits were from ThermoFisher. pcDNA4-MycHisB plasmid (ThermoFisher) was digested with HindIII and EcoRI. Oligonucleotides with HindIII restriction sites, a Kozak sequence, a start codon, a murine Igκ leader sequence, a FLAG tag, and an EcoRI restriction site were annealed, phosphorylated with T4 PNK, and ligated into the HindIII/EcoRI-digested pcDNA4-MycHisB vector. The new vector called pSecFLAG-MycHis allows for in-frame cloning with C-terminal Myc epitope and His tag. Additional pSecFLAG vectors were created with mCherry coding sequence inserted between NotI and XbaI restriction sites of pSecFLAG (for in-frame cloning with C-terminal mCherry tag, pSecFLAG-mCherry) or a streptavidin-binding peptide (SBP) tag immediately upstream of Myc epitope (pSecFLAG-SBP-MycHis). IRE1α (S24-L977), IRE1β (L35-R925), and IRE1β deletion construct (L35-S782, L35-R452) coding sequences were PCR amplified from IRE1α and IRE1β templates (provided by K. Kohno, Nara Institute of Science and Technology, Ikoma, Japan) using primers with EcoRI and NotI restriction sites. PCR-amplified products were digested and ligated into EcoRI/NotI-digested pSecFLAG-MycHis, pSecFLAG-mCherry, or pSecFLAG-SBP-MycHis vectors. IRE1α(K599A), IRE1α(H692G), IRE1β(K547A), and IRE1β(G641H) mutations were introduced using QuickChange Lightning Site-Directed Mutagenesis Kit (Agilent). All constructs were confirmed by restriction digest and sequencing (Harvard Biopolymer Facility).
HEK293T, HEK293, and HEK293IRE1αKO cells were maintained in DMEM supplemented with 10% FBS. Cells were seeded in 24-well plates at a density of 1–2 × 10⁵ cells/well in 0.5 ml media. At 24 h after plating, cells were transfected with IRE1 expression plasmids or pcDNA4 as control (500 ng per well) using polyethyleneimine (PEI; linear 25 kD; Polysciences) at a DNA/PEI mass ratio of 1:3. At 18–24 h after transfection, cells were treated with Tg or SubAB along with appropriate controls as described in the figure legends. After treatment, cells were washed twice with ice-cold PBS and used for RNA extraction or preparation of whole-cell lysates.
Expression analysis by qPCR
Total RNA was extracted from cell lines and colonoids using the RNeasy Mini Kit (Qiagen). Cell pellets were lysed in Buffer RLT, homogenized with QiaShredder (Qiagen), and processed according to the manufacturer’s protocol (including on-column DNase digest). Total RNA concentrations were measured by absorbance at 260 nm, and quality was assessed by A260/A280 ratios. Total RNA (typically 500 ng) was used as a template for cDNA synthesis using iScript cDNA synthesis kit (BioRad). Target transcripts were amplified using primers listed in Table S1 and Sso Advanced Universal SYBR Green Supermix according to the manufacturer’s protocol (BioRad). All qPCR reactions were assayed in triplicate for each sample, and the average Cq value was used to calculate the mean expression ratio of the test sample compared with the control sample (i.e., stress treated compared with control treated) using the 2-ΔΔCt method. Cq values for targets were analyzed relative to Cq values for hprt, ppia, and gapdh housekeeping genes.
Western blots
Whole-cell lysates were prepared in RIPA buffer supplemented with Complete Protease Inhibitor (100 µl per cm2 surface area of cells). Cells were lysed on ice for 15 min. Lysates were cleared by centrifugation at 16,800 ×g for 10 min. Total protein was measured using BCA assay. Typically, 10–25 µg of total protein was separated on reducing SDS-PAGE (4–15% or 4–20% gradient gels; BioRad). Proteins were transferred to nitrocellulose membranes and blocked with 5% dry milk in TBS with 0.1% Tween-20 (TBS/T) buffer. Membranes were incubated with primary antibody (diluted in 5% milk, TBS/T) for 1 h at room temperature or 16–24 h at 4°C, washed 3× with TBS/T, and incubated HRP-conjugated secondary antibody (diluted in 5% milk, TBS/T) for 1 h at room temperature. Membranes were washed three times with TBS/T, developed with SuperSignal West Femto Maximum Sensitivity Substrate (ThermoFisher), and imaged using Azure c300 Chemiluminescent Western Blot Imaging System (Azure Biosystems). Membranes were stripped with Restore Stripping Buffer (ThermoFisher) and reprobed as needed. Band intensities were quantified using ImageJ. Antibodies used include anti-IRE1α (14C10, 1:1,000; Cell Signaling Technologies), anti-IRE1β (PA5-13921, 1:2,000; ThermoFisher), anti-Myc tag (9B11, 1:2,000; Cell Signaling Technologies), anti-FLAG (M2 F1804, 1:1,000; Sigma), anti-XBP1 (M186, sc-7160 1:200; Santa Cruz Biotechnology), and anti-βactin (AC-15, A5441 1:5,000; Sigma). Secondary antibodies used include HRP-conjugated anti-rabbit IgG (A6154, 1:5,000–1:10,000; Sigma) and HRP-conjugated anti-mouse IgG (A4416, 1:5,000–1:10,000; Sigma,).
Luciferase reporter assays
pCAX-HA-2xXBP1-Luc-F (XBP1 splicing reporter) was provided by T. Iwawaki (Kanazawa Medical University, Uchinada, Japan; Iwawaki and Akai, 2006). pGL3-5XUPRE-Luc was provided by Ron Prywes (Columbia University, New York, NY; Addgene plasmid 11976; Wang et al., 2000). hIRE1α-1153/+114-Luc and hIRE1α−300/+114-Luc reporter vectors were prepared by PCR amplifying the specified IRE1α promoter region from a synthetic gBlock Gene Fragment (IDT) with NheI and NcoI restriction sites. Restriction-digested, gel-purified PCR products were ligated into NheI–NcoI–digested pGL3-basic vector (Promega) immediately upstream of the luciferase start codon. HEK293T or HEK293 cells (0.5 × 10⁵ cells/well) were seeded in 96-well plates and reverse transfected with protein expression vectors and inducible luciferase reporter vectors at a 1:1 ratio with 100 ng total DNA per well. Mock transfections included pcDNA4-MycHisB vector and inducible luciferase vector. An untransfected control was also included that did not have the luciferase vector for background correction. At 18–24 h after transfection, cells were treated with 3 µM Tg or 100 ng/ml subtilase toxin (or inactive mutant toxin SubAA272B) for 4–8 h, lysed, and assayed for luciferase activity using Bright-Glo luciferase assay system (Promega). Luminescence was measured using Tecan Spark 10M plate reader. The background signal from untransfected cells was subtracted from all data.
Coimmunoprecipitation studies
For the inducible cell line, 8 × 10⁶ HEK293doxIRE1β cells were seeded in 100-mm dishes. The next day, IRE1β-FLAG expression was induced with 100 ng/ml DOX for 24 h. For transient overexpression, 8.2 × 10⁶ HEK293T cells were seeded in 100-mm dishes. The next day, IRE1β-FLAG plasmid was transfected using PEI at a 1:5 DNA/PEI ratio (5 µg DNA). Cells were collected after 24 h. Cells were lysed in lysis buffer (0.1% NP-40, 10% glycerol, 250 mM NaCl, 20 mM Hepes, pH 7.9, and 1 mM EDTA) with protease and phosphatase inhibitors. Samples were incubated with 10 µl prewashed Dynabeads T1 (Invitrogen) that were either prebound with BioM2 anti-FLAG (Sigma; 1 µl antibody/10 µl beads) or no antibody for 1 h at 4°C. After washing with lysis buffer, bound proteins were eluted directly in sample buffer and samples were separated on a 4–12% Criterion Bis-Tris gel (BioRad). Proteins were transferred to polyvinylidene difluoride membrane (Immobilon-FL; Millipore), and incubate with anti-IRE1a (1/1,000; 14C10; Cell Signaling Technology), M2 anti-FLAG (1/1,000; Sigma), and anti-tubulin (1/2,000; Sigma). Proteins were revealed with anti-mouse and anti-rabbit HRP-conjugated antibodies (1/15,000; Jackson Immuno AffiniPure).
IRE1 oligomerization assays
To assay oligomerization of endogenous IRE1α in HEK293doxIRE1β cell line, cells were resuspended in 25 mM Tris, pH 8.0, 150 mM NaCl, 20 mM dodecylmaltoside, 5 mM β-mercaptoethanol, 1× Complete Protease Inhibitor, and 1× PhosSTOP (0.5 ml lysis buffer per 10 cm2 surface area of cells), transferred to a 1.5-ml tube, and lysed at 4°C with end-over-end rotation for 1 h. Lysate was cleared by centrifugation at 16,000 ×g for 10 min. 250 µl of cleared lysate was fractionated on a Superose6 Increase 10/30 gel filtration column (GE Healthcare) equilibrated in running buffer (25 mM Tris, pH 8.0, 150 mM NaCl, 0.5 mM dodecylmaltoside, and 5 mM β-mercaptoethanol) at 0.5 ml/min. Fractions (0.2 ml) were collected in a 96-well plate from 6 ml to 24 ml elution. Fractions were assayed by SDS-PAGE and Western blot with anti-IRE1α antibody to detect endogenous IRE1α.
HEK293 cells were plated at 8 × 10⁵ cells/well in 6-well plates. The next day, pSecFLAG-IRE1α-mCherry or pSecFLAG-IRE1β-mCherry constructs were expressed by transient transfection using PEI at a 1:3 DNA/PEI ratio (2.5 µg total DNA per well). In cases where IRE1-mCherry constructs were cotransfected with unlabeled IRE1 constructs, they were included at equal amounts or cotransfected with pcDNA4 as a control. At 24 h after transfection, cells were collected, lysed, and fractionated as described above. Fractions were assayed by measuring mCherry fluorescence using Tecan Spark 10M plate reader (excitation at 570 nm and emission at 620 nm) to detect elution of IRE1-mCherry. Background fluorescence was subtracted, if needed, by taking the average of the first 10 fractions and last 10 fractions. For reinjection experiments (Fig. 6 C), defined high-molecular-weight fractions from the original fractionated lysate were reinjected on Superose6 column. IRE1-mCherry elution was monitored by fluorescence. Endonuclease activity was monitored for each fraction in 96-well format as described below using 1 µM substrate and measuring fluorescence at the 60-min time point.
Expression and purification of full-length IRE1 constructs
Full-length IRE1 constructs for purification were expressed in the Expi293 Expression System (ThermoFisher). Expi293F cells were maintained and expanded in Expi293 Expression Medium. Cells were transfected with pSecFLAG-IRE1-SBP-MycHis expression plasmids according to the manufacturer’s protocol using 1 µg DNA per ml of culture volume. At 48 h after transfection, cells were collected, washed once with ice-cold PBS, and resuspended at ∼20 × 106 cells/ml in lysis buffer (25 mM Tris, pH 8.0, 150 mM NaCl, 20 mM dodecylmaltoside, 5 mM β-mercaptoethanol, 1× Complete Protease Inhibitor [Sigma], and 1× PhosSTOP phosphatase inhibitor [Sigma]). Cells were lysed for 1 h at 4°C with end-over-end rotation. Lysate was cleared by centrifugation at 30,000 ×g for 15 min. Cleared lysate was applied by gravity flow to a 0.5–1.0 ml StrepTactin Sepharose column equilibrated in wash buffer (25 mM Tris, pH 8.0, 300 mM NaCl, 1 mM dodecylmaltoside, and 5 mM β-mercaptoethanol). Column was washed four times with 5 ml of wash buffer. Bound protein was eluted with 8× 0.5-column volumes of elution buffer (25 mM Tris, pH 8.0, 150 mM NaCl, 1 mM dodecylmaltoside, 5 mM β-mercaptoethanol, and 2.5 mM desthiobiotin). Samples of elution fractions were assayed by SDS-PAGE and detected by colloidal Coomassie staining or by Western blot with anti-IRE1α, anti-IRE1β, or anti-Myc antibodies. Coomassie-stained bands were excised, digested with trypsin, and assayed by liquid chromatography with tandem mass spectrometry for protein identification and phosphopeptide mapping (Taplin Mass Spectrometry Facility, Harvard Medical School). In some cases, further purification of samples was performed by gel filtration chromatography on Superose6 column equilibrated in 25 mM Tris, pH 8.0, 150 mM NaCl, 0.5 mM dodecylmaltoside, and 5 mM β-mercaptoethanol.
In vitro endonuclease assays
An XBP1 RNA stem-loop model substrate was synthesized with a 5′-FAM and 3′-BlackHoleQuencher (IDT): 5′-FAM-CAUGUCCGCAGCGCAUG-BHG-3′ (Wiseman et al., 2010). Endonuclease assays were performed in 96-well plates (80–100 µl reaction volume) or 384-well plates (20 µl reaction volume). Purified enzyme or gel filtration fractions were diluted twofold with 2× endonuclease reaction buffer containing substrate (at indicated concentrations) to give final conditions of 50 mM Tris, pH 7.5, 150 mM NaCl, 10 mM MgCl2, 1 mM ATP, 10 mM DTT, 0.5 mM dodecylmaltoside, and 1× substrate. Formation of cleaved reaction product was monitored by fluorescence using Perkin Elmer VictorX or Tecan Spark 10M plate reader with excitation at 485 nm and emission at 535 nm. In all cases, background was corrected using a buffer-only (no enzyme) control reaction. For steady-state kinetic measurements, reaction velocities were determined from the initial change in fluorescence as a function of time. Velocity versus [substrate] data were analyzed using Michaelis–Menten or enzyme inhibitor models in Prism.
In vitro kinase assays
Purified IRE1 enzyme was incubated with 2× kinase buffer in a final volume of 25 µl (125 nM enzyme, 70 mM Tris, pH 7.6, 75 mM NaCl, 10 mM MgCl2, 5 mM DTT, 1 mM ATP, and 0.5 mM dodecylmaltoside) for 30 min at room temperature. ADP produced from autophosphorylation was detected using the ADP-Glo Kinase Assay (Promega). Luminescence intensity was measured on a Perkin Elmer VictorX plate reader. A no-enzyme control (buffer only) was used to control for the depletion of ATP in kinase reaction before detection of ADP.
Statistical analysis
In most cases, data consisted of three or more independent experiments. Unless otherwise indicated in figure legend, figures include all independent measures (n = 3) shown as symbols and bars represent mean values ± SEM. For expression data, fold changes (e.g., stress compared with control) were transformed to log2 scale, and mean values were compared using one-way or two-way ANOVA, as appropriate, with multiple comparisons corrected using statistical hypothesis testing (Tukey). Mean values between two groups were compared using unpaired Student’s t test (two sided). In all cases, data distribution was assumed to be normal, but this was not formally tested. In figures, significance is indicated by asterisks (*, P < 0.05; **, P < 0.01; ***, P < 0.001; ****, P < 0.0001). All analyses were performed in Prism (GraphPad Software).
Online supplemental material
Fig. S1 shows expression of IRE1β in intestinal epithelial cells and cell models (supports Fig. 1). Fig. S2 shows that IRE1β suppresses XBP1 transcriptional activity (supports Fig. 2). Fig. S3 shows that IRE1β restricts stress-induced IRE1α expression (supports Fig. 3) and the effect of transient IRE1β expression on IRE1α protein levels in HEK293T cells. Fig. S4 shows that IRE1β interacts with IRE1β (supports Fig. 5) and shows IRE1β-IRE1α coimmunoprecipitation experiments in HEK293 cells. Fig. S5 shows expression and XBP1 splicing activity of IRE1 constructs (supports Fig. 6). Fig. S6 shows that IRE1β-G641H mutant rescues XBP1 splicing (supports Fig. 8 B). Table S1 shows primer sequences used for qPCR. Data S1 shows differential expression of UPR, XBP1, and RIDD genes in HEK293doxIRE1β cells. Data S2 shows putative XBP1 binding sites in human IRE1α promoter region. Data S3 shows mass spectrometry of phosphorylation sites in IRE1α and IRE1β proteins purified from Expi293 cells.
Supplementary Material
lists the primer sequences used for expression analysis by qPCR.
shows differential expression of UPR, XBP1, and RIDD genes in HEK293doxIRE1β cells.
shows putative XBP1 binding sites in the human IRE1α promoter region.
shows mass spectrometry of phosphorylation sites in IRE1α and IRE1β proteins purified from Expi293 cells.
Acknowledgments
We thank members of the Lencer, Eyckerman, and Janssens laboratories for critical evaluation and discussion throughout this project. We thank Dr. Kenji Kohno for providing pCAG-hIRE1β plasmid; Takao Iwawaki for providing pCAX-HA-2xXBP1ΔDBD(anATG)-LUC-F XBP1 splicing reporter plasmid; Ron Prywes for providing p5xATF6-GL3 (UPRE-LUC, plasmid 11976; Addgene); Qingbo Xu and Lingfang Zeng for providing pCMV5-FLAG-XBP1 plasmid (plasmid 63680; Addgene); Dan Chinnapen and Elisha Fielding for providing Expi293F cells and expression protocols; and Dustin Maly for providing AT9283 IRE1 kinase inhibitor and valuable discussions on IRE1 kinase domains and activation.
This work was supported by National Institutes of Health grants DK048106 and DK084424 and the Harvard Digestive Disease Center grants P30DK034854 (Epithelial Cell and Mucosal Immunology Core) to W.I. Lencer and K01DK119414 to M.J. Grey.
The authors declare no competing financial interests.
Author contributions: M.J. Grey and W.I. Lencer conceived the project and M.J. Grey, W.I. Lencer, E. Cloots, S. Eyckerman, and S. Janssens designed experiments. M.J. Grey, E. Cloots, and M.S. Simpson carried out all experiments with technical support from N. LeDuc, H. De Luca, and D. De Sutter. Y.V. Serebrenik, A.W. Paton, and J.C. Paton provided critical reagents. P. Luong, J.R. Thiagarajah, and M.A. Seeliger provided critical reagents and intellectual support in experiment design and analysis. M.J. Grey, E. Cloots, M.S. Simpson, S. Eyckerman, S. Janssens, and W.I. Lencer analyzed and provided interpretation for all data. M.J. Grey and W.I. Lencer wrote the manuscript with substantial input from E. Cloots, M.S. Simpson, S. Eyckerman, and S. Janssens. The final manuscript and data were made available to all authors for review and comment prior to submission.
References
- Acosta-Alvear D., Zhou Y., Blais A., Tsikitis M., Lents N.H., Arias C., Lennon C.J., Kluger Y., and Dynlacht B.D.. 2007. XBP1 controls diverse cell type- and condition-specific transcriptional regulatory networks. Mol. Cell. 27:53–66. 10.1016/j.molcel.2007.06.011 [DOI] [PubMed] [Google Scholar]
- Amin-Wetzel N., Saunders R.A., Kamphuis M.J., Rato C., Preissler S., Harding H.P., and Ron D.. 2017. A J-Protein Co-chaperone Recruits BiP to Monomerize IRE1 and Repress the Unfolded Protein Response. Cell. 171:1625–1637. [DOI] [PMC free article] [PubMed] [Google Scholar]
- Bertolotti A., Zhang Y., Hendershot L.M., Harding H.P., and Ron D.. 2000. Dynamic interaction of BiP and ER stress transducers in the unfolded-protein response. Nat. Cell Biol. 2:326–332. 10.1038/35014014 [DOI] [PubMed] [Google Scholar]
- Bertolotti A., Wang X., Novoa I., Jungreis R., Schlessinger K., Cho J.H., West A.B., and Ron D.. 2001. Increased sensitivity to dextran sodium sulfate colitis in IRE1beta-deficient mice. J. Clin. Invest. 107:585–593. 10.1172/JCI11476 [DOI] [PMC free article] [PubMed] [Google Scholar]
- Calfon M., Zeng H., Urano F., Till J.H., Hubbard S.R., Harding H.P., Clark S.G., and Ron D.. 2002. IRE1 couples endoplasmic reticulum load to secretory capacity by processing the XBP-1 mRNA. Nature. 415:92–96. 10.1038/415092a [DOI] [PubMed] [Google Scholar]
- Chang T.K., Lawrence D.A., Lu M., Tan J., Harnoss J.M., Marsters S.A., Liu P., Sandoval W., Martin S.E., and Ashkenazi A.. 2018. Coordination between Two Branches of the Unfolded Protein Response Determines Apoptotic Cell Fate. Mol. Cell. 71:629–636.e5. 10.1016/j.molcel.2018.06.038 [DOI] [PubMed] [Google Scholar]
- Feldman H.C., Tong M., Wang L., Meza-Acevedo R., Gobillot T.A., Lebedev I., Gliedt M.J., Hari S.B., Mitra A.K., Backes B.J., et al. 2016. Structural and Functional Analysis of the Allosteric Inhibition of IRE1α with ATP-Competitive Ligands. ACS Chem. Biol. 11:2195–2205. 10.1021/acschembio.5b00940 [DOI] [PMC free article] [PubMed] [Google Scholar]
- Haber A.L., Biton M., Rogel N., Herbst R.H., Shekhar K., Smillie C., Burgin G., Delorey T.M., Howitt M.R., Katz Y., et al. 2017. A single-cell survey of the small intestinal epithelium. Nature. 551:333–339. 10.1038/nature24489 [DOI] [PMC free article] [PubMed] [Google Scholar]
- Hetz C., and Papa F.R.. 2018. The Unfolded Protein Response and Cell Fate Control. Mol. Cell. 69:169–181. 10.1016/j.molcel.2017.06.017 [DOI] [PubMed] [Google Scholar]
- Hollien J., and Weissman J.S.. 2006. Decay of endoplasmic reticulum-localized mRNAs during the unfolded protein response. Science. 313:104–107. 10.1126/science.1129631 [DOI] [PubMed] [Google Scholar]
- Hollien J., Lin J.H., Li H., Stevens N., Walter P., and Weissman J.S.. 2009. Regulated Ire1-dependent decay of messenger RNAs in mammalian cells. J. Cell Biol. 186:323–331. 10.1083/jcb.200903014 [DOI] [PMC free article] [PubMed] [Google Scholar]
- Imagawa Y., Hosoda A., Sasaka S., Tsuru A., and Kohno K.. 2008. RNase domains determine the functional difference between IRE1alpha and IRE1beta. FEBS Lett. 582:656–660. 10.1016/j.febslet.2008.01.038 [DOI] [PubMed] [Google Scholar]
- Iwawaki T., and Akai R.. 2006. Analysis of the XBP1 splicing mechanism using endoplasmic reticulum stress-indicators. Biochem. Biophys. Res. Commun. 350:709–715. 10.1016/j.bbrc.2006.09.100 [DOI] [PubMed] [Google Scholar]
- Iwawaki T., Hosoda A., Okuda T., Kamigori Y., Nomura-Furuwatari C., Kimata Y., Tsuru A., and Kohno K.. 2001. Translational control by the ER transmembrane kinase/ribonuclease IRE1 under ER stress. Nat. Cell Biol. 3:158–164. 10.1038/35055065 [DOI] [PubMed] [Google Scholar]
- Karagöz G.E., Acosta-Alvear D., Nguyen H.T., Lee C.P., Chu F., and Walter P.. 2017. An unfolded protein-induced conformational switch activates mammalian IRE1. eLife. 6:e30700 10.7554/eLife.30700 [DOI] [PMC free article] [PubMed] [Google Scholar]
- Lee K., Tirasophon W., Shen X., Michalak M., Prywes R., Okada T., Yoshida H., Mori K., and Kaufman R.J.. 2002. IRE1-mediated unconventional mRNA splicing and S2P-mediated ATF6 cleavage merge to regulate XBP1 in signaling the unfolded protein response. Genes Dev. 16:452–466. 10.1101/gad.964702 [DOI] [PMC free article] [PubMed] [Google Scholar]
- Li H., Korennykh A.V., Behrman S.L., and Walter P.. 2010. Mammalian endoplasmic reticulum stress sensor IRE1 signals by dynamic clustering. Proc. Natl. Acad. Sci. USA. 107:16113–16118. 10.1073/pnas.1010580107 [DOI] [PMC free article] [PubMed] [Google Scholar]
- Lisbona F., Rojas-Rivera D., Thielen P., Zamorano S., Todd D., Martinon F., Glavic A., Kress C., Lin J.H., Walter P., et al. 2009. BAX inhibitor-1 is a negative regulator of the ER stress sensor IRE1alpha. Mol. Cell. 33:679–691. 10.1016/j.molcel.2009.02.017 [DOI] [PMC free article] [PubMed] [Google Scholar]
- Lu M., Lawrence D.A., Marsters S., Acosta-Alvear D., Kimmig P., Mendez A.S., Paton A.W., Paton J.C., Walter P., and Ashkenazi A.. 2014. Opposing unfolded-protein-response signals converge on death receptor 5 to control apoptosis. Science. 345:98–101. 10.1126/science.1254312 [DOI] [PMC free article] [PubMed] [Google Scholar]
- Martino M.B., Jones L., Brighton B., Ehre C., Abdulah L., Davis C.W., Ron D., O’Neal W.K., and Ribeiro C.M.. 2013. The ER stress transducer IRE1β is required for airway epithelial mucin production. Mucosal Immunol. 6:639–654. 10.1038/mi.2012.105 [DOI] [PMC free article] [PubMed] [Google Scholar]
- Mi L.Z., Lu C., Li Z., Nishida N., Walz T., and Springer T.A.. 2011. Simultaneous visualization of the extracellular and cytoplasmic domains of the epidermal growth factor receptor. Nat. Struct. Mol. Biol. 18:984–989. 10.1038/nsmb.2092 [DOI] [PMC free article] [PubMed] [Google Scholar]
- Miyoshi H., and Stappenbeck T.S.. 2013. In vitro expansion and genetic modification of gastrointestinal stem cells in spheroid culture. Nat. Protoc. 8:2471–2482. 10.1038/nprot.2013.153 [DOI] [PMC free article] [PubMed] [Google Scholar]
- Paton A.W., Srimanote P., Talbot U.M., Wang H., and Paton J.C.. 2004. A new family of potent AB(5) cytotoxins produced by Shiga toxigenic Escherichia coli. J. Exp. Med. 200:35–46. 10.1084/jem.20040392 [DOI] [PMC free article] [PubMed] [Google Scholar]
- Paton A.W., Beddoe T., Thorpe C.M., Whisstock J.C., Wilce M.C., Rossjohn J., Talbot U.M., and Paton J.C.. 2006. AB5 subtilase cytotoxin inactivates the endoplasmic reticulum chaperone BiP. Nature. 443:548–552. 10.1038/nature05124 [DOI] [PubMed] [Google Scholar]
- Prischi F., Nowak P.R., Carrara M., and Ali M.M.. 2014. Phosphoregulation of Ire1 RNase splicing activity. Nat. Commun. 5:3554 10.1038/ncomms4554 [DOI] [PMC free article] [PubMed] [Google Scholar]
- Sepulveda D., Rojas-Rivera D., Rodríguez D.A., Groenendyk J., Köhler A., Lebeaupin C., Ito S., Urra H., Carreras-Sureda A., Hazari Y., et al. 2018. Interactome Screening Identifies the ER Luminal Chaperone Hsp47 as a Regulator of the Unfolded Protein Response Transducer IRE1α. Mol. Cell. 69:238–252.e7. 10.1016/j.molcel.2017.12.028 [DOI] [PubMed] [Google Scholar]
- Shemorry A., Harnoss J.M., Guttman O., Marsters S.A., Kőműves L.G., Lawrence D.A., and Ashkenazi A.. 2019. Caspase-mediated cleavage of IRE1 controls apoptotic cell commitment during endoplasmic reticulum stress. eLife. 8:e47084 10.7554/eLife.47084 [DOI] [PMC free article] [PubMed] [Google Scholar]
- Singh J. 1994. Comparison of conservation within and between the Ser/Thr and Tyr protein kinase family: proposed model for the catalytic domain of the epidermal growth factor receptor. Protein Eng. 7:849–858. 10.1093/protein/7.7.849 [DOI] [PubMed] [Google Scholar]
- Sundaram A., Plumb R., Appathurai S., and Mariappan M.. 2017. The Sec61 translocon limits IRE1α signaling during the unfolded protein response. eLife. 6:e27187 10.7554/eLife.27187 [DOI] [PMC free article] [PubMed] [Google Scholar]
- Tam A.B., Koong A.C., and Niwa M.. 2014. Ire1 has distinct catalytic mechanisms for XBP1/HAC1 splicing and RIDD. Cell Reports. 9:850–858. 10.1016/j.celrep.2014.09.016 [DOI] [PMC free article] [PubMed] [Google Scholar]
- Tirasophon W., Welihinda A.A., and Kaufman R.J.. 1998. A stress response pathway from the endoplasmic reticulum to the nucleus requires a novel bifunctional protein kinase/endoribonuclease (Ire1p) in mammalian cells. Genes Dev. 12:1812–1824. 10.1101/gad.12.12.1812 [DOI] [PMC free article] [PubMed] [Google Scholar]
- Tirasophon W., Lee K., Callaghan B., Welihinda A., and Kaufman R.J.. 2000. The endoribonuclease activity of mammalian IRE1 autoregulates its mRNA and is required for the unfolded protein response. Genes Dev. 14:2725–2736. 10.1101/gad.839400 [DOI] [PMC free article] [PubMed] [Google Scholar]
- Tschurtschenthaler M., Adolph T.E., Ashcroft J.W., Niederreiter L., Bharti R., Saveljeva S., Bhattacharyya J., Flak M.B., Shih D.Q., Fuhler G.M., et al. 2017. Defective ATG16L1-mediated removal of IRE1α drives Crohn’s disease-like ileitis. J. Exp. Med. 214:401–422. 10.1084/jem.20160791 [DOI] [PMC free article] [PubMed] [Google Scholar]
- Tsuru A., Fujimoto N., Takahashi S., Saito M., Nakamura D., Iwano M., Iwawaki T., Kadokura H., Ron D., and Kohno K.. 2013. Negative feedback by IRE1β optimizes mucin production in goblet cells. Proc. Natl. Acad. Sci. USA. 110:2864–2869. 10.1073/pnas.1212484110 [DOI] [PMC free article] [PubMed] [Google Scholar]
- Tsuru A., Imai Y., Saito M., and Kohno K.. 2016. Novel mechanism of enhancing IRE1α-XBP1 signalling via the PERK-ATF4 pathway. Sci. Rep. 6:24217 10.1038/srep24217 [DOI] [PMC free article] [PubMed] [Google Scholar]
- Walter P., and Ron D.. 2011. The unfolded protein response: from stress pathway to homeostatic regulation. Science. 334:1081–1086. 10.1126/science.1209038 [DOI] [PubMed] [Google Scholar]
- Wang X.Z., Harding H.P., Zhang Y., Jolicoeur E.M., Kuroda M., and Ron D.. 1998. Cloning of mammalian Ire1 reveals diversity in the ER stress responses. EMBO J. 17:5708–5717. 10.1093/emboj/17.19.5708 [DOI] [PMC free article] [PubMed] [Google Scholar]
- Wang Y., Shen J., Arenzana N., Tirasophon W., Kaufman R.J., and Prywes R.. 2000. Activation of ATF6 and an ATF6 DNA binding site by the endoplasmic reticulum stress response. J. Biol. Chem. 275:27013–27020. [DOI] [PubMed] [Google Scholar]
- Wiseman R.L., Zhang Y., Lee K.P., Harding H.P., Haynes C.M., Price J., Sicheri F., and Ron D.. 2010. Flavonol activation defines an unanticipated ligand-binding site in the kinase-RNase domain of IRE1. Mol. Cell. 38:291–304. 10.1016/j.molcel.2010.04.001 [DOI] [PMC free article] [PubMed] [Google Scholar]
- Yoshida H., Matsui T., Yamamoto A., Okada T., and Mori K.. 2001. XBP1 mRNA is induced by ATF6 and spliced by IRE1 in response to ER stress to produce a highly active transcription factor. Cell. 107:881–891. 10.1016/S0092-8674(01)00611-0 [DOI] [PubMed] [Google Scholar]
Associated Data
This section collects any data citations, data availability statements, or supplementary materials included in this article.
Supplementary Materials
lists the primer sequences used for expression analysis by qPCR.
shows differential expression of UPR, XBP1, and RIDD genes in HEK293doxIRE1β cells.
shows putative XBP1 binding sites in the human IRE1α promoter region.
shows mass spectrometry of phosphorylation sites in IRE1α and IRE1β proteins purified from Expi293 cells.


