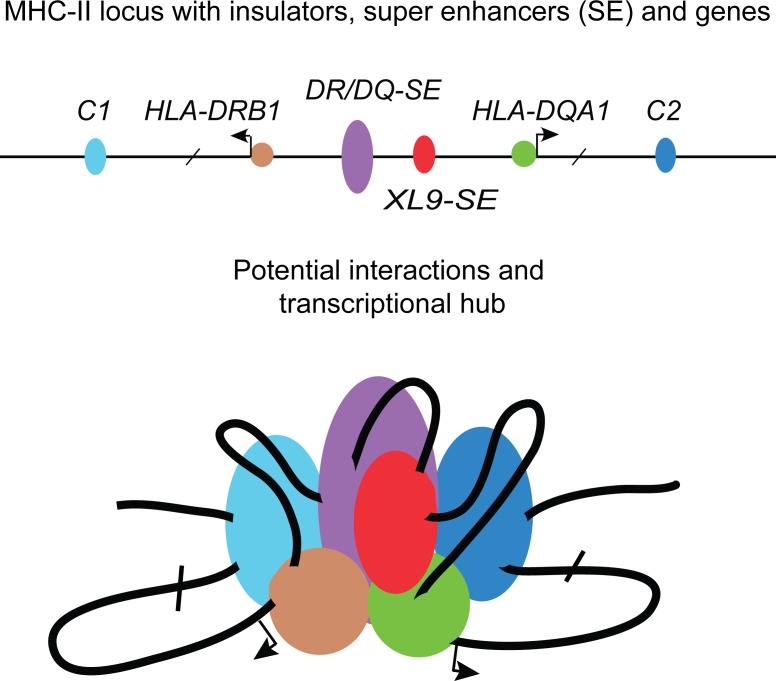
A super enhancer termed DR/DQ-SE within the MHC-II locus was examined by CRISPR mutagenesis. DR/DQ-SE was found to regulate HLA-DRB1, -DQA1, and -DQB1 gene expression by controlling chromatin interactions/looping between MHC-II gene promoters and CTCF binding elements.
Abstract
Super enhancers (SEs) play critical roles in cell type–specific gene regulation. The mechanisms by which such elements work are largely unknown. Two SEs termed DR/DQ-SE and XL9-SE are situated within the human MHC class II locus between the HLA-DRB1 and HLA-DQA1 genes and are highly enriched for disease-causing SNPs. To test the function of these elements, we used CRISPR/Cas9 to generate a series of mutants that deleted the SE. Deletion of DR/DQ-SE resulted in reduced expression of HLA-DRB1 and HLA-DQA1 genes. The SEs were found to interact with each other and the promoters of HLA-DRB1 and HLA-DQA1. DR/DQ-SE also interacted with neighboring CTCF binding sites. Importantly, deletion of DR/DQ-SE reduced the local chromatin interactions, implying that it functions as the organizer for the local three-dimensional architecture. These data provide direct mechanisms by which an MHC-II SE contributes to expression of the locus and suggest how variation in these SEs may contribute to human disease and altered immunity.
Graphical Abstract
Introduction
The human MHC class II (MHC-II) locus is positioned in the short arm of chromosome 6 at 6p21.31, spans ∼700 kb, and contains a dense cluster of genes (Boss, 1997; Germain and Margulies, 1993; Ting and Trowsdale, 2002) and pseudo-genes (The MHC Sequencing Consortium, 1999). Within the region are the genes encoding the α and β chains of the classic MHC-II molecules, HLA-DR, -DQ, and -DP, which are highly polymorphic and responsible for the initiation of adaptive cellular and humoral immune responses toward specific pathogens (Ting and Trowsdale, 2002). In addition, HLA-DM and -DO are also encoded (Sloan et al., 1995; Weber et al., 1996) and contain α and β chains that are homologous to the classic MHC-II proteins and function to modulate the selection of peptides for presentation by MHC-II molecules. MHC-II, HLA-DM, and HLA-DO molecules are coregulated and expressed in a cell type–specific manner. These genes are constitutively expressed in B-lymphocytes, macrophages, and dendritic cells (Boss and Jensen, 2003; Ting and Trowsdale, 2002) and ultimately function to select and present antigenic peptides to CD4+ T cells. In many cells, such as epithelial cells and fibroblasts, MHC-II genes can be induced by IFNγ (Collins et al., 1984).
Conserved DNA sequences termed X1, X2, and Y boxes, located in the proximal promoter region of all MHC-II genes, are essential for the expression of all MHC-II genes. The X1, X2, and Y box elements bind the regulatory factor X (RFX) complex, cAMP response element–binding protein (CREB), and nuclear factor Y (NF-Y), respectively (Choi et al., 2011). These factors interact with each other to recruit a single, cell type–specific limiting factor, the class II transactivator, CIITA. CIITA expression is expressed in the above immune cells and is specifically induced by IFNγ in nonimmune cell types, explaining the general mechanism by which IFNγ controls MHC-II expression (Chang et al., 1994). Together, this complex forms an enhanceosome (Vilen et al., 1991) that recruits chromatin modifiers and the general transcription machinery, leading to expression of these genes (Choi and Boss, 2012; Choi et al., 2011). The RFX/CREB/NF-Y/CIITA protein–DNA complex is an independent unit able to drive the transcription of a reporter gene (Riley et al., 1995). CIITA recruitment is essential for the placement of active chromatin marks on promoter region nucleosomes (Beresford and Boss, 2001; Choi and Boss, 2012; LeibundGut-Landmann et al., 2004; Reith and Mach, 2001).
The mammalian insulator protein CCCTC binding factor (CTCF) has been shown to demarcate and insulate regions of regulatory activity within the genome by functioning as an enhancer blocker (Felsenfeld et al., 2004; West et al., 2004) or by preventing the spread of heterochromatin into active genes (Labrador and Corces, 2002). In vertebrates, insulator elements are associated with the function of CTCF (Burgess-Beusse et al., 2002; Bushey et al., 2008; Felsenfeld et al., 2004). CTCF functions in part by forming the nexus of long-range chromatin loops that organize chromatin into higher-order structures (Rowley and Corces, 2018). However, how such chromatin loops coordinate gene expression is still not fully understood. Previously, we identified a series of CTCF binding regions within the MHC-II locus (Majumder and Boss, 2010). One of these, termed XL9, was in the intergenic region between HLA-DRB1 and HLA-DQA1 and had potent enhancer blocking activity (Majumder et al., 2006). Intriguingly, XL9 was found to serve as a nexus for distant interactions with the promoter regions of the above HLA genes (Majumder et al., 2008). The interactions were dependent on the presence of both CTCF and CIITA. Depletion of CTCF from MHC-II–expressing cells resulted in a decrease in HLA-DRB1 and HLA-DQA1 expression, reduced histone acetylation at the promoters of the above genes, and loss of the interactions with the HLA-DRB1 and HLA-DQA1 promoter regions (Majumder et al., 2006, 2008). Overall, CTCF activity was found to be required for expression of all MHC-II genes (Majumder and Boss, 2010). CIITA and CTCF coimmunoprecipitated, suggesting that the two factors interacted directly or indirectly through a complex (Majumder and Boss, 2011). These observations demonstrated a role for CTCF in regulating HLA-DRB1 and HLA-DQA1 expression and that this occurs through spatial relationships and topological architecture of these genes.
Intriguingly, multiple human diseases have been linked to genetic variation in the intergenic region of the human MHC-II locus. A genome-wide study on vitiligo autoimmune disease revealed that three single nucleotide polymorphisms (SNPs) are present in the intergenic region of HLA-DRB1 and HLA-DQA1 genes (Cavalli et al., 2016). Another analysis in particular found that there was a direct relationship between systemic lupus erythematosus (SLE), SNPs located in the XL9 region, and MHC-II gene expression (Raj et al., 2016). The levels of histone H3K27 acetylation (H3K27ac) in the HLA-DR/DQ intergenic region were found to be strongly associated with SLE (Pelikan et al., 2018). Additionally, a SNP correlating with Parkinson’s disease and mapping to the first intron of HLA-DRA correlated with increased expression of HLA-DRB1 HLA-DQA1 and HLA-DQB1 mRNAs (Kannarkat et al., 2015). These findings and our previous observations raise the question of how variation within XL9 and other complex regulatory elements control MHC-II expression and contribute to human diseases.
Based on bioinformatic analyses in B cells, two super enhancers (SEs) were identified in the intervening sequences between HLA-DRB1 and HLA-DQA1 (Hnisz et al., 2013). Although one of these contained XL9, the other was new and not previously characterized. To investigate the functions and relationship of these SEs on MHC-II gene expression, we deleted these sequences using CRISPR/Cas9 gene editing methods. Our results showed that deletion of the SEs directly modified expression of the adjacent MHC-II genes. Loss of DR/DQ-SE resulted in a reduction in the recruitment of CIITA to the promoters, as well as concomitant reduction in histone modifications associated with active chromatin. Moreover, we found that each of the SEs interacted with each other and with their adjacent promoter regions. Importantly, the activity of DR/DQ-SE was necessary for interactions between the MHC-II promoters, XL9, and other CTCF binding sites within the locus. These data therefore provide evidence that DR/DQ-SE is directly responsible for modulating the expression of the MHC-II genes and establishing the architectural nexus that regulates the locus.
Results
Identification of SEs (DR/DQ-SE and XL9-SE) in the intergenic region of HLA-DRB1 and HLA-DQA1
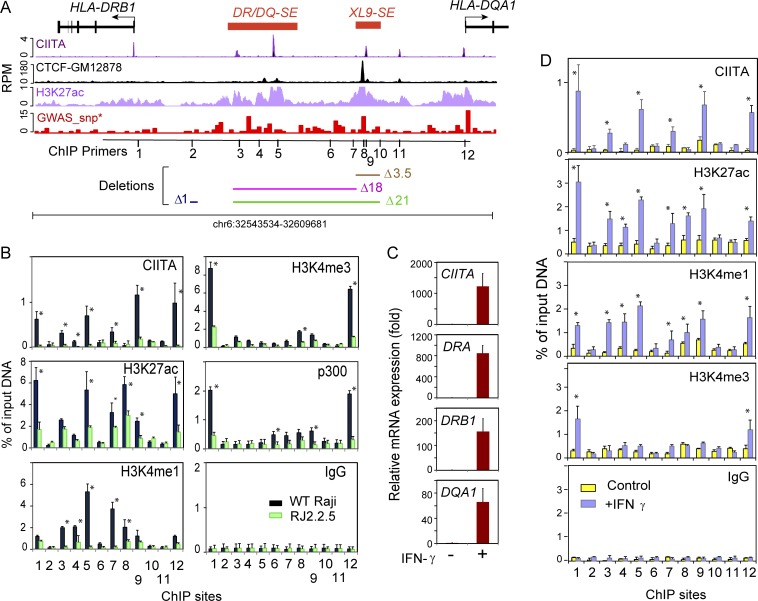
SEs represent the top percentage of genomic enhancer elements based on enrichment of H3K27ac, Mediator, and lineage defining transcription factors and are associated with increased levels of disease-associated SNPs (Parker et al., 2013; Whyte et al., 2013). In both primary human B cells and the GM12878 cell line, the intergenic region between HLA-DRB1 and HLA-DQA1 was classified as an SE (Hnisz et al., 2013). Indeed, in the Burkitt lymphoma B cell line Raji (Epstein et al., 1966), this region is highly enriched for H3K27ac and H3K4 monomethylation (me1) and contains multiple CIITA binding sites (Scharer et al., 2015; Fig. 1 A). Based on H3K27ac enrichment, the region was subdivided into two SEs (Hnisz et al., 2015), with the SE closest to HLA-DRB1 spanning ∼10 kb and having an average H3K27ac content 13.2-fold higher than site 2 (background control fragment) as defined by conventional chromatin immunoprecipitation (ChIP; Fig. 1 B). We termed this element DR/DQ-SE, reflecting its intergenic location. The second element encompasses the XL9 CTCF binding site (Majumder et al., 2006) and was termed XL9-SE, reflecting its original description. The H3K27ac content of XL9-SE was 16.2-fold higher relative to site 2 (Fig. 1 B). Although there is some background signal, CTCF binding within the entire intergenic region is dominated by the single site within XL9-SE. Using ChIP sequencing (ChIP-seq), we previously identified multiple potential CIITA-binding sites within the intergenic region (Scharer et al., 2015), with at least one strong signal in each SE. Lastly, the density of SNPs from the genome-wide association study (GWAS) catalog (Buniello et al., 2019; see Materials and methods) was annotated in 500-bp bins across the genome and revealed that both DR/DQ-SE and XL9-SE are among the top 0.1% of disease-associated genomic loci (Fig. 1 A). Thus, both the DR/DQ-SE and XL9-SE have multiple hallmarks of SEs and are associated with human disease risk alleles.
Figure 1.
Two SEs reside in the intergenic region between HLA-DRB1 and HLA-DQA1. (A) Schematic of the HLA-DR, -DQ intergenic region. CIITA, CTCF, and H3K27ac ChIP-seq data from The ENCODE Project Consortium (2012) and Scharer et al. (2015) are plotted with respect to the HLA-DRB1 and HLA-DQA1 genes. Red bars represent the DR/DQ-SE and XL9-SE SEs. The GWAS-SNP track shows the density of disease-associated SNPs in 500-bp bins across the region. The positions of ChIP primers (Table S1) are shown, as are regions that are deleted in the CRISPR/Cas9 mutant series. (B) Conventional ChIP-qPCR was performed on Raji and RJ2.2.5 cell chromatin for the indicated antibody with ChIP primer sets located at positions illustrated in A. (C) Relative fold change of the indicated gene expression as determined by qRT-PCR of A-431 cells ± 24 h treatment with IFNγ. (D) ChIP as in B of A-431 cells ± IFNγ treatment. Experiments in this figure were performed at least three times from independent cultures. Data represent mean ± SD, and significance was determined by Student’s t tests. *, P ≤ 0.05.
CIITA controls MHC-II SE active chromatin state
To validate the ChIP-seq data and determine the role played by CIITA in the histone modifications, a series of traditional ChIP assays were performed using Raji cells. Raji, which express high levels of MHC-II and its CIITA-deficient derivative RJ2.2.5 (Accolla, 1983; Steimle et al., 1993), have been used for decades as a model, experimental B cell line to understand human MHC-II gene regulation (Beresford and Boss, 2001; Majumder et al., 2008; Sloan and Boss, 1988). A total of 12 loci/sites covering the promoters of HLA-DRB1 (site 1), HLA-DQA1 (site 12), DR/DQ-SE (sites 3–5), and XL9-SE (sites 7–9) were examined by conventional ChIP. The results confirmed some of the ChIP-seq data, with high levels of CIITA binding at sites 3 and 5 in DR/DQ-SE and site 9 in XL9-SE, as well as the promoters of HLA-DRB1 and HLA-DQA1 (Fig. 1 B). However, a signal for CIITA binding to site 11, located downstream of XL9-SE, was near background and did not support the ChIP-seq data in that region. As expected, only a background CIITA signal was observed in the RJ2.2.5 cell line.
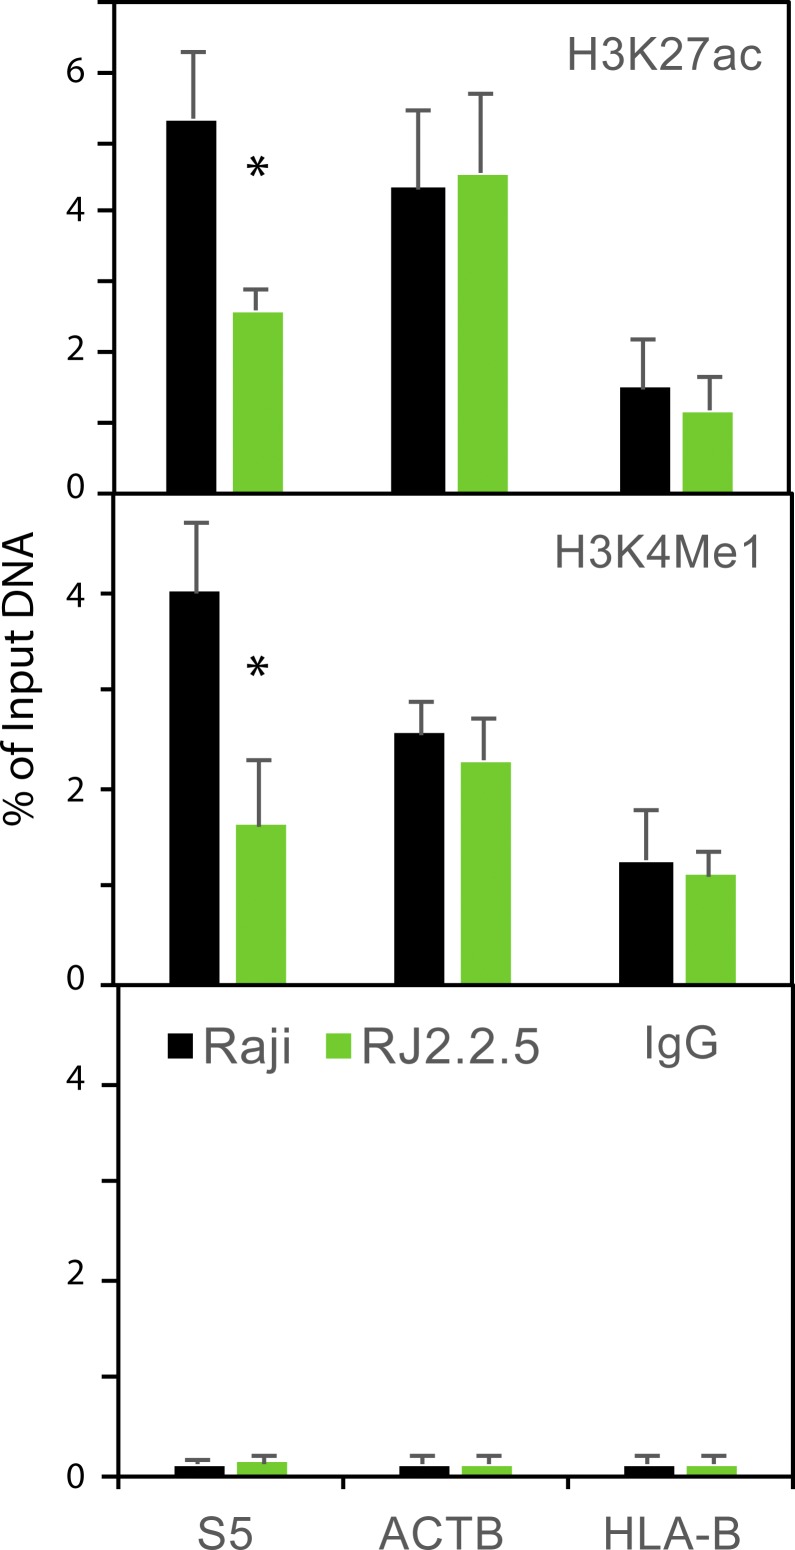
H3K27ac levels corresponded to peaks from the ChIP-seq datasets, with highest levels at the gene promoters (sites 1 and 12), the CIITA peak (site 5) in DR/DQ-SE, and at the XL9 CTCF binding site (site 8; Fig. 1, A and B). With the exception of site 3, H3K27ac levels were significantly reduced in the absence of CIITA (RJ2.2.5 cells). p300 levels were also centered on promoters, with some enrichment at the XL9-SE but not at the DR/DQ-SE, suggesting a lesser role of this histone acetyltransferase at these SEs. H3K4me1 levels, which are also enriched in SEs (Hnisz et al., 2013), were highest at the CIITA site in DR/DQ-SE (site 5) and at sites 7–9, encompassing the CTCF site in XL9-SE. In both SEs, the enrichment of H3K4me1 was nearly completely dependent on the presence of CIITA. At other expressed gene promoters (β-actin and HLA-B), the levels of H3K27ac and H3K4me1 in RJ2.2.5 and Raji cells were similar; thus, the noted decreases were not due to a global change in these marks in RJ2.2.5 cells (Fig. S1). As expected, the levels of H3K4me3 were centered over the promoters (Ernst et al., 2011), with some enrichment at XL9-SE. All H3K4me3 MHC-II promoter enrichment was dependent on CIITA, as initially observed (Beresford and Boss, 2001; Gomez et al., 2005). Thus, in B cells, the active chromatin state of these SEs is largely dependent on the presence of CIITA.
Figure S1.
Raji and RJ2.2.5 have similar H3K27ac and H3K4me1 levels at expressed non-MHC-II genes. Conventional quantitative ChIP was performed on the promoters of the ACTB and HLA-B genes for the above histone marks, including an IgG control. Data were derived from three independent chromatin preparations. SDs are shown, and Student’s t tests were used to determine significance between Raji and RJ2.2.5 preparations. *, P ≤ 0.05.
IFNγ induces SE chromatin activity
MHC-II genes are induced by IFNγ in nonimmune cell types through the induction and expression of CIITA (Chang et al., 1992; Collins et al., 1984). The human epithelial cell line A-431 is highly responsive to IFNγ induction of both CIITA and MHC-II genes (Fig. 1 C). To further determine the relationship between the SEs and MHC-II regulation, ChIP assays assessing the levels of H3K27Ac, H3K4me1, and H3K4me3, as well as CIITA binding, were performed across the DR/DQ intergenic region following exposure of A-431 cells to IFNγ. As expected, the promoter regions showed all three active marks under MHC-II–expressing cell conditions (+IFNγ; Fig. 1 D). Additionally, both SEs showed IFNγ-dependent induction of H3K27ac and H3K4me1 levels. CIITA binding was observed only in IFNγ-treated cells and occurred at the same locations as those observed in Raji B cells (Fig. 1, B and D). In the absence of IFNγ, all marks were reduced, corroborating the results from RJ2.2.5 cells and demonstrating a role for CIITA in mediating the observed histone modification activity. Thus, in both a constitutive and an inducible system, the MHC-II SEs contain active histone modifications that are associated with MHC-II gene expression and the presence of CIITA.
DR/DQ-SE contributes to the expression of HLA-DRB1 and HLA-DQA1
The above data suggest the hypothesis that the SEs play a critical role in controlling MHC-II gene expression. To investigate the mechanism, a series of deletion mutants were generated in Raji cells using CRISPR/Cas9 genome editing technologies (Cong et al., 2013; Mali et al., 2013). Three homozygous deletions were created (Fig. 1 A): a 21-kb deletion (termed Δ21) encompassing the entire region from DR/DQ-SE through most of XL9-SE; an 18-kb deletion (termed Δ18) that spans DR/DQ-SE but leaves XL9-SE intact; and a 3.5-kb deletion (termed Δ3.5) that encompasses the CTCF and CIITA sites of XL9-SE. In total, nine, three, and six independent homozygous clones were isolated for each of the above mutants, respectively. A heterozygous clone in which the CRISPR/Cas9 system was used to generate a deletion of 0.7 kb in a region that contained no active chromatin marks (termed Δ1) was isolated and used as a control for the CRISPR/Cas9 editing and selection process in some of the experiments.
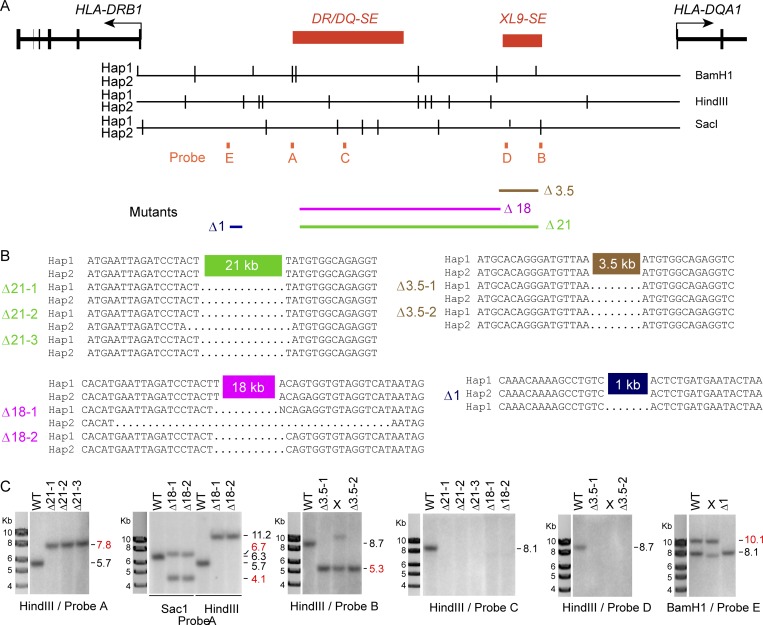
The authenticity of the deletions was determined by genomic PCR, with some of the clones further validated by Southern blotting and DNA sequencing of the novel junctions created following gene editing (Fig. S2). Because the region is extremely polymorphic (Raj et al., 2016), validation required assigning specific deletions to the appropriate haplotype/allele. Moreover, because a Raji genome sequence was not publicly available, we sequenced the Raji genome to 30× coverage and assembled a haplotype phased diploid genomic sequence. The HLA-DR3 allele was assigned to haplotype 1 and the HLA-DR10 allele to haplotype 2. For all clones analyzed by sequencing, the CRISPR/Cas9 deletions reflecting the position of the guide RNAs were similar on both alleles, with only minor variation in the breakpoints of some of the clones (Fig. S2).
Figure S2.
Genomic analysis of CRISPR/Cas9 gene-edited clonal isolates. (A) Schematic of restriction enzyme sites relative to the DR-DQ intergenic region. For each of the Raji haplotypes (Hap1/Hap2), the vertical bars indicate the relative location of the restriction sites in the region that were used for Southern blotting. The positions of the Southern blot probes and relative locations of the deletions are indicated below map. (B) DNA sequences of the novel junctions formed by CRISPR/Cas9 editing are shown. Dots indicate region not present. Haplotypes were determined by polymorphisms in adjacent sequences not shown. (C) Southern blots of the indicated mutant isolates with the restriction enzyme and probe used in each. Red molecular weight positions (kb) indicate the positions of expected mutant bands. Lanes denoted with an X represent clones not used due to an incorrect banding pattern.
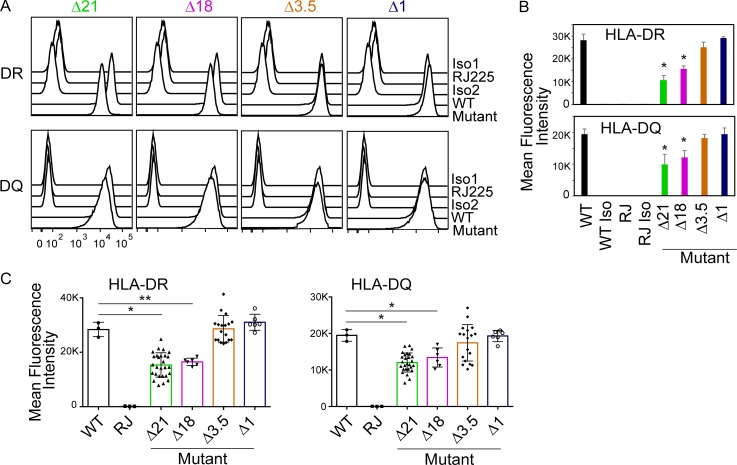
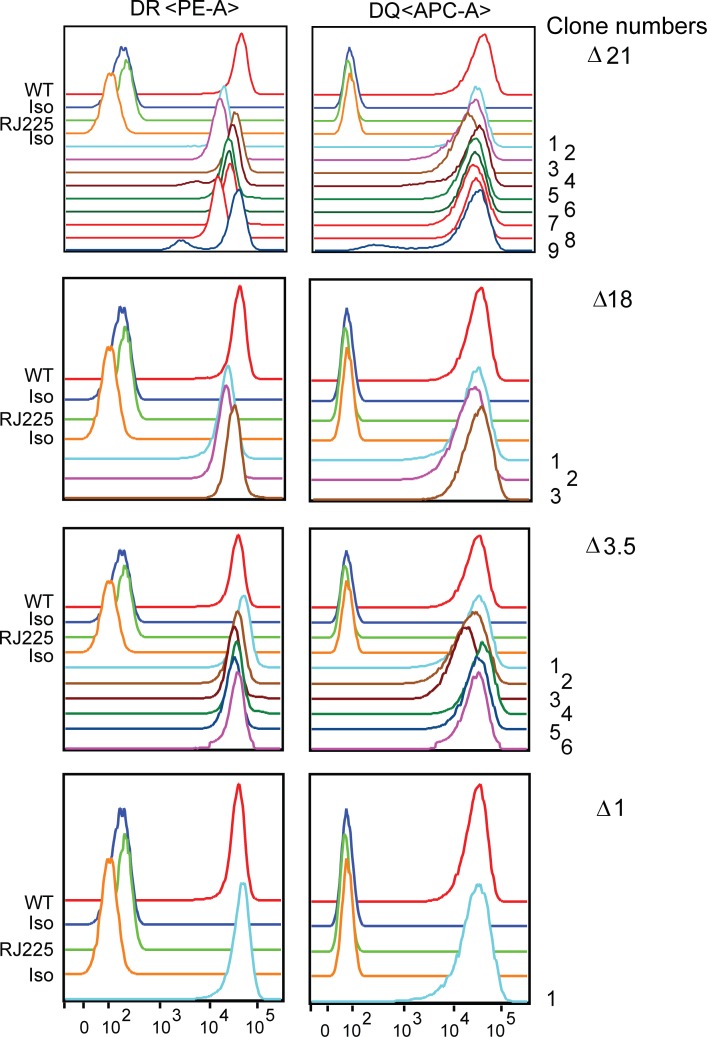
Cultures of mutant and WT cells were started simultaneously from liquid N2 stocks, and the surface expression levels of HLA-DR and HLA-DQ were determined by flow cytometry. Compared with either WT Raji or Δ1 cells, a significant reduction in both HLA-DR and HLA-DQ expression was observed in specific Δ21 and Δ18 mutant clones (Fig. 2, A and B). Flow cytometry of all isolated mutant clones (Fig. S3) showed variation in expression levels; however, an overall reduction in expression of both HLA-DR and HLA-DQ levels in Δ21 and Δ18 mutant clones was observed (Fig. 2 C), arguing against clonal variation that could result from the CRISPR/Cas9 process. Additionally, Raji and the Δ1 clone showed near-identical levels in all experiments. These results point to a critical role for DR/DQ-SE in regulating MHC-II expression. In contrast to the results observed for DR/DQ-SE, deletion of XL9-SE (Δ3.5) did not lead to a reduction in either HLA-DR or HLA-DQ expression (Figs. 2 and S3). This latter result could suggest that if the activity of the XL9-SE is due in part to CTCF binding, it may predict a redundancy in the ability to use other CTCF binding elements that are spread throughout the locus (Majumder and Boss, 2010; Majumder et al., 2014).
Figure 2.
Super-enhancer region deletion results in a reduction of surface HLA-DR and HLA-DQ expression. (A) Cultures of representative Δ21, Δ18, and Δ1 mutant cell lines were stained for surface HLA-DR and HLA-DQ expression and analyzed by flow cytometry. Raji and RJ2.2.5 cells were stained as positive and negative controls, respectively. Isotype control staining patterns for antibodies are also shown. This figure is representative of three independent experiments. (B) Quantitative analysis of mean fluorescence intensity of HLA-DR and HLA-DQ from A. (C) Quantitation of mean fluorescence intensity of HLA-DR and HLA-DQ expression obtained from three independent cultures of all homozygous mutants isolated (Fig. S2) were plotted with WT and RJ representing Raji and RJ2.2.5 cells, respectfully. Data represent mean ± SD. One-way ANOVA with Tukey’s post hoc test were used to assess significance. *, P ≤ 0.05; **, P ≤ 0.01.
Figure S3.
Flow cytometry of all mutant cell lines. Cultures of all homozygous Δ21, Δ18, and Δ1 mutant cell lines were stained for surface HLA-DR and -DQ expression and analyzed by flow cytometry. Raji (WT) and RJ2.2.5 cells were stained as positive and negative controls, respectively. Isotype (iso) control staining patterns for surface antibodies are also shown.
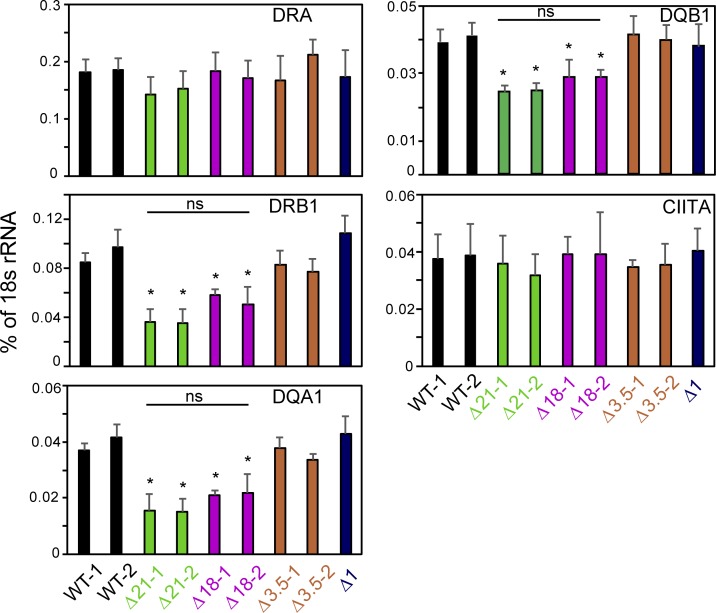
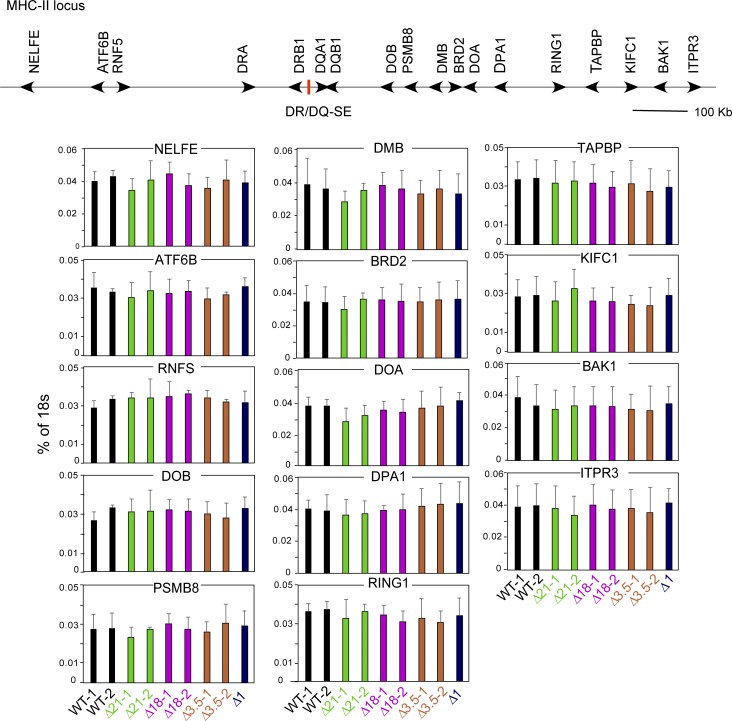
To further demonstrate a role for these elements in regulating these genes, mRNA levels were assessed by quantitative RT-PCR (qRT-PCR). For these experiments, two clones from each mutant group, which were validated by all three methods discussed above, were chosen. Assessment of steady-state mRNA expression showed a significant reduction in the levels of HLA-DRB1, HLA-DQA1, and HLA-DQB1 mRNAs from either Δ21 or Δ18 but not Δ3.5 mutant clones (Fig. 3). Δ1 cells exhibited WT (Raji) mRNA levels. Importantly, CIITA mRNA levels were similar for each of the clones, eliminating differences in CIITA expression as a cause of the observed effects. Moreover, no significant reduction in HLA-DRA mRNA levels was observed, suggesting that this gene was not influenced directly by these SEs. To determine if other genes within the MHC-II locus were affected by deletion of DR/DQ-SE or XL9-SE, qRT-PCR was performed on RNA isolated from WT and mutant lines for 14 additional genes located within the ∼1-Mb MHC-II locus (Fig. S4). The results showed that the broad effect of DR/DQ-SE was restricted to the immediate HLA-DR/DQ subregion of the MHC.
Figure 3.
Deletion of the SE region reduces HLA-DRB1 and HLA-DQA1 mRNA levels. RNA was isolated from two independent isolates for each designated mutant line and subjected to qRT-PCR for expression of the indicated MHC-II gene or CIITA. WT represents duplicate Raji cell cultures. Data were normalized to the percentage of 18s rRNA, and the mean ± SD is shown. Each culture was analyzed three independent times, and significance was determined by two-tailed Student’s t tests between the WT and other samples. *, P ≤ 0.05. A one-way ANOVA with Tukey’s post hoc test gave similar P values when sample groups (WT, Δ21, Δ18) were combined. No significant differences between samples under the bar labeled ns were observed.
Figure S4.
Expression of genes outside of the HLA-DR/DQ subregion in mutant cell lines. Schematic of the relevant portion of the human MHC with selected genes indicated. qRT-PCR was performed on RNA isolated from the indicated WT and mutant cell lines as in Fig. 3. Data represent three independent experiments, and the mean ± SD are shown. Student’s t tests and one-way ANOVA with Tukey’s post hoc test were used to determine significance as described in Fig. 3; however, no differences between the samples for these genes were observed.
Deletion of DR/DQ-SE and XL9-SE impacts CD4 T cell responses
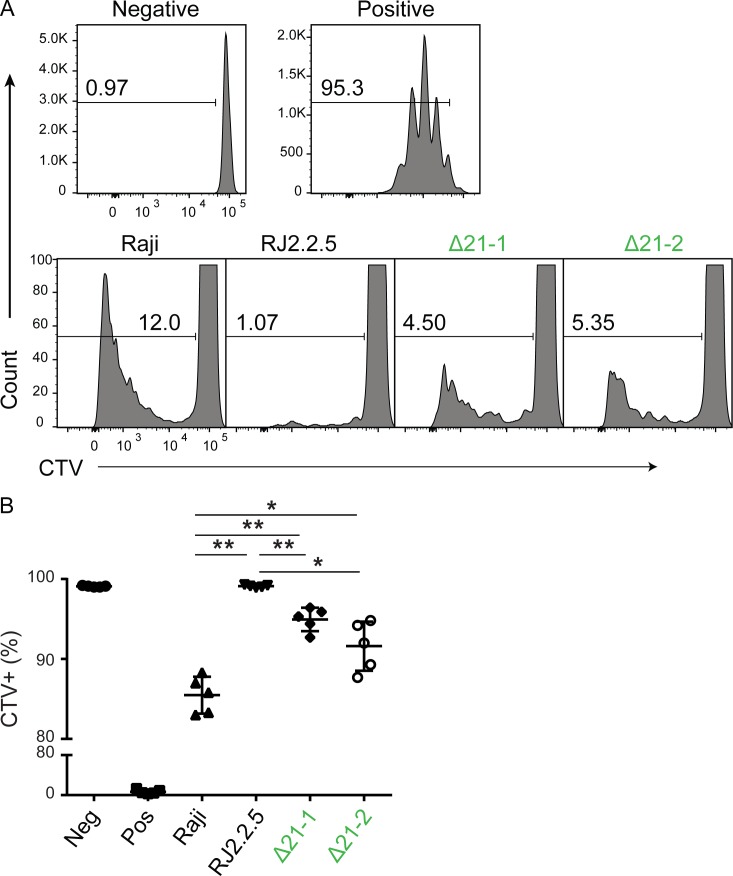
The above data raise the question as to whether the observed changes in MHC-II expression could have an impact on immune responses. To test this, a mixed lymphocyte reaction experiment was performed to test alloreactivity to MHC-II antigens. Here, CD4+ T cells were isolated from healthy subjects, labeled with CellTrace Violet (CTV) to track proliferation, and plated with 5,000 mitomycin C–treated Raji cells or the Δ21 DR/DQ-SE mutants. Cellular CTV levels were evaluated by flow cytometry after 6 d in culture. As a measure of allogenic stimulation, cells that divided once or more were considered CTV negative for this assay. The results showed that CD4+ T cells divided efficiently in response to anti-CD3/CD28 beads but not to the no-stimulation control or to RJ2.2.5 cells, which lack MHC-II expression (Fig. 4). CD4+ T cells also proliferated in response to WT Raji cells, as expected. Importantly, both Δ21 mutant lines tested showed reduced proliferation compared with Raji cells but more than RJ2.2.5 cells. These data suggest that the changes in MHC-II levels caused by deletion of the SEs can impact the ability of CD4+ T cells to respond in an allogeneic setting.
Figure 4.
MHC mutant cells incompletely stimulate allogenic CD4 T cells to divide. Freshly isolated human CD4+ T cells were labeled with CTV and cocultured with Raji cells, RJ2.2.5 cells, or Δ21 cells for 6 d. (A) Histograms of CTV-labeled cells, set to observe T cells that divided at least once and lost CTV label. Negative (Neg) control in which CD4 T cells were incubated without stimulation. Positive (Pos) control in which CD4+ T cells were incubated with anti-CD3/CD28 beads. (B) Summation of data in A. Peripheral blood samples were isolated from five healthy subjects, and the experiment was performed in groups of two and three. Data represent mean ± SD. Subject samples were compared across all stimulations using a repeated measures one-way ANOVA, with the Greenhouse–Geisser correction followed by a Tukey’s post hoc test. *, P ≤ 0.05; **, P ≤ 0.01.
Loss of DR/DQ-SE and XL9-SE SEs results in reduction of active chromatin marks at MHC-II promoters
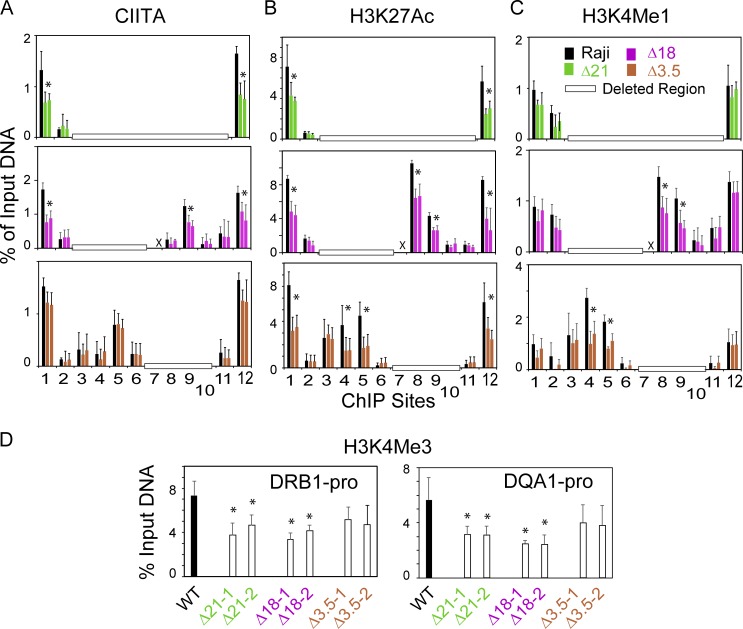
MHC-II promoters (Beresford and Boss, 2001; Gomez et al., 2005) and the SEs (Fig. 1) are associated with active chromatin modifications, including H3K27ac, H3K4me1, and H3K4me3. To derive a mechanism by which the SEs were influencing HLA-DRB1 and HLA-DQA1 expression, ChIP assays were performed to determine if the absence of the SEs influenced the above histone modifications or the occupancy of CIITA at the promoters. Chromatin isolated from Δ21 (DR/DQ-SE and XL9-SE), Δ18 (DR/DQ-SE), and Δ3.5 (XL9-SE) mutant cells and control Raji cells was interrogated for CIITA binding and the presence of the above histone marks (Fig. 5). CIITA occupancy on HLA-DRB1 and -DQA1 promoters was significantly reduced in Δ21 and Δ18 mutants compared with WT Raji cells (Fig. 5 A). Although CIITA occupancy at the HLA-DRB1 and -DQA1 promoters appeared slightly lower in the Δ3.5 mutant, this was not statistically significant (HLA-DRB1, P = 0.069/Δ3.5-1 and P = 0.100/Δ3.5-2; HLA-DQA1, P = 0.103/Δ3.5-1 and P = 0.065/Δ3.5-2). These results suggest that optimal recruitment of CIITA to the promoter regions requires the DR/DQ-SE. CIITA recruitment to ChIP site 9 was also affected by the loss of DR/DQ-SE. In contrast, CIITA occupancy levels were not affected by the loss of XL9-SE (Δ3.5). The levels of H3K27ac were significantly reduced at the promoters in all three mutants (Fig. 5 B). Reduction of H3K27ac was also observed at sites 4 and 5 within DR/DQ-SE when XL9-SE was absent.
Figure 5.
CIITA recruitment and histone modifications are altered at MHC-II promoters following deletion of DR/DQ-SE. (A–C) Conventional ChIP-qPCR assays for binding of CIITA or enrichment (A) of H3K27ac (B) and H3K4me1 (C) were performed on Raji (WT) or two represented isolates for each of the mutations deleting the DR/DQ-SE (Δ18), XL9-SE (Δ3.5), or both (Δ21) regions. Positions of ChIP PCR sites 1–12 are shown in Fig. 1 A. (D) ChIP assays for H3K4me3 were performed at the indicated promoter regions. ChIP assays were performed in triplicate from three independent cultures. X represents ChIP assays not performed for the indicated site. Horizontal open bars represents ChIP sites deleted in the mutants assayed. Data represent mean ± SD. For A–C, Student’s t tests were performed to determine the significance between a WT sample and a mutant sample. For D, a one-way ANOVA with Tukey’s post hoc test was performed to assess significance. *, P ≤ 0.05.
For all three mutants, H3K4me1 levels at the promoters were not statistically distinct from WT cells. However, H3K4me1 levels were about half of the WT at sites 4 and 5 (DR/DQ-SE) when XL9-SE was deleted, suggesting that XL9-SE can influence the chromatin state of the DR/DQ-SE (Fig. 5 C). Deletion of the DR/DQ-SE in both the Δ21 and Δ18 mutant cells exhibited lower levels of H3K4me3 at the promoters (Fig. 5 D), potentially reflecting the changes in CIITA occupancy at the promoters. Together, these results imply two potential mechanisms, one involving a change in occupancy of CIITA, which was dependent on DR/DQ-SE, and a second that may reflect a distinct role for the SEs. Moreover, the observation that the SEs influence distal chromatin states or CIITA occupancy suggests that interactions between the elements may occur.
DR/DQ-SE participates in chromatin interactions in HLA-DRB1 and HLA-DQA1 loci
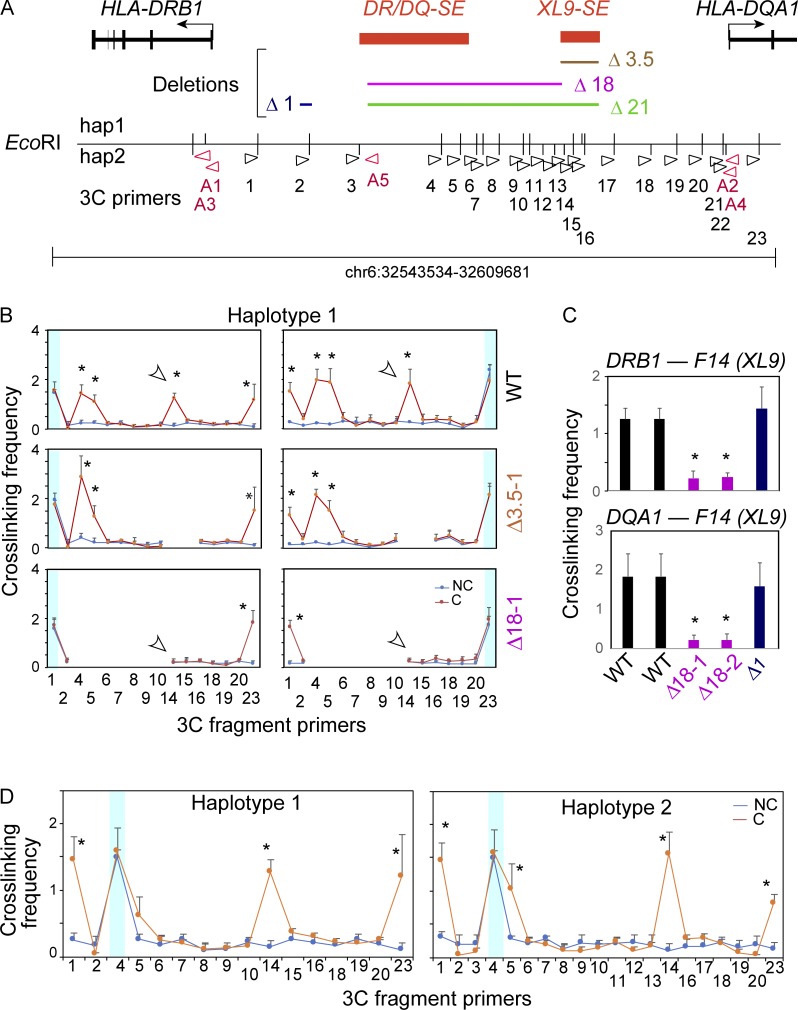
Higher-order chromatin organization is mediated in part through CTCF bound to its cis-acting elements, thereby connecting two distantly separated DNA fragments (Corces and Corces, 2016; Oomen et al., 2019; Rowley and Corces, 2016). In our previous work examining both the human and murine MHC-II loci (Choi et al., 2011; Majumder and Boss, 2010, 2011; Majumder et al., 2008, 2014), CTCF-bound elements interacted in a distance-dependent manner, forming long-range chromatin loops. In a CTCF- and CIITA-dependent manner, these CTCF elements, like XL9, also interacted with the nearby promoter regions (Majumder and Boss, 2010; Majumder et al., 2008). Importantly, CTCF and presumably these interactions were critical for optimal MHC-II expression (Majumder and Boss, 2010). Considering the dependence of HLA-DR and HLA-DQ expression on CIITA binding to promoters, and the active chromatin state on both SEs, we sought to determine if the SE interacted with the promoters or each other or influenced the CTCF interactions across the region. Thus, a quantitative chromatin conformation capture (3C) assay developed previously for this system (Majumder and Boss, 2010; Majumder et al., 2008) was employed on the Δ18 and Δ3.5 mutant cells to determine the relationship between the SE and chromatin interactions across the locus (Figs. 6 and 7). Raji cells were used as the WT control. Here, following formaldehyde cross-linking, chromatin DNA was digested with EcoRI, diluted, and religated, allowing the formation of novel junctions between restriction fragments that were in close spatial proximity. Because this region is polymorphic in Raji cells and contains some haplotype-specific EcoRI sites (Fig. 6 A), each haplotype was analyzed. A total of 23 restriction fragments were assessed with the promoter containing restriction fragments as “anchor sites.”
Figure 6.
DR/DQ-SE is necessary for chromatin looping structure between XL9 and MHC-II promoter regions. (A) Schematic of DR/DQ intergenic region, with detailed location and orientation of 3C primers (Table S1) relative to the EcoRI restriction sites (vertical lines above and/or below reference line) for haplotypes 1 and 2. Anchor 3C primers (red) were used in all promoter-based 3C assays specific for haplotype 1 (A1 and A2) or haplotype 2 (A3 and A4) with each of the other 23 primers sets (black) according to the haplotype assayed. (B) 3C assays were conducted on Raji cells (WT) or a representative Δ3.5 or Δ18 mutant clone. Haplotype 1 assays are shown. These data and those from a second independent clone and haplotype 2 are shown in Fig. S5. Blue shaded areas represent the self-ligating restriction fragments associated with the anchor primer and serve as an internal control for restriction enzyme efficiency/accessibility in digesting the cross-linked chromatin. The cross-linked frequency with standard error represents the relative amount of 3C product for each set of interactions divided by a nonspecific control fragment within each set of reactions. (C) 3C assays comparing interactions between XL9 (fragment 14) and the indicated promoters in Raji (WT), Δ18 (two independent clones), or Δ1 control cells. (D) 3C assays performed in Raji cells with an anchor set to EcoRI site 4 (red arrowhead) representing the DR/DQ-SE. These data were derived from three independent chromatin preparations. SDs are shown, and two-tailed Student’s t tests were performed between cross-linked (C) and non–cross-linked (NC) samples. *, P < 0.05.
Figure 7.
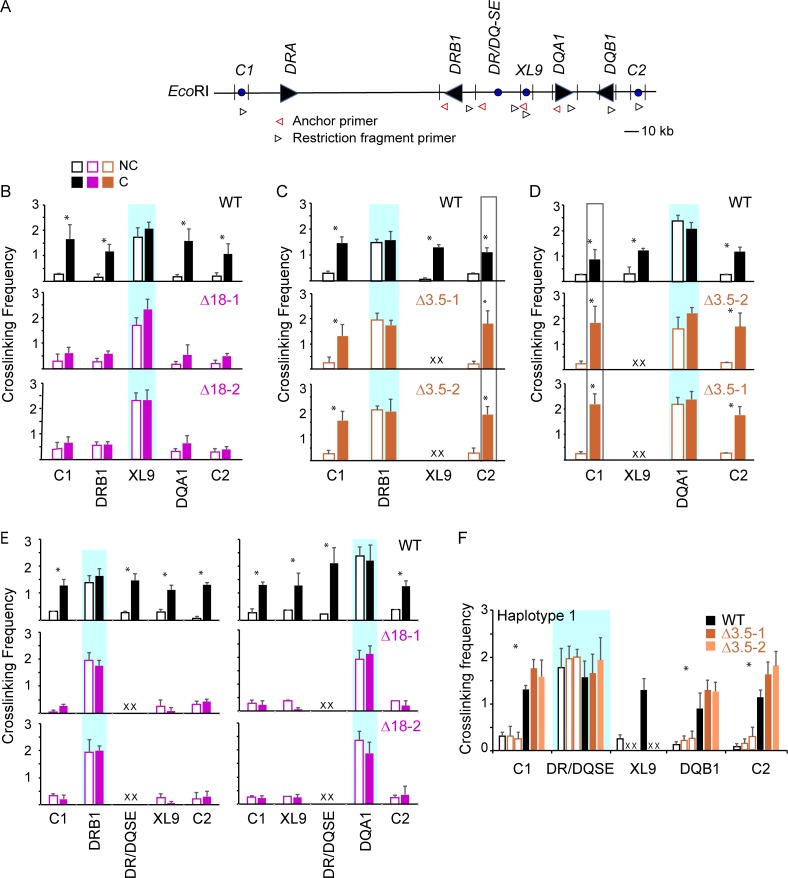
The DR/DQ-SE controls CTCF-CTCF site as well as CTCF site–promoter interactions within the DR-DQ MHC II region. (A) Schematic map of HLA-DR and HLA-DQ regions, including CTCF sites C1, XL9, and C2. The locations of the 3C primers (black arrowheads) and anchors (red arrowheads) used in these assays are indicated. (B–F) Quantitative 3C was performed as in Fig. 6 to assess interactions between XL9, DR/DQ-SE, HLA-DRB1, -DQA1 promoters or CTCF sites C1 and C2 in Raji cells (WT) or the indicated mutant isolate. Blue shaded boxes indicate the anchor region. C, cross-linked (solid bars); NC, non–cross-linked samples (open bars). Data were derived from three independent chromatin preparations. SDs are shown, and two-tailed Student’s t tests were performed between C and NC samples. *, P ≤ 0.05.
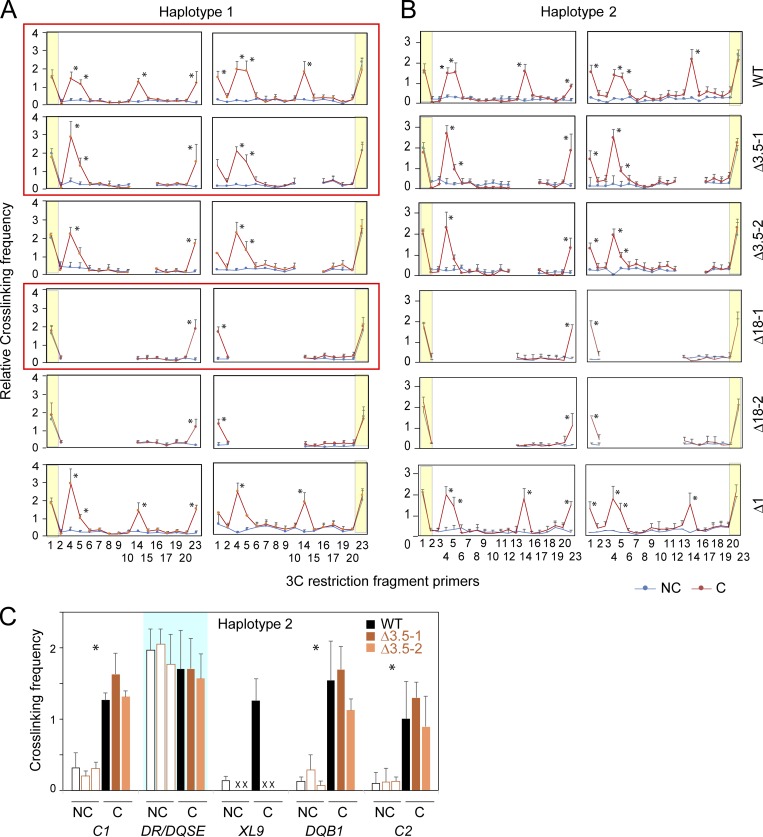
3C interactions between each of the HLA-DRB1 and -DQA1 promoter “anchor” regions with the XL9-SE (fragment 14) recapitulated previous findings in Raji cells (Majumder and Boss, 2010; Majumder et al., 2008; Fig. 6 B). This was true for both haplotypes (Fig. 6 B, haplotype 1; Fig. S5, haplotypes 1 and 2). Surprisingly, 3C interactions between the promoters and XL9 were absent in the Δ18 mutants, irrespective of haplotype, and this result was confirmed in a second Δ18 clone (Fig. 6, B and C; and Fig. S5). Furthermore, a novel 3C interaction between the DR/DQ-SE (fragments 4 and 5) occurred with each of the promoters in WT cells (Fig. 6 B). The Δ1 clone showed WT interactions (Fig. S5), and non–cross-linked chromatin preparations demonstrate the dependence of the interactions on cross-linking. Additionally, self-ligated anchor fragments were used to display similar restriction digestion/ligation efficiency between cross-linked and non–cross-linked species. Together, these results revealed that DR/DQ-SE is required for chromatin interactions between XL9-SE and the proximal MHC-II promoters but that XL9-SE was not required for interactions between the promoters and DR/DQ-SE.
Figure S5.
3C interactions between promoters and SEs. 3C assays were performed on the indicated WT (Raji) or indicated mutant cell line clones as described in Materials and methods and Figs. 6 and 7. (A and B) Haplotype 1 (A) and Haplotype 2 (B). Yellow shaded bars indicate location of the anchor primers used to interrogate interactions with the other restriction fragments. Red-outlined panels indicate those that are shown as part of Fig. 5. They are replicated here for the sake of comparison. (C) 3C assay showing Haplotype 2 for comparison to Fig. 7 F. C (solid bars) and NC (open bars) represent cross-linked and non–cross-linked control samples, respectively. These assays represent three independent experiments each, and the mean ± SD were plotted. Student’s t tests were used to determine significance. *, P ≤ 0.05 for all comparisons in each group between C and NC where indicated.
The above results suggest that DR/DQ-SE might interact with XL9-SE. To test this, 3C assays were performed across the intergenic region using fragment 4 within DR/DQ-SE as an anchor (Fig. 6 D). Robust interactions between the two SEs were observed in both haplotypes, as were interactions between DR/DQ-SE and the promoters. These data provide a potential mechanism by which the SEs coordinate expression of these genes through long-range looping of regulatory elements.
CTCF interactions with HLA-DRB1 and HLA-DQA1 promoter regions are dependent on DR/DQ-SE
As mentioned above, we previously showed that multiple CTCF sites within the MHC-II region could interact with MHC-II promoters (Majumder and Boss, 2010). In particular, CTCF sites C1 and C2, which reside 5′ to the HLA-DRA and HLA-DQB1 genes, respectively (Fig. 7 A), interacted with XL9 and the HLA-DRB1 and -DQA1 promoters (Majumder and Boss, 2010). Thus, while the above results demonstrate an intriguing role for DR/DQ-SE in regulating the local chromatin organization with XL9, the question of whether the DR/DQ-SE also governed interactions with other CTCF sites remained unexplored. To address this, 3C interactions between XL9, C1, and C2 were reinvestigated. Using XL9 as an anchor, interactions between XL9 and C1 or C2 were confirmed in WT cells (Fig. 7 B), as were interactions between the HLA-DRB1 and HLA-DQA1 promoters and C1 or C2 (Fig. 7, C and D, respectively). Surprisingly, the deletion of DR/DQ-SE (Δ18) resulted in the loss of interactions between XL9 and the other CTCF sites (Fig. 7 B). Interactions between the HLA-DRB1 and HLA-DQA1 promoters with C1 or C2 were not affected by deletion of XL9-SE and may have led to an increase in the observed cross-linking frequency between the 3C fragments compared with the WT cells (Fig. 7, C and D). These results demonstrate a critical role for DR/DQ-SE in the overall three-dimensional architecture of the locus and imply that the function of XL9-SE may be replaced to some extent by other CTCF-bound sequences within the MHC-II locus and that, in its absence, there is a reconfiguration of the local chromatin architecture.
The influence of DR/DQ-SE on interactions between the HLA-DRB1 and -DQA1 promoters and three nearby CTCF sites (C1, XL9, and C2) was also examined. Surprisingly, deletion of DR/DQ-SE (Δ18) resulted in a complete loss of detectable interactions between the two promoters and the neighboring CTCF sites (Fig. 7 E). In contrast, deletion of XL9-SE (Δ3.5) did not diminish interactions between DR/DQ-SE and C1, C2, or the HLA-DQB1 promoter (Fig. 7 F). Thus, DR/DQ-SE is critically important in controlling the architecture of the MHC-II region, and its influence extends minimally from HLA-DRB1 through HLA-DQB1 and the C2 CTCF site.
Discussion
In this report, we characterized two SEs, DR/DQ-SE and XL9-SE, that reside in a highly polymorphic region of the human MHC-II locus, namely the 47 kb that separate the transcriptionally divergent HLA-DRB1 and -DQA1 genes. Of the SEs identified in human B cells, DR/DQ-SE was ranked first of 689 SEs in CD19+ B cells, 49th of 971 in CD20+ B cells, and 98th of 258 in the GM12878 cell line, for degree of H3K27ac signal (Hnisz et al., 2013). Using a cell line, Raji (Epstein et al., 1966), that has been a hallmark line used to define the regulation of MHC-II genes, we constructed a series of CRISPR/Cas9-mediated deletions that removed the SEs and determined the resultant phenotypes to assess the roles of each of the SEs. Our results demonstrate a role for DR/DQ-SE in optimal expression of the HLA-DRB1, HLA-DQA1, and HLA-DQB1 genes and support a model in which both DR/DQ-SE and XL9-SE contribute to a complex three-dimensional chromatin architecture of the region (Fig. 8). XL9-SE supported the role of DR/DQ-SE through histone modifications but did not influence MHC-II gene expression, suggesting that its role may be somewhat redundant with other CTCF-containing elements in the locus, as discussed below. Importantly, using a modified mixed lymphocyte reaction, we were able to demonstrate that the reduced levels of MHC-II on the Raji cell mutants could be detected by allogeneic responses to CD4+ T cells. Thus, DR/DQ-SE functions to regulate the expression of the MHC-II locus and contributes to the control of immune responses that rely on MHC-II–mediated antigen presentation.
Figure 8.
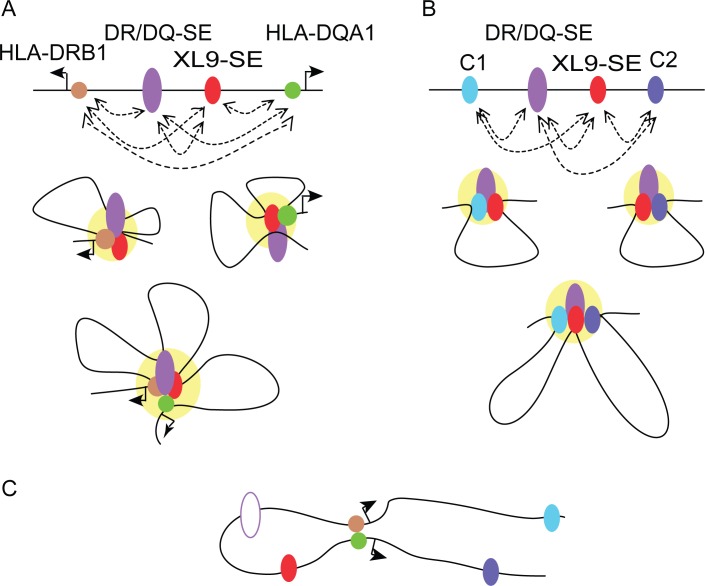
Models of potential chromatin interactions. (A) CIITA-dependent interactions between the two SEs with either the HLA-DRB1 or HLA-DQA1 promoters or together in a combined interaction hub (yellow) are illustrated. Dotted arrows signify interactions observed by 3C. (B) Interactions directed by the DR/DQ-SE and CTCF sites are illustrated as single sets of interactions or together in a combined hub. (C) Model schematic in the absence of DR/DQ-SE (open oval) showing interactions of the CIITA-bound promoter regions.
We previously showed that the CTCF binding to the XL9 region and other CTCF sites located between MHC-II gene pairs (e.g., DRA/DRB1) was critical for formation of long-distance interactions between the CTCF sites (Majumder and Boss, 2010). We also showed that the CTCF sites (C1, XL9, and C2) interacted directly with MHC-II promoters that were within 200 kb of each other (Majumder and Boss, 2010). These latter interactions, but not the former, were dependent on the presence of CIITA within the cells, and coimmunoprecipitation studies showed that the CTCF and CIITA could interact, suggesting the formation of a complex regulatory network or hub (Majumder et al., 2008). Here, deletion of XL9-SE, which included the original XL9 CTCF site and a CIITA-binding site, did not result in a loss of expression of any of the MHC-II genes. This is likely explained by the fact that, in its absence, MHC-II promoters interacted with the other CTCF-binding sites, suggesting that this aspect of MHC-II gene expression has built-in redundancy that is duplicated with every MHC-II α/β chain encoding gene set. A potential CIITA binding site located between XL9-SE and the HLA-DQA1 promoter, which was identified by ChIP-seq but not by conventional ChIP in Raji cells, did not appear to play a role in any of the above activities and was likely an artifact of the ChIP-seq process.
Deletion of DR/DQ-SE resulted in decreased HLA-DR and HLA-DQ expression, impacting HLA-DRB1, -DQA1, and -DQB1 mRNA levels. DR/DQ-SE interacted with the HLA-DRB1, DQA1, and DQB1 promoter regions and controlled the ability of XL9 to interact with the promoters. Deletion of DR/DQ-SE also impacted the ability of XL9 to interact with the other CTCF sites and for the C1 and C2 CTCF sites to interact with the HLA-DRB1 and HLA-DQA1 promoters. Thus, DR/DQ-SE appears to control the short- and long-range chromatin interactions that shape the architecture of the human MHC-II region (Fig. 8).
Both SEs played a role in the enrichment of the active H3K27ac chromatin modification at MHC-II promoters and each other. At MHC-II gene promoters, this mark is largely dependent on CIITA binding, as shown here and in other experiments (Beresford and Boss, 2001; Choi et al., 2011). CIITA promoter region binding was affected only by deletion of DR/DQ-SE, and thus the loss of H3K27ac at promoters in Δ18 may be directly related to the loss of that interaction. If the sole function of the XL9-SE is to provide a CTCF binding site, compensation by the other MHC-II CTCF sites could explain the maintenance of CIITA binding in Δ3.5, but not the loss of H3K27ac. This would imply that CTCF itself or another part of XL9-SE was contributing to a portion of the H3K27ac enrichment at the promoters. CTCF binding sites are usually in active chromatin regions and show extensive H3K27ac enrichment (Majumder and Boss, 2010; Ren et al., 2017). Both SEs also influenced the H3K27ac enrichment of each other. Previous studies that initially found interactions between XL9 and the HLA-DRB1 and HLA-DQA1 promoters also saw modest interactions across the intergenic region, including with the DR/DQ-SE. These interactions were examined from the opposite orientation and were not the focus of that study (Majumder et al., 2008). In the context of the current findings, it is likely that the two SEs function together with the promoter regions to regulate expression of multiple MHC-II genes (Fig. 8).
Both SEs had CIITA sites, with the peak in DR/DQ-SE showing the highest levels of CIITA binding by ChIP-seq. Examination of the ChIP-seq dataset (Scharer et al., 2015) suggests that this is one of the top 5 CIITA-binding peaks in the genome. As CIITA is not a DNA-binding protein itself, also within the site over ChIP primer set 5 (Fig. 1) are the requisite X1, X2, and Y box cis-elements that serve as binding sites for RFX, CREB, and NF-Y, respectively, and make up a functional CIITA-binding platform (Scharer et al., 2015). Years ago, CIITA was shown to be able to interact with itself, forming multimers, leading to models in which several CIITA molecules could be bound to a single promoter region (Kretsovali et al., 2001; Linhoff et al., 2001; Rasmussen et al., 2001; Sisk et al., 2001; Tosi et al., 2002; Wright and Ting, 2006). With CIITA sites in each of the SEs, this would suggest a new model in which SE activity that is mediated by CIITA is stabilized through CIITA–CIITA interactions that are provided through the cis-elements in the promoters and SEs. In such a model, CIITA bound to multiple X-Y sequences across the MHC-II locus would coordinate interactions between MHC-II promoters as observed in the Δ21 mutations, and between promoters and DR/DQ-SE. Such interactions would also be combined with CTCF site interactions, especially those that are contained within a SE region that has a CIITA-binding site like XL9-SE (Fig. 8). Other CTCF sites within the locus may function redundantly to the XL9-SE. Alternatively, there is the possibility of all CTCF and SE regions within the MHC-II locus interact in a single hub-like structure to coordinately control multiple MHC-II genes. Support for a model in which multiple genes interacting in a single hub could be extracted from the fact that the HLA-DRB1 and HLA-DQA1 promoter regions interact in a CIITA-dependent manner (Majumder et al., 2008) but independently of DR/DQ-SE (Fig. 8).
Genetic variants underlying complex diseases are often focused on regulatory elements (Lowe and Reddy, 2015; Price et al., 2015). Many autoimmune diseases are associated with genetic variation in the HLA-DR and -DQ genes (Bogner et al., 1992; Matzaraki et al., 2017). Although polymorphisms across the coding regions of the HLA-DRB1 and HLA-DQA1 genes are well documented, it is intriguing that an even greater number appear over the SEs. As mentioned, in SLE, a clear association of the XL9 region was observed (Raj et al., 2016), as was an association with histone acetylation (Pelikan et al., 2018). It is intriguing to speculate that these associations alter the function of DR/DQ-SE in forming multiple interactions across the region, thereby modulating the levels of MHC-II gene expression and the efficiency and robustness of cells to present antigens.
Materials and methods
Cell culture
The Burkitt’s lymphoma B cell line Raji (Epstein et al., 1966) was obtained from the American Type Culture Collection (CCL-86). The cell line RJ2.2.5 (provided by R. Accolla, University of Insubria, Varese, Italy) is a derivative of the Raji line that does not express MHC-II genes due to mutations within the CIITA gene (Accolla, 1983; Riley et al., 1995; Steimle et al., 1993) Cells were grown in RPMI 1640 supplemented with 5% FBS (Hyclone), 5% bovine calf serum (Hyclone), 100 U/ml penicillin/streptomycin, 4.5 g/liter glucose, 1.0 mM sodium pyruvate, and 10 mM HEPES. A-431 is an epithelial cell line that is negative for MHC-II expression (American Type Culture Collection, CRL-1555). A-431 cells were grown in DMEM with the described supplements and 10% FBS. Where indicated, A-431 cells were treated with 500 U/ml IFNγ to induce CIITA and MHC-II gene expression as previously described (Gomez et al., 2005; Majumder et al., 2008).
CRISPR/Cas9 mutagenesis
CRISPR/Cas9-mediated deletion was employed to generate genomic deletions using two methods. First, guide sequences that targeted SE flanking regions were designed using the CRISPR design tool (http://crispr.mit.edu/; Table S1) and cloned into the pX330-U6-Chimeric_BB-CBh-hSpCas9 plasmid (pX330; Addgene, 42230) as previously described (Ran et al., 2013). Additionally, a two-step PCR-based strategy was used to create a U6 promoter and sgRNA cassette. For the first PCR, a U6 promoter containing primer (5′-U6-Fwd) and a reverse primer specific for each of the targeting guide sequences (5′-XX-Rev) was used in 15 rounds of PCR with the pX330 plasmid as a template. Here, XX represents the guide targeting sequence and a portion of the tracer RNA. The resulting product was diluted 1:200 and amplified for an additional 15 cycles with the 5′-U6-Fwd and 5′-tracrRNA-Rev primers to generate the final PCR construct. To generate deletions, the sgRNA PCR products, pX330 plasmid, a 70–90 bp single-stranded DNA oligonucleotide homology arm (Table S1), and the pFLAG-GFP plasmid (Yoon et al., 2012) to monitor transfection efficiency were cotransfected into the Raji cells using a Nucleofector II (Lonza) according to the manufacturer’s protocol. The homology arm was designed to provide a template for the novel deletion joint and enhance deletion efficiency as previously described (Chen et al., 2011). After 4 d, GFP-positive cells were single-cell sorted into 96-well dishes. 3 wk later, each well was screened for evidence of deletion by PCR (Table S1). For all mutant clones used for analysis, PCR confirming deletion, sequencing of the deletion junction, and Southern blot analyses were performed to confirm homozygous deletion of both alleles for all mutants (Fig. S2).
Flow cytometry
Cells were harvested, washed twice with FACS buffer (PBS with 1% BSA and 2 mM EDTA), and resuspended at 107 cells per ml in the same buffer. Cells were stained for 1 h with anti-HLA-DR (PE; BD PharMingen, 555812) and anti-HLA-DQ (APC; Miltenyi Biotec, 130-104-497) antibody cocktails and fixed with 1% paraformaldehyde before analysis. Flow cytometric data were collected on an LSRII (Becton Dickinson) with FACSDiva v6.2 software. Analysis of flow cytometry data was conducted with FlowJo v9.9.5.
qRT-PCR
Total RNA was isolated using the RNeasy RNA isolation kit (Qiagen). cDNA synthesis was performed using Superscript II reverse transcription (Invitrogen) with 2 µg of total RNA in a volume of 20 µl in PCR II buffer containing 5 mM MgCl2 (Applied Biosystems). After reverse transcription, cDNA was diluted 1:200 µl with water and 3 µl used for qRT-PCR. The levels of 18s rRNA were used in each of the experiments to normalize the input between samples. PCR primers are listed in Table S2.
Mixed lymphocyte reactions
Human peripheral blood was obtained from five anonymous donors through the Emory Vaccine Center on their general Institutional Review Board protocol IRB00045821. Peripheral blood mononuclear cells were separated by density gradient centrifugation, and CD4 T cells were enriched using bead-based magnetic columns (Miltenyi Biotec). CD4 T cells were incubated with a 5-µM solution of CTV (Life Technologies) for 20 min at room temperature, washed, and diluted such that 100,000 cells were added per 100 µl in each well of a 96-well plate. Raji, RJ2.2.5, and the mutant cell lines were treated with 50 µg/ml mitomycin C (Sigma-Aldrich) for 20 min at 37°C, washed three times, and diluted such that 5,000 cells were added per 100 µl in each well of a 96-well plate. The use of mitomycin C prevented the Raji cells and their derivatives from overgrowing the culture. CTV-labeled CD4 T cells were cultured alone, with anti-CD3/CD28 Dynabeads Human T-Activator (Thermo Fisher Scientific), or with 5,000 cells from one of the Raji cell derivatives for 6 d. Flow cytometry was performed to analyze CTV expression using CD3-Alexa Fluor 700 (Invitrogen), CD4-PE-Cy7, CD19-APC, and Zombie Yellow viability dye (BioLegend). Data were analyzed using FlowJo v10. To calculate the percentage of CTV+ cells, a gate was set for each patient sample using the unstimulated, CTV-labeled negative control such that >99% of CD4+ T cells were CTV positive and applied to all test samples from that patient. Statistical analysis was performed in GraphPad Prism 6.
Whole-genome sequencing
Raji chromosomal DNA was prepared with the DNeasy Blood & Tissue Kit (Qiagen, 69504 and 69506), and 1 µg of sonicated DNA was sequenced using 150-bp paired-end reads on an Illumina HiSeq X10. Sequencing reads were mapped to the hg38 reference genome with BWA (Li and Durbin, 2009), and PCR duplicates were marked with PICARD v2.6.0. Next, we applied GATK (Genome Analysis Toolkit; McKenna et al., 2010) base quality score recalibration, indel realignment, and duplicate removal and performed SNP and INDEL discovery and genotyping using variant quality score recalibration according to GATK Best Practices recommendations to generate haplotype phased Raji reference genome sequences for each allele (DePristo et al., 2011; Van der Auwera et al., 2013). Here, haplotypes 1 and 2 refer to the HLA-DR3 and HLA-DR10 haplotypes within the MHC region. The Raji genome data are available from the National Center for Biotechnology Information Sequence Read Archive under accession PRJNA528941.
ChIP assay
ChIP assays were performed as described previously (Beresford and Boss, 2001). Briefly, cells were cross-linked in 1% formaldehyde for 10 min, and a chromatin lysate was prepared and sonicated to generate fragments averaging 500 bp in length. Antibodies used included anti-H3K27Ac (Millipore Sigma, 07-360), anti-H3K4Me1 (Millipore Sigma, 07-436), anti-H3K4Me3 (Millipore Sigma, 07-473), anti-p300 (Millipore Sigma, 05-257), anti-CIITA (Rockland Immunochemicals, 100-401-249; Beresford and Boss, 2001), or anti-IgG (Millipore Sigma, 12-370). Protein G magnetic beads (Invitrogen, 2019-12-31; 15 µl/sample) were used to isolate the chromatin–antibody complexes. Following washing, the immunoprecipitated chromatin was eluted in elution buffer (50 mM NaHCO3 and 1% SDS) and incubated overnight at 65°C to reverse the formaldehyde-induced cross-links. The DNA was purified and quantitated by real-time PCR using a 5-point genomic DNA standard curve on a CFX96 Real-Time System, C1000 Thermal Cycler (Bio-Rad). PCR reactions contained 5% DMSO, 1× SYBR Green (Cambrex, 50513), 0.04% gelatin, 0.3% Tween-20, 50 mM KCl, 20 mM Tris, pH 8.3, 3 mM MgCl2, 0.2 mM dNTP, and 100 nM of each primer. Sequences for all primers used in the ChIP real-time PCR assays are listed in Table S1.
Quantitative 3C assay
A modified 3C assay protocol was performed in this experiment as described previously (Majumder et al., 2008; Tolhuis et al., 2002). 107 cells were washed in cold 1× PBS buffer. Formaldehyde was added to cells to a final concentration of 1% and incubated for 10 min at room temperature. Glycine (final concentration, 125 mM) was added to stop the cross-linking reaction. Nuclei were collected from the cross-linked cells, the DNA was digested overnight at 37°C with EcoRI, and restriction enzymes were heat inactivated. Samples were diluted 1:40 into ligation buffer and ligated overnight with T4 DNA ligase (20,000 NEB units) at 16°C. Proteinase K (final concentration to 200 µg/ml) was added to the ligation reactions and incubated overnight at 65°C to reverse the cross-links and digest the proteins. The DNA was purified by phenol/chloroform extraction and ethanol precipitation. Quantitation of the 3C products was performed by real-time PCR using a 5-point standard curve as described previously (Majumder et al., 2008). Standard curve templates for the 3C products were generated in vitro by restriction enzyme cleaving and ligation of a BAC construct containing the region being studied (Majumder and Boss, 2010; Majumder et al., 2008). All primer combinations (Table S1) were tested before use in the 3C assay to determine whether they could efficiently amplify a single-product BAC DNA standard template with >90% efficiency. Negative control restriction fragments were chosen to be more than two restriction sites away from the test sequence and contained within a fragment that was <10 kb in length, as we have empirically found that very large fragments function poorly in these assays. Data were normalized as cross-linked frequency compared with the BAC.
Bioinformatic analysis
Scripts generating the genome plots across the DR/DQ locus are available at https://github.com/cdschar using previously published datasets as indicated. The genome was divided into 500-bp or 1-kb bins, the overlap of bins with GWAS disease-associated SNPs (Buniello et al., 2019) and common SNPs from dbSNP151 (Sherry et al., 2001) was calculated using BEDTools (Quinlan and Hall, 2010), and GWAS SNP density was normalized to the total SNPs in each bin. Fold differences in histone H3 acetylation were calculated by averaging the ChIP-qPCR percentage of input values (sites 3, 4, and 5 for the DR/DQ-SE; sites 7, 8, and 9 for the XL9-SE) and dividing by the ChIP value of site 2, which represents an irrelevant site with no substantial histone acetylation.
Online supplemental material
Fig. S1 compares the H3K27ac and H3K4me1 ChIP enrichment between Raji and RJ2.2.5 cells for two non–MHC-II expressed genes, β-actin and HLA-B. Fig. S2 shows the validation and genomic analyses of the CRISPR/Cas cell lines constructed and used in the article. Fig. S3 shows flow cytometry for HLA-DR and -DQ for all mutants constructed and is associated with Fig. 2. Fig. S4 shows the effects of SE deletion for 14 additional genes by qPCR. Fig. S5 shows all 3C data for both haplotypes collected for Fig. 5, including the panels presented in Fig. 5. Table S1 lists all primer sets used the paper.
Supplementary Material
Acknowledgments
We thank members of the Boss laboratory for comments and suggestions about the work and Dr. B. Barwick for informatics and statistics advice.
This work was supported in part by National Institutes of Health grants GM47310 and NS092122 to J.M. Boss.
The authors declare no competing financial interests.
Author contributions: P. Majumder designed and performed experiments associated with all of the figures, participated in data interpretation, and wrote the manuscript. J.T. Lee created and characterized the mutant cell lines and edited the manuscript. A.R. Rahmberg developed and performed the mixed lymphocyte reaction experiments and participated in writing the manuscript. G. Kumar assembled the Raji genome used in the manuscript. T. Mi performed bioinformatics. C.D. Scharer performed bioinformatics, participated in data interpretation, and edited the manuscript. J.M. Boss participated in the conception and design of the project, interpretation of the data, and wrote and edited the manuscript.
References
- Accolla R.S. 1983. Human B cell variants immunoselected against a single Ia antigen subset have lost expression of several Ia antigen subsets. J. Exp. Med. 157:1053–1058. 10.1084/jem.157.3.1053 [DOI] [PMC free article] [PubMed] [Google Scholar]
- Beresford G.W., and Boss J.M.. 2001. CIITA coordinates multiple histone acetylation modifications at the HLA-DRA promoter. Nat. Immunol. 2:652–657. 10.1038/89810 [DOI] [PubMed] [Google Scholar]
- Bogner U., Badenhoop K., Peters H., Schmieg D., Mayr W.R., Usadel K.H., and Schleusener H.. 1992. HLA-DR/DQ gene variation in nongoitrous autoimmune thyroiditis at the serological and molecular level. Autoimmunity. 14:155–158. 10.3109/08916939209083135 [DOI] [PubMed] [Google Scholar]
- Boss J.M. 1997. Regulation of transcription of MHC class II genes. Curr. Opin. Immunol. 9:107–113. 10.1016/S0952-7915(97)80166-5 [DOI] [PubMed] [Google Scholar]
- Boss J.M., and Jensen P.E.. 2003. Transcriptional regulation of the MHC class II antigen presentation pathway. Curr. Opin. Immunol. 15:105–111. 10.1016/S0952-7915(02)00015-8 [DOI] [PubMed] [Google Scholar]
- Buniello A., MacArthur J.A.L., Cerezo M., Harris L.W., Hayhurst J., Malangone C., McMahon A., Morales J., Mountjoy E., Sollis E., et al. . 2019. The NHGRI-EBI GWAS Catalog of published genome-wide association studies, targeted arrays and summary statistics 2019. Nucleic Acids Res. 47(D1):D1005–D1012. 10.1093/nar/gky1120 [DOI] [PMC free article] [PubMed] [Google Scholar]
- Burgess-Beusse B., Farrell C., Gaszner M., Litt M., Mutskov V., Recillas-Targa F., Simpson M., West A., and Felsenfeld G.. 2002. The insulation of genes from external enhancers and silencing chromatin. Proc. Natl. Acad. Sci. USA. 99(Suppl 4):16433–16437. 10.1073/pnas.162342499 [DOI] [PMC free article] [PubMed] [Google Scholar]
- Bushey A.M., Dorman E.R., and Corces V.G.. 2008. Chromatin insulators: regulatory mechanisms and epigenetic inheritance. Mol. Cell. 32:1–9. 10.1016/j.molcel.2008.08.017 [DOI] [PMC free article] [PubMed] [Google Scholar]
- Cavalli G., Hayashi M., Jin Y., Yorgov D., Santorico S.A., Holcomb C., Rastrou M., Erlich H., Tengesdal I.W., Dagna L., et al. . 2016. MHC class II super-enhancer increases surface expression of HLA-DR and HLA-DQ and affects cytokine production in autoimmune vitiligo. Proc. Natl. Acad. Sci. USA. 113:1363–1368. 10.1073/pnas.1523482113 [DOI] [PMC free article] [PubMed] [Google Scholar]
- Chang C.H., Fodor W.L., and Flavell R.A.. 1992. Reactivation of a major histocompatibility complex class II gene in mouse plasmacytoma cells and mouse T cells. J. Exp. Med. 176:1465–1469. 10.1084/jem.176.5.1465 [DOI] [PMC free article] [PubMed] [Google Scholar]
- Chang C.H., Fontes J.D., Peterlin M., and Flavell R.A.. 1994. Class II transactivator (CIITA) is sufficient for the inducible expression of major histocompatibility complex class II genes. J. Exp. Med. 180:1367–1374. 10.1084/jem.180.4.1367 [DOI] [PMC free article] [PubMed] [Google Scholar]
- Chen F., Pruett-Miller S.M., Huang Y., Gjoka M., Duda K., Taunton J., Collingwood T.N., Frodin M., and Davis G.D.. 2011. High-frequency genome editing using ssDNA oligonucleotides with zinc-finger nucleases. Nat. Methods. 8:753–755. 10.1038/nmeth.1653 [DOI] [PMC free article] [PubMed] [Google Scholar]
- Choi N.M., and Boss J.M.. 2012. Multiple histone methyl and acetyltransferase complex components bind the HLA-DRA gene. PLoS One. 7:e37554 10.1371/journal.pone.0037554 [DOI] [PMC free article] [PubMed] [Google Scholar]
- Choi N.M., Majumder P., and Boss J.M.. 2011. Regulation of major histocompatibility complex class II genes. Curr. Opin. Immunol. 23:81–87. 10.1016/j.coi.2010.09.007 [DOI] [PMC free article] [PubMed] [Google Scholar]
- Collins T., Korman A.J., Wake C.T., Boss J.M., Kappes D.J., Fiers W., Ault K.A., Gimbrone M.A. Jr., Strominger J.L., and Pober J.S.. 1984. Immune interferon activates multiple class II major histocompatibility complex genes and the associated invariant chain gene in human endothelial cells and dermal fibroblasts. Proc. Natl. Acad. Sci. USA. 81:4917–4921. 10.1073/pnas.81.15.4917 [DOI] [PMC free article] [PubMed] [Google Scholar]
- Cong L., Ran F.A., Cox D., Lin S., Barretto R., Habib N., Hsu P.D., Wu X., Jiang W., Marraffini L.A., and Zhang F.. 2013. Multiplex genome engineering using CRISPR/Cas systems. Science. 339:819–823. 10.1126/science.1231143 [DOI] [PMC free article] [PubMed] [Google Scholar]
- Corces M.R., and Corces V.G.. 2016. The three-dimensional cancer genome. Curr. Opin. Genet. Dev. 36:1–7. 10.1016/j.gde.2016.01.002 [DOI] [PMC free article] [PubMed] [Google Scholar]
- DePristo M.A., Banks E., Poplin R., Garimella K.V., Maguire J.R., Hartl C., Philippakis A.A., del Angel G., Rivas M.A., Hanna M., et al. . 2011. A framework for variation discovery and genotyping using next-generation DNA sequencing data. Nat. Genet. 43:491–498. 10.1038/ng.806 [DOI] [PMC free article] [PubMed] [Google Scholar]
- ENCODE Project Consortium 2012. An integrated encyclopedia of DNA elements in the human genome. Nature. 489:57–74. 10.1038/nature11247 [DOI] [PMC free article] [PubMed] [Google Scholar]
- Epstein M.A., Achong B.G., Barr Y.M., Zajac B., Henle G., and Henle W.. 1966. Morphological and virological investigations on cultured Burkitt tumor lymphoblasts (strain Raji). J. Natl. Cancer Inst. 37:547–559. [PubMed] [Google Scholar]
- Ernst J., Kheradpour P., Mikkelsen T.S., Shoresh N., Ward L.D., Epstein C.B., Zhang X., Wang L., Issner R., Coyne M., et al. . 2011. Mapping and analysis of chromatin state dynamics in nine human cell types. Nature. 473:43–49. 10.1038/nature09906 [DOI] [PMC free article] [PubMed] [Google Scholar]
- Felsenfeld G., Burgess-Beusse B., Farrell C., Gaszner M., Ghirlando R., Huang S., Jin C., Litt M., Magdinier F., Mutskov V., et al. . 2004. Chromatin boundaries and chromatin domains. Cold Spring Harb. Symp. Quant. Biol. 69:245–250. 10.1101/sqb.2004.69.245 [DOI] [PubMed] [Google Scholar]
- Germain R.N., and Margulies D.H.. 1993. The biochemistry and cell biology of antigen processing and presentation. Annu. Rev. Immunol. 11:403–450. 10.1146/annurev.iy.11.040193.002155 [DOI] [PubMed] [Google Scholar]
- Gomez J.A., Majumder P., Nagarajan U.M., and Boss J.M.. 2005. X box-like sequences in the MHC class II region maintain regulatory function. J. Immunol. 175:1030–1040. 10.4049/jimmunol.175.2.1030 [DOI] [PubMed] [Google Scholar]
- Hnisz D., Abraham B.J., Lee T.I., Lau A., Saint-André V., Sigova A.A., Hoke H.A., and Young R.A.. 2013. Super-enhancers in the control of cell identity and disease. Cell. 155:934–947. 10.1016/j.cell.2013.09.053 [DOI] [PMC free article] [PubMed] [Google Scholar]
- Hnisz D., Schuijers J., Lin C.Y., Weintraub A.S., Abraham B.J., Lee T.I., Bradner J.E., and Young R.A.. 2015. Convergence of developmental and oncogenic signaling pathways at transcriptional super-enhancers. Mol. Cell. 58:362–370. 10.1016/j.molcel.2015.02.014 [DOI] [PMC free article] [PubMed] [Google Scholar]
- Kannarkat G.T., Cook D.A., Lee J.K., Chang J., Chung J., Sandy E., Paul K.C., Ritz B., Bronstein J., Factor S.A., et al. . 2015. Common Genetic Variant Association with Altered HLA Expression, Synergy with Pyrethroid Exposure, and Risk for Parkinson’s Disease: An Observational and Case-Control Study. NPJ Parkinsons Dis. 1:15002 10.1038/npjparkd.2015.2 [DOI] [PMC free article] [PubMed] [Google Scholar]
- Kretsovali A., Spilianakis C., Dimakopoulos A., Makatounakis T., and Papamatheakis J.. 2001. Self-association of class II transactivator correlates with its intracellular localization and transactivation. J. Biol. Chem. 276:32191–32197. 10.1074/jbc.M103164200 [DOI] [PubMed] [Google Scholar]
- Labrador M., and Corces V.G.. 2002. Setting the boundaries of chromatin domains and nuclear organization. Cell. 111:151–154. 10.1016/S0092-8674(02)01004-8 [DOI] [PubMed] [Google Scholar]
- LeibundGut-Landmann S., Waldburger J.M., Krawczyk M., Otten L.A., Suter T., Fontana A., Acha-Orbea H., and Reith W.. 2004. Mini-review: Specificity and expression of CIITA, the master regulator of MHC class II genes. Eur. J. Immunol. 34:1513–1525. 10.1002/eji.200424964 [DOI] [PubMed] [Google Scholar]
- Li H., and Durbin R.. 2009. Fast and accurate short read alignment with Burrows-Wheeler transform. Bioinformatics. 25:1754–1760. 10.1093/bioinformatics/btp324 [DOI] [PMC free article] [PubMed] [Google Scholar]
- Linhoff M.W., Harton J.A., Cressman D.E., Martin B.K., and Ting J.P.. 2001. Two distinct domains within CIITA mediate self-association: involvement of the GTP-binding and leucine-rich repeat domains. Mol. Cell. Biol. 21:3001–3011. 10.1128/MCB.21.9.3001-3011.2001 [DOI] [PMC free article] [PubMed] [Google Scholar]
- Lowe W.L. Jr., and Reddy T.E.. 2015. Genomic approaches for understanding the genetics of complex disease. Genome Res. 25:1432–1441. 10.1101/gr.190603.115 [DOI] [PMC free article] [PubMed] [Google Scholar]
- Majumder P., and Boss J.M.. 2010. CTCF controls expression and chromatin architecture of the human major histocompatibility complex class II locus. Mol. Cell. Biol. 30:4211–4223. 10.1128/MCB.00327-10 [DOI] [PMC free article] [PubMed] [Google Scholar]
- Majumder P., and Boss J.M.. 2011. Cohesin regulates MHC class II genes through interactions with MHC class II insulators. J. Immunol. 187:4236–4244. 10.4049/jimmunol.1100688 [DOI] [PMC free article] [PubMed] [Google Scholar]
- Majumder P., Gomez J.A., and Boss J.M.. 2006. The human major histocompatibility complex class II HLA-DRB1 and HLA-DQA1 genes are separated by a CTCF-binding enhancer-blocking element. J. Biol. Chem. 281:18435–18443. 10.1074/jbc.M601298200 [DOI] [PubMed] [Google Scholar]
- Majumder P., Gomez J.A., Chadwick B.P., and Boss J.M.. 2008. The insulator factor CTCF controls MHC class II gene expression and is required for the formation of long-distance chromatin interactions. J. Exp. Med. 205:785–798. 10.1084/jem.20071843 [DOI] [PMC free article] [PubMed] [Google Scholar]
- Majumder P., Scharer C.D., Choi N.M., and Boss J.M.. 2014. B cell differentiation is associated with reprogramming the CCCTC binding factor-dependent chromatin architecture of the murine MHC class II locus. J. Immunol. 192:3925–3935. 10.4049/jimmunol.1303205 [DOI] [PMC free article] [PubMed] [Google Scholar]
- Mali P., Yang L., Esvelt K.M., Aach J., Guell M., DiCarlo J.E., Norville J.E., and Church G.M.. 2013. RNA-guided human genome engineering via Cas9. Science. 339:823–826. 10.1126/science.1232033 [DOI] [PMC free article] [PubMed] [Google Scholar]
- Matzaraki V., Kumar V., Wijmenga C., and Zhernakova A.. 2017. The MHC locus and genetic susceptibility to autoimmune and infectious diseases. Genome Biol. 18:76 10.1186/s13059-017-1207-1 [DOI] [PMC free article] [PubMed] [Google Scholar]
- McKenna A., Hanna M., Banks E., Sivachenko A., Cibulskis K., Kernytsky A., Garimella K., Altshuler D., Gabriel S., Daly M., and DePristo M.A.. 2010. The Genome Analysis Toolkit: a MapReduce framework for analyzing next-generation DNA sequencing data. Genome Res. 20:1297–1303. 10.1101/gr.107524.110 [DOI] [PMC free article] [PubMed] [Google Scholar]
- The MHC Sequencing Consortium 1999. Complete sequence and gene map of a human major histocompatibility complex. The MHC sequencing consortium. Nature. 401:921–923. 10.1038/44853 [DOI] [PubMed] [Google Scholar]
- Oomen M.E., Hansen A.S., Liu Y., Darzacq X., and Dekker J.. 2019. CTCF sites display cell cycle-dependent dynamics in factor binding and nucleosome positioning. Genome Res. 29:236–249. 10.1101/gr.241547.118 [DOI] [PMC free article] [PubMed] [Google Scholar]
- Parker S.C., Stitzel M.L., Taylor D.L., Orozco J.M., Erdos M.R., Akiyama J.A., van Bueren K.L., Chines P.S., Narisu N., Black B.L., et al. NISC Comparative Sequencing Program Authors . 2013. Chromatin stretch enhancer states drive cell-specific gene regulation and harbor human disease risk variants. Proc. Natl. Acad. Sci. USA. 110:17921–17926. 10.1073/pnas.1317023110 [DOI] [PMC free article] [PubMed] [Google Scholar]
- Pelikan R.C., Kelly J.A., Fu Y., Lareau C.A., Tessneer K.L., Wiley G.B., Wiley M.M., Glenn S.B., Harley J.B., Guthridge J.M., et al. . 2018. Enhancer histone-QTLs are enriched on autoimmune risk haplotypes and influence gene expression within chromatin networks. Nat. Commun. 9:2905 10.1038/s41467-018-05328-9 [DOI] [PMC free article] [PubMed] [Google Scholar]
- Price A.L., Spencer C.C., and Donnelly P.. 2015. Progress and promise in understanding the genetic basis of common diseases. Proc. Biol. Sci. 282:20151684 10.1098/rspb.2015.1684 [DOI] [PMC free article] [PubMed] [Google Scholar]
- Quinlan A.R., and Hall I.M.. 2010. BEDTools: a flexible suite of utilities for comparing genomic features. Bioinformatics. 26:841–842. 10.1093/bioinformatics/btq033 [DOI] [PMC free article] [PubMed] [Google Scholar]
- Raj P., Rai E., Song R., Khan S., Wakeland B.E., Viswanathan K., Arana C., Liang C., Zhang B., Dozmorov I., et al. . 2016. Regulatory polymorphisms modulate the expression of HLA class II molecules and promote autoimmunity. eLife. 5:e12089 10.7554/eLife.12089 [DOI] [PMC free article] [PubMed] [Google Scholar]
- Ran F.A., Hsu P.D., Wright J., Agarwala V., Scott D.A., and Zhang F.. 2013. Genome engineering using the CRISPR-Cas9 system. Nat. Protoc. 8:2281–2308. 10.1038/nprot.2013.143 [DOI] [PMC free article] [PubMed] [Google Scholar]
- Rasmussen H.B., Kelly M.A., and Clausen J.. 2001. Genetic susceptibility to multiple sclerosis: detection of polymorphic nucleotides and an intron in the 3′ untranslated region of the major histocompatibility complex class II transactivator gene. Hum. Immunol. 62:371–377. 10.1016/S0198-8859(01)00215-4 [DOI] [PubMed] [Google Scholar]
- Reith W., and Mach B.. 2001. The bare lymphocyte syndrome and the regulation of MHC expression. Annu. Rev. Immunol. 19:331–373. 10.1146/annurev.immunol.19.1.331 [DOI] [PubMed] [Google Scholar]
- Ren G., Jin W., Cui K., Rodrigez J., Hu G., Zhang Z., Larson D.R., and Zhao K.. 2017. CTCF-Mediated Enhancer-Promoter Interaction Is a Critical Regulator of Cell-to-Cell Variation of Gene Expression. Mol. Cell. 67:1049–1058.e6. 10.1016/j.molcel.2017.08.026 [DOI] [PMC free article] [PubMed] [Google Scholar]
- Riley J.L., Westerheide S.D., Price J.A., Brown J.A., and Boss J.M.. 1995. Activation of class II MHC genes requires both the X box region and the class II transactivator (CIITA). Immunity. 2:533–543. 10.1016/1074-7613(95)90033-0 [DOI] [PubMed] [Google Scholar]
- Rowley M.J., and Corces V.G.. 2016. The three-dimensional genome: principles and roles of long-distance interactions. Curr. Opin. Cell Biol. 40:8–14. 10.1016/j.ceb.2016.01.009 [DOI] [PMC free article] [PubMed] [Google Scholar]
- Rowley M.J., and Corces V.G.. 2018. Organizational principles of 3D genome architecture. Nat. Rev. Genet. 19:789–800. 10.1038/s41576-018-0060-8 [DOI] [PMC free article] [PubMed] [Google Scholar]
- Scharer C.D., Choi N.M., Barwick B.G., Majumder P., Lohsen S., and Boss J.M.. 2015. Genome-wide CIITA-binding profile identifies sequence preferences that dictate function versus recruitment. Nucleic Acids Res. 43:3128–3142. 10.1093/nar/gkv182 [DOI] [PMC free article] [PubMed] [Google Scholar]
- Sherry S.T., Ward M.H., Kholodov M., Baker J., Phan L., Smigielski E.M., and Sirotkin K.. 2001. dbSNP: the NCBI database of genetic variation. Nucleic Acids Res. 29:308–311. 10.1093/nar/29.1.308 [DOI] [PMC free article] [PubMed] [Google Scholar]
- Sisk T.J., Roys S., and Chang C.H.. 2001. Self-association of CIITA and its transactivation potential. Mol. Cell. Biol. 21:4919–4928. 10.1128/MCB.21.15.4919-4928.2001 [DOI] [PMC free article] [PubMed] [Google Scholar]
- Sloan J.H., and Boss J.M.. 1988. Conserved upstream sequences of human class II major histocompatibility genes enhance expression of class II genes in wild-type but not mutant B-cell lines. Proc. Natl. Acad. Sci. USA. 85:8186–8190. 10.1073/pnas.85.21.8186 [DOI] [PMC free article] [PubMed] [Google Scholar]
- Sloan V.S., Cameron P., Porter G., Gammon M., Amaya M., Mellins E., and Zaller D.M.. 1995. Mediation by HLA-DM of dissociation of peptides from HLA-DR. Nature. 375:802–806. 10.1038/375802a0 [DOI] [PubMed] [Google Scholar]
- Steimle V., Otten L.A., Zufferey M., and Mach B.. 1993. Complementation cloning of an MHC class II transactivator mutated in hereditary MHC class II deficiency (or bare lymphocyte syndrome). Cell. 75:135–146. 10.1016/S0092-8674(05)80090-X [DOI] [PubMed] [Google Scholar]
- Ting J.P., and Trowsdale J.. 2002. Genetic control of MHC class II expression. Cell. 109(2, Suppl):S21–S33. 10.1016/S0092-8674(02)00696-7 [DOI] [PubMed] [Google Scholar]
- Tolhuis B., Palstra R.J., Splinter E., Grosveld F., and de Laat W.. 2002. Looping and interaction between hypersensitive sites in the active beta-globin locus. Mol. Cell. 10:1453–1465. 10.1016/S1097-2765(02)00781-5 [DOI] [PubMed] [Google Scholar]
- Tosi G., Jabrane-Ferrat N., and Peterlin B.M.. 2002. Phosphorylation of CIITA directs its oligomerization, accumulation and increased activity on MHCII promoters. EMBO J. 21:5467–5476. 10.1093/emboj/cdf557 [DOI] [PMC free article] [PubMed] [Google Scholar]
- Van der Auwera G.A., Carneiro M.O., Hartl C., Poplin R., Del Angel G., Levy-Moonshine A., Jordan T., Shakir K., Roazen D., Thibault J., et al. . 2013. From FastQ data to high confidence variant calls: the Genome Analysis Toolkit best practices pipeline. Curr. Protoc. Bioinformatics. 43:1–33. 10.1002/0471250953.bi1110s43 [DOI] [PMC free article] [PubMed] [Google Scholar]
- Vilen B.J., Cogswell J.P., and Ting J.P.Y.. 1991. Stereospecific alignment of the X and Y elements is required for major histocompatibility complex class II DRA promoter function. Mol. Cell. Biol. 11:2406–2415. 10.1128/MCB.11.5.2406 [DOI] [PMC free article] [PubMed] [Google Scholar]
- Weber D.A., Evavold B.D., and Jensen P.E.. 1996. Enhanced dissociation of HLA-DR-bound peptides in the presence of HLA-DM. Science. 274:618–620. 10.1126/science.274.5287.618 [DOI] [PubMed] [Google Scholar]
- West A.G., Huang S., Gaszner M., Litt M.D., and Felsenfeld G.. 2004. Recruitment of histone modifications by USF proteins at a vertebrate barrier element. Mol. Cell. 16:453–463. 10.1016/j.molcel.2004.10.005 [DOI] [PubMed] [Google Scholar]
- Whyte W.A., Orlando D.A., Hnisz D., Abraham B.J., Lin C.Y., Kagey M.H., Rahl P.B., Lee T.I., and Young R.A.. 2013. Master transcription factors and mediator establish super-enhancers at key cell identity genes. Cell. 153:307–319. 10.1016/j.cell.2013.03.035 [DOI] [PMC free article] [PubMed] [Google Scholar]
- Wright K.L., and Ting J.P.. 2006. Epigenetic regulation of MHC-II and CIITA genes. Trends Immunol. 27:405–412. 10.1016/j.it.2006.07.007 [DOI] [PubMed] [Google Scholar]
- Yoon H.S., Scharer C.D., Majumder P., Davis C.W., Butler R., Zinzow-Kramer W., Skountzou I., Koutsonanos D.G., Ahmed R., and Boss J.M.. 2012. ZBTB32 is an early repressor of the CIITA and MHC class II gene expression during B cell differentiation to plasma cells. J. Immunol. 189:2393–2403. 10.4049/jimmunol.1103371 [DOI] [PMC free article] [PubMed] [Google Scholar]
Associated Data
This section collects any data citations, data availability statements, or supplementary materials included in this article.


