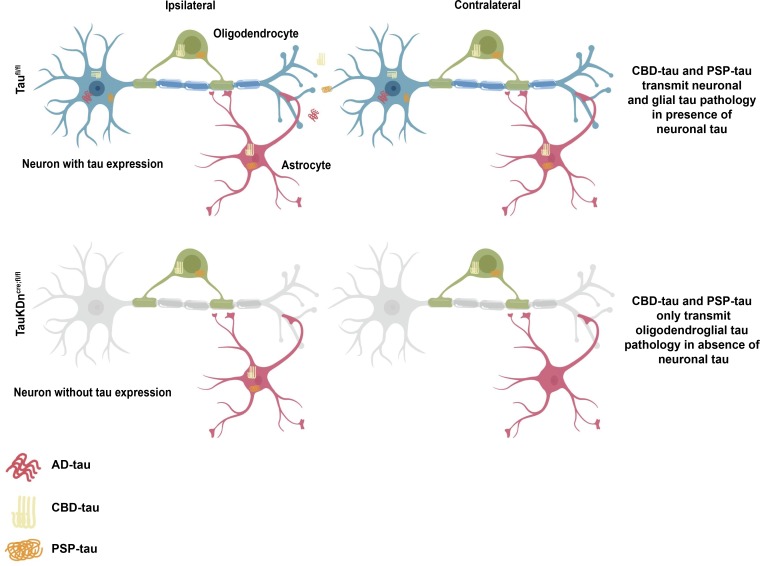
The pathogenesis of glial tau pathology is unknown. This study shows glial tau pathology can propagate in the absence of neuronal tau. In particular, oligodendrocytes transmit tau pathology via their own processes, independent of neuronal tau.
Abstract
Tauopathies are characterized by abnormal accumulation of tau protein in neurons and glia. In Alzheimer’s disease (AD), tau aggregates in neurons, while in corticobasal degeneration (CBD) and progressive supranuclear palsy (PSP), tau also aggregates in astrocytes and oligodendrocytes. We previously demonstrated that human CBD and PSP tauopathy lysates (CBD-tau and PSP-tau) contain distinct tau strains that propagate neuronal and glial tau aggregates in nontransgenic (nonTg) mouse brain. Yet the mechanism of glial tau transmission is unknown. Here, we developed a novel mouse model to knock down tau in neurons to test for glial tau transmission. While oligodendroglial tau pathology propagated across the mouse brain in the absence of neuronal tau pathology, astrocytic tau pathology did not. Oligodendroglial tau aggregates propagated along white matter tracts independently of neuronal axons, and resulted in oligodendrocyte cell loss. Thus, glial tau pathology has significant functional consequences independent of neuronal tau pathology.
Graphical Abstract
Introduction
Alzheimer’s disease (AD) and other neurodegenerative tauopathies are characterized by the abnormal aggregation of tau protein (Lee et al., 2001). Tau is a soluble protein found primarily in neuronal axons, where it stabilizes microtubules; in disease, tau becomes hyperphosphorylated and forms insoluble aggregates. Tau aggregate burden correlates with neuron death and cognitive decline, contributing to human disease progression (Arriagada et al., 1992; Giannakopoulos et al., 2003; Xia et al., 2017).
Tauopathies display both clinical and neuropathological heterogeneity (Lee et al., 2001). AD, corticobasal degeneration (CBD), and progressive supranuclear palsy (PSP) patients present with different clinical symptoms, and correspondingly, tau aggregates form in different brain regions. Interestingly, tau aggregates in different cell types in each disease: primarily in neurons in AD, but also in astrocytes and oligodendrocytes in CBD and PSP. The morphologies of glial tau aggregates vary from astrocytic plaques in CBD to tufted astrocytes in PSP, and oligodendroglial coiled bodies in both (Lee et al., 2001).
The mechanism underlying the formation of glial tau pathology is poorly understood. While tau expression in glial cells has been controversial, newer literature suggests there is some endogenous glial tau expression, including MAPT mRNA expression in vivo (LoPresti, 2002; Seiberlich et al., 2015; Zhang et al., 2014). Yet, tau expression is much higher in neurons than glial cells (Zhang et al., 2014). Studies in human tauopathy brains have shown glial cell death is an early feature of disease and correlates with neurodegeneration (Broe et al., 2004; Kobayashi et al., 2004; Su, et al., 2000). Tau overexpression in glial cells in mouse models also causes glial cell death (Forman et al., 2005; Higuchi et al., 2005; Yoshiyama et al., 2003), although tau overexpression does not occur in human disease.
Many studies have shown that pathological tau aggregates can propagate from cell to cell through transmission of proteopathic tau seeds (Gibbons et al., 2019). Under this framework, our laboratory and others showed that different structural conformations of misfolded tau (tau strains) form in human tauopathy brains and underlie the heterogeneity of tauopathies (Clavaguera et al., 2013; Kaufman et al., 2016; Narasimhan et al., 2017; Sanders et al., 2014). Furthermore, we demonstrated tau strains extracted from human brains (AD-tau, CBD-tau, and PSP-tau) mimicked the heterogeneity of human tauopathies in nontransgenic (nonTg) mouse brains, without human tau overexpression (Narasimhan et al., 2017).
In particular, CBD-tau and PSP-tau had strain-specific seeding of glial tau pathology, propagating tau aggregates in astrocytes and oligodendrocytes (Narasimhan et al., 2017). However, it was still unclear whether the formation of glial tau pathology depended on neuronal tau, a long-standing question in the field. We hypothesized that glial tau aggregates cannot form in the absence of neuronal tau. To test this hypothesis, we tested human tau strains in glial cell cultures, and in a novel neuronal tau knockdown mouse model (TauKDncre;fl/fl).
Results and discussion
Characterization of tau expression in glial cultures
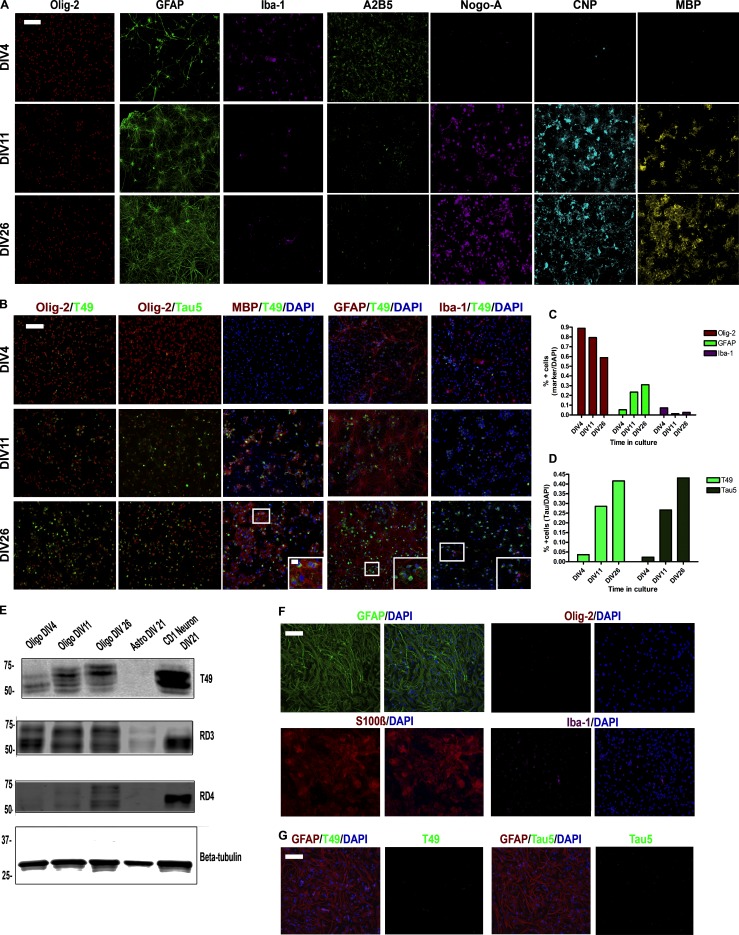
Rat oligodendrocyte precursor cells (OPCs) cultured at 4 d in vitro (DIV4) contained ∼90% oligodendrocytes, which decreased to ∼65% at DIV26 after differentiation, with increasing astrocytes and rare microglia (Fig. S1, A–C). At DIV4, the OPCs expressed Olig-2 and A2B5, with decreasing A2B5 expression after differentiation and increasing expression of Nogo-A, 2′,3′-cyclic nucleotide 3′-phosphodiesterase (CNP), and myelin basic protein (MBP; Fig. S1 A).
Figure S1.
Characterization of glial cell cultures in vitro. (A) ICC for oligodendrocytes (Olig-2, A2B5, Nogo-A, CNP, and MBP), astrocytes (GFAP), and microglia (Iba-1) in oligodendrocytes cultured from DIV4 to DIV26. Two independent experiments. Scale bar, 100 µm. (B) Double-labeling ICC for Olig-2, MBP, GFAP, or Iba-1 and tau (Tau5 or T49) in oligodendrocyte cultures. Two independent experiments. Scale bars, 100 µm; inset, 10 µm. (C) Quantification of oligodendrocytes, astrocytes, and microglia in oligodendrocyte culture over time. (D) IF quantification for T49 and Tau5 in oligodendrocyte cultures. (E) Western blot of T49, RD3 (3R tau), and RD4 (4R tau) for oligodendrocytes, astrocytes, and neurons in culture. β-tubulin is loading control. Three independent experiments. (F) ICC for GFAP, S100β, Olig-2, and Iba-1 in astrocyte cultures. Two independent experiments. Scale bar, 100 µm. (G) ICC for GFAP, T49, or Tau5 and DAPI in astrocyte cultures. Two independent experiments. Scale bar, 100 µm.
Tau expression increased in the oligodendrocytes after differentiation at DIV11, as previously described (Fig. S1, B and D; LoPresti, 2002; Seiberlich et al., 2015). By Western blot, oligodendrocytes expressed tau protein, but less than neurons. Oligodendrocytes initially express 3R tau, but over time express more 4R tau (Fig. S1 E). Furthermore, tau expression increased as myelination increased, colocalizing with MBP (Fig. S1 B). Tau was not expressed in astrocytes or microglia (no colocalization with glial fibrillary acidic protein [GFAP] or Iba-1, respectively; Fig. S1 B). Mouse astrocytes cultured separately primarily expressed GFAP and S100β, with very few Olig-2+ or Iba-1+ cells (Fig. S1 F). In contrast to oligodendrocytes, cultured astrocytes did not have detectable levels of tau protein (Fig. S1, E–G).
Human tau strains seed tau pathology in glial cultures
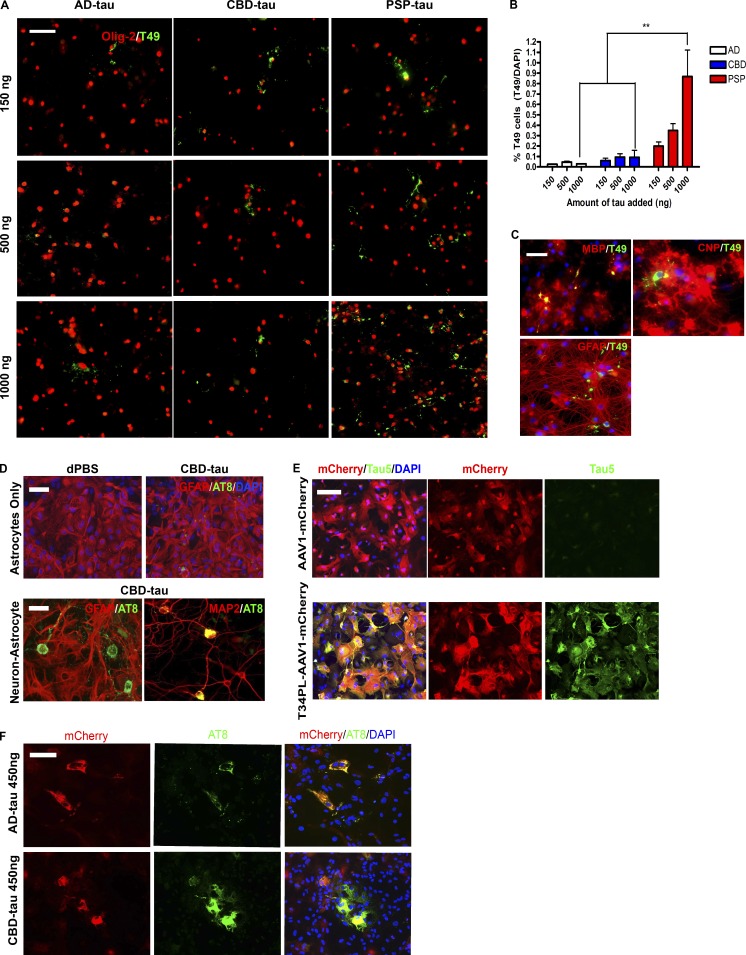
To test if glial cells can develop tau pathology in the absence of neurons, oligodendrocyte cultures were seeded with AD-tau, CBD-tau, and PSP-tau. Notably, insoluble tau aggregates formed in oligodendrocytes after seeding with all three tau strains, with PSP-tau seeding the most aggregates in a dose-dependent manner (Fig. 1, A and B). Yet the highest dose of PSP-tau only seeded tau aggregates in <1% of oligodendrocytes. The tau aggregates were found in myelinating oligodendrocytes, colocalizing with MBP, and partially colocalizing with CNP (Fig. 1 C). Tau aggregates never formed in astrocytes in the oligodendrocyte cultures (no colocalization with GFAP; Fig. 1 C).
Figure 1.
Seeding of cultured oligodendrocytes and astrocytes with tau strains. (A) ICC for Olig-2 (red) and T49 (green) after seeding of oligodendrocyte cultures with AD-tau (n = 3 cases), CBD-tau (n = 3 cases), and PSP-tau (n = 1 case). Four independent experiments. Scale bar, 50 µm. (B) Quantification of T49+ cells from A. Mean ± SEM plotted. Two-way ANOVA with Bonferroni post hoc test. P = 0.0246 (**, P < 0.01). (C) ICC for MBP (red), CNP (red), GFAP (red), and T49 (green) after seeding with PSP-tau (500 ng/coverslip). Two independent experiments. Scale bar, 50 µm. (D) Top: ICC for GFAP (red) and AT8 (green) of astrocyte cultures seeded with CBD-tau (450 ng/coverslip). Bottom: ICC for GFAP (red, astrocyte) and AT8 (green; left) and MAP2 (red, neuron) and AT8 (green; right) of neuron–astrocyte co-cultures seeded with CBD-tau (450 ng/coverslip). Dulbecco's PBS (dPBS) used as control. Two independent experiments. Scale bars, 50 µm. (E) ICC for Tau5 (green) and mCherry (red) post-viral transfection of T34PL-AAV1-mCherry or AAV1-mCherry in astrocyte cultures. Two independent experiments. Scale bar, 50 µm. (F) ICC for AT8 (green) and mCherry (red) in virally transfected astrocytes seeded with AD-tau (n = 3 cases) or CBD-tau (n = 3 cases) at 450 ng/coverslip. Two independent experiments. Scale bar, 50 µm.
CBD-tau did not seed tau aggregates in astrocytes cultured separately (Fig. 1 D). Neuron-astrocyte co-cultures seeded with CBD-tau only developed tau aggregates in neurons, but not astrocytes (Fig. 1 D). To determine if astrocytes in culture are capable of developing tau pathology, astrocytes were infected with a viral vector to overexpress human tau (AAV1-T34PL-mCherry, P301L tau mutation and mCherry tag; Fig. 1 E). The astrocytes developed phosphorylated, insoluble tau aggregates comprised of virally expressed tau (AT8+ and mCherry+) after seeding with AD-tau or CBD-tau (Fig. 1 F). However, there was no strain difference between AD-tau and CBD-tau, likely due to tau overexpression. These data suggest oligodendrocytes can develop tau pathology independent of neurons, while astrocytes only do so with exogenous tau expression.
Characterization of TauKDncre;fl/fl mice
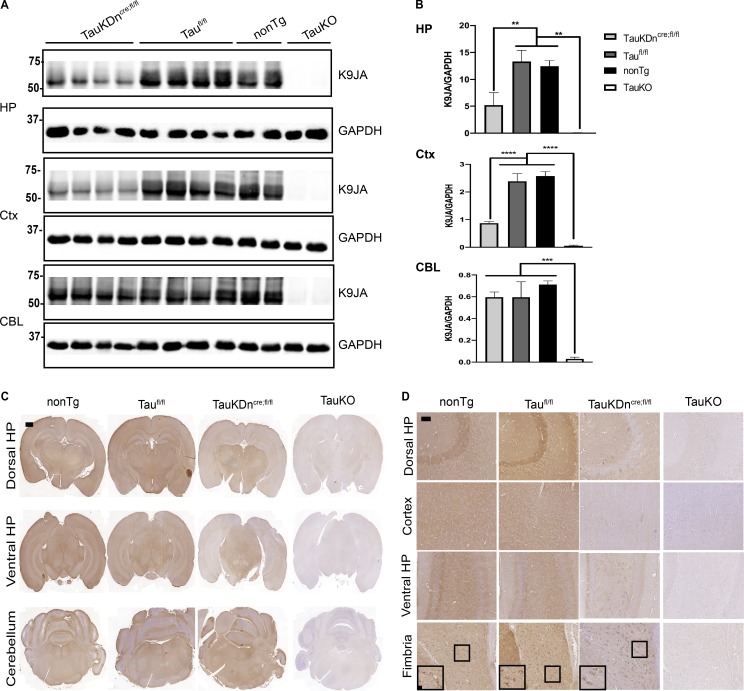
CAMK2a-Cre mice (expressing Cre in forebrain neurons) were crossed with TauFlox mice (Roberson laboratory at University of Alabama at Birmingham, Birmingham, AL) to generate TauKDncre;fl/fl, as well as littermate controls (Taufl/fl). TauKDncre;fl/fl mice had markedly less tau expression by Western blot in the hippocampus and cortex compared with Taufl/fl and nonTg mice (Fig. 2, A and B). There were no changes in tau expression in the cerebellum of TauKDncre;fl/fl mice given forebrain Cre expression, and total tau KO mice (TauKO) had no tau expression in any region. The residual tau expression in TauKDncre;fl/fl mice could be due to incomplete neuronal Cre expression/Cre excision, or remaining glial tau expression.
Figure 2.
Characterization of tau expression in TauKDncre;fl/fl mice. (A) Western blot of K9JA in TauKDncre;fl/fl (n = 4), Taufl/fl (n = 4), nonTg (n = 2), and TauKO mice (n = 2) in the hippocampus (HP), cortex (Ctx), and cerebellum (CBL). GAPDH is loading control. Two independent experiments. (B) Quantification of K9JA and GAPDH signal by Western blot. Mean ± SEM plotted. One-way ANOVA with Bonferroni post hoc test: HP, P = 0.0002, Ctx, P = 0.0001, CBL, P = 0.0016; post hoc: **, P < 0.01, ***, P < 0.001, ****, P << 0.0001. (C) R2295 IHC in nonTg (n = 3), Taufl/fl (n = 3), TauKDncre;fl/fl (n = 3), and whole-body TauKO mice (n = 3). Two independent experiments. Scale bar, 1,000 µm. (D) R2295 IHC in nonTg, Taufl/fl, TauKDncre;fl/fl, and TauKO mice in dorsal and ventral HP, cortex, and fimbria. Scale bars, 50 µm; inset, 10 µm.
To test the above hypotheses, cell type–specific tau expression was analyzed by immunohistochemistry (IHC) using mouse-tau–specific antibody R2295 (Guo et al., 2016). Tau was expressed throughout the brain in nonTg and Taufl/fl mice, with less tau staining in the hippocampus and cortex of TauKDncre;fl/fl mice (Fig. 2 C). Total TauKO mice had no tau staining (Fig. 2 C). Most neurons in the hippocampus and cortex did not express tau in the TauKDncre;fl/fl mice, except ventral hilar neurons (Fig. 2 D). Surprisingly, there was significant tau expression in oligodendrocytes (fimbria) in nonTg, Taufl/fl, and TauKDncre;fl/fl mice, but not in total TauKO mice, confirming oligodendrocytes express tau protein in vivo (Fig. 2 D). There was no astrocytic tau expression by IHC. Thus, remaining tau expression in TauKDncre;fl/fl mice was due to residual tau expression in select neurons, as well as oligodendrocytes.
Initiation of glial tau pathology in TauKDncre;fl/fl mice
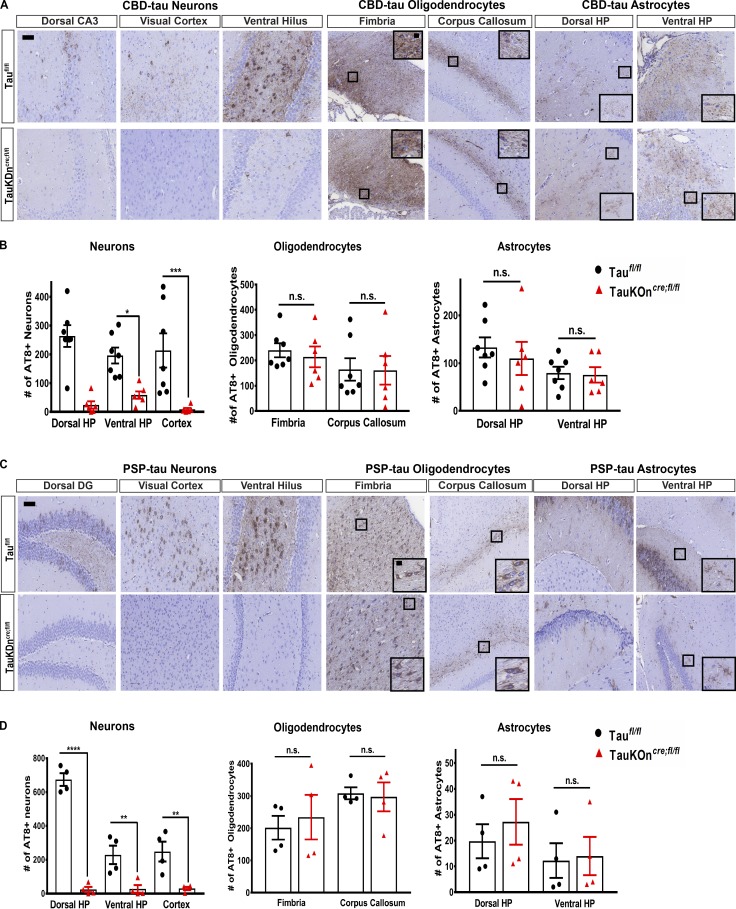
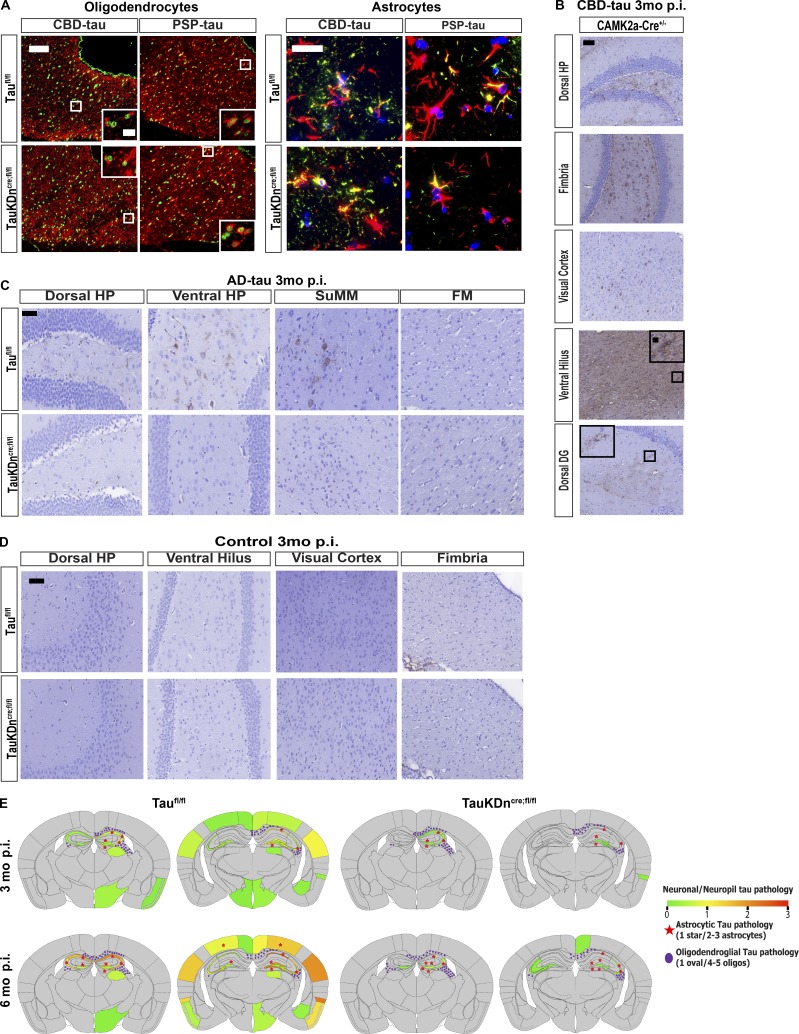
There was markedly less neuronal tau pathology and transmission to distant regions in TauKDncre;fl/fl mice compared with controls at 3 mo post-injection (p.i.) of CBD-tau and PSP-tau (Fig. 3). However, there was no change in glial tau pathology (oligodendrocyte or astrocyte) in the injected TauKDncre;fl/fl mice compared with controls (Fig. 3). Both the TauKDncre;fl/fl mice and controls had astrocytic plaque–like aggregates in the CBD-tau–injected mice, tufted astrocyte-like pathology in the PSP-tau–injected mice, and oligodendroglial coiled body-like inclusions in both (Fig. S2 A). Thus, the knockdown of neuronal tau did not affect the number or morphology of glial tau pathology in TauKDncre;fl/fl mice.
Figure 3.
Seeding of glial tau pathology in TauKDncre;fl/fl mice. (A) AT8 IHC on CBD-tau–injected TauKDncre;fl/fl (n = 6) and Taufl/fl mice (n = 7) 3 mo p.i. Two independent experiments. Scale bars, 50 µm; inset, 10 µm. (B) Quantification of AT8+ neurons, oligodendrocytes, and astrocytes. Mean ± SEM plotted. One-way ANOVA with Bonferroni post hoc test: neurons, P = 0.0001; oligodendrocytes, P = 0.4879; astrocytes, P = 0.2285; post hoc: *, P < 0.05, **, P < 0.01, ***, P < 0.001. (C) AT8 IHC on PSP-tau–injected TauKDncre;fl/fl and Taufl/fl mice (n = 4 each) 3 mo p.i. Two independent experiments. Scale bars, 50 µm; inset, 10 µm. (D) Quantification of AT8+ neurons, oligodendrocytes, and astrocytes. Mean ± SEM plotted. One-way ANOVA with Bonferroni post hoc test: neurons, P = 0.0001; oligodendrocytes, P = 0.343; astrocytes, P = 0.504; post hoc: *, P < 0.05, **, P < 0.01, ***, P < 0.001, ****, P < 0.0001. n.s., not significant.
Figure S2.
Characterization of tau pathology in mice injected with AD-tau, CBD-tau, and PSP-tau. (A) IF double-labeling of Olig-2 (green) and AT8 (red) in the fimbria, and GFAP (red) and AT8 (green) in the dorsal hippocampus in Taufl/fl mice (n = 6 CBD-tau, n = 4 PSP-tau) and TauKDncre;fl/fl mice (n = 7 CBD-tau, n = 4 PSP-tau). Two independent experiments. Scale bars, oligodendrocytes, 50 µm; insets, 25 µm; astrocytes, 25 µm. (B) AT8 IHC in CBD-tau–injected CAMK2a-Cre+ mice (n = 4). Two independent experiments. Scale bar, 50 µm, insets, 10 µm (C) AT8 IHC in AD-tau–injected TauKDncre;fl/fl mice (n = 5) and Taufl/fl mice (n = 4). Two independent experiments. Scale bar, 50 µm. DG, dentate gyrus; FM, fimbria; SuMM, supramammillary nucleus. (D) AT8 IHC in control-brain lysate–injected TauKDncre;fl/fl mice and Taufl/fl mice (n = 4 each). (E) Heatmaps of neuronal tau pathology on a scale of 0 (gray) to 3 (red) of PSP-injected Taufl/fl and TauKDncre;fl/fl mice 3 and 6 mo p.i. Astrocytic tau aggregates in red stars and oligodendroglial tau inclusions in purple ovals.
CBD-tau–injected CAMK2a-Cre+ mice had similar levels of neuronal and glial tau pathology as Taufl/fl mice, showing the pathology in TauKDncre;fl/fl mice was not an artifact of Cre expression (Fig. S2 B). As expected, TauKDncre;fl/fl mice injected with AD-tau developed little to no neuronal tau aggregates and no glial tau pathology, confirming the strain-specific cell type specificity of AD-tau, CBD-tau, and PSP-tau (Fig. S2 C). Control-brain–injected mice had no tau pathology (Fig. S2 D). Together, these data indicate the initiation of glial tau pathology does not depend on neuronal tau.
Propagation of glial tau pathology in TauKDncre;fl/fl mice
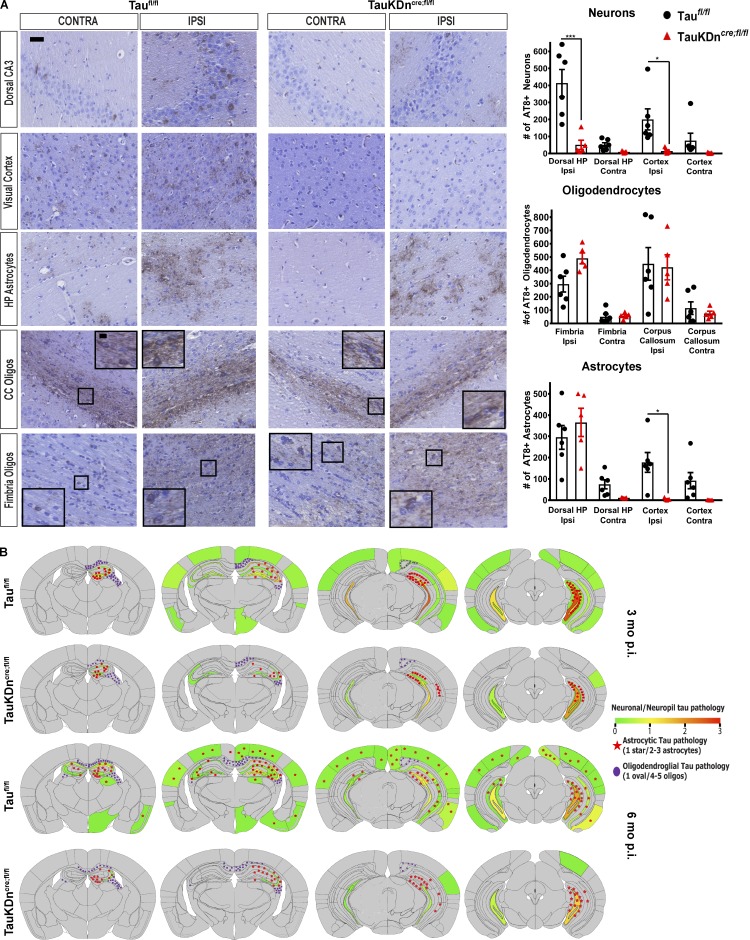
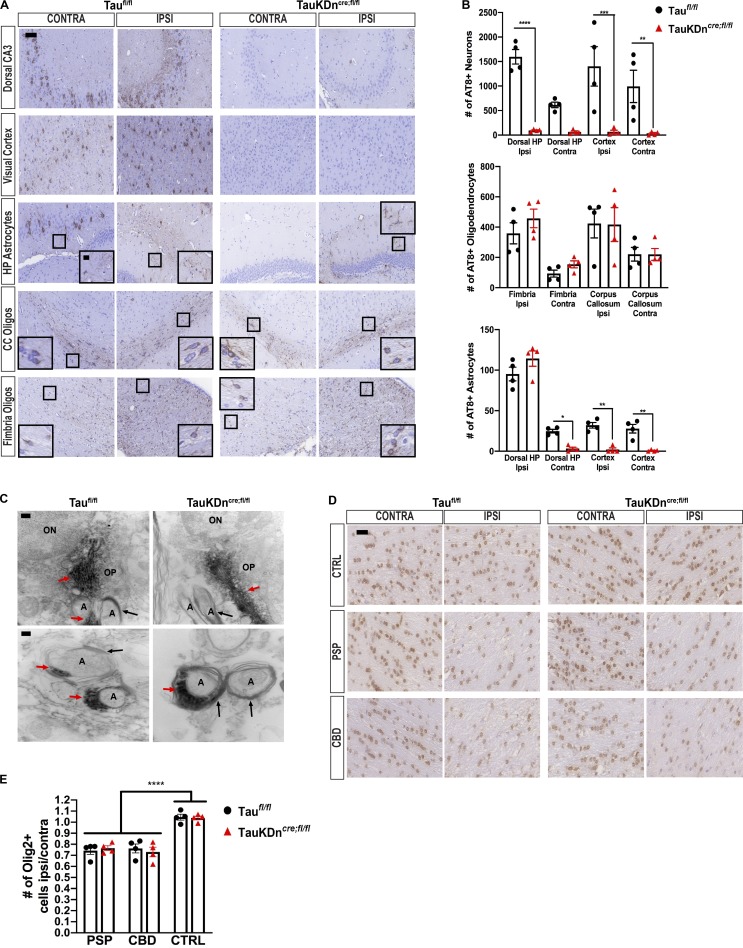
We previously reported the spatiotemporal transmission of oligodendroglial and astrocytic tau aggregates in CBD-tau or PSP-tau–injected nonTg mice (Narasimhan et al., 2017). Oligodendroglial tau aggregates spread to contralateral white matter tracts in CBD-tau and PSP-tau–injected TauKDncre;fl/fl mice at 6 mo p.i., despite significantly less neuronal tau pathology than controls (Fig. 4 A and Fig. 5, A and B). Heatmaps showed the oligodendroglial tau aggregates propagated along the fimbria and corpus callosum to the contralateral side in the TauKDncre;fl/fl mice, as in controls (Fig. 4 B and Fig. S2 E).
Figure 4.
Tau pathology propagation in TauKDncre;fl/fl mice. (A) Left: AT8 IHC of CBD-injected Taufl/fl mice (n = 6) and TauKDncre;fl/fl mice (n = 5) 6 mo p.i. Scale bars, 50 µm; inset, 10 µm. Right: Quantification of AT8+ neurons, oligodendrocytes, and astrocytes. Ipsi, ipsilateral; Contra, contralateral; CC, corpus callosum. Mean ± SEM plotted. One-way ANOVA with Bonferroni post hoc test: neurons, P = 0.0001; oligodendrocytes, P = 0.0001; astrocytes, P = 0.0001; post hoc: *, P < 0.05, ***, P < 0.001. Two independent experiments. (B) Heatmaps of neuronal tau pathology on a scale of 0 (gray) to 3 (red) of coronal sections of Taufl/fl and TauKDncre;fl/fl mice 3 and 6 mo p.i. Astrocytic tau aggregates in red stars and oligodendroglial tau inclusions in purple ovals.
Figure 5.
Oligodendroglial tau pathology propagation in TauKDncre;fl/fl mice. (A) AT8 IHC on PSP-tau–injected TauKDncre;fl/fl and Taufl/fl mice (n = 4 each) 6 mo p.i. Two independent experiments. CC, corpus callosum. Scale bars, 50 µm; inset, 10 µm. (B) Quantification of AT8+ neurons, oligodendrocytes, and astrocytes from A. Mean ± SEM plotted. One-way ANOVA for neurons, P = 0.0001; oligodendrocytes, P = 0.0029; astrocytes, P = 0.0001; post hoc analysis: *, P < 0.05, **, P < 0.01, ***, P < 0.001, ****, P < 0.0001. (C) Immuno-EM of AT8 in corpus callosum of CBD-tau–injected Taufl/fl and TauKDncre;fl/fl mice (n = 3 each) 3 mo p.i. Two independent experiments. ON, oligodendrocyte nucleus; OP, oligodendrocyte process; A, axon; red arrows, tau fibril; black arrows, myelin sheath. Scale bars, top, 200 nm; bottom, 100 nm. (D) Olig-2 IHC in the fimbria of CBD-tau, PSP-tau, and control-brain–injected TauKDncre;fl/fl and Taufl/fl mice (n = 4 mice each) 3 mo p.i. Two independent experiments. Scale bar, 25 µm. (E) Quantification of Olig-2+ cells from C. Mean ± SEM plotted. One-way ANOVA with Bonferroni post hoc P < 0.0001; post hoc: *, P < 0.05, **, P < 0.01, ***, P < 0.001.
There are at least two possible mechanisms by which oligodendrocytes transmit tau pathology: (1) Oligodendrocytes use neuronal axons as a conduit to propagate tau seeds, and/or (2) oligodendrocytes use their own processes to transmit insoluble tau aggregates. Immuno–electron microscopy (EM) on CBD-tau–injected TauKDncre;fl/fl and Taufl/fl mice showed tau fibrils were found almost exclusively in oligodendroglial processes (Fig. 5 C). Tau fibrils were identified at the end of the oligodendrocyte processes near the formation of the myelin sheath, but not within the axon itself (Fig. 5 C). These observations suggest the second hypothesized mechanism likely explains the spread of oligodendroglial tau pathology.
Furthermore, there were fewer oligodendrocytes in the fimbria of both CBD-tau and PSP-tau–injected TauKDncre;fl/fl and Taufl/fl mice compared with control-brain–injected mice at 3 mo p.i. (Fig. 5, D and E). However, there were no differences in the number of oligodendrocytes between injected TauKDncre;fl/fl and Taufl/fl mice, thereby suggesting a correlation between oligodendrocyte tau pathology and cell loss even in the absence of neuronal tau.
In contrast to oligodendrocytes, astrocytic tau aggregates did not spread in the CBD-tau or PSP-tau–injected TauKDncre;fl/fl mice at 6 mo p.i. (Fig. 4, A and B; and Fig. 5, A and B). As previously described (Narasimhan et al., 2017), astrocytic tau pathology propagated to the contralateral hippocampus and cortical regions in Taufl/fl mice, paralleling neuronal tau transmission. However, without neuronal tau transmission in TauKDncre;fl/fl mice, there was no astrocytic tau transmission (Fig. 4, A and B; and Fig. 5, A and B). Thus, oligodendroglial, but not astrocytic, tau pathology propagated over time in the absence of neuronal tau transmission.
Concluding remarks
Until now, the mechanism underlying glial tau pathology formation in tauopathies has been unknown. Using in vitro glial cell cultures and a novel TauKDncre;fl/fl model, we demonstrated that glial cells could propagate tau aggregates independent of neuronal tau. In particular, oligodendrocytes seeded with human tau strains develop tau aggregates in vitro, and propagate tau aggregates in vivo, despite neuronal tau knockdown. The subcellular localization of tau aggregates was almost exclusively in oligodendrocyte processes, and not in neuronal axons. This finding suggests oligodendrocytes may form their own network, an “oligodendroglial connectome,” by which they propagate tau aggregates via their own processes. In fact, tau fibrils were identified near the formation of the myelin sheath in vitro and in vivo, suggesting myelin sheaths may play a role in oligodendrocyte tau transmission.
In contrast, astrocytes do not develop tau aggregates in vitro as they do not express tau, yet they initially form tau aggregates in vivo. These findings appear contradictory, particularly given that astrocytes express MAPT mRNA in vivo (Zhang et al., 2014). Possible explanations include that tau mRNA does not get translated into protein in astrocytes in vivo, tau protein is expressed in vitro at levels too low for detection, or the astrocyte cultures are not representative of astrocytes in vivo (Foo et al., 2011). Furthermore, astrocytic tau pathology did not propagate in the mouse brain in the absence of neuronal tau, showing that the previously described correlation between neuronal and astrocytic tau pathology is due to neuronal tau aggregate release and local uptake by astrocytes (Narasimhan et al., 2017).
It is not clear why astrocytic tau pathology initially formed in vivo, but did not transmit over time. One explanation is astrocytes do not express tau protein in vivo, and astrocytic tau pathology is due to uptake from neurons or oligodendrocytes. This hypothesis is supported by the lack of tau expression in astrocytes by IHC. Another possibility is that astrocytes express some tau protein and can develop tau aggregates independent of neurons, but there is no astrocyte-to-astrocyte network to facilitate the tau transmission. These data do not preclude the possibility that astrocytes are involved in neuronal tau transmission. Future studies using the TauFlox mice and astrocyte-specific Cre lines are needed to further evaluate the role of astrocytes in tau transmission.
Our study further reveals the significance of glial tau pathology in the pathogenesis of tauopathies. It has been challenging to investigate the functional consequences of glial tau pathology given that both neuronal and glial tau pathology coexist in human disease. However, we now show oligodendrocyte cell loss occurs in the presence of oligodendrocyte tau pathology alone. While our study suggests a correlation between oligodendrocyte tau pathology and cell loss, future studies should investigate additional functional effects of glial tau pathology. Since glial tau pathology has functional effects independent of neuronal tau pathology, therapies developed to treat tauopathies should target both neurons and glia. Until now, most tau-targeted therapies have been tested in mouse models that only develop neuronal tau aggregates, and future studies using our mouse model can test the effect of these therapies on glial cells.
Materials and methods
Purification of insoluble tau from AD, CBD, and PSP brains
Human brain tissues from three AD cases, three CBD cases, and one PSP case (all cases from the Center for Neurodegenerative Disease Research brain bank) with abundant frontal cortical tau pathology were selected for this study (Table S1). One control-brain case with no tau pathology was also selected for this study (Table S1). All cases were diagnosed based on accepted neuropathology criteria (Irwin et al., 2015; Montine et al., 2016). Purification of pathological, insoluble tau from the frontal cortex of these cases was performed as previously described (Guo et al., 2016; Narasimhan and Lee, 2017).
Table S1. Final supernatant characterization of all cases.
| Case no. | Neuropathology diagnosis | Gender | Age at death (yr) | PMI (h) | Disease duration (yr) | Tau concentration (mg/ml) | Total protein concentration (mg/ml) | Purity (% tau/total protein) |
|---|---|---|---|---|---|---|---|---|
| AD 1 | AD | M | 66 | 4 | 11 | 2.6 | 8.9 | 29 |
| AD 2 | AD | M | 62 | 12 | N/A | 1.29 | 6.7 | 19 |
| AD 3 | AD | F | 68 | 9 | 8 | 1.95 | 9.4 | 21 |
| CBD 1 | CBD | M | 52 | 8 | 4 | 0.693 | 12 | 6 |
| CBD 2 | CBD | M | 56 | 15 | 6 | 0.277 | 12.6 | 2 |
| CBD 3 | CBD | F | 76 | 14 | 10 | 0.048 | 11.8 | 0.4 |
| PSP 1 | PSP | F | 63 | 6.5 | 5 | 0.0371 | 13.3 | 3 |
| C 1 | Control | M | 59 | 17 | N/A | Undetectable | 12.2 | N/A |
F, female; M, male; N/A, not applicable; PMI, postmortem interval.
The final purified supernatants contained insoluble, pathological tau, and are identified as AD-tau, CBD-tau, and PSP-tau in subsequent experiments. The different fractions from each purification were analyzed by Western blotting and sandwich ELISA for tau as previously described (Guo et al., 2016; Narasimhan and Lee, 2017). The sandwich ELISA and Western blotting for tau in the final supernatant were used for estimates of tau concentration (see Table S1). The final supernatants were also analyzed by bicinchoninic acid (BCA) assay (Thermo Fisher Scientific) for total protein concentration (Table S1). AD-tau and CBD-tau were injected at 1 µg/site, and PSP-tau was injected at 0.7 µg/site for injection experiments. Control-brain lysate was injected at equal total protein concentration to tauopathy lysates.
Primary neuron cultures
Embryonic day 16–18 embryos from pregnant CD1 mice were used to generate primary neuron cultures. Dissociated hippocampal tissues were digested with papain (Worthington Biochemical), triturated, and strained into single neurons using a Falcon Cell Strainer (BD Biosciences). They were then plated onto coverslips precoated with poly-D-lysine (Sigma-Aldrich) diluted in borate buffer (0.05 M boric acid, pH 8.5) at 100,000 cells per coverslip on 24-well plates. Neurons on day 6 or 7 in vitro were treated with AD-tau, CBD-tau, or PSP-tau that had been sonicated for 60 pulses with a handheld probe. Immunocytochemistry (ICC) was performed at 15 d after fibril treatment.
Primary astrocyte and neuron–astrocyte cultures
The cortex was dissected out from postnatal day 0–2 pups from pregnant CD1 mice to generate primary cortical astrocyte cultures. Tissue was triturated with a Pasteur pipet in dissection media (DMEM with high glucose, 10% FBS, 1% penicillin/streptomycin, and 1% L-glutamine) and strained through a 70-µm strainer into a 50-ml Falcon conical tube. Cells were centrifuged at 2,000 rpm for 3 min at 4°C, then washed in dissection media and centrifuged at 2,000 rpm for 3 min at 4°C two more times. Cells were seeded onto a T-25 flask (one cortex/flask) and incubated for 7–10 d until confluent (fed with DMEM/10% FBS every 2–3 d).
Once astrocytes formed confluent monolayer on a T-25 flask, flasks were shaken for 30 min at 180 rpm at 37°C, and fresh media were added (to remove microglia). Then flasks were shaken again for 6 h at 37°C at 240 rpm, with fresh media added (to remove oligodendrocytes). Cells were washed with versene, 0.25% trypsin was added to remove the astrocytes, and cells were resuspended in dissection media. Astrocytes were centrifuged at 2,000 rpm for 3 min at 4°C, resuspended in DMEM/10% FBS, and counted to plate 50,000 cells/coverslip on a 24-well plate or 100,000 cells/well on a 12-well plate for biochemistry.
For neuron–astrocyte co-culture, astrocytes were prepared as described above and plated on coverslips at 80,000 cells/coverslip (coated with 0.4 μg/ml poly-D-lysine in 50 mM borate buffer, and then coated with 10 μg/ml laminin). After washing, coverslips were incubated with glia media (DMEM with 10% FBS, and 1% penicillin–streptomycin). Once the astrocytes were 70% confluent, 20 μl of 1,000× 5-fluorodeoxyuridine was added to stop astrocyte growth before adding neurons. 1 d before the neurons were plated, the astrocyte culture medium was changed to glia–neuron media (1% B27, 1% heat-inactivated FBS, and 0.5 mM GlutaMAX in Neurobasal A medium). Neurons were prepared as described above and resuspended after centrifugation in glial–neuron media. Neurons were plated at 100,000 cells/coverslip (24-well plate) on top of astrocytes. Primary astrocyte-only or neuron–astrocyte co-cultures were seeded with CBD-tau at 500 ng/coverslip and incubated for 15 d after seeding (see below).
For viral transfection of mouse astrocyte cultures, T34PL-AAV1-mCherry was used, with AAV1-mCherry as a control. Both viral vectors were used at multiplicity of infection 200,000, which was mixed with conditioned astrocyte media (50% astrocyte growth media + 50% fresh 10% FBS astrocyte media from above), and plated on mouse astrocytes cultures at DIV3. 2 d following transfection, media with virus was removed and replaced with conditioned astrocyte media. Astrocytes were fixed with 4% paraformaldehyde 6 d after transfection, and ICC for Tau5 was performed to determine tau and mCherry expression (see below). CBD-tau and AD-tau (450 ng/coverslip) were seeded on virally transfected mouse astrocytes 3 d after viral transfection. Astrocytes were fixed and extracted with 4% paraformaldehyde and 1% Triton X-100 15 d after seeding, and ICC was performed (see below).
Primary rat oligodendrocyte cultures
Cerebral hemispheres from postnatal day 1–2 rat pups were dissected and suspended in DMEM with 10% FBS. Tissue was triturated with a Pasteur pipet and centrifuged at 800 g for 5–10 min at room temperature. Supernatant was aspirated and the pellet was resuspended in DMEM/10% FBS and plated onto a T-75 flask (∼1 rat brain per flask). Flasks were not touched for 4 d to allow neurons to die and astrocytes to adhere; after 4 d, cells were fed twice a week until astrocytes formed a confluent monolayer on flasks, with microglia and OPCs on top (7–10 d).
Once the astrocyte monolayer had formed, medium was changed completely with fresh DMEM/10% FBS and incubated for 1 h at 37°C. Flasks were first shaken for 2 h at 200 rpm at 37°C. Then media were aspirated (to remove microglia) and the cells were washed with PBS. Media were replaced, and flasks were incubated for 1 h at 37°C. Flasks were shaken again for 2 h at 220 rpm at 37°C. Then media were replaced, and flasks were incubated for 1 h at 37°C (to remove microglia). Finally, flasks were shaken for 24 h at 240 rpm at 37°C. The supernatant containing OPCs was removed and centrifuged at 500 g for 10 min, with OPCs resuspended in DMEM/10% FBS and plated at 65,000 cells/coverslip (50 µg/ml poly-L-lysine–coated coverslips in 24-well plate). 4 h after plating, media were replaced with oligodendrocyte growth media (DMEM with insulin [5 µg/ml], transferrin [5 µg/ml], and sodium selenite [25 ng/ml] supplement; Boehringer). Once OPCs were confluent on coverslips (3–4 d), oligodendrocyte growth media were replaced with long-term differentiation media (half DMEM/half Neurobasal, 2% B27, 1% T3, 1% L-glutamine, 1% penicillin–streptomycin, 1% sodium pyruvate, 2.5 mg/ml insulin, 1% differentiation media supplement [containing 50 mg/ml transferrin, 5.37 mg/ml putrescine, 0.0015 mg/ml progesterone, and 0.00264 mg/ml selenium dioxide], 10 µg/ml biotin, 1% bovine serum albumin, 1× NAc, and 1× Cellgro Trace elements B). Once oligodendrocytes matured for 7 d, they were directly seeded with different tauopathy lysates and incubated for 15 d after seeding (DIV26 total).
ICC
Neurons, oligodendrocytes, and astrocytes were fixed with 4% paraformaldehyde (without extraction) or 4% paraformaldehyde with 1% Triton X-100 to remove soluble tau (with extraction after seeding of tau strains) for 15 min. ICC was performed with the primary anti-tau antibodies described in each figure overnight (see figure legends for details), followed by incubation with appropriate Alexa Fluor–conjugated secondary antibodies the next day. Coverslips were mounted using Fluoromount-G containing DAPI (Southern Biotech) to label cell nuclei. A Nikon Eclipse DSQi1MC microscope was used to acquire immunofluorescence (IF) images. For quantification of fluorescent signals, whole coverslips were scanned using a Lamina Multilabel Slide scanner (PerkinElmer) and quantified using the image analysis platform HALO (Indica Laboratories).
Extraction of astrocytes and oligodendrocytes for biochemistry
To investigate tau expression in astrocytes, mouse astrocytes in 6-well plates were scraped into 1% radioimmunoprecipitation assay buffer and centrifuged at 100,000 g for 30 min at 4°C. Similarly, rat oligodendrocytes in 6-well plates were scraped, and two wells were pooled into 1% sarkosyl lysis buffer (1% sarkosyl in 50 mM Tris, and 150 mM NaCl, pH 7.6) and centrifuged at 100,000 g for 30 min at 4°C. The supernatants from both extractions were collected for soluble tau, and total protein concentration was determined by BCA assay (Thermo Fisher Scientific).
Animals
CD1 and C57Bl/6 mice and pregnant rats were purchased from Charles River. Embryos from pregnant CD1 females were used to generate primary hippocampal neurons, and mouse pups postnatal day 0–3 from pregnant CD1 females were used to generate primary astrocyte cultures. Postnatal day 0–2 rat pup brains were used to generate primary rat oligodendrocyte cultures.
TauKDncre;fl/fl were generated by crossing CAMK2a-Cre mice (on C57Bl/6J background, purchased from the Jackson Laboratory, 027310; Dragatsis and Zeitlin, 2000) with TauFlox mice (generated by the Roberson Laboratory on C57Bl/6J background). Due to the expression of Cre in the testes of CAMK2a-Cre mice, male homozygous TauFlox mice were crossed with female heterozygous CAMK2a-Cre mice to generate the first generation of TauKDncre;fl/+ heterozygous mice. Then, female TauKDncre;fl/+ from the first generation were crossed with male homozygous TauFlox mice to generate homozygous TauKDncre;fl/fl mice, along with littermate controls not expressing Cre (referred to as Taufl/fl mice). Additional control mice generated include Cre-only expressing mice (CAMK2a-Cre+). The University of Pennsylvania’s Institutional Animal Care and Use Committee approved all animal protocols.
Stereotaxic surgery on mice
Stereotaxic surgery on nonTg mice was performed as previously described (Narasimhan et al., 2017; Narasimhan and Lee, 2017). The mice were aseptically inoculated with human brain extracts in the dorsal hippocampus and overlying cortex of one hemisphere (bregma: −2.5 mm; lateral: +2 mm; depth: −2.4 mm and −1.4 mm from the skull). For the hippocampus and cortex injections, each site received 2.5 µl of inoculum. Concentrations of tau per injection site was 1 μg/site for AD-tau and CBD-tau, and 0.7 μg/site for PSP-tau.
IHC and IF
Injected mice were sacrificed and analyzed via IHC and IF as previously described (Iba et al., 2013; Narasimhan et al., 2017). IHC for various anti-tau primary antibodies was performed, or double-labeling IF was performed with two primary antibodies incubated on tissue sections overnight, followed by incubation with secondary antibodies conjugated to Alexa Fluor (see figure legends for details). IHC-stained slides were scanned using the Lamina Multilabel Slide Scanner (PerkinElmer) to obtain images. IF images were acquired using a Nikon Eclipse DSQi1MC microscope.
Quantitative analysis for in vitro experiments was performed using Halo software. For injected mice, each coronal mouse section was identified by stereology using The Mouse Brain in Stereotaxic Coordinates (Franklin and Paxinos, 2001) to map to specific bregma level (10 sections per mouse per region were used). Then, specific brain regions for quantification were identified using the atlas, and regions of interest were drawn using Halo software. AT8-positive neuronal or glial cells were manually counted by a a blinded reviewer using Halo. Similarly for Olig-2 quantification, three sections of fimbria per mouse were identified using specific bregma levels, and Olig-2+ cells were counted using Halo software. Semi-quantitative analysis was performed as previously described (Guo et al., 2016), with AT8-positive pathology scored on a scale of 0–3 (0: no pathology; 3: high pathology) at six coronal sections (bregma: 0.98 mm, −2.18 mm, −2.92 mm, −3.52 mm, −4.96 mm, and −5.52 mm) for each mouse. Scores were averaged across all mice at each time point and then imported into customized software to generate color-coded heatmaps of the spatial distribution of pathology as previously described (Narasimhan et al., 2017).
Western blotting
For cell cultures, samples were extracted as described above, and protein concentration was determined by BCA. For mouse brains, different brain regions were dissected after cardiac perfusion and frozen at −80°C until extraction. Each brain region was thawed on ice and homogenized in 5× vol/wt high-salt reassembly buffer (100 ml of 10× reassembly buffer containing 0.1 M MES [2-(N-morpholino)ethanesulfonic acid], 10 mM EGTA, 5 mM Mg2SO4, 0.75 M NaCl, and 0.02M NaF) using a hand-held probe sonicator (QSonica). The homogenates were centrifuged at 100,000 g for 30 min at 4°C, and the supernatants with soluble tau were analyzed by BCA for total protein concentration.
Samples were loaded with the same amount of total protein on a 10% SDS gel, transferred to 0.2 µm nitrocellulose membranes, and blocked in 5% milk diluted in Tris-buffered saline. Blots were incubated in appropriate primary antibodies overnight (see Antibodies section), and then incubated with IRDye-labeled secondary antibodies and scanned using an ODY-2816 Imager.
Immuno-EM
CBD-tau–injected TauKDncre;fl/fl mice or Taufl/fl mice were sacrificed, and cardiac perfusion was performed at 3 mo p.i. as previously described (Narasimhan and Lee, 2017). Mouse brains were fixed in either 2% paraformaldehyde + 0.05% glutaraldehyde in 0.1 M cacodylate buffer (pH 7.4) or periodate-lysine-paraformaldehyde buffer (2% paraformaldehyde + 0.075 M lysine + 0.01 M Na-m-periodate in 0.037 M NaH2PO4 buffer, pH 7.0) for 2 h, and then were sectioned on the vibratome at 70 µm sections. Vibratome sections were permeabilized 30 min in 50% ethanol and blocked 30 min in PBS + 2% fish gelatin + 0.0005% saponin + 0.05% thimerosal. Antibody incubations were 2 d in AT8 (1:100), overnight in biotinylated horse anti-mouse IgG, and 3 d in ABC Elite avidin-HRP conjugate (Vector Laboratories). All incubations were in PBS + 2% fish gelatin + 0.0005% saponin + 0.05% thimerosal at room temperature. HRP stain was 8 min at room temperature in 10 mg/ml 3,3′-diaminobenzidine in 0.1 M TrisHCl buffer, pH 7.4, + 10 mM imidazole.
For EM processing, sections were fixed overnight in 2.5% glutaraldehyde in 0.1 M cacodylate buffer, post-fixed 1 h in 1% OsO4 + 1.5% potassium ferrocyanide in 0.05 M cacodylate buffer, pH 7.4, dehydrated in ethanol, and embedded in EMbed-812 (Electron Microscopy Sciences). Selected 1-µm semithin sections were reembedded and cut for EM. Sections were stained with 1% uranyl acetate in 50% ethanol and Reynolds lead citrate or with lead citrate only. EM images were taken on JEOL 1010 (JEOL USA).
Antibodies
Antibodies used for ICC were Olig-2 (rabbit polyclonal, Millipore, 1:500), T49 (rodent-tau specific antibody, mouse monoclonal, in-house, 1:500), GFAP (rat monoclonal, in-house, 1:1,000), MBP, rat monoclonal, in-house, 1:500), CNP, rabbit polyclonal, in-house, 1:500), MAP2 (rabbit polyclonal, in-house, 1:5,000), AT8 (pS202/205 tau antibody, mouse monoclonal, Thermo Fisher Scientific, 1:1,000), Tau5 (pan-tau antibody, mouse monoclonal, gift from L. Binder [deceased], 1:500), Nogo-A (rabbit polyclonal, Santa Cruz, 1:500), Iba-1 (rabbit polyclonal, Wako, 1:500), and A2B5 (mouse monoclonal, in-house, 1:500). Antibodies used for Western blotting were T49 (rodent-tau specific antibody, mouse monoclonal, in-house, 1:1,000), RD3 (3R tau antibody, mouse monoclonal, Millipore, 1:1,000), RD4 (4R tau antibody, mouse monoclonal, Millipore, 1:1,000), K9JA (total tau antibody, rabbit polyclonal, Dako, 1:1,000), GAPDH (loading control, mouse monoclonal, Advanced Immunochemical, 1:5,000), and β-tubulin (loading control, rabbit polyclonal, Abcam, 1:1,000). Antibodies used for IHC were R2295 (mouse tau-specific, rabbit polyclonal, in-house, 1:2,000 with formic acid antigen retrieval), AT8 (pS202/205 antibody, mouse monoclonal, Thermo Fisher Scientific, 1:10,000), and Olig-2 (rabbit polyclonal, Millipore, 1:500 with citrate buffer antigen retrieval). Antibodies used for IF were Olig-2 (rabbit polyclonal, Millipore, 1:250 with citrate buffer antigen retrieval), AT8 (pS202/205 antibody, mouse monoclonal, Thermo Fisher Scientific, 1:2,000), and GFAP (rat polyclonal, in-house, 1:1,000). The antibody used for immuno-EM was AT8 (pS202/205 antibody, mouse monoclonal, Thermo Fisher Scientific, 1:100).
Experimental design and statistical analysis
For the seeding of primary rat oligodendrocyte and neuron-oligodendrocyte co-cultures, n = 3 cases of AD, n = 3 cases of CBD, and n = 1 case of PSP were tested in three independent experiments, and quantification of IF was performed using HALO (Indica Labs). Two-way ANOVA with Bonferroni post hoc test was performed comparing all groups with GraphPad Prism. P values <0.05 were considered statistically significant.
The number of mice used for all in vivo experiments is described per figure. For Western blots of TauKDncre;fl/fl mouse tau expression, fluorescent antibody signal for each region was quantified using the LiCor software and normalized to GAPDH signal. For quantification of IHC, 9 or 10 sections per mouse per region were quantified for AT8+ cells as specified in each figure. The total number of AT8+ cells per mouse per region was plotted as mean ± SEM. For Olig-2 quantification, three sections per mouse in the ipsilateral and contralateral fimbria were quantified for Olig-2+ cells. Given that tau pathology only occurs in ipsilateral fimbria at 3 mo p.i. of CBD-tau and PSP-tau, the number of Olig-2+ cells in the ipsilateral fimbria was normalized with the contralateral fimbria, and then compared with control-brain–injected mice. IHC quantification results were analyzed across mice using one-way ANOVA with Bonferroni post hoc test with GraphPad Prism, with each statistical test described per figure. P values <0.05 were considered statistically significant.
Online supplemental material
Fig. S1 shows the characterization of rat oligodendrocyte and astrocyte cultures in vitro. Fig. S2 shows control experiments for the TauKDncre;fl/fl mice, including double-labeling IF for colocalization of oligodendroglial and astrocytic tau pathology, AD-tau injections into TauKDncre;fl/fl mice, CBD-tau injections into CAMK2a-Cre+-only mice, control-brain injections into TauKDncre;fl/fl mice, and heatmaps for PSP-tau injected into TauKDncre;fl/fl mice. Table S1 characterizes the human tauopathy cases used in this paper, including biochemical data on the final extracts used for in vitro and in vivo experiments.
Acknowledgments
We thank Jing Guo and Soo-Jung Kim for technical assistance, Kurt Brunden for critical reading of the manuscript, and Lester Binder (deceased) for Tau5 antibody. We also thank the patients and families for brain donation.
National Institute on Aging grants AG10124 and AG17586, CurePSP, and the Woods Foundation funded this work.
The authors declare no competing financial interests.
Author contributions: S. Narasimhan, J.Q. Trojanowski, and V.M.Y. Lee designed the study. L. Changolkar performed biochemical extraction of human tauopathy lysates. D.M. Riddle performed cell culture experiments. E.D. Roberson and Z. Li provided TauFlox mice to help design TauKDncre;fl/fl mouse generation. B. Zhang performed in vivo mouse injections. A. Stieber performed EM experiments. S. Narasimhan, A. Kats, and S.A. Weitzman designed, performed, and analyzed the injected mouse experiments. S. Narasimhan, J.Q. Trojanowki, and V.M.Y. Lee wrote the manuscript.
References
- Arriagada P.V., Growdon J.H., Hedley-Whyte E.T., and Hyman B.T.. 1992. Neurofibrillary tangles but not senile plaques parallel duration and severity of Alzheimer’s disease. Neurology. 42:631–639. 10.1212/WNL.42.3.631 [DOI] [PubMed] [Google Scholar]
- Broe M., Kril J., and Halliday G.M.. 2004. Astrocytic degeneration relates to the severity of disease in frontotemporal dementia. Brain. 127:2214–2220. 10.1093/brain/awh250 [DOI] [PubMed] [Google Scholar]
- Clavaguera F., Akatsu H., Fraser G., Crowther R.A., Frank S., Hench J., Probst A., Winkler D.T., Reichwald J., Staufenbiel M., et al. . 2013. Brain homogenates from human tauopathies induce tau inclusions in mouse brain. Proc. Natl. Acad. Sci. USA. 110:9535–9540. 10.1073/pnas.1301175110 [DOI] [PMC free article] [PubMed] [Google Scholar]
- Dragatsis I., and Zeitlin S.. 2000. CaMKIIalpha-Cre transgene expression and recombination patterns in the mouse brain. Genesis. 26:133–135. [DOI] [PubMed] [Google Scholar]
- Foo L.C., Allen N.J., Bushong E.A., Ventura P.B., Chung W.S., Zhou L., Cahoy J.D., Daneman R., Zong H., Ellisman M.H., and Barres B.A.. 2011. Development of a method for the purification and culture of rodent astrocytes. Neuron. 71:799–811. 10.1016/j.neuron.2011.07.022 [DOI] [PMC free article] [PubMed] [Google Scholar]
- Forman M.S., Lal D., Zhang B., Dabir D.V., Swanson E., Lee V.M., and Trojanowski J.Q.. 2005. Transgenic mouse model of tau pathology in astrocytes leading to nervous system degeneration. J. Neurosci. 25:3539–3550. 10.1523/JNEUROSCI.0081-05.2005 [DOI] [PMC free article] [PubMed] [Google Scholar]
- Franklin K., and Paxinos G.. 2001. The Mouse Brain in Stereotaxic Coordinates. Second edition Academic Press, San Diego. 296 pp. [Google Scholar]
- Giannakopoulos P., Herrmann F.R., Bussière T., Bouras C., Kövari E., Perl D.P., Morrison J.H., Gold G., and Hof P.R.. 2003. Tangle and neuron numbers, but not amyloid load, predict cognitive status in Alzheimer’s disease. Neurology. 60:1495–1500. 10.1212/01.WNL.0000063311.58879.01 [DOI] [PubMed] [Google Scholar]
- Gibbons G.S., Lee V.M.Y., and Trojanowski J.Q.. 2019. Mechanisms of cell-to-cell transmission of pathological tau: a review. JAMA Neurol. 76:101–108. 10.1001/jamaneurol.2018.2505 [DOI] [PMC free article] [PubMed] [Google Scholar]
- Guo J.L., Narasimhan S., Changolkar L., He Z., Stieber A., Zhang B., Gathagan R.J., Iba M., McBride J.D., Trojanowski J.Q., and Lee V.M.. 2016. Unique pathological tau conformers from Alzheimer’s brains transmit tau pathology in nontransgenic mice. J. Exp. Med. 213:2635–2654. 10.1084/jem.20160833 [DOI] [PMC free article] [PubMed] [Google Scholar]
- Higuchi M., Zhang B., Forman M.S., Yoshiyama Y., Trojanowski J.Q., and Lee V.M.. 2005. Axonal degeneration induced by targeted expression of mutant human tau in oligodendrocytes of transgenic mice that model glial tauopathies. J. Neurosci. 25:9434–9443. 10.1523/JNEUROSCI.2691-05.2005 [DOI] [PMC free article] [PubMed] [Google Scholar]
- Iba M., Guo J.L., McBride J.D., Zhang B., Trojanowski J.Q., and Lee V.M.Y.. 2013. Synthetic tau fibrils mediate transmission of neurofibrillary tangles in a transgenic mouse model of Alzheimer’s-like tauopathy. J. Neurosci. 33:1024–1037. 10.1523/JNEUROSCI.2642-12.2013 [DOI] [PMC free article] [PubMed] [Google Scholar]
- Irwin D.J., Cairns N.J., Grossman M., McMillan C.T., Lee E.B., Van Deerlin V.M., Lee V.M., and Trojanowski J.Q.. 2015. Frontotemporal lobar degeneration: defining phenotypic diversity through personalized medicine. Acta Neuropathol. 129:469–491. 10.1007/s00401-014-1380-1 [DOI] [PMC free article] [PubMed] [Google Scholar]
- Kaufman S.K., Sanders D.W., Thomas T.L., Ruchinskas A.J., Vaquer-Alicea J., Sharma A.M., Miller T.M., and Diamond M.I.. 2016. Tau prion strains dictate patterns of cell pathology, progression rate, and regional vulnerability in vivo. Neuron. 92:796–812. 10.1016/j.neuron.2016.09.055 [DOI] [PMC free article] [PubMed] [Google Scholar]
- Kobayashi K., Hayashi M., Nakano H., Shimazaki M., Sugimori K., and Koshino Y.. 2004. Correlation between astrocyte apoptosis and Alzheimer changes in gray matter lesions in Alzheimer’s disease. J. Alzheimers Dis. 6:623–632, discussion: 673–681. 10.3233/JAD-2004-6606 [DOI] [PubMed] [Google Scholar]
- Lee V.M.Y., Goedert M., and Trojanowski J.Q.. 2001. Neurodegenerative tauopathies. Annu. Rev. Neurosci. 24:1121–1159. 10.1146/annurev.neuro.24.1.1121 [DOI] [PubMed] [Google Scholar]
- LoPresti P. 2002. Regulation and differential expression of tau mRNA isoforms as oligodendrocytes mature in vivo: implications for myelination. Glia. 37:250–257. 10.1002/glia.10035 [DOI] [PubMed] [Google Scholar]
- Montine T.J., Monsell S.E., Beach T.G., Bigio E.H., Bu Y., Cairns N.J., Frosch M., Henriksen J., Kofler J., Kukull W.A., et al. . 2016. Multisite assessment of NIA-AA guidelines for the neuropathologic evaluation of Alzheimer’s disease. Alzheimers Dement. 12:164–169. 10.1016/j.jalz.2015.07.492 [DOI] [PMC free article] [PubMed] [Google Scholar]
- Narasimhan S., and Lee V.M.Y.. 2017. The use of mouse models to study cell-to-cell transmission of pathological tau. Methods Cell Biol. 141:287–305. 10.1016/bs.mcb.2017.06.009 [DOI] [PMC free article] [PubMed] [Google Scholar]
- Narasimhan S., Guo J.L., Changolkar L., Stieber A., McBride J.D., Silva L.V., He Z., Zhang B., Gathagan R.J., Trojanowski J.Q., and Lee V.M.Y.. 2017. Pathological Tau Strains from Human Brains Recapitulate the Diversity of Tauopathies in Nontransgenic Mouse Brain. J. Neurosci. 37:11406–11423. 10.1523/JNEUROSCI.1230-17.2017 [DOI] [PMC free article] [PubMed] [Google Scholar]
- Sanders D.W., Kaufman S.K., DeVos S.L., Sharma A.M., Mirbaha H., Li A., Barker S.J., Foley A.C., Thorpe J.R., Serpell L.C., et al. . 2014. Distinct tau prion strains propagate in cells and mice and define different tauopathies. Neuron. 82:1271–1288. 10.1016/j.neuron.2014.04.047 [DOI] [PMC free article] [PubMed] [Google Scholar]
- Seiberlich V., Bauer N.G., Schwarz L., Ffrench-Constant C., Goldbaum O., and Richter-Landsberg C.. 2015. Downregulation of the microtubule associated protein tau impairs process outgrowth and myelin basic protein mRNA transport in oligodendrocytes. Glia. 63:1621–1635. 10.1002/glia.22832 [DOI] [PubMed] [Google Scholar]
- Su J.H., Nichol K.E., Sitch T., Sheu P., Chubb C., Miller B.L., Tomaselli K.J., Kim R.C., and Cotman C.W.. 2000. DNA damage and activated caspase-3 expression in neurons and astrocytes: evidence for apoptosis in frontotemporal dementia. Exp. Neurol. 163:9–19. 10.1006/exnr.2000.7340 [DOI] [PubMed] [Google Scholar]
- Xia C., Makaretz S.J., Caso C., McGinnis S., Gomperts S.N., Sepulcre J., Gomez-Isla T., Hyman B.T., Schultz A., Vasdev N., et al. . 2017. Association of in vivo [18F]AV-1451 tau PET imaging results with cortical atrophy and symptoms in typical and atypical Alzheimer disease. JAMA Neurol. 74:427–436. 10.1001/jamaneurol.2016.5755 [DOI] [PMC free article] [PubMed] [Google Scholar]
- Yoshiyama Y., Zhang B., Bruce J., Trojanowski J.Q., and Lee V.M.. 2003. Reduction of detyrosinated microtubules and Golgi fragmentation are linked to tau-induced degeneration in astrocytes. J. Neurosci. 23:10662–10671. 10.1523/JNEUROSCI.23-33-10662.2003 [DOI] [PMC free article] [PubMed] [Google Scholar]
- Zhang Y., Chen K., Sloan S.A., Bennett M.L., Scholze A.R., O’Keeffe S., Phatnani H.P., Guarnieri P., Caneda C., Ruderisch N., et al. . 2014. An RNA-sequencing transcriptome and splicing database of glia, neurons, and vascular cells of the cerebral cortex. J. Neurosci. 34:11929–11947. 10.1523/JNEUROSCI.1860-14.2014 [DOI] [PMC free article] [PubMed] [Google Scholar]


