As a novel type of anticancer reagent, imatinib inhibits not only BCR-ABL oncogenic protein but also LCK in T cells as an off-target, being able to selectively deplete mature T reg cells and thereby evoke effective immune responses to various cancers.
Abstract
This report addresses whether small molecules can deplete FoxP3-expressing regulatory T (T reg) cells, thereby augmenting antitumor immunity. Imatinib, a tyrosine kinase inhibitor of oncogenic BCR-ABL protein expressed by chronic myelogenous leukemia (CML) cells, possesses off-targets including LCK expressed in T cells. We showed that imatinib-treated CML patients in complete molecular remission (CMR) exhibited selective depletion of effector T reg (eT reg) cells and significant increase in effector/memory CD8+ T cells while non-CMR patients did not. Imatinib at CML-therapeutic concentrations indeed induced apoptosis specifically in eT reg cells and expanded tumor antigen–specific CD8+ T cells in vitro in healthy individuals and melanoma patients, and suppressed colon tumor growth in vivo in mice. Mechanistically, because of FoxP3-dependent much lower expression of LCK and ZAP-70 in T reg cells compared with other T cells, imatinib inhibition of LCK further reduced their TCR signal intensity, rendering them selectively susceptible to signal-deprived apoptotis. Taken together, eT reg cell depletion by imatinib is instrumental in evoking effective immune responses to various cancers.
Introduction
Naturally occurring regulatory T (T reg) cells expressing the transcription factor FoxP3 are actively engaged in suppressing immune responses against self-antigens, preventing autoimmune disease (Sakaguchi et al., 2008; Josefowicz et al., 2012). On the other hand, they appear to be suppressing immune responses against quasi–self-tumor antigens, hindering effective tumor immunity in cancer patients. As illustrations of this undesirable role of T reg cells, they abundantly infiltrate into tumor tissues (Nishikawa and Sakaguchi, 2014; Tanaka and Sakaguchi, 2017), and a high frequency of Foxp3+ T reg cells or a high ratio of Foxp3+ cells to CD8+ T cells in the tumor tissue is significantly correlated with poor prognosis in various cancers (Bates et al., 2006; Curiel et al., 2004; Sasada et al., 2003; Sato et al., 2005). In addition, depletion of T reg cells has been shown to be effective in evoking antitumor immune responses. For example, depletion of CD25high T reg cells in tumor-bearing mice by anti-CD25 antibody treatment potently expanded tumor-infiltrating CD8+ T cells with strong tumor-specific killing activity, eradicating tumors (Onizuka et al., 1999; Shimizu et al., 1999). In humans, cell-depleting antibodies against cell surface markers, such as CCR4 and CTLA-4, which are predominantly expressed by tumor-infiltrating T reg cells, were able to effectively enhance antitumor immune responses (Ha et al., 2019; Sugiyama et al., 2013; Arce Vargas et al., 2018). With such promising results of T reg cell–depleting antibodies in mice and humans, we have explored in this report whether a small molecule with a similar T reg cell–depleting activity is able to evoke and enhance antitumor immune responses in vivo and in vitro, in humans and in mice.
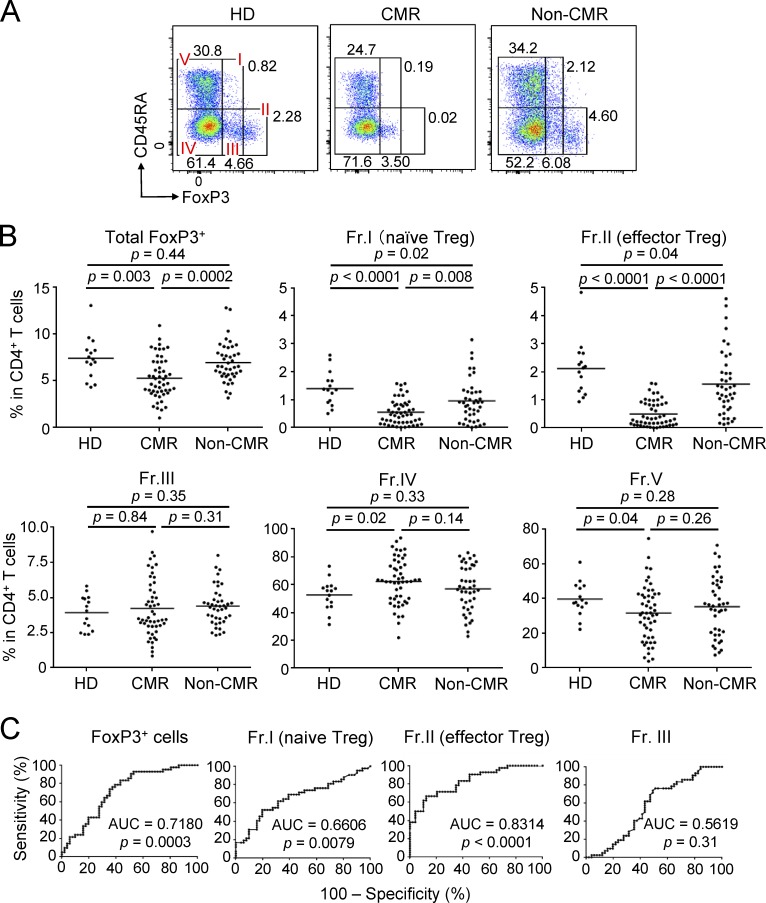
Human FoxP3+ T cells in the peripheral blood are heterogeneous in function and phenotype, and can be dissected into three main subpopulations by the expression levels of FoxP3 and cell surface CD45RA (Fig. 1 A): (i) FoxP3loCD45RA+ resting or naive T reg cells (Fraction [Fr.] I); (ii) FoxP3hiCD45RA− effector T reg (eT reg) cells (Fr. II), which have terminally differentiated from Fr. I naive T reg cells upon TCR stimulation to exert suppressive activity; and (iii) FoxP3loCD45RA− T cells (Fr. III), which appear to be activated conventional T (T conv) cells transiently expressing FoxP3 at a low level, hardly exhibiting suppressive activity, and capable of secreting pro-inflammatory cytokines (Miyara et al., 2009; Saito et al., 2016; Sakaguchi et al., 2010; Sugiyama et al., 2013). In contrast with the peripheral blood, a majority of tumor-infiltrating FoxP3+ T cells are Fr. II eT reg cells (reviewed in Nishikawa and Sakaguchi, 2014; Tanaka and Sakaguchi, 2017). The degree of their tumor infiltration is significantly associated with poor prognosis in various cancers (Saito et al., 2016). These findings collectively suggest that specific depletion of eT reg cells is sufficient to remove a majority of tumor-infiltrating T reg cells and thereby to elicit antitumor immune responses in tumor tissues. Moreover, this specific eT reg cell deletion, even systemically, can spare naive T reg cells in other tissues, enabling the latter to prevent possible immune-related adverse events due to T reg cell depletion (Sugiyama et al., 2013).
Figure 1.
Reduction of T reg cells, particularly eT reg cells, by imatinib treatment. (A) Representative CD45RA and FoxP3 staining of CD4+ T cells in the blood from a healthy donor (HD) and CML patients in CMR or non-CMR. (B) Frequencies of total FoxP3+ T cells and each subset (Fr. I, II, III, IV, and V) among CD4+ T cells from PBMCs of healthy donors (n = 15) and CML patients in CMR (n = 51) or non-CMR (n = 42). Data are pooled from more than two independent experiments. (C) Correlation evaluated by ROC curves between CMR achievement and decrease of total and each subset (Fr. I, II, and III) of FoxP3+ T cells from CML patients’ PBMCs in B. Horizontal lines in B indicate medians. Statistical significance was assessed by Mann-Whitney U test in B.
In this report, we have searched for small molecules that are able to selectively deplete eT reg cells to evoke effective tumor immunity while preventing autoimmune disease. Imatinib, a tyrosine kinase inhibitor for ABL kinase, has been used over the years for treating chronic myelogenous leukemia (CML) cells, without accompanying clinically serious autoimmunity. In addition to its direct leukemia cell–killing effect by inhibiting the BCR-ABL fusion protein expressed by CML cells, it has been reported that CML patients, especially those in remission, frequently develop T cell responses to leukemic cells or their specific antigens (Chen et al., 2008; Gannagé et al., 2005; Molldrem et al., 2000). Here, we show that imatinib-treated CML patients who have achieved complete molecular remission (CMR) show selective reduction of Fr. II eT reg cells and general expansion of memory type CD8+ T cells in the circulation, whereas those patients who failed to achieve CMR do not. The drug is able to specifically reduce eT reg cells in vitro and enhance immune responses of healthy donor T conv cells to tumor antigens; further, it can reduce T reg cells in vivo and inhibit tumor growth in mice. We show that imatinib inhibits lymphocyte-specific protein tyrosine kinase (LCK), a T cell–specific signaling molecule, as an off-target and selectively kills eT reg cells, which are intrinsically much lower than other T cells in the amount of LCK expression and therefore more sensitive to signal-deprived apoptosis upon inhibition of TCR signal by imatinib. The drug thus appears to kill CML cells not only directly but also indirectly by augmenting antitumor immunity, and is therefore useful for evoking and augmenting antitumor immunity against various cancers not limited to CML. These findings with imatinib would help in developing other small molecules with similar T reg cell–depleting effects as a new type of anticancer drug.
Results
Reduced eT reg cells by imatinib treatment in CML patients with CMR
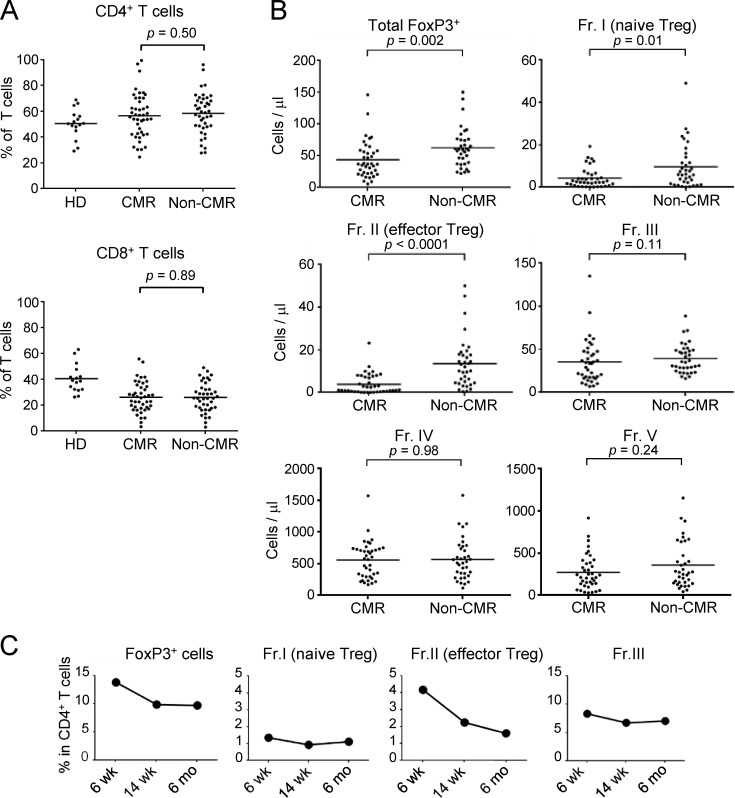
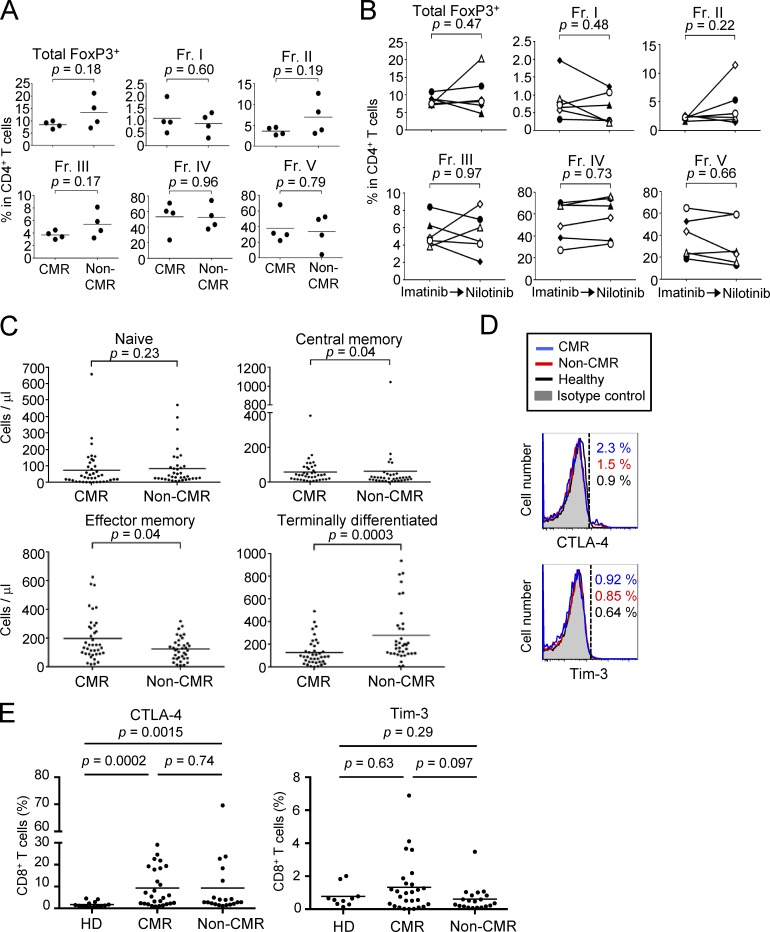
Imatinib possesses off-target effects on various tyrosine kinases expressed by T cells, affecting T cell number and function (Balachandran et al., 2011; Dietz et al., 2004; Hantschel et al., 2008). To determine its possible effects on human T cells in vivo, we first examined subset composition of CD4+ T cells in peripheral blood mononuclear cells (PBMCs) from 93 CML patients treated with ≤400 mg/d imatinib for 1–10 yr (average: 75.7 mo). Among them, 51 patients were in CMR (i.e., no detectable BCR-ABL mRNA by PCR), while 42 patients were in non-CMR (i.e., detectable BCR-ABL mRNA despite cytogenetic nondetection of leukemic cells; Table 1 and Shinohara et al., 2013 for detailed patients’ information). We found that CML patients who had achieved CMR possessed significantly lower percentages and numbers of FoxP3+ T reg cells, in particular eT reg cells and to a lesser extent naive T reg cells, with no significant alteration in FoxP3lo non-T reg cells and whole CD4+ or CD8+ T cells, when compared with non-CMR patients or healthy individuals (Fig. 1, A and B; and Fig. S1, A and B). Non-CMR patients showed a slight but significant reduction of naive T reg and eT reg cells compared with healthy donorss. Kinetic analysis of FoxP3+CD4+ T cell subpopulations after initiating imatinib treatment showed a gradual and selective reduction of eT reg cells, but not naive T reg cells or FoxP3+ non-T reg cells, over 6 mo (Fig. S1 C). There were no significant differences between CMR and non-CMR patients in clinical parameters including CML risk score, imatinib treatment duration, and median time required for complete cytogenetic responses (Shinohara et al., 2013; Baccarani et al., 2013; Table 2). In addition, nilotinib, another BCR-ABL inhibitor with weaker off-target effects and better CML-killing activity than imatinib (Weisberg et al., 2005; Weisberg et al., 2007), was apparently less potent in reducing eT reg cells in a limited number of CML patients who had been treated with nilotinib alone or switched from imatinib to nilotinib (Fig. S2, A and B). Taken together, imatinib is able to selectively deplete eT reg cells and, to a lesser extent, naive T reg cells as an off-target effect on T cells. This T reg cell depletion has a close correlation with complete CML remission at the molecular level, and is therefore a highly significant biomarker of molecular remission as revealed by receiver operating characteristic (ROC) curve analysis (Fig. 1 C). This would enable withdrawal of further tyrosine kinase inhibitor treatment in those CML patients with eT reg cell depletion.
Table 1. Clinical characteristics of CML patients.
| Characteristics (n = 93) | Median (range) |
|---|---|
| Age (yr) | 60.1 (23–85) |
| Male/female | 58/35 |
| Sokal risk (low/int./high) | 59/24/4 |
| EUTOS risk (low/high) | 73/5 |
| Prior IFN-α (+/−) | 19/74 |
| CML duration (mo) | 84.8 (13.2–229.4) |
| Duration of IM treatment (mo) | 75.7 (12.6–122.4) |
| Actual daily IM dose (mg/d) | 400 (66.7–400) |
| Median time to CCyR (mo) | |
| From diagnosis to CCyR | 6.6 (1–103.3) |
| From IM therapy to CCyR | 5.3 (0.5–76.7) |
| Median time to MMR (mo) | |
| From diagnosis to MMR | 19.5 (4.4–185.6) |
| From IM therapy to MMR | 17.0 (3.2–93.9) |
CCyR, complete cytogenetic response; EUTOS, European Treatment and Outcome Study; IM, imatinib; int., intermediate; MMR, major molecular response.
Figure S1.
Reduction of T reg cells, especially eT reg cells, by chronic imatinib treatment. (A) Frequencies of total CD4+ and CD8+ T cells in PBMCs of healthy donors (HD; n = 15) and CML patients in CMR (n = 51) or non-CMR (n = 42) as in Fig. 1 B. (B) The numbers of total FoxP3+ T cells and each subset (Fr. I, II, III, IV, and V) among CD4+ T cells from PBMCs of CML patients in CMR (n = 51) or non-CMR (n = 42) as in Fig. 1 B. (C) Kinetics of the frequencies of total FoxP3+ T cells and each subset (Fr. I, II, and III) among CD4+ T cells in a CML patient from whom sufficient amounts of PBMCs during clinical course were obtained. Data are pooled from at least two independent experiments. Horizontal lines indicate medians. Statistical significance was assessed by Mann–Whitney U test.
Table 2. Comparison of clinical characteristics between CMR and non-CMR CML patients.
| Clinical parameters | CMR (n = 51) median (range) | Non-CMR (n = 42) median (range) | P values |
|---|---|---|---|
| Age (yr) | 60.7 (28–85) | 59.5 (23–79) | 0.9446 |
| Sex,a female | 20 (39.2) | 15 (35.7) | 0.7287 |
| Weight (kg) | 60.3 (42–84) | 60.7 (45–102) | 0.3965 |
| Sokal risk (low/int./high) | 35/13/2 | 24/11/2 | 0.8688 |
| EUTOS risk (low/high) | 42/3 | 31/2 | 0.9140 |
| CML duration (mo) | 84.8 (22.4–229.4) | 77.3 (13.2–186.3) | 0.6576 |
| Prior IFN-αa | 8 (15.7) | 11 (26.2) | 0.2112 |
| Duration of IM treatment (mo) | 84.3 (22.4–116.6) | 77.1 (12.6–122.4) | 0.5036 |
| Actual daily IM dose (mg/d) | 400 (161.7–400) | 400 (66.7–400) | 0.9098 |
| Median time to CCyR (mo) | |||
| From diagnosis to CCyR | 6.6 (2.5–60.1) | 6.5 (1–103.3) | 0.8728 |
| From IM therapy to CCyR | 5.7 (2–46.5) | 4.8 (0.5–76.7) | 0.5431 |
| Median time to MMR (mo) | |||
| From diagnosis to MMR | 15.8 (4.4–185.6) | 30.5 (4.4–167.8) | 0.0937 |
| From IM therapy to MMR | 15.1 (3.2–76.1) | 19.6 (3.6–93.9) | 0.2429 |
| IM trough concentration (ng/ml) | 981.8 (336.3–2,687.7) | 1151.7 (124.4–2,624.1) | 0.5597 |
| BIM deletiona | 4 (7.8) | 7 (16.6) | 0.1898 |
BIM, BCL2L11 gene; CCyR, complete cytogenetic response; EUTOS, European Treatment and Outcome Study; IM, imatinib; int., intermediate; MMR, major molecular response.
Data presented as number (%) of patients.
Figure S2.
Frequencies of T reg cells and CD8+ T cell subsets under imatinib treatment, nilotinib treatment, or after switching to nilotinib from imatinib. (A and B) Frequencies of total FoxP3+ T cells and each subset (Fr. I, II, III, IV, and V) among CD4+ T cells from PBMCs of CML patients in CMR or non-CMR after nilotinib treatment (A, n = 4) or of CML patients who achieved CMR after switching from imatinib to nilotinib (B, n = 5). (C) The numbers of naive, central/memory, effector/memory, and terminally differentiated CD8+ T cells in the blood from CML patients in CMR (n = 51) or non-CMR (n = 42) as in Fig. 2 B. (D and E) CTLA-4 and TIM-3 expressions by CD8+ T cells (D) and the frequency of CTLA-4–positive or Tim-3–positive cells (E) in PBMCs of healthy donors (HD; n = 14 or 10) and CML patients in CMR (n = 27) or non-CMR (n = 20). Analyses in E were performed in patients from whom sufficient numbers of PBMCs were available. Data are pooled from at least two independent experiments. Horizontal lines in A, C, and E indicate medians. Statistical significance was assessed by Mann–Whitney U test.
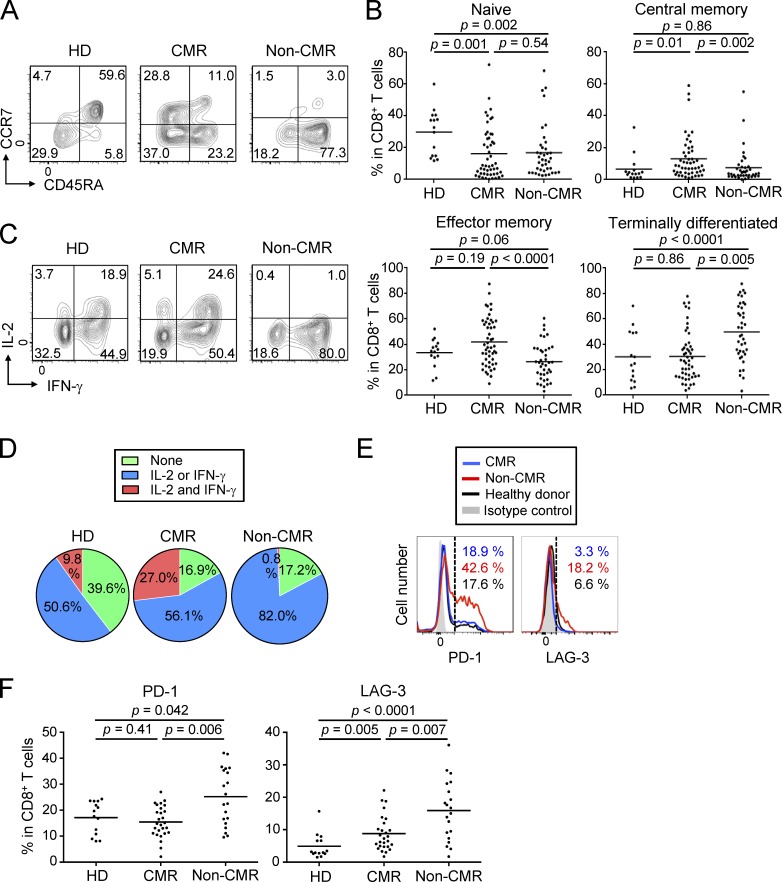
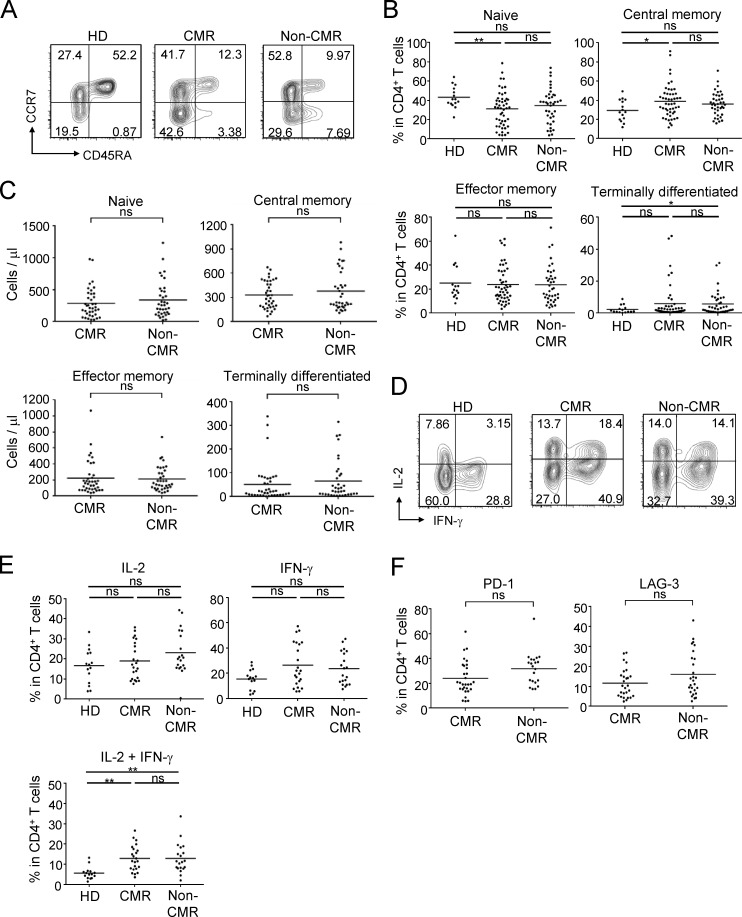
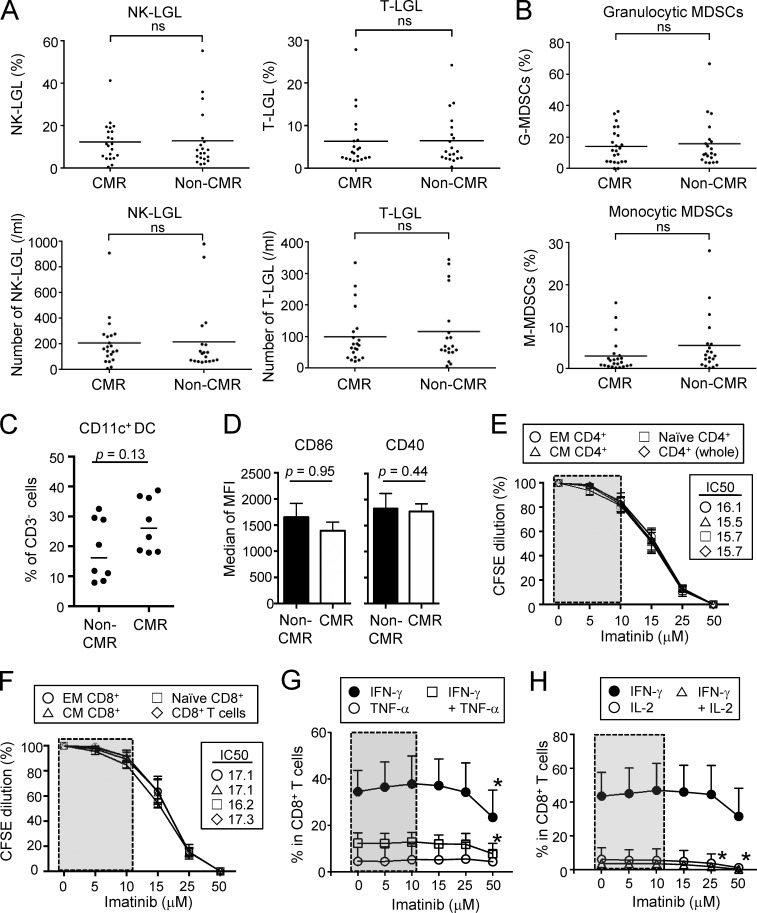
Analyses of other T cells, in particular CD8+ T cells, revealed that CML patients in CMR possessed significantly higher frequencies and numbers of central memory (CCR7+CD45RA−) and effector memory (CCR7−CD45RA−) CD8+ T cells (Sallusto et al., 1999), with reduction of naive T (CCR7+CD45RA+) cells and terminally differentiated (CCR7−CD45RA+) CD8+ T cells, when compared with healthy individuals or non-CMR patients; total numbers and ratios of CD4+ or CD8+ T cells in PBMCs were not significantly different between the two groups (Fig. 2, A and B; Fig. S1 A; and Fig. S2 C). Functionally, CD8+ T cells of patients in CMR were significantly higher than those in non-CMR or healthy individuals in the frequency of cells producing both IL-2 and IFN-γ upon in vitro PMA and ionomycin stimulation, while CD8+ T cells in non-CMR patients were significantly impaired in the dual cytokine production (Fig. 2, C and D). In accordance with these findings, CD8+ T cells expressing coinhibitory molecules such as PD-1 and LAG-3, but not Tim-3 or CTLA-4, suggestive of an exhausted state (Wherry, 2011), were more abundant in non-CMR patients compared with healthy individuals or patients in CMR (Fig. 2, E and F; and Fig. S2, D and E). There were no significant differences between CMR and non-CMR patients in the number or the frequency of other circulating blood cells (such as naive and memory CD4+ T cells, natural killer [NK] cells, dendritic cells, and granulocytic and monocytic myeloid-derived suppressor cells [MDSCs]), in cytokine production by CD4+ T cells, or in activation status of APCs (Fig. S3 and Fig. S4, A–D). Thus, CMR induction by chronic imatinib treatment is closely associated with general increase of effector and memory CD8+ T cells and with reduction of apparently exhausted CD8+ T cells, suggesting that T cell–mediated immunity contributes to CMR induction in CML patients.
Figure 2.
General activation of CD8+ T cells under chronic imatinib treatment. (A) Representative staining for CD45RA and CCR7 to assess naive, central memory, effector memory, and terminally differentiated CD8+ T cells in PBMCs from a healthy donor (HD) and CML patients in CMR or non-CMR. (B) Frequencies of each subset among CD8+ T cells from PBMCs of healthy donors (n = 15) and CML patients in CMR (n = 51) or non-CMR (n = 42). Data are pooled from more than two independent experiments. (C and D) IFN-γ and IL-2 production by CD8+ T cells stimulated with PMA and ionomycin. Representative staining of intracellular cytokines (C) and percentages (D) of cytokine-producing cells in CD8+ T cells from healthy donors (n = 15) and CML patients in CMR (n = 23) or non-CMR (n = 20). Data are pooled from more than two independent experiments. (E and F) Expression of cell surface markers for T cell exhaustion. (E) Representative PD-1 and LAG-3 staining of CD8+ T cells in the blood from a healthy donor and CML patients in CMR or non-CMR. (F) Frequencies of PD-1–positive and LAG-3–positive CD8+ T cells from PBMCs of healthy donors (n = 14) and CML patients in CMR (n = 28) or non-CMR (n = 21). Horizontal lines in B and F indicate medians. Analyses in C–F were performed in patients from whom sufficient numbers of PBMCs were available. Statistical significance was assessed by Mann-Whitney U test in B and F.
Figure S3.
CD4+ T cell subsets under chronic imatinib treatment. (A) Representative staining for CD45RA and CCR7 to detect naive, central memory, effector memory, and terminally differentiated CD4+ T cells in the blood from a healthy donor (HD) and CML patients in CMR or non-CMR. (B and C) Frequencies (B) and the absolute numbers (C) of each subset among CD4+ T cells from PBMCs of healthy donors (n = 15) and CML patients in CMR (n = 51) or non-CMR (n = 42). (D and E) IFN-γ and IL-2 production by CD4+ T cells stimulated with PMA and ionomycin. Representative staining (D) and percentages (E) of cytokine-producing cells among CD4+ T cells from healthy donors (n = 15) and CML patients with CMR (n = 23) or non-CMR (n = 20). (F) Expression of exhausted markers. Frequencies of PD-1–positive or LAG-3–positive CD4+ T cells from PBMCs of CML patients in CMR (n = 28) or non-CMR (n = 21). Analyses in E and F were performed in patients from whom sufficient numbers of PBMCs were available. Data are pooled from more than two independent experiments. Horizontal lines in B, C, E, and F indicate medians. Statistical significance was assessed by Mann–Whitney U test. ns, not significant; *, P < 0.05; **, P < 0.01.
Figure S4.
Effects of imatinib on LGLs, MDSCs, and proliferations of naive and effector CD4+ and CD8+ T cells. (A) The frequencies (top) and the numbers (bottom) of NK (CD3−CD16+CD56dimCD57+) and T (CD3+CD8+CD57+)-LGLs in the blood from CML patients in CMR (n = 21) or non-CMR (n = 20). (B) Frequency of granulocytic MDSCs (CD15+CD33+CD11b+HLA-DR−) and monocytic MDSCs (CD14+HLA-DR−) in the blood from CML patients in CMR (n = 23) or non-CMR (n = 20). (C) Frequency of CD11c+ MHC class IIhigh dendritic cells among CD3− cells from PBMCs of CML patients in CMR or non-CMR (n = 8 each). (D) Expressions of CD86 and CD40 by dendritic cells from PBMCs of CML patients in CMR or non-CMR (n = 8 each). Analyses were performed in patients from whom sufficient numbers of PBMCs were available. MFI, mean fluorescence intensity. (E and F) Proliferations of naive and effector subsets of CD4+ (E) and CD8+ (F) T cells prepared from PBMCs of healthy donors. Cells were stimulated with anti-CD3 and anti-CD28 mAbs with graded doses of imatinib (n = 5 each) for 5 d and assessed by CFSE dilution. CCR7+CD45RA+ as naive, CCR7+CD45RA− as central memory (CM), and CCR7−CD45RA− as effector memory (EM) T cells. (G and H) Effects of imatinib on cytokine production. CD8+ T cells from PBMCs of healthy donors (n = 6) were stimulated with PMA and ionomycin with graded doses of imatinib, and cytokine production was assessed by intracellular cytokine staining; IFN-γ and/or TNFα (G), and IFN-γ and/or IL-2 (H). Data are pooled from at least two independent experiments. Horizontal lines indicate medians in A–C. Statistical significance was assessed by Mann-Whitney U test in A–D or by two-way ANOVA with Holm-Sidak multiple comparisons to CD4+ T cells in E, CD8+ T cells in F, or each cytokine at 0 µM imatinib dose in G and H. Error bars indicate means ± SEM in D–H. ns, not significant; *, P < 0.05.
Imatinib selectively reduces eT reg cells in vitro
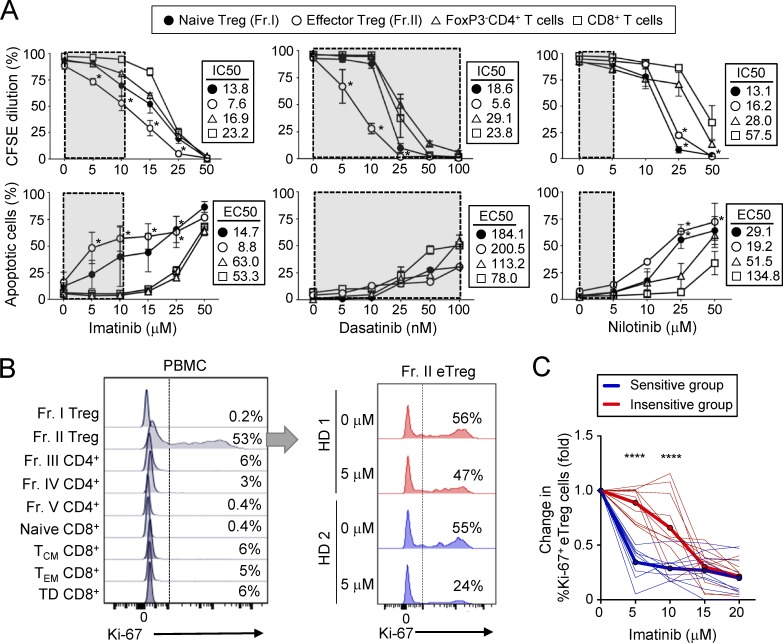
To determine then possible direct effects of imatinib on T cells, we prepared CD4+ T cell subpopulations (naive T reg cells, eT reg cells, and FoxP3−CD4+ T cells) and CD8+ T cells from healthy individuals and stimulated each population in vitro with anti-CD3 and anti-CD28 mAbs in the presence of graded amounts of imatinib. Adding imatinib at concentrations equivalent to therapeutic serum doses (∼10 µM; Druker et al., 2001) significantly decreased the proliferation of eT reg cells and increased their apoptosis, and to a lesser degree affected these events in naive T reg cells, but not in other naive or central/effector memory populations of CD4+ and CD8+ T cells (Fig. 3 A and Fig. S4, E and F). It scarcely affected cytokine production by CD8+ T cells (Fig. S4, G and H). Imatinib killed all these T cell subpopulations at higher doses well above its therapeutic concentration, indicative of its immunosuppressive activity at high doses (Seggewiss et al., 2005). Unlike imatinib, nilotinib failed to selectively destroy eT reg cells at therapeutic doses (Saglio et al., 2010; Weisberg et al., 2007), requiring much higher doses for similar effects. Dasatinib, another BCR-ABL inhibitor with broader off-target effects than imatinib or nilotinib (Hantschel et al., 2008), showed selective eT reg cell depletion within its therapeutic range for CML (Imagawa et al., 2015; Kantarjian et al., 2010; Weisberg et al., 2007; Fig. 3 A). Thus, the in vivo selective T reg cell depletion by imatinib is not secondary to its killing of CML cells but attributed to its direct killing of T reg cells, because the drug was able to destroy normal T reg cells from healthy individuals in vitro in the absence of leukemic cells and because nilotinib, which is more potent at CML killing, failed to deplete T reg cells in vitro at its CML therapeutic doses.
Figure 3.
Imatinib selectively reduces eT reg cells in vitro. (A) Proliferation inhibition and apoptosis induction by imatinib, dasatinib, and nilotinib. Subsets of CD4+ T cells (Fr. I and II and FoxP3− T cells) and CD8+ T cells prepared from PBMCs of healthy donors were stimulated with anti-CD3 and anti-CD28 mAbs with graded doses of imatinib (n = 8), dasatinib (n = 5), or nilotinib (n = 5) for 5 d. Proliferation was assessed by CFSE dilution and apoptosis by Annexin V and 7-AAD staining. Half-maximal inhibitory concentration (IC50) for proliferation and half-maximal effective concentration (EC50) for apoptosis are shown. Gray boxes indicate therapeutic doses. Data are pooled from more than two independent experiments. (B and C) Ki-67 staining of indicated subsets in freshly obtained PBMCs of a healthy individual (B, left; representative of five samples) and Ki-67 staining of Fr. II eT reg cells cultured with or without imatinib and 5 U/ml IL-2 for 5 d (B, right; two typical staining patterns representative of 10 samples in C). TCM, central memory T; TEM, effector memory T; TD, terminally differentiated. Percentages of Ki-67+ cells are indicated. Fold differences (C) in Ki-67+ eT reg frequencies after the culture in B. Donor samples (thin lines) were clustered by hierarchical clustering and K-means clustering into two groups. An insensitive group (red) with higher cluster means (bold red) and sensitive group (blue) with lower cluster means (bold blue) at 5 and 10 µM imatinib doses (n = 20). Data are pooled from more than two independent experiments. Error bars indicate means ± SEM in A. Statistical significance was assessed by two-way ANOVA with Holm-Sidak multiple comparisons to CD8+ T cells in A, and between two clustered groups at each dose in C. *, P < 0.05; ****, P < 0.0001.
In addition, eT reg cells were physiologically in a more active proliferative state than other T reg cells or T conv cells as shown with freshly isolated eT reg cells or after in vitro culture with IL-2 without exogenous TCR stimulation (Levine et al., 2014; Miyara et al., 2009; Vahl et al., 2014; Fig. 3 B). The in vitro eT reg culture revealed that healthy individuals are statistically segregated into two groups, susceptible or insusceptible to the imatinib-induced in vitro eT reg depletion, in a similar frequency (Fig. 3, B and C).
Thus, eT reg cells are physiologically in a highly proliferative state, and the most susceptible to apoptosis induction by imatinib. The variation in imatinib-induced T reg cell depletion among healthy individuals appears to be genetic and could be responsible for the CMR achievement in only a half of CML patients (Table 2) with profound T reg cell reduction after long-term imatinib treatment (Fig. 1).
Imatinib-induced eT reg cell reduction augments antitumor immune responses
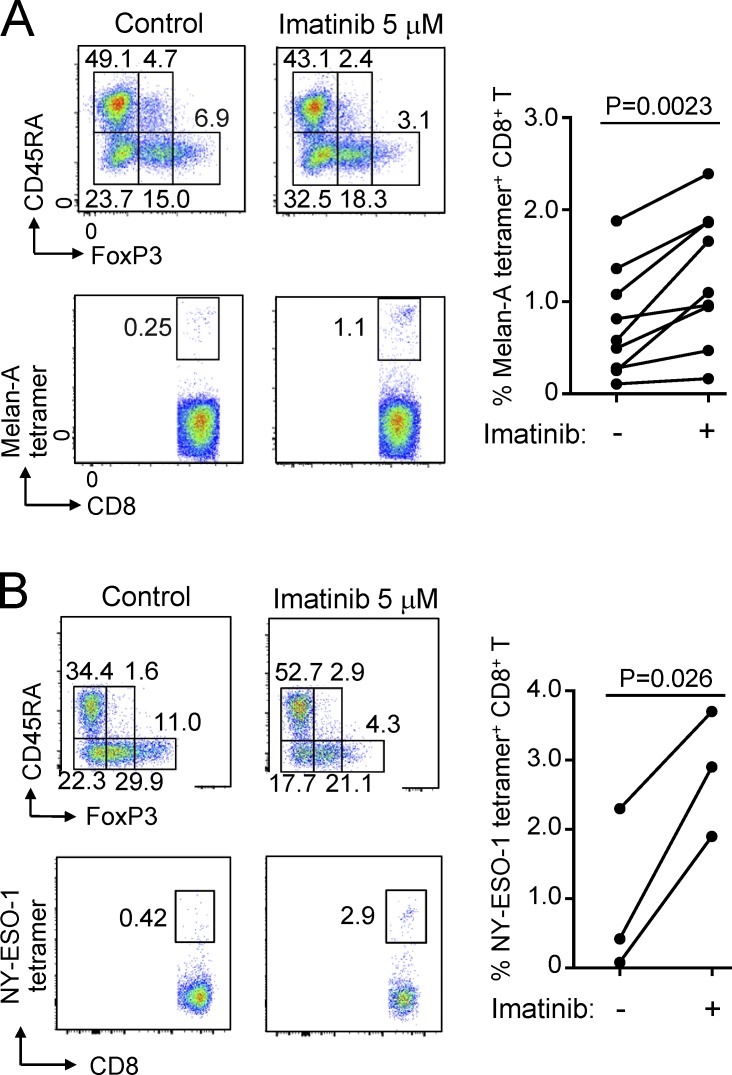
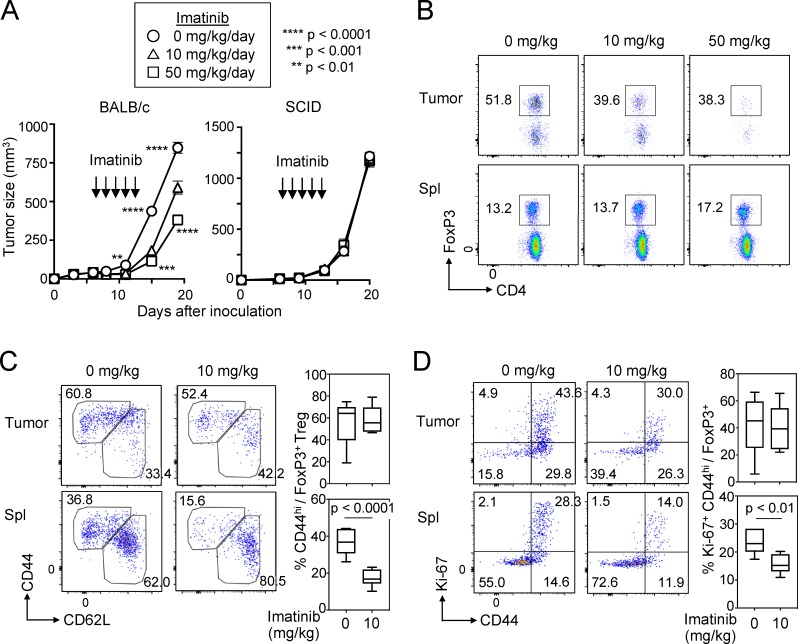
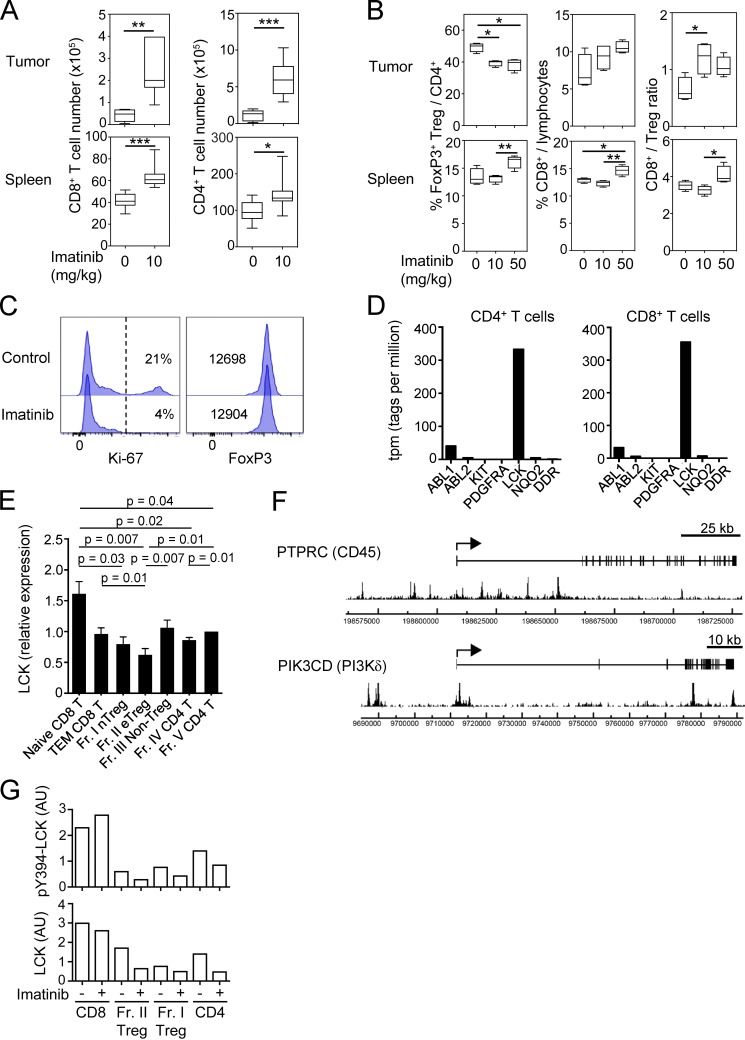
The above findings suggested that imatinib might evoke effective immune responses against not only CML but also other cancers via depleting T reg cells. To assess this possibility in vitro, we stimulated PBMCs of healthy individuals with peptides from Melan-A/MART-1, a melanocyte-specific self-antigen and also a melanoma-specific tumor antigen (Romero et al., 1997), in the presence of a therapeutic dose (5 µM) of imatinib. The treatment indeed reduced eT reg cells and significantly expanded Melan-A–specific CD8+ T cells (detectable by MHC/peptide tetramers) from PBMCs over 10 d (Fig. 4 A). Similarly, with PBMCs from patients with melanoma expressing NY-ESO-1 antigen, a cancer/testis antigen expressed by various types of cancer cells and human germ line cells (Gnjatic et al., 2006), imatinib enhanced the induction of NY-ESO-1–specific CD8+ T cells upon NY-ESO-1 peptide stimulation (Fig. 4 B). Moreover, imatinib treatment (10 or 50 mg/kg/d) every day for 5 d significantly inhibited the growth of CT26 colon carcinoma in BALB/c mice, but not in T/B cell-deficient BALB/c SCID mice (Fig. 5 A). In the former, tumor-infiltrating CD4+ and CD8+ T cells in imatinib-treated mice were significantly increased in number (Fig. S5 A), while the frequency of FoxP3+ T reg cells was significantly reduced, thereby increasing CD8+ T-to–T reg cell ratios in the tumor (Fig. 5 B and Fig. S5, A and B). Along with the reduction of tumor-infiltrating T reg cells, imatinib treatment reduced the frequency of CD44highCD62Llow or Ki-67+CD44high effector T reg cells in the spleen (Fig. 5, C and D), which resembled imatinib-induced reduction of human eT reg cells in the peripheral blood. In addition, stable Foxp3 expression level in vitro after imatinib treatment (10 µM) indicated that imatinib did not reduce or alter Foxp3 expression by T reg cells (Fig. S5 C).
Figure 4.
Imatinib reduces eT reg cells and augments antitumor immune responses in vitro. (A) In vitro imatinib-dependent induction of tumor antigen–specific CD8+ T cells from PBMCs of healthy individuals. PBMCs from HLA-A*0201+ healthy individuals (n = 9) were stimulated with Melan-A26-35 peptide with/without 5 µM imatinib. Reduction of eT reg cells (top) and Melan-A–specific CD8+ T cell induction detected by MHC/Melan-A peptide tetramers (bottom). Representative result of three independent experiments. CD4+ and CD8+ T cells were separately analyzed by FACS. Summary of Melan-A–specific CD8+ T cell induction from nine healthy donors (right). (B) In vitro imatinib-dependent induction of tumor antigen–specific CD8+ T cells from PBMCs of cancer patients. PBMCs from two HLA-A*0201+ and one HLA-Cw*0304+ melanoma patients were stimulated with NY-ESO-1157–165 and NY-ESO-192–100 peptides, respectively, with/without 5 µM imatinib (n = 3). Decrease of eT reg cells (top) and increase of NY-ESO-1–specific CD8+ T cells detected by MHC/NY-ESO-1 peptide tetramers (bottom). Representative result of three independent experiments. CD4+ and CD8+ T cells were separately analyzed by FACS. Summary of NY-ESO-1–specific CD8+ T cell induction from three melanoma patients (right). Statistical significance was assessed by Student’s two-tailed paired t test in A and B.
Figure 5.
Imatinib-induced T reg cell reduction hinders growth of inoculated tumor in mice. (A) Tumor growth curve of BALB/c or BALB/c SCID mice inoculated with CT26 colon cancer. Mice were treated with imatinib at indicated doses for 5 d (n = 9 or 10 BALB/c or n = 8 or 9 SCID mice per each treatment group/experiment). Representative of two independent experiments. Tumor curves were assessed by two-way ANOVA, and asterisks by circles or squares indicate statistical significance between 0 and 10 mg/kg/d treated groups or 0 and 50 mg/kg/d treated groups for each time point, respectively. (B) The frequency of splenic (Spl) and tumor-infiltrating Foxp3+ T reg cells on the third day of imatinib treatment (10 d after tumor inoculation) as in A. Representative staining of each group (n = 3 or 4 mice per group). (C and D) Representative staining of Foxp3+CD4+ T cells in the tumor or the spleen for CD44 and CD62L (C, left) and the frequency of CD44hiCD62Llo FoxP3+ effector T reg cells in the tumor (C, right top) or the spleen (C, right bottom) 3 d after the last imatinib treatment (15 d after tumor inoculation). Representative staining of Foxp3+CD4+ T cells in the tumor or the spleen for CD44 and Ki-67 (D, left) and the frequency of Ki-67+CD44hi FoxP3+ T reg cells in the tumor (D, right top) or the spleen (D, right bottom) of the mice (n = 6 or 8 mice per group in two independent experiments). Error bars indicate means ± SEM in A or means ± SD in C and D. Statistical significance was assessed by two-way repeated-measure ANOVA with Tukey’s multiple comparisons test in A, or by two-sided Student’s t test in C and D.
Figure S5.
Antitumor effect by imatinib in mice and molecular targets of imatinib in humans. (A) Total cell numbers of CD8+ and CD4+ T cells in the tumor (top) or the spleen (bottom) of CT26-inoculated BALB/c mice 3 d after the last imatinib treatment (15 d after tumor inoculation) as in Fig. 5 A. (B) The frequency and ratio of T reg cells and CD8+ T cells in Fig. 5 B. (C) Representative staining of Ki-67 and Foxp3 for CellTrace Violet+ T reg cells cultured with or without 10 µM imatinib and 5 U/ml IL-2 for 4 d. CD4+ Foxp3+ (GFP+) T reg cells from Foxp3-IRES-GFP reporter mice were sorted and labeled with CellTrace Violet before the culture (n = 3). Percentages of Ki-67+ cells (left) or mean fluorescence intensity of Foxp3 (right) are indicated in the plots. (D) Gene expression levels of putative targets of imatinib, including ABL1, ABL2, KIT, PDGFRA, LCK, NQO2,and DDR1 in human CD4+ or CD8+ T cells by deepCAGE (Cap Analysis of Gene Expression) database (CNhs 13223 and CNhs 12201). (E) LCK mRNA expressions in naive and effector subsets of CD8+ T, CD4+ T, and T reg cells prepared from PBMCs of healthy donors (n = 6). LCK mRNA levels relative to GAPDH were measured by quantitative real-time PCR. (F) FoxP3 binding near the promoter regions of human PIK3CD (gene encoding phosphatidylinositol-4,5-bisphosphate 3-kinase p110δ [PI3Kδ]) and PTPRC (gene encoding protein tyrosine phosphatase, receptor type C [CD45]) genes. The arrows indicate transcription start sites, boxes indicate exons, and peaks indicate FoxP3-binding sites from SRA data analysis (SRX060160; Birzele et al., 2011). (G) Signal intensities of pY394-LCK and total LCK protein with or without 10 µM imatinib in Fig. 6 C. AU, arbitrary unit. Error bars indicate means ± SD. Data are pooled from at least two independent experiments. Statistical significance was evaluated by two-sided Student’s t test. *, P < 0.05; **, P < 0.01; ***, P < 0.001.
These results in humans and mice collectively indicate that therapeutic doses of imatinib for CML are able to augment general immune responses, including tumor antigen–specific CD8+ T cell responses, by selectively reducing eT reg cells, in a similar manner as direct depletion of eT reg cells by specific mAb was able to evoke effective tumor immunity (Sugiyama et al., 2013; Ha et al., 2019).
Imatinib inhibits LCK, which is intrinsically lower in T reg cells and selectively causes their apoptosis
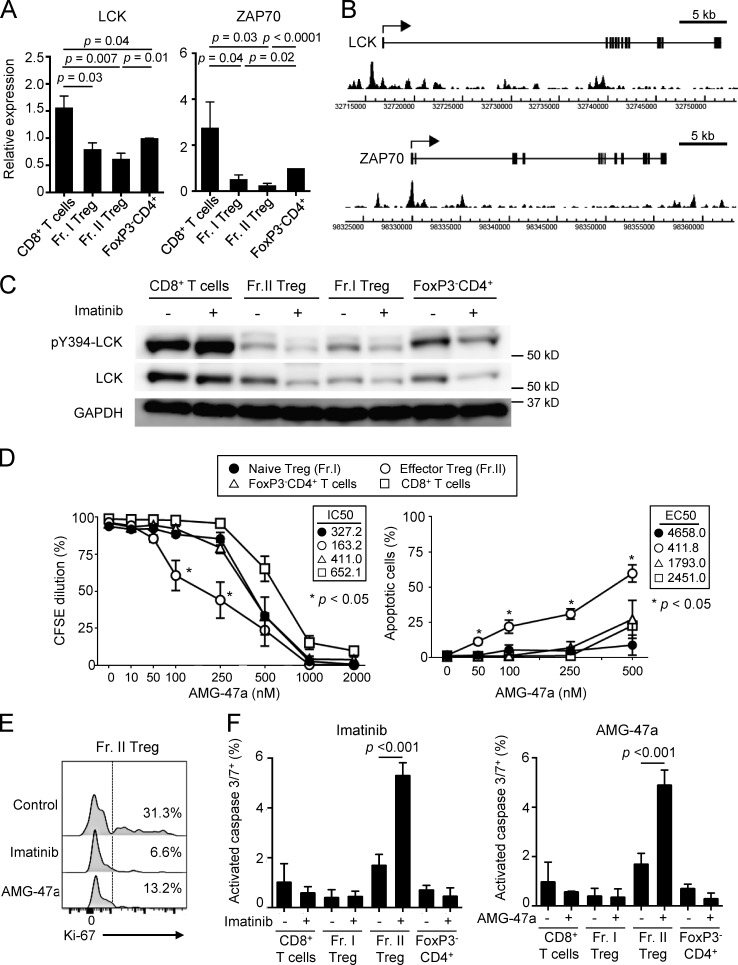
Then, which tyrosine kinase(s) does imatinib inhibit in T reg cells as an off-target, leading to selective reduction of eT reg cells? T cells transcribed a number of tyrosine kinases and molecules that have been reported as high-affinity targets of imatinib (Hantschel et al., 2008; Lee et al., 2010): e.g., ABL1, ABL2, KIT, PDGFR, LCK, NQO2, and DDR1, with the most abundant expression of LCK in CD4+ and CD8+ T cells (Fig. S5 D). Among CD4+ and CD8+ T cell subsets including naive and effector T cells, the levels of mRNA for LCK and also the down-stream signaling molecule ZAP-70, which is phosphorylated by LCK, were slightly lower in CD4+ T cells compared with CD8+ T cells, and lowest in eT reg and naive T reg cells (Fig. 6 A and Fig. S5 E). In T reg cells, FoxP3 bound to the promoter regions of the genes encoding TCR-proximal signaling molecules including LCK, ZAP70, PTPRC (CD45), and PIK3CD (PI3Kδ; Fig. 6 B and Fig. S5 F), contributing to their low expression in T reg cells, especially upon TCR stimulation (Birzele et al., 2011; Forrest et al., 2014; Morikawa and Sakaguchi, 2014; Ohkura et al., 2012). Accordingly, LCK protein levels were substantially lower in T reg cells and CD4+ T cells, compared with CD8+ T cells, and the basal levels of the constitutively active form of LCK, which is auto-phosphorylated at Y394 residue (pY394-LCK; Nika et al., 2010), were also lower in eT reg and naive T reg cells compared with CD4+ or CD8+ T cells. Addition of imatinib further reduced the protein levels, presumably because of enhanced degradation of imatinib-bound LCK (Nika et al., 2010), as well as pY394-LCK levels in T reg cells but not in CD8+ T cells (Fig. 6 C and Fig. S5 G). Similar to imatinib, the LCK inhibitor AMG-47a selectively and significantly reduced eT reg cells at the concentrations at which proliferation of other T cells was not significantly affected (Fig. 6 D). Both reagents indeed reduced Ki-67+ eT reg cells (Fig. 6 E) and selectively induced apoptosis-mediating activated caspases specifically in eT reg cells (Fig. 6 F).
Figure 6.
Imatinib inhibits LCK and selectively causes apoptosis in T reg cells. (A) LCK and ZAP-70 mRNA expressions in naive CD8+ T cells, Fr. I naive T reg cells, Fr. II eT reg cells, and naive CD4+ T cells prepared from PBMCs of healthy donors. LCK (n = 6) and ZAP-70 (n = 5) mRNA levels relative to GAPDH were measured by quantitative real-time PCR. Data are pooled from more than two independent experiments. (B) FoxP3 binding near the promoter regions of human LCK and ZAP-70 genes. The arrows indicate transcription start sites, boxes indicate exons, and peaks indicate FoxP3-binding sites from SRA data analysis (SRX060160; Birzele et al., 2011) by Integrative Genomics Viewer software. (C) Total and phosphorylated LCK (pY394-LCK) protein expression measured by Western blotting. Each cell population sorted from PBMCs of healthy donors was incubated with or without 10 µM imatinib for 1 h (n = 5). Data are representative of five independent experiments. (D) Proliferation inhibition and apoptosis induction by the LCK inhibitor AMG-47a. Subsets of CD4+ T cells (Fr. I and II and FoxP3−CD4+ T cells) and CD8+ T cells prepared from PBMCs of healthy donors (n = 3) were stimulated with anti-CD3 and anti-CD28 mAbs with or without graded doses of AMG-47a for 5 d. Proliferation was assessed by CFSE dilution, and apoptosis was assessed by Annexin V and 7-AAD staining. IC50 for proliferation and EC50 for apoptosis are shown in the boxes. Data are pooled from more than two independent experiments. (E) Representative staining (n = 3 each) of Ki-67 in Fr. II eT reg cells from PBMCs of healthy donors treated with 10 µM imatinib or 250 nM AMG-47a for 4 d with anti-CD3 and anti-CD28 mAbs. Percentages of Ki-67+ cells were indicated. Data are pooled from more than two independent experiments. (F) The frequencies of cells with activated caspase 3 and 7, prepared from PBMCs of healthy donors, after treatment with or without 10 µM imatinib or 250 nM AMG-47a for 4 d with anti-CD3 and anti-CD28 mAbs. Caspase 3/7+ cells negative for SYTOX AADvanced cell impermeant nucleic acid stain were measured (n = 3 each). Data are pooled from more than two independent experiments. Error bars indicate means ± SEM in A, D, and F. Statistical significance was assessed by Student’s two-tailed paired t test in A and two-way ANOVA with Holm-Sidak multiple comparisons to CD8+ T cells in D, or to imatinib or AMG-47a–treated Fr. II T reg cells in F.
Taken together, inhibition of Y394-LCK phosphorylation by imatinib and the intrinsically low-level expression of LCK and ZAP-70 in T reg cells may synergistically attenuate TCR-proximal signaling intensity more profoundly in T reg cells than in other T cells. This leads to selective reduction of the former, eT reg cells in particular, due to signal-deprived cell death, in accordance with high dependency of Ki-67+ eT reg cells on TCR signal intensity for their survival (Levine et al., 2014; Vahl et al., 2014).
Discussion
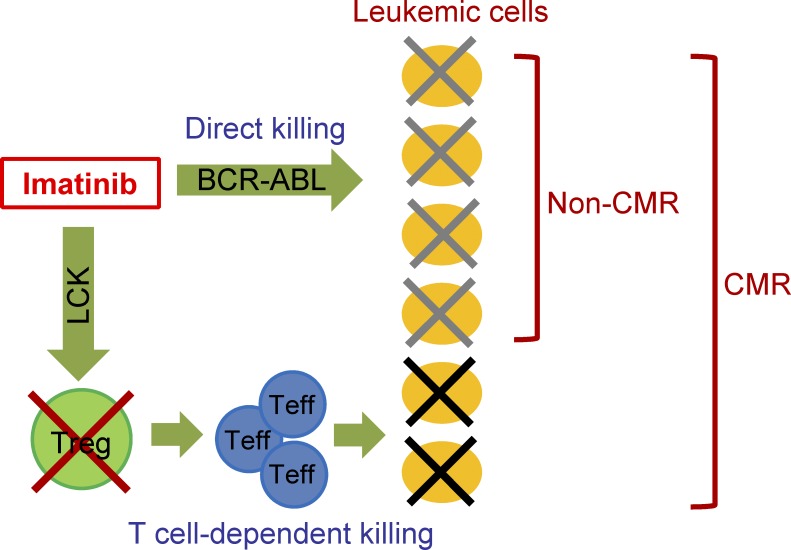
The results in this study have shown that imatinib not only directly kills BCR-ABL–expressing leukemic cells, but also selectively depletes eT reg cells at CML therapeutic doses by inhibiting LCK, thereby evoking T cell–mediated antitumor immune responses. The direct and indirect (immunological) killing of malignant cells by imatinib suggests their synergistic contributions to CMR induction in CML (Fig. 7). Such T reg cell–depleting activity of imatinib can be exploited to immunologically treat other cancers as well.
Figure 7.
A schematic diagram showing direct or T cell–dependent killing of CML cells by imatinib for achieving CMR. Teff, effector T cell.
How then does LCK inhibition by imatinib selectively kill eT reg cells? One contributing factor to the selective killing is that, compared with other T reg or T conv populations, eT reg cells are physiologically in a highly proliferative state, which is dependent on the TCR signal; LCK inhibition attenuates the TCR signal and thereby induces signal-deprived cell death selectively in eT reg cells. Conditional deletion of TCRs in T reg cells indeed impaired their proliferation and rendered them subject to apoptosis (Levine et al., 2014; Vahl et al., 2014). The active proliferation of eT reg cells can be in large part attributed to their TCR repertoire skewed toward recognizing self-antigens presented by APCs and to their antigen-primed state as exemplified by their high expression of various T cell accessory molecules including adhesion molecules (such as LFA-1; Sakaguchi et al., 2008). Another key factor for T reg cell–specific killing by imatinib is the inherently low level expression of LCK in T reg cells compared with T conv cells, which enables imatinib to further reduce TCR signal selectively in T reg cells at relatively low doses. FoxP3-dependent gene repression appears to be responsible for this T reg cell–specific down-regulation of LCK and ZAP-70 expression (Ohkura et al., 2012). Since LCK and ZAP-70 are the most TCR-proximal kinases, attenuation of these kinases synergistically dampens the down-stream TCR signaling intensity. In addition, the basal level of active pY394-LCK is critical in setting the TCR signaling threshold (Chakraborty and Weiss, 2014; Courtney et al., 2018). Thus, these inherent differences in the amount and activation status of LCK between T reg and T conv cells, together with the highly proliferative basal state of T reg cells, render eT reg cells more sensitive than other T cells to apoptotic cell death due to signal deprivation when imatinib inhibits LCK.
Imatinib exhibits both immune-enhancing and -suppressive effects depending on the dose for treatment. At CML therapeutic doses, imatinib selectively reduces eT reg cells but spares CD8+ T cells in vivo and in vitro, allowing the latter to mediate antitumor immune responses. Imatinib at higher-than-therapeutic doses (over 10 µM), however, unselectively inhibits proliferation of CD4+ and CD8+ T conv cells and T reg cells, killing them, and thereby suppressing immune responses. Dasatinib, which has much higher affinities than imatinib for both BCR-ABL and LCK (>100-fold), shows similar dose-dependent effects. Within its CML therapeutic concentration range, low doses of dasatinib (5–10 nM) selectively inhibit eT reg proliferation in vitro, while higher doses (25–100 nM) indiscriminately inhibit proliferation of all T conv and T reg cells. In contrast, nilotinib, which more specifically inhibits BCR-ABL than imatinib or dasatinib, does not possess a T reg cell–specific differential killing effect in a CML therapeutic dose range in vitro. These results collectively indicate that LCK inhibitors including imatinib, dasatinib, and AMG-47a, but not nilotinib, affect eT reg cells selectively at a low concentration, and indiscriminately all T cell subsets at higher concentrations. In addition to this dose-dependent differential effect on T cell subpopulations in a particular imatinib-treated individual, about a half of imatinib-treated CML patients failed to show reduction of eT reg cells and to attain CMR. This susceptibility and resistance to imatinib-induced eT reg reduction was also evident in healthy individuals at a similar ratio. This resistance can be overcome, at least in vitro, by moderately increasing imatinib dose. Thus, eT reg depletion can be attained in those imatinib-sensitive and -resistant CML patients and healthy individuals by adjusting the dose of imatinib, although increasing the dose may affect T reg cells less selectively.
Imatinib reduces eT reg cells and enhances antitumor immunity but does not cause serious autoimmunity. Genetic deficiency of T reg cells due to FoxP3 mutations causes fatal autoimmunity affecting multiple organs in humans and mice (Sakaguchi et al., 2008; Josefowicz et al., 2012). Moreover, selective depletion of Foxp3-expressing T reg cells in adult mice for a limited period is able to induce various autoimmunities (Asano et al., 1996; Kim et al., 2007; Lahl et al., 2007). Imatinib has been seldom associated with serious immune-related adverse events in its clinical use for the past 15 yr. Similarly, cell-depleting anti-CCR4 mAb, which kills eT reg cells without much affecting naive T reg cells, scarcely elicited serious immune-related adverse events in humans (Ishida et al., 2012; Sugiyama et al., 2013). It is thus likely that imatinib treatment, which selectively affects eT reg cells and spares naive T reg cells, may preserve an adequate reservoir of eT reg cell precursors to suppress autoimmunity.
Imatinib exploits the inherently down-regulated LCK activity in eT reg cells, which are highly proliferative and apoptosis prone, to selectively deplete them. This mechanism of specific depletion of eT reg cells can be applied to designing new immune-enhancing drugs selectively controlling T reg cells by targeting other TCR-proximal signaling molecules such as ZAP-70 for the treatment of cancer and chronic infection. Furthermore, structural addition of LCK inhibition activity to kinase inhibitors targeting oncogenic kinases may confer on them both direct and immunological tumor-killing activity, especially when an on-target oncogene gains drug resistance by mutation. Moreover, one advantage of such T reg cell–depleting drugs is that it is easy to assess their effects and adjust the dose for differentially controlling T reg and T conv cells by monitoring T reg cell number and composition in the peripheral blood. Thus, T reg cell–depleting small molecules could be useful for treatment and prevention of various types of cancer, and presumably of chronic infection.
Materials and methods
Donor samples
Peripheral blood samples were obtained from healthy individuals and CML patients according to the protocols approved by the institutional ethics committee of Osaka University, Akita University, Kyoto University, Mie University, and Landesarztekammer Hessen, Frankfurt. CML patients were enrolled in a multicenter trial (UMIN000004935), which has been reported previously (Shinohara et al., 2013). All healthy donors and CML patients provided written informed consent before sampling according to the Declaration of Helsinki. PBMCs were isolated by density gradient with Ficoll-Paque (GE Healthcare). PBMCs were directly subjected to ex vivo staining for the analyses of FoxP3+CD4+ T cells and activation status of CD8+ T cells.
Flow cytometry staining
PBMCs were directly stained with a combination of the following antibodies. Alexa Fluor 700–conjugated anti-CD3 (UCHT1) mAb, PE-Cy7–conjugated anti-CD8 (RPA-T8) mAb, BD Horizon V500 –conjugated anti-CD8 (RPA-T8) mAb, PE-conjugated anti-CD25 (M-A251) mAb, FITC-conjugated anti-CD33 (P67.6) mAb, FITC-conjugated anti-CD45RA (HI100) mAb, allophycocyanin-cyanine7–conjugated anti-CD14 (MPj9) mAb, peridinin chlorophyll protein complex–cyanine5.5 (PerCP-Cy5.5)–conjugated anti-CD56 (B159) mAb, BD Horizon PE-CF594-conjugated anti-CD57 (NK-1) mAb, FITC-conjugated Lineage Cocktail 1 mAb, PE-CF594–conjugated anti-CD57 (G46-6) mAb, AF647-conjugated anti-CD15s (CSLEX1) mAb, allophycocyanin-conjugated anti-CTLA-4 (BNI3) mAb, FITC-conjugated anti-HLA DR, DP, DQ (Tu39) mAb, PerCP-Cy5.5–conjugated anti-CD86 (2331) mAb, PE-Cy7–conjugated anti-CD80 (L307.4) mAb, and Brilliant Violet (BV) 711–conjugated anti-CD11c (B-ly6) mAb were purchased from BD Bioscience. PE-conjugated anti-FoxP3 (236A/E7) mAb, Fixable Viability Dye eFluor506, PerCP-eFluor710–conjugated anti-CD15 (MMA) mAb, eFlour450-conjugated anti-Ki67 (SolA15) mAb, and PE-Cy7–conjugated anti-CD16 (CB16) mAb were purchased from eBioscience. BV421-conjugated anti-CD3 (UCHT1) mAb, allophycocyanin-Cy7–conjugated anti-CD4 (SK3) mAb, BV421-conjugated anti-CD11b (ICRF44) mAb, PerCP-Cy5.5–conjugated anti-CCR7 (G043H7) mAb, BV421-conjugated anti-CD279 (PD-1; EH12.2H7) mAb, and BV510-conjugated anti-CD40 (5C3) mAb were purchased from BioLegend. FITC-conjugated anti-LAG-3 (17B4) mAb was purchased from Enzo Life Science. PE-conjugated anti–TIM-3 (344823) mAb was purchased from R&D systems. CellEvent Caspase3/7 green detection reagent and SYTOX AADvanced dead cell stain were purchased from Life Technologies. For murine cell staining, BV711-conjugated CD4 (GK1.5) mAb, PE-Cy7–conjugated CD8a (53–6.7) mAb, FITC-conjugated anti-CD44 (IM7) mAb, and allophycocyanin-conjugated anti-CD62L (MEL-14) mAb were purchased from BD Bioscience. PE-conjugated Foxp3 (FJK-16s) mAb, eFluor450-conjugated Ki-67 (SoA15) mAb, and Fixable Viability Dye eFluor780 for dead cell staining were provided by eBioscience. 123count eBeads (eBioscience) were used for cell counting in some experiments according to the manufacturer’s instructions. After washing, cells were analyzed with LSR Fortessa with FACS Diva software (BD Bioscience) and FlowJo software (version 9 or 10; TreeStar).
Intracellular cytokine staining
CD4+ and CD8+ T cells were purified from PBMCs using CD4+ T cell Isolation Kit and CD8 Microbeads, respectively (Miltenyi Biotec), and stimulated for 6 h with PMA/ionomycin (Sigma), and Golgi stop monensin (BD Bioscience) was added for the last 5 h of culture. Cells were stained for cell surface markers and then intracellular cytokines (IFN-γ: 4S.B3; TNF-α: MAb11; and IL-2: MQ1-17H12) after permeabilization using BD Cytofix/Cytoperm Fixation/Permeabilization Kit according to the instructions provided by the manufacturer. After washing, cells were analyzed.
Reagents
Imatinib (Cell Signaling Technology), nilotinib (Toronto Research Chemicals Inc.), and dasatinib (Selleck Chemicals) were dissolved in DMSO at 10 mM stock and stored at −20°C. The stock solutions were diluted into RPMI 1640 containing 10% human AB serum to the indicated concentration.
T cell culture
CD4+ and CD8+ T cells were prepared from PBMCs. CD4+ T cells were sorted into CD45RA+CD25lo naive T reg cells, CD45RA−CD25hi eT reg cells, and CD25− T cells with FACSAria II (BD). Sorted T cells were labeled for 7 min at 37°C with 2.5 µM CFSE and washed two times with RPMI 1640 containing 10% human AB serum. CFSE-labeled T cells were then stimulated with Dynabeads Human T-Activator CD3/CD28 (Life Technologies) with IL-2 (10 U/ml) in the presence/absence of different concentrations of imatinib, nilotinib, or dasatinib. After 5 d, cell proliferation by CFSE dilution and apoptosis by Annexin V and 7-AAD were analyzed. For assessing Ki-67+ eT reg sensitivity, PBMCs were cultured with 5 U/ml IL-2 and imatinib for 5 d and analyzed by FACS. Results were calculated using R (RStudio) with hierarchical clustering and K-means clustering functions. For murine Foxp3+ T reg cells, sorted cells were labeled with CellTrace Violet Cell proliferation dye (Thermo Fisher) and cultured for 4 d.
Assessment of antigen-specific CD8+ T cells
Antigen-specific CD8+ T cells were induced as described previously (Ha et al., 2019; Sugiyama et al., 2013), with some modifications. Whole T cells from PBMCs were stimulated by APCs (T cell–depleted PBMCs) pulsed with 10 µM Melan-A26-35 (EAAGIGILTV; Romero et al., 1997), NY-ESO-1157-165 (SLLMWITQC) peptides (Operon Biotechnology) specific for HLA-A*0201, or NY-ESO-192-100 (LAMPFATPM) peptide specific for HLA-Cw*0304 overnight. After irradiation, APCs were added to round-bottom 96-well plates containing sorted CD8+ T cells. Subsequently, one-half of the medium was replaced with fresh medium containing 20 U/ml IL-2 and 40 ng/ml IL-7 8 h later and repeated twice a week.
Mice and murine tumor models
BALB/c and BALB/c SCID mice were purchased from SLC, Inc. and CLEA Japan, respectively. Foxp3-IRES-GFP knock-in BALB/c mice have been described previously (Ohkura et al., 2012). CT26 colon cancer cells were cultured in RPMI 1640 medium supplemented with 10% FBS and harvested by trypsinization. Harvested cells were washed twice in PBS, and 5 × 10⁵ CT26 cells in 200 µl of PBS were injected subcutaneously into 6-wk-old female mice. Imatinib (0, 10, or 50 mg/kg; Focus Biomolecules) was administered i.p. from day 8 to day 12 after tumor injection in a 24-h interval. Each group contained 9 or 10 BALB/c mice or 8 or 9 BALB/c SCID mice per treatment group. Tumors and spleens were collected on 10 or 15 d after tumor injection and analyzed by FACS after preparing single cells. All mice were maintained in specific pathogen–free facilities and treated in accordance with the institutional guidelines for animal care at the National Cancer Center Japan or Immunology Frontier Research Center, Osaka University.
Western blotting
CD4+ CD45RA+ CD25lo naive T reg cells, CD4+ CD45RA− CD25hi eT reg cells, CD4+ CD45RA+ CD25− T cells, and CD8+ CD45RA+ CD25− T cells from PBMCs were sorted by FACSAria II (BD) and cultured with or without 10 µM imatinib for 1 h. Cells were treated with NP-40 buffer (1% NonidetP-40, 20 mM Tris pH 7.8, 150 mM NaCl, 2 mM MgCl2), supplemented with the protease inhibitors PMSF (1 mM) and CLAP (5 µg/ml each of chymostatin, pepstatin A, antipain hydrochloride, and 10 µg/ml leupeptin hemisulphate) and a phosphatase inhibitor cocktail (Roche), and subsequently with Laemmli buffer. Lysates from 2 × 10⁵ cells from each sample were run on 7.5% polyacrylamide gel. Anti-Lck (3A5) antibody (Santa Cruz Biotechnology) and anti-Phospho-Src family (Y416) antibody (Cell Signaling Technology) were used for detection, and analysis was performed by LAS-4000 with ImageReader program (Fujifilm). Quantification of band signal intensity with background subtraction was calculated by MultiGauge software (Fujifilm).
Quantitative PCR
Total RNA was isolated with an RNeasy Mini Kit (Qiagen) from sorted PBMCs. cDNA was synthesized from 50 ng of total RNA using a SuperScript III RT kit (Invitrogen) and the Oligo(dt) primer in a total volume of 20 µl. Quantitative real-time PCR was performed by a StepOne Plus real-time PCR system (including StepOne software; Applied Biosystems) with each TaqMan probe (TaqMan Gene Expression Arrays; Life Technologies) and TaqMan Gene Expression Master Mix (Life Technologies) according to the instructions provided by the manufacturer.
Foxp3 binding peaks
Foxp3 binding peaks were visualized and analyzed using Integrative Genomics Viewer (Broad Institute) software on data from Birzele et al. (2011) (SRX060160) in the Sequence Read Archive (SRA) database.
Statistical analysis
The significance of difference was assessed by Mann-Whitney U test, two-way ANOVA with Holm-Sidak multiple comparison, and Student’s two-tailed paired t test using Prism version 6 software (GraphPad). P values < 0.05 were considered significant. The area under the ROC curve (AUC) was also assessed by Prism version 6 software (GraphPad). The AUC is a measure of how well a parameter can distinguish between two diagnostic groups (CMR/non-CMR).
Online supplemental material
Fig. S1 shows cell numbers and frequencies of CD4+ T cell subsets including T reg cells in imatinib-treated CML patients either in CMR or non-CMR. Fig. S2 shows T reg cell frequencies in nilotinib-treated CML patients and cell numbers of CD8+ T cell subsets in imatinib-treated CML patients. Fig. S3 shows CD4+ T cell subsets and their cytokine productions from imatinib-treated CML patients. Fig. S4 shows effects of imatinib treatment on proliferation or cytokine production by CD4+ or CD8+ T cells and frequencies of large granular lymphocytes (LGLs) and MDSCs. Fig. S5 shows numbers or ratios of CD8+ T, CD4+ T, and T reg cells in imatinib-treated tumor-bearing mice and stability of Foxp3 expression by imatinib-treated T reg cells, as well as expression levels of molecules targeted by imatinib.
Acknowledgments
We thank Dr. James B. Wing for helpful discussion and critical reading of this manuscript and Ms. K. Teshima, Y. Tada, Y. Funabiki, M. Tanaka, and R. Ishii for technical assistance.
This study was supported by Grants-in-Aid from the Ministry of Education, Culture, Sports, Science and Technology of Japan for Specially Promoted Research (S. Sakaguchi, no. 16H06295), for Scientific Research (S. Sakaguchi, no. 26253030; H. Nishikawa, no. 17H06162, 23300354 and 26290054), and for Young Scientists (A. Tanaka, no. 26860331 and 17K15723); Core Research for Evolutional Science and Technology from Japan Science and Technology Agency (S. Sakaguchi, no. 17gm0410016); Leading Advanced Projects for medical innovation from Japan Agency for Medical Research and Development (S. Sakaguchi, no. 18gm0010005); Ministry of Health, Labor, and Welfare of Japan Health and Labor Sciences Research Grants, Research on Applying Health Technology (H. Nishikawa, H24-Clinical Cancer Research-general-006) and a Cancer Research Institute Clinic and Laboratory Integration Program grant (H. Nishikawa). This study was partly performed as a research program of the Project for Development of Innovative Research on Cancer Therapeutics, Practical Research for Innovative Cancer Control, and Project for Cancer Research and Therapeutic Evolution (S. Sakaguchi, no. 18cm0106303) by Japan Agency for Medical Research and Development.
H. Nishikawa, A. Tanaka, and S. Sakaguchi are the primary inventors on the patent “An immune-stimulatory reagent for tumor immunity and infectious immunity.” The remaining authors declare no competing financial interests.
Author contributions: A. Tanaka, H. Nishikawa, N. Takahashi, and S. Sakaguchi designed the research. A. Tanaka, S. Noguchi, D. Sugiyama, H. Morikawa, D. Ha, Y. Takeuchi, N. Shigeta, Y. Maeda, and T. Saito performed experiments. Y. Shinohara, Y. Kameoka, F. Monma, K. Ohishi, J. Karbach, E. Jäger, K. Sawada, N. Katayama, K. Iwaisako, T. Kitawaki, and N. Takahashi collected samples and obtained clinical data. A. Tanaka, H. Nishikawa, S. Noguchi, N. Takahashi, and S. Sakaguchi analyzed data. A. Tanaka, H. Nishikawa, S. Noguchi, N. Takahashi, and S. Sakaguchi wrote the paper.
References
- Arce Vargas F., Furness A.J.S., Litchfield K., Joshi K., Rosenthal R., Ghorani E., Solomon I., Lesko M.H., Ruef N., Roddie C., et al. TRACERx Lung consortia . 2018. Fc effector function contributes to the activity of human anti-CTLA-4 antibodies. Cancer Cell. 33:649–663.e4. 10.1016/j.ccell.2018.02.010 [DOI] [PMC free article] [PubMed] [Google Scholar]
- Asano M., Toda M., Sakaguchi N., and Sakaguchi S.. 1996. Autoimmune disease as a consequence of developmental abnormality of a T cell subpopulation. J. Exp. Med. 184:387–396. 10.1084/jem.184.2.387 [DOI] [PMC free article] [PubMed] [Google Scholar]
- Baccarani M., Deininger M.W., Rosti G., Hochhaus A., Soverini S., Apperley J.F., Cervantes F., Clark R.E., Cortes J.E., Guilhot F., et al. 2013. European LeukemiaNet recommendations for the management of chronic myeloid leukemia: 2013. Blood. 122:872–884. 10.1182/blood-2013-05-501569 [DOI] [PMC free article] [PubMed] [Google Scholar]
- Balachandran V.P., Cavnar M.J., Zeng S., Bamboat Z.M., Ocuin L.M., Obaid H., Sorenson E.C., Popow R., Ariyan C., Rossi F., et al. 2011. Imatinib potentiates antitumor T cell responses in gastrointestinal stromal tumor through the inhibition of Ido. Nat. Med. 17:1094–1100. 10.1038/nm.2438 [DOI] [PMC free article] [PubMed] [Google Scholar]
- Bates G.J., Fox S.B., Han C., Leek R.D., Garcia J.F., Harris A.L., and Banham A.H.. 2006. Quantification of regulatory T cells enables the identification of high-risk breast cancer patients and those at risk of late relapse. J. Clin. Oncol. 24:5373–5380. 10.1200/JCO.2006.05.9584 [DOI] [PubMed] [Google Scholar]
- Birzele F., Fauti T., Stahl H., Lenter M.C., Simon E., Knebel D., Weith A., Hildebrandt T., and Mennerich D.. 2011. Next-generation insights into regulatory T cells: expression profiling and FoxP3 occupancy in Human. Nucleic Acids Res. 39:7946–7960. 10.1093/nar/gkr444 [DOI] [PMC free article] [PubMed] [Google Scholar]
- Chakraborty A.K., and Weiss A.. 2014. Insights into the initiation of TCR signaling. Nat. Immunol. 15:798–807. 10.1038/ni.2940 [DOI] [PMC free article] [PubMed] [Google Scholar]
- Chen C.I., Maecker H.T., and Lee P.P.. 2008. Development and dynamics of robust T-cell responses to CML under imatinib treatment. Blood. 111:5342–5349. 10.1182/blood-2007-12-128397 [DOI] [PMC free article] [PubMed] [Google Scholar]
- Courtney A.H., Lo W.L., and Weiss A.. 2018. TCR signaling: mechanisms of initiation and propagation. Trends Biochem. Sci. 43:108–123. 10.1016/j.tibs.2017.11.008 [DOI] [PMC free article] [PubMed] [Google Scholar]
- Curiel T.J., Coukos G., Zou L., Alvarez X., Cheng P., Mottram P., Evdemon-Hogan M., Conejo-Garcia J.R., Zhang L., Burow M., et al. 2004. Specific recruitment of regulatory T cells in ovarian carcinoma fosters immune privilege and predicts reduced survival. Nat. Med. 10:942–949. 10.1038/nm1093 [DOI] [PubMed] [Google Scholar]
- Dietz A.B., Souan L., Knutson G.J., Bulur P.A., Litzow M.R., and Vuk-Pavlovic S.. 2004. Imatinib mesylate inhibits T-cell proliferation in vitro and delayed-type hypersensitivity in vivo. Blood. 104:1094–1099. 10.1182/blood-2003-12-4266 [DOI] [PubMed] [Google Scholar]
- Druker B.J., Talpaz M., Resta D.J., Peng B., Buchdunger E., Ford J.M., Lydon N.B., Kantarjian H., Capdeville R., Ohno-Jones S., and Sawyers C.L.. 2001. Efficacy and safety of a specific inhibitor of the BCR-ABL tyrosine kinase in chronic myeloid leukemia. N. Engl. J. Med. 344:1031–1037. 10.1056/NEJM200104053441401 [DOI] [PubMed] [Google Scholar]
- Forrest A.R., Kawaji H., Rehli M., Baillie J.K., de Hoon M.J., Haberle V., Lassmann T., Kulakovskiy I.V., Lizio M., Itoh M., et al. FANTOM Consortium and the RIKEN PMI and CLST (DGT) . 2014. A promoter-level mammalian expression atlas. Nature. 507:462–470. 10.1038/nature13182 [DOI] [PMC free article] [PubMed] [Google Scholar]
- Gannagé M., Abel M., Michallet A.S., Delluc S., Lambert M., Giraudier S., Kratzer R., Niedermann G., Saveanu L., Guilhot F., et al. 2005. Ex vivo characterization of multiepitopic tumor-specific CD8 T cells in patients with chronic myeloid leukemia: implications for vaccine development and adoptive cellular immunotherapy. J. Immunol. 174:8210–8218. 10.4049/jimmunol.174.12.8210 [DOI] [PubMed] [Google Scholar]
- Gnjatic S., Nishikawa H., Jungbluth A.A., Güre A.O., Ritter G., Jäger E., Knuth A., Chen Y.T., and Old L.J.. 2006. NY-ESO-1: review of an immunogenic tumor antigen. Adv. Cancer Res. 95:1–30. 10.1016/S0065-230X(06)95001-5 [DOI] [PubMed] [Google Scholar]
- Ha D., Tanaka A., Kibayashi T., Tanemura A., Sugiyama D., Wing J.B., Lim E.L., Teng K.W.W., Adeegbe D., Newell E.W., et al. 2019. Differential control of human Treg and effector T cells in tumor immunity by Fc-engineered anti-CTLA-4 antibody. Proc. Natl. Acad. Sci. USA. 116:609–618. 10.1073/pnas.1812186116 [DOI] [PMC free article] [PubMed] [Google Scholar]
- Hantschel O., Rix U., and Superti-Furga G.. 2008. Target spectrum of the BCR-ABL inhibitors imatinib, nilotinib and dasatinib. Leuk. Lymphoma. 49:615–619. 10.1080/10428190801896103 [DOI] [PubMed] [Google Scholar]
- Imagawa J., Tanaka H., Okada M., Nakamae H., Hino M., Murai K., Ishida Y., Kumagai T., Sato S., Ohashi K., et al. DADI Trial Group . 2015. Discontinuation of dasatinib in patients with chronic myeloid leukaemia who have maintained deep molecular response for longer than 1 year (DADI trial): a multicentre phase 2 trial. Lancet Haematol. 2:e528–e535. 10.1016/S2352-3026(15)00196-9 [DOI] [PubMed] [Google Scholar]
- Ishida T., Joh T., Uike N., Yamamoto K., Utsunomiya A., Yoshida S., Saburi Y., Miyamoto T., Takemoto S., Suzushima H., et al. 2012. Defucosylated anti-CCR4 monoclonal antibody (KW-0761) for relapsed adult T-cell leukemia-lymphoma: a multicenter phase II study. J. Clin. Oncol. 30:837–842. 10.1200/JCO.2011.37.3472 [DOI] [PubMed] [Google Scholar]
- Josefowicz S.Z., Lu L.F., and Rudensky A.Y.. 2012. Regulatory T cells: mechanisms of differentiation and function. Annu. Rev. Immunol. 30:531–564. 10.1146/annurev.immunol.25.022106.141623 [DOI] [PMC free article] [PubMed] [Google Scholar]
- Kantarjian H., Shah N.P., Hochhaus A., Cortes J., Shah S., Ayala M., Moiraghi B., Shen Z., Mayer J., Pasquini R., et al. 2010. Dasatinib versus imatinib in newly diagnosed chronic-phase chronic myeloid leukemia. N. Engl. J. Med. 362:2260–2270. 10.1056/NEJMoa1002315 [DOI] [PubMed] [Google Scholar]
- Kim J.M., Rasmussen J.P., and Rudensky A.Y.. 2007. Regulatory T cells prevent catastrophic autoimmunity throughout the lifespan of mice. Nat. Immunol. 8:191–197. 10.1038/ni1428 [DOI] [PubMed] [Google Scholar]
- Lahl K., Loddenkemper C., Drouin C., Freyer J., Arnason J., Eberl G., Hamann A., Wagner H., Huehn J., and Sparwasser T.. 2007. Selective depletion of Foxp3+ regulatory T cells induces a scurfy-like disease. J. Exp. Med. 204:57–63. 10.1084/jem.20061852 [DOI] [PMC free article] [PubMed] [Google Scholar]
- Lee K.C., Ouwehand I., Giannini A.L., Thomas N.S., Dibb N.J., and Bijlmakers M.J.. 2010. Lck is a key target of imatinib and dasatinib in T-cell activation. Leukemia. 24:896–900. 10.1038/leu.2010.11 [DOI] [PubMed] [Google Scholar]
- Levine A.G., Arvey A., Jin W., and Rudensky A.Y.. 2014. Continuous requirement for the TCR in regulatory T cell function. Nat. Immunol. 15:1070–1078. 10.1038/ni.3004 [DOI] [PMC free article] [PubMed] [Google Scholar]
- Miyara M., Yoshioka Y., Kitoh A., Shima T., Wing K., Niwa A., Parizot C., Taflin C., Heike T., Valeyre D., et al. 2009. Functional delineation and differentiation dynamics of human CD4+ T cells expressing the FoxP3 transcription factor. Immunity. 30:899–911. 10.1016/j.immuni.2009.03.019 [DOI] [PubMed] [Google Scholar]
- Molldrem J.J., Lee P.P., Wang C., Felio K., Kantarjian H.M., Champlin R.E., and Davis M.M.. 2000. Evidence that specific T lymphocytes may participate in the elimination of chronic myelogenous leukemia. Nat. Med. 6:1018–1023. 10.1038/79526 [DOI] [PubMed] [Google Scholar]
- Morikawa H., and Sakaguchi S.. 2014. Genetic and epigenetic basis of Treg cell development and function: from a FoxP3-centered view to an epigenome-defined view of natural Treg cells. Immunol. Rev. 259:192–205. 10.1111/imr.12174 [DOI] [PubMed] [Google Scholar]
- Nika K., Soldani C., Salek M., Paster W., Gray A., Etzensperger R., Fugger L., Polzella P., Cerundolo V., Dushek O., et al. 2010. Constitutively active Lck kinase in T cells drives antigen receptor signal transduction. Immunity. 32:766–777. 10.1016/j.immuni.2010.05.011 [DOI] [PMC free article] [PubMed] [Google Scholar]
- Nishikawa H., and Sakaguchi S.. 2014. Regulatory T cells in cancer immunotherapy. Curr. Opin. Immunol. 27:1–7. 10.1016/j.coi.2013.12.005 [DOI] [PubMed] [Google Scholar]
- Ohkura N., Hamaguchi M., Morikawa H., Sugimura K., Tanaka A., Ito Y., Osaki M., Tanaka Y., Yamashita R., Nakano N., et al. 2012. T cell receptor stimulation-induced epigenetic changes and Foxp3 expression are independent and complementary events required for Treg cell development. Immunity. 37:785–799. 10.1016/j.immuni.2012.09.010 [DOI] [PubMed] [Google Scholar]
- Onizuka S., Tawara I., Shimizu J., Sakaguchi S., Fujita T., and Nakayama E.. 1999. Tumor rejection by in vivo administration of anti-CD25 (interleukin-2 receptor alpha) monoclonal antibody. Cancer Res. 59:3128–3133. [PubMed] [Google Scholar]
- Romero P., Gervois N., Schneider J., Escobar P., Valmori D., Pannetier C., Steinle A., Wolfel T., Lienard D., Brichard V., et al. 1997. Cytolytic T lymphocyte recognition of the immunodominant HLA-A*0201-restricted Melan-A/MART-1 antigenic peptide in melanoma. J. Immunol. 159:2366–2374. [PubMed] [Google Scholar]
- Saglio G., Kim D.W., Issaragrisil S., le Coutre P., Etienne G., Lobo C., Pasquini R., Clark R.E., Hochhaus A., Hughes T.P., et al. ENESTnd Investigators . 2010. Nilotinib versus imatinib for newly diagnosed chronic myeloid leukemia. N. Engl. J. Med. 362:2251–2259. 10.1056/NEJMoa0912614 [DOI] [PubMed] [Google Scholar]
- Saito T., Nishikawa H., Wada H., Nagano Y., Sugiyama D., Atarashi K., Maeda Y., Hamaguchi M., Ohkura N., Sato E., et al. 2016. Two FOXP3(+)CD4(+) T cell subpopulations distinctly control the prognosis of colorectal cancers. Nat. Med. 22:679–684. 10.1038/nm.4086 [DOI] [PubMed] [Google Scholar]
- Sakaguchi S., Yamaguchi T., Nomura T., and Ono M.. 2008. Regulatory T cells and immune tolerance. Cell. 133:775–787. 10.1016/j.cell.2008.05.009 [DOI] [PubMed] [Google Scholar]
- Sakaguchi S., Miyara M., Costantino C.M., and Hafler D.A.. 2010. FOXP3+ regulatory T cells in the human immune system. Nat. Rev. Immunol. 10:490–500. 10.1038/nri2785 [DOI] [PubMed] [Google Scholar]
- Sallusto F., Lenig D., Förster R., Lipp M., and Lanzavecchia A.. 1999. Two subsets of memory T lymphocytes with distinct homing potentials and effector functions. Nature. 401:708–712. 10.1038/44385 [DOI] [PubMed] [Google Scholar]
- Sasada T., Kimura M., Yoshida Y., Kanai M., and Takabayashi A.. 2003. CD4+CD25+ regulatory T cells in patients with gastrointestinal malignancies: possible involvement of regulatory T cells in disease progression. Cancer. 98:1089–1099. 10.1002/cncr.11618 [DOI] [PubMed] [Google Scholar]
- Sato E., Olson S.H., Ahn J., Bundy B., Nishikawa H., Qian F., Jungbluth A.A., Frosina D., Gnjatic S., Ambrosone C., et al. 2005. Intraepithelial CD8+ tumor-infiltrating lymphocytes and a high CD8+/regulatory T cell ratio are associated with favorable prognosis in ovarian cancer. Proc. Natl. Acad. Sci. USA. 102:18538–18543. 10.1073/pnas.0509182102 [DOI] [PMC free article] [PubMed] [Google Scholar]
- Seggewiss R., Loré K., Greiner E., Magnusson M.K., Price D.A., Douek D.C., Dunbar C.E., and Wiestner A.. 2005. Imatinib inhibits T-cell receptor-mediated T-cell proliferation and activation in a dose-dependent manner. Blood. 105:2473–2479. 10.1182/blood-2004-07-2527 [DOI] [PubMed] [Google Scholar]
- Shimizu J., Yamazaki S., and Sakaguchi S.. 1999. Induction of tumor immunity by removing CD25+CD4+ T cells: a common basis between tumor immunity and autoimmunity. J. Immunol. 163:5211–5218. [PubMed] [Google Scholar]
- Shinohara Y., Takahashi N., Nishiwaki K., Hino M., Kashimura M., Wakita H., Hatano Y., Hirasawa A., Nakagawa Y., Itoh K., et al. 2013. A multicenter clinical study evaluating the confirmed complete molecular response rate in imatinib-treated patients with chronic phase chronic myeloid leukemia by using the international scale of real-time quantitative polymerase chain reaction. Haematologica. 98:1407–1413. 10.3324/haematol.2013.085167 [DOI] [PMC free article] [PubMed] [Google Scholar]
- Sugiyama D., Nishikawa H., Maeda Y., Nishioka M., Tanemura A., Katayama I., Ezoe S., Kanakura Y., Sato E., Fukumori Y., et al. 2013. Anti-CCR4 mAb selectively depletes effector-type FoxP3+CD4+ regulatory T cells, evoking antitumor immune responses in humans. Proc. Natl. Acad. Sci. USA. 110:17945–17950. 10.1073/pnas.1316796110 [DOI] [PMC free article] [PubMed] [Google Scholar]
- Tanaka A., and Sakaguchi S.. 2017. Regulatory T cells in cancer immunotherapy. Cell Res. 27:109–118. 10.1038/cr.2016.151 [DOI] [PMC free article] [PubMed] [Google Scholar]
- Vahl J.C., Drees C., Heger K., Heink S., Fischer J.C., Nedjic J., Ohkura N., Morikawa H., Poeck H., Schallenberg S., et al. 2014. Continuous T cell receptor signals maintain a functional regulatory T cell pool. Immunity. 41:722–736. 10.1016/j.immuni.2014.10.012 [DOI] [PubMed] [Google Scholar]
- Weisberg E., Manley P.W., Breitenstein W., Brüggen J., Cowan-Jacob S.W., Ray A., Huntly B., Fabbro D., Fendrich G., Hall-Meyers E., et al. 2005. Characterization of AMN107, a selective inhibitor of native and mutant Bcr-Abl. Cancer Cell. 7:129–141. 10.1016/j.ccr.2005.01.007 [DOI] [PubMed] [Google Scholar]
- Weisberg E., Manley P.W., Cowan-Jacob S.W., Hochhaus A., and Griffin J.D.. 2007. Second generation inhibitors of BCR-ABL for the treatment of imatinib-resistant chronic myeloid leukaemia. Nat. Rev. Cancer. 7:345–356. 10.1038/nrc2126 [DOI] [PubMed] [Google Scholar]
- Wherry E.J. 2011. T cell exhaustion. Nat. Immunol. 12:492–499. 10.1038/ni.2035 [DOI] [PubMed] [Google Scholar]


