Abstract
We present an RNA-As-Graphs (RAG) based inverse folding algorithm, RAG-IF, to design novel RNA sequences that fold onto target tree graph topologies. The algorithm can be used to enhance our recently reported computational design pipeline (Jain et. al, NAR 2018). The RAG approach represents RNA secondary structures as tree and dual graphs, where RNA loops and helices are coarse-grained as vertices and edges, opening the usage of graph theory methods to study, predict, and design RNA structures. Our recently developed computational pipeline for design utilizes graph partitioning (RAG-3D) and atomic fragment assembly (F-RAG) to design sequences to fold onto RNA-like tree graph topologies; the atomic fragments are taken from existing RNA structures that correspond to tree subgraphs. Because F-RAG may not produce the target folds for all designs, automated mutations by RAG-IF algorithm enhance the candidate pool markedly. The crucial residues for mutation are identified by differences between the predicted and the target topology. A genetic algorithm then mutates the selected residues, and the successful sequences are optimized to retain only the minimal or essential mutations. Here we evaluate RAG-IF for 6 RNA-like topologies and generate a large pool of successful candidate sequences with a variety of minimal mutations. We find that RAG-IF adds robustness and efficiency to our RNA design pipeline, making inverse folding motivated by graph topology rather than secondary structure more productive.
Keywords: RNA As Graphs, RNA sequence design, RNA-like topology, genetic algorithm, automatic mutations
Introduction
Complementing experimental and bioinformatics techniques for designing RNAs for various applications [1–4] are computational methods for RNA inverse folding, i.e., designing novel RNA sequences that fold onto a target secondary (2D) structure or topology. The knowledge obtained from such in silico experiments can be used to infer mechanisms, understand the variety of roles that RNA molecules play in biological systems [5–8], and manipulate RNA building blocks for different applications [9, 10].
A variety of algorithms have been developed for the RNA inverse folding problem. One of the earliest available programs, RNAInverse [11] generates sequences where nucleotides are randomly mutated. Other programs like RNA-SSD [12], INFO-RNA [13], DSS-OPT [14], NUPACK-Design [15], MODENA [16], RNAiFOLD [17] apply techniques like dynamic programming, Newtonian dynamics, genetic algorithms, stochastic sampling, and approaches that satisfy specific design constraints to generate and then optimize candidate sequences. The popular RNA design platform EteRNA [18] provides the users not only with an opportunity to design novel RNAs interactively, but also the possibility of laboratory testing. Various programs are also available for RNA design with multiple targets or general RNA shapes [19, 20].
While most of the programs above design RNA sequences to fold onto a desired 2D structure, graph-based coarse-grained approaches to study, predict, and design RNAs offer a complementary direction. Pioneering work on studying RNA structures using graphs was done in the 1980s [21–23]. Apart from graphs, various other coarse-grained modeling approaches are available to represent RNA structures [24, 25]. Our RNA-As-Graph (RAG) approach systematically represents an RNA 2D structure using planar, undirected tree or dual graphs [26–28]. In the design analogue, we seek to find sequences that fold onto a general fold, defined by a graph topology rather than a specific 2D structure. This offers more flexibility in the design process, as discussed below.
The coarse-grained RNA tree graphs are defined by single-stranded RNA regions as vertices and double-stranded helices as edges [29, 30], simplifying the complexity of the RNA 2D structure (Figure 1). Dual graphs represent RNA helices as vertices and loop strands as edges, and are capable of handling more complex RNA features, like pseudoknots [31–33]. Such graphs representative of RNA 2D structure have also opened usage of graph theory methods, like graph enumeration, to create a library of all possible tree graph topologies up to 13 vertices [31, 34]. Many of these tools are used here for RNA design. For example, graph partitioning approaches can be used to determine similarities among RNA substructures [35] and define subgraphs of RNA as building blocks for design. Our RAG-based algorithm for RNA structure prediction, RAGTOP (RNA-As-Graphs Topology Prediction), builds 3D tree graphs from RNA 2D structures and generates candidate graph topologies using Monte Carlo sampling, guided by a knowledge-based potential function derived from known RNA structures [36, 37]. Our related fragment assembly for RNA-As-Graphs (F-RAG) builds three-dimensional (3D) atomic models from RAGTOP’s predicted graphs by coarse-grained graph partitioning and all-atom fragment assembly [38].
Fig. 1.
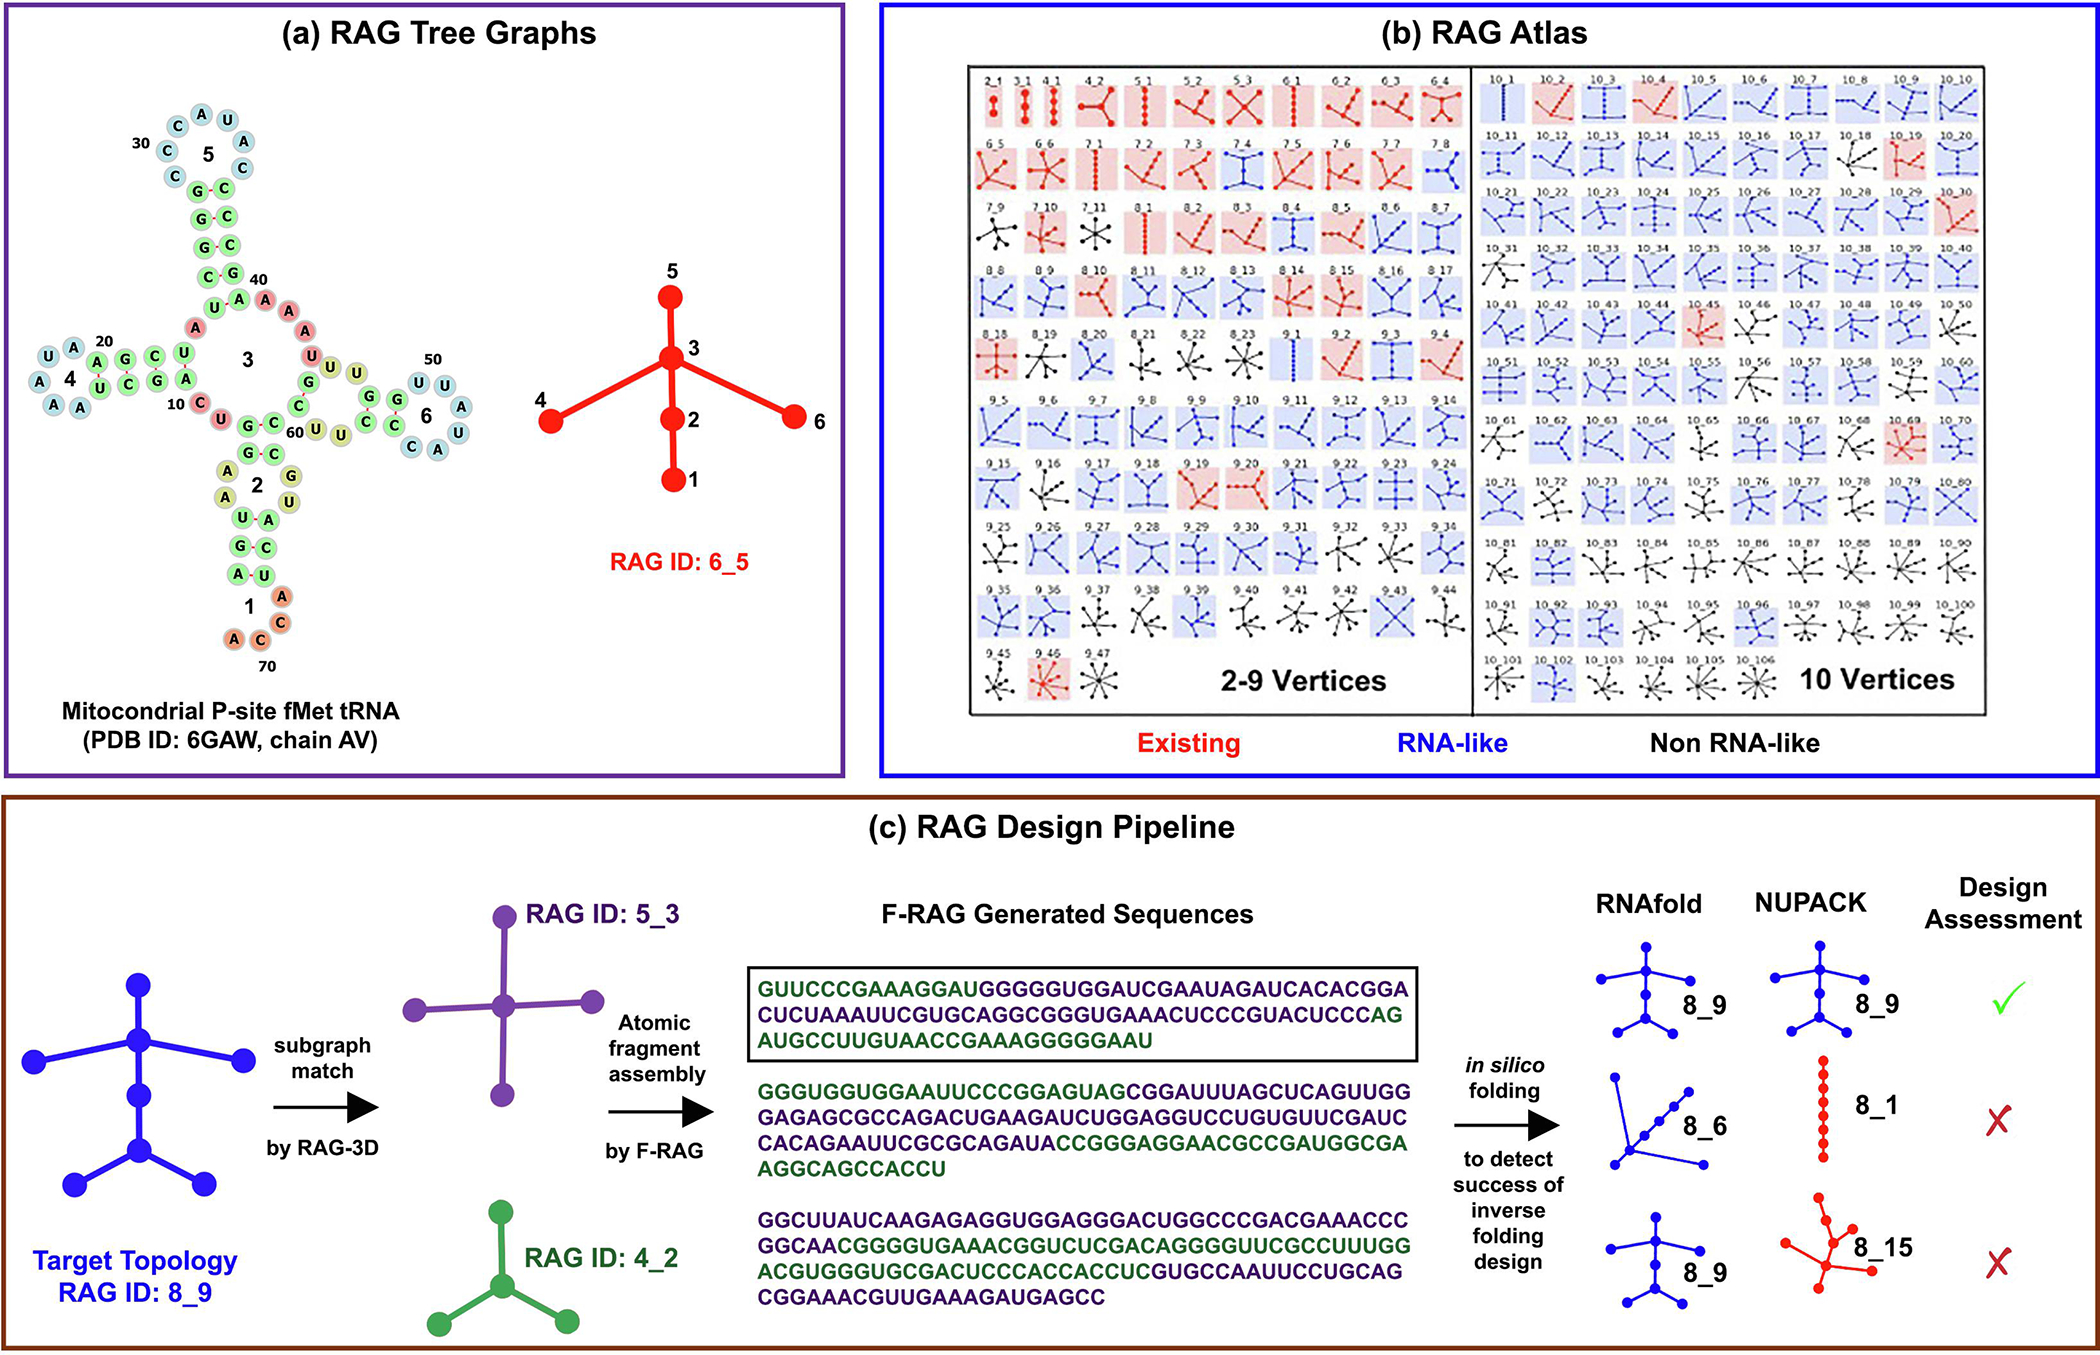
Overview of RAG tree graphs and computational design pipeline (see ‘Materials and Methods’). (a) The 2D structure of a mitochondria P-site tRNA (PDB ID: 6GAW, chain AV) has 6 vertices and corresponds to the 6_5 tree graph topology. (b) RAG atlas of tree graph topologies, shown here up to 10 vertices. (c) The target topology for design (8_9) is partitioned into two subgraphs (5_3 and 4_2) by RAG-3D and the corresponding fragments from the RAG-3D database are assembled by F-RAG to generate novel sequences. The top unique sequences (3 shown here as example) are then subjected to in silico folding by programs RNAfold and NUPACK. The predicted topologies of these sequences are shown under the corresponding program headings. Only the sequences that fold onto the target topology by both programs (highlighted in the black box) are considered successful. The rest of the sequences are unsuccessful and are potential candidates for our RAG-IF protocol.
Such approaches present natural candidates for novel RNA design. The enumeration of all possible topologies and connectivities of a tree or dual graph for a given number of vertices makes possible application of clustering techniques to classify these topologies as ‘existing’, ‘RNA-like’, or ‘non RNA-like’ [29, 31, 34]. RNA-like topologies have similar features to existing RNA topologies that correspond to known RNA structures, but corresponding RNA structures have not yet been discovered. Such classification offers us a great opportunity to design novel RNA sequences to fold onto these RNA-like topologies. The ability to design sequences corresponding to a tree graph topology, rather than a specific 2D structure adds flexibility, potentially resulting in more viable sequences.
Recently, we have developed a systematic and computational pipeline to design novel sequences that fold onto target RNA-like topologies [39], building upon ideas first reported in 2014 [40]. Experimental testing by chemical mapping has shown the reliability of our general approach [39]. The design pipeline starts with a user-specified RNA-like topology and partitions it into subgraphs using our program RAG-3D, and corresponding atomic fragments of these subgraphs are extracted from our library of existing RNA substructures (RAG-3D database) [35]. These fragments are then assembled by F-RAG to build a full atomic structure corresponding to the target RNA-like topology. Designed sequences are considered successful if they fold onto the target RAG topology, as determined by two in silico folding programs, RNAfold [41] and NUPACK [15].
Because, not all sequences generated by F-RAG ‘fold’ onto the target topology by both folding programs, an effective remedy is to mutate key nucleotides to tweak the fold and modify any undesired interactions. This approach has proven effective in our recent work [39], where we performed manual point mutations on 12 RNA sequences to ensure successful designs (using EteRNA web interface [18]). However, this trial-and-error process is time-consuming and requires expert knowledge of RNA structures. An automated tool that can mutate the unsuccessfully designed sequences to fold onto the target topology is highly desired, and is the subject of this work. Our goal here is to reduce the number of unsuccessful sequences returned by our design pipeline, with specific and targeted mutations.
Here we develop a RAG-based RNA inverse folding algorithm, RAG-IF, to automatically mutate sequences generated by F-RAG to fold onto target RNA-like topologies, thus reducing the number of unsuccessful sequences and increasing the yield of our design pipeline. The idea is to first identify correlated/common vertices/loops between the in silico predicted and the target topology. Second, we subject nucleotides from uncorrelated vertices and adjacent helices to mutations by a genetic algorithm (GA), and screen these sequences using RNAfold and NUPACK. Third, we optimize successful sequences, leaving only the essential point mutations to maintain the target topology.
We apply our RAG-IF protocol to generate sequences for 6 RNA-like topologies [39]. Our results demonstrate that RAG-IF can rescue most unsuccessful designs and produce a large pool of candidate sequences, with a variety of mutations and 2D structures. We also compare our GA to RNAInverse [11] and show that our GA generates sequences with less mutations (before screening and optimization). Furthermore, RAG-IF can perform targeted tweaks via minimal mutations, which provides robustness and efficiency to our RAG-based design pipeline. The overall large sequence candidate pool with target graph topologies provides us with a valuable starting point for designing RNA molecules in the laboratory with potentially novel biological or clinical applications.
Materials and Methods
Design pipeline overview
RAG represents RNA 2D structures by planar, undirected, connected tree graphs. Unpaired loops including junctions, internal loops and bulges (excluding single-residue ones), hairpin loops, and 5′/3′ ends are represented by vertices, which are connected by base-paired helical regions denoted by edges [29, 31] (see Figure 1a). Our tree graph library consists of all possible connectivities of tree graphs up to 13 vertices, with each topology assigned a unique RAG ID. We have also classified all tree graph topologies by clustering techniques as “existing”, “RNA-like”, and “non RNA-like” (partial RAG library shown in Figure 1b) [29, 31, 34]. Existing topologies correspond to known RNA structures; RNA-like topologies are similar to existing topologies, but have not yet been discovered.
We have recently developed a computational pipeline to design novel sequences that fold onto RNA-like topologies [39]. The design pipeline starts with a target RNA-like topology (e.g., RAG ID 8_9 in Figure 1c), and partitions it into subgraphs (e.g., 5_3 and 4_2) using our graph partitioning tool [40]. Corresponding atomic fragments for both subgraphs are extracted from the RAG-3D database of RNA graphs and associated fragments [35], and are then assembled by F-RAG [38, 39] to build 3D atomic structures of the target RNA-like topology. F-RAG can also be used to design sequences with an additional restriction on a particular internal or hairpin loop to be a given motif (e.g., a GNRA tetraloop or a kink-turn). The resulting atomic models are scored based on our knowledge-based potential used for topology prediction [36, 37], and all unique sequences from the top atomic models are selected for further screening. A sequence is considered to fold successfully onto the target RAG topology if its predicted 2D structures yield the target topology, as determined by two in silico folding programs: RNAfold [41], using minimum free energy (MFE) or centroid structures, and NUPACK [15].
We have used our computational pipeline described above for 6 RNA-like topologies, namely 7_4, 8_4, 8_6, 8_7, 8_9, and 8_12. F-RAG was run for different orientations (i.e., different end/degree-1 vertices are considered as the first vertex, thus providing a unique 5′ to 3′ vertex order) for each target topology, and top 200 unique sequences were selected for screening using RNAfold and NUPACK. For the unrestricted design (i.e., without any loops being restricted to a specific motif), our pipeline successfully designed sequences to fold onto 5 of the 6 topologies (except 8_12) [39].
RAG-IF Components
RAG-IF, sketched in Figure 2, consists of three main components: (1) selecting target residues for mutation based on the tree graph topology and/or vertex differences between the predicted and target topology, (2) mutating the residues to generate a set of candidate sequences that fold onto the target topology using a genetic algorithm, and (3) optimizing the mutations in the candidate sequences to keep only the minimal mutations required to fold onto the target topology. These three components are described in turn below.
Fig. 2.
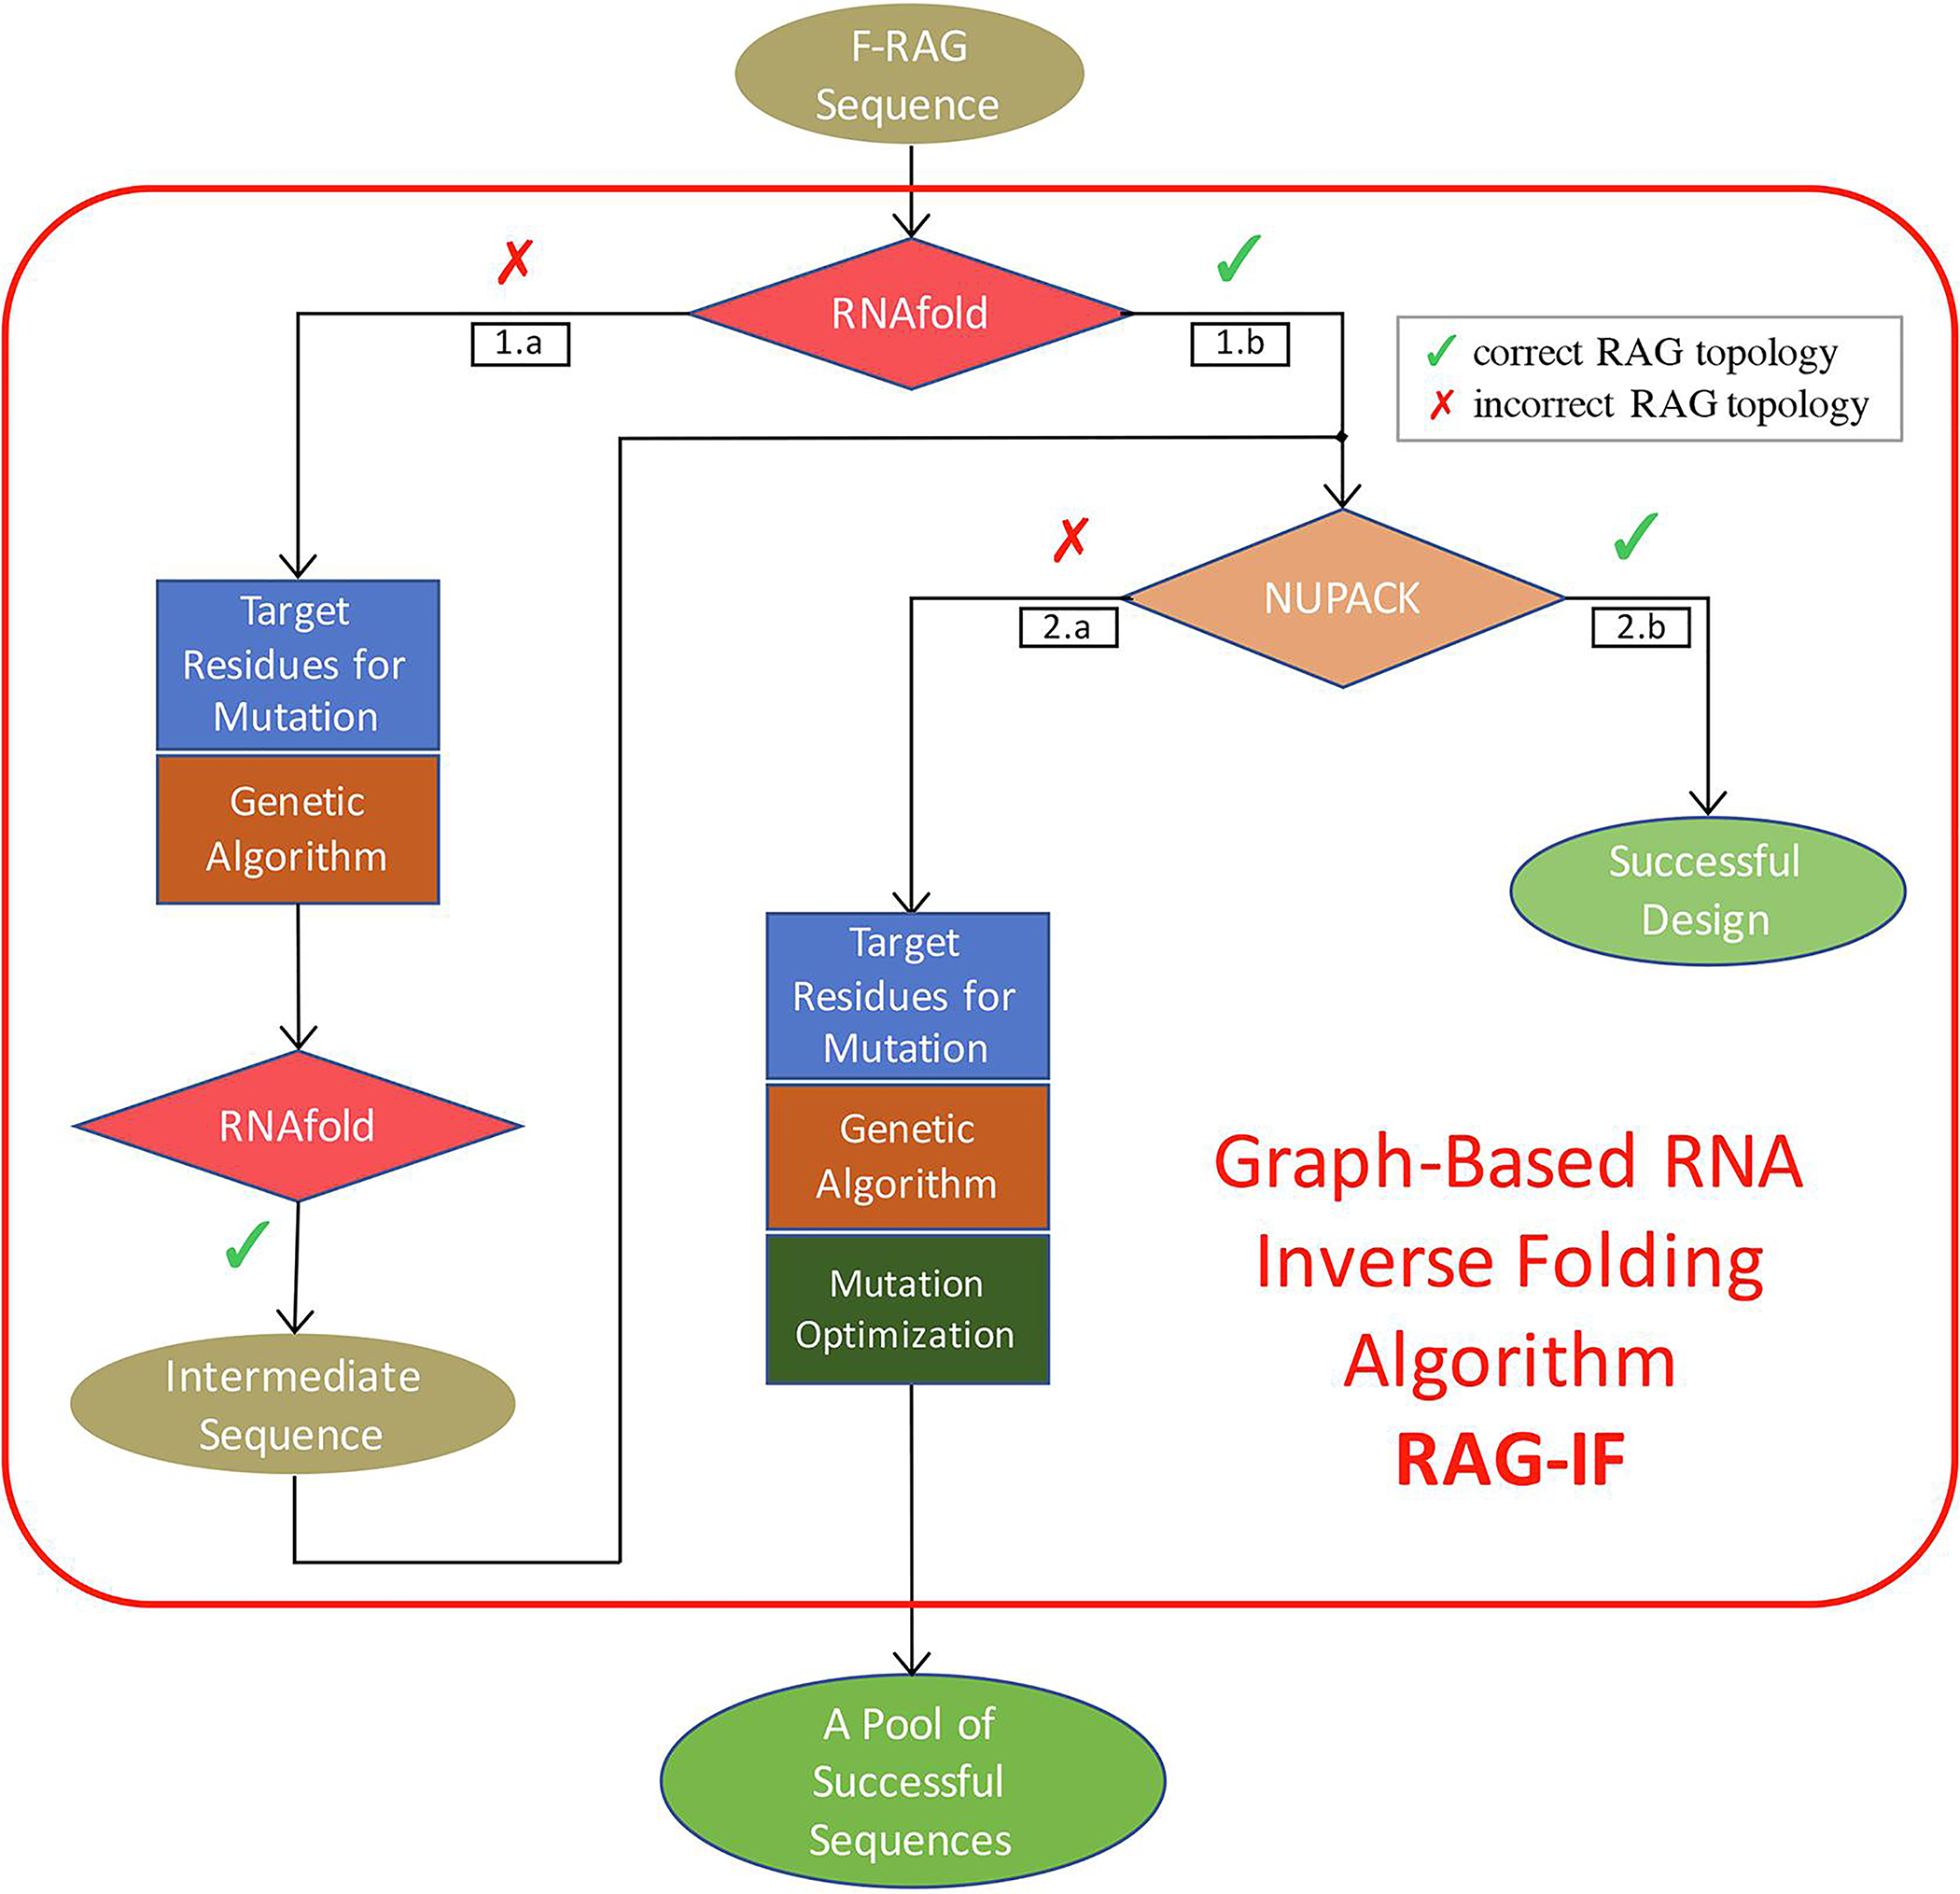
Overview of graph-based RNA inverse folding algorithm (RAG-IF). Detailed descriptions of the three components of the RAG-IF protocol: selecting target residues, mutating the sequences using a genetic algorithm, and optimizing the mutations are given in Subsections ‘Selecting target residues for mutation’, ‘Genetic algorithm for mutating sequences’, and ‘Optimizing the sequence pool’ respectively. For route 1a, the target residues for mutation are calculated based on the correlated vertices between the target and the RNAfold predicted topology. For route 2a, the target residues for mutation are calculated based on the correlated vertices between the RNAfold and NUPACK predicted topology, as RNAfold topology is the same as the target topology after Step 1.
Selecting target residues for mutation
Selecting which residues to mutate in sequences with 100–200 nucleotides is nontrivial. Here we utilize similarities and differences between the sequence’s target and predicted graph topology that graph simplification offers. Specifically, we correlate pairs of vertices between two graph topologies of the same sequence, and use the residues of uncorrelated vertices (including adjacent stems and vertices as required) as target for mutations, as shown in Figure 3 for two sample sequence with target topologies 7_4 and 8_4, and predicted topologies 8_7 and 8_8, respectively.
Fig. 3.
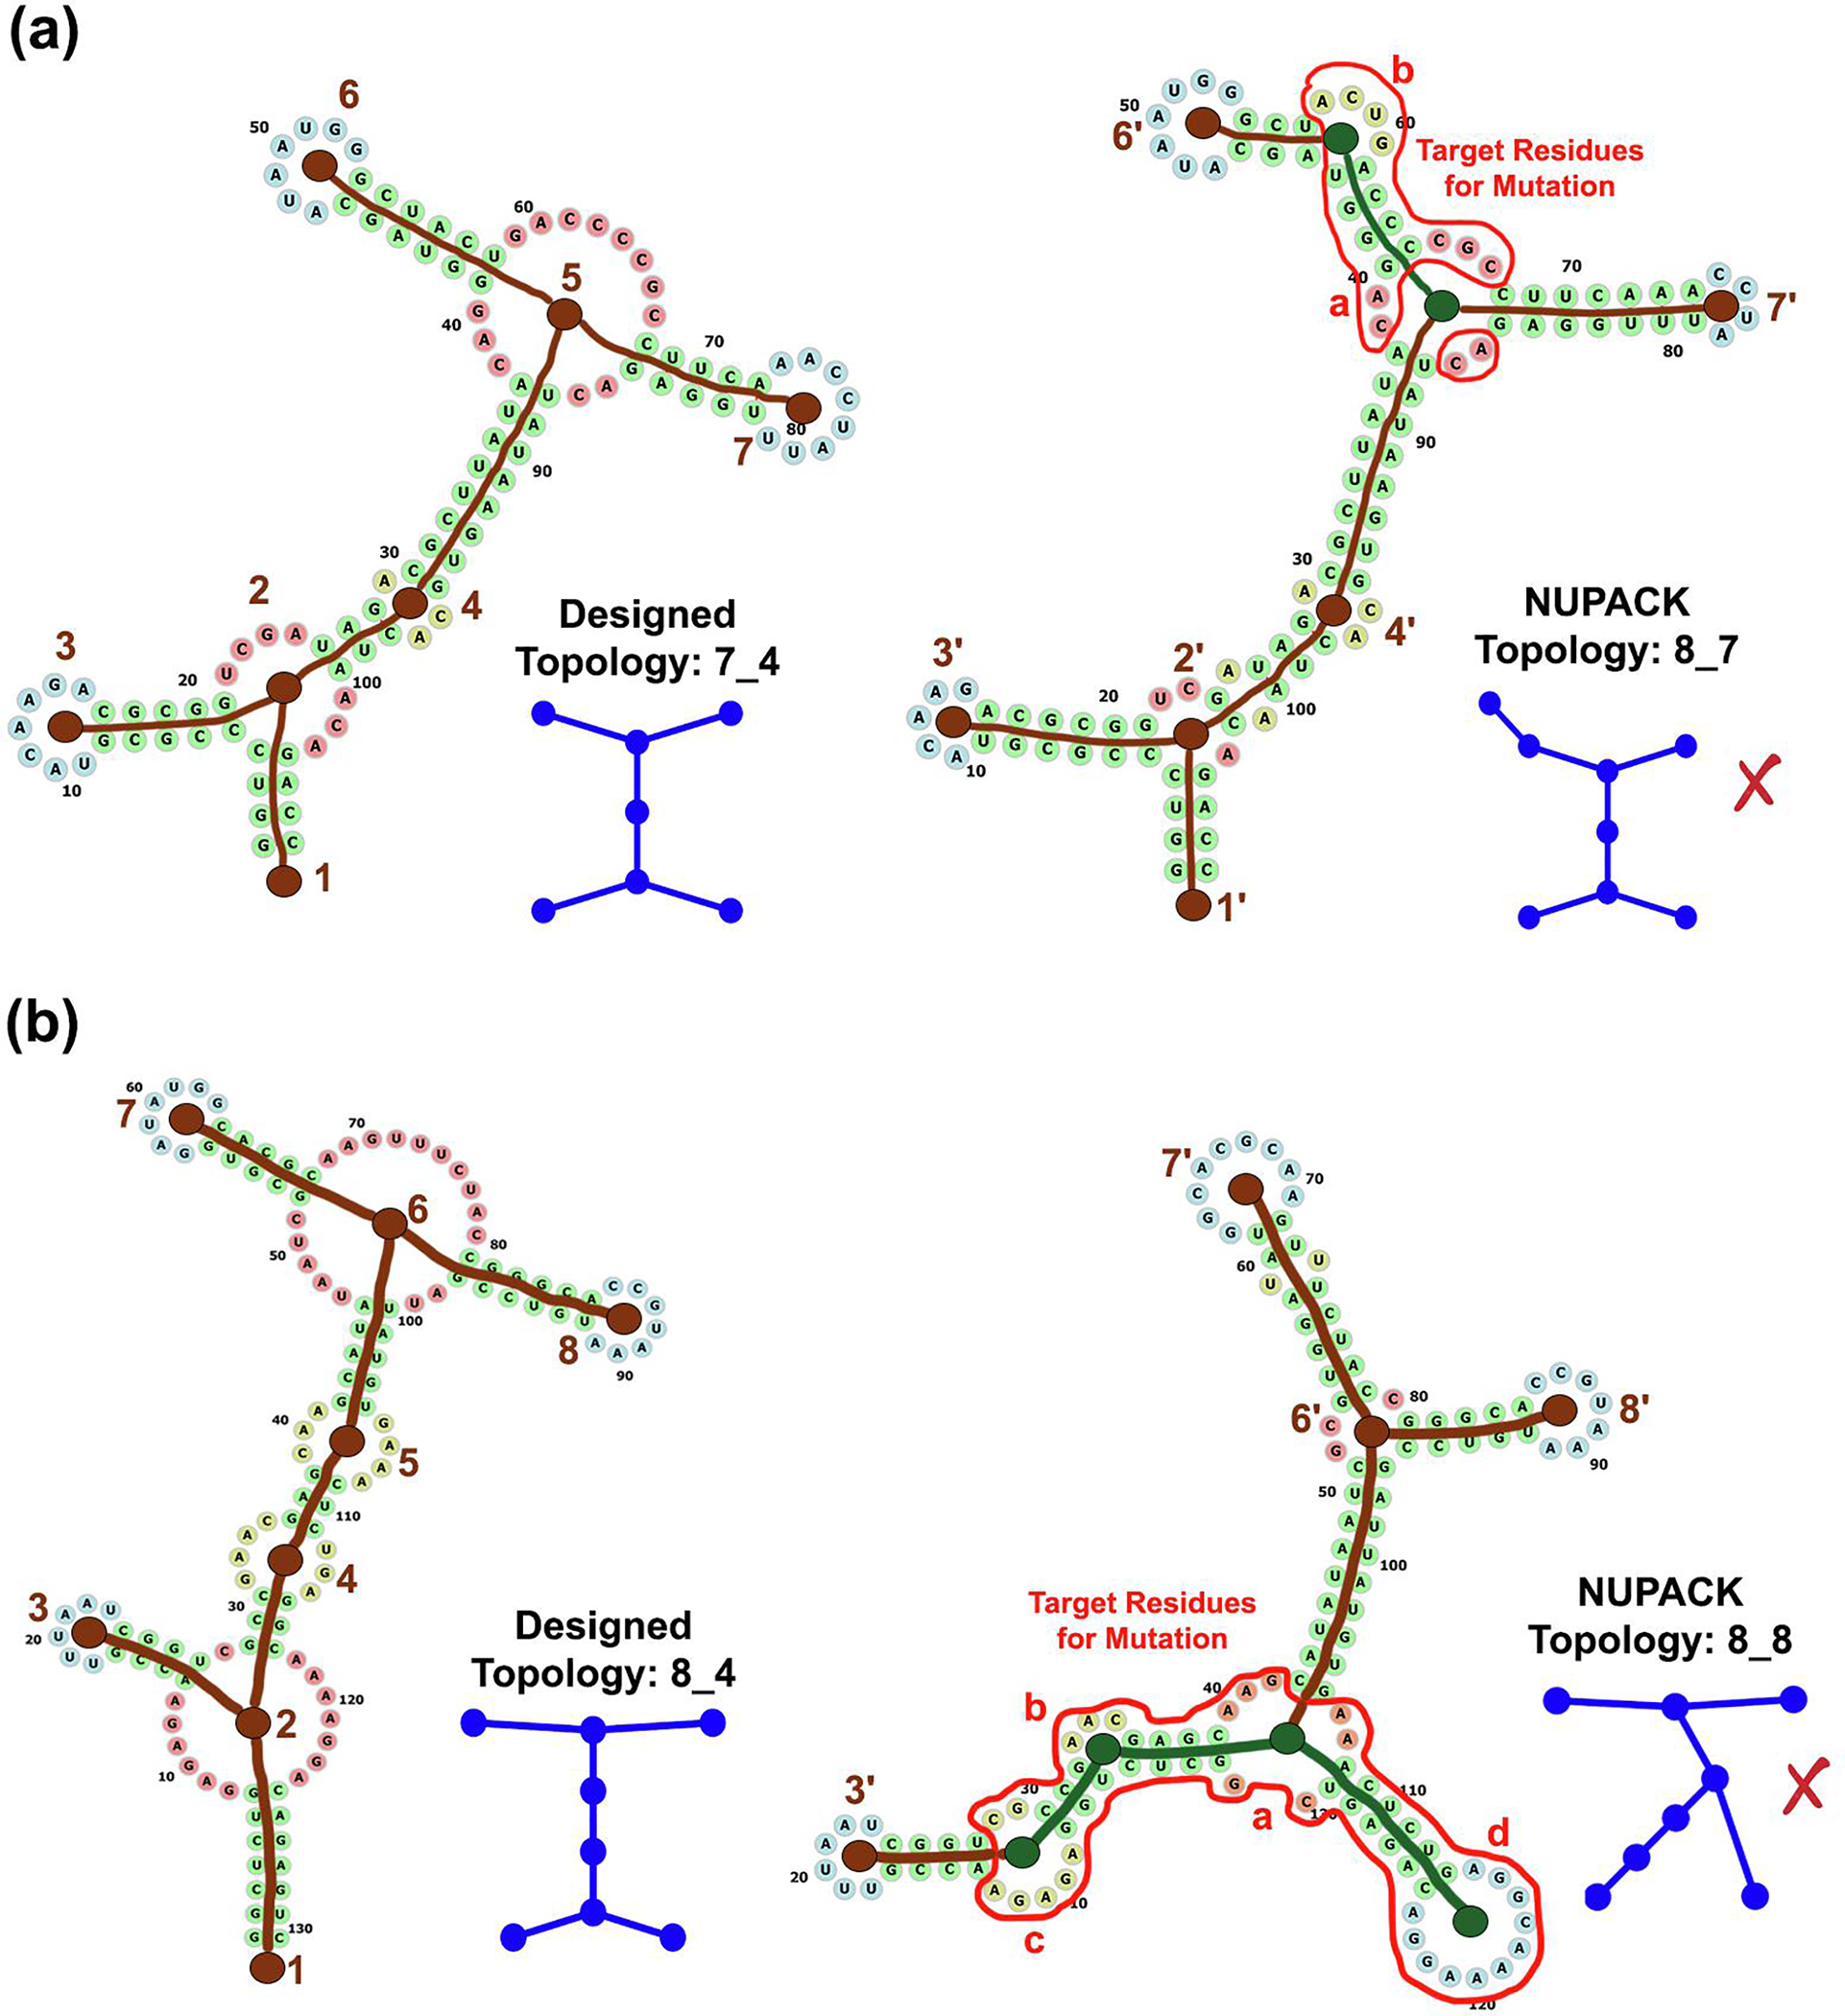
Correlated vertices and residues for mutation. Shown are two example sequences with their designed/target and NUPACK predicted tree graph topologies. Brown vertices are correlated (labeled as n and n′), while the green colored vertices (labelled as a and b in red) are uncorrelated. Residues selected for mutation are enclosed within the red curve.
We consider vertices in two graph topologies “correlated” if any of the following conditions are true:
they contain the same residue numbers, e.g., vertices 4 ≈ 4′ (residues 29, 96, 97), 6 ≈ 6′ (residues 47–53), and 2 ≈ 2′ (residues 22–25, 101–103) in Figure 3a, and vertices 3 ≈ 3′ (residues 18–23) and 8 ≈ 8′ (residues 85–91) in Figure 3b.
some residues of an adjacent edge/stem in one topology are part of the vertex/loop of the second topology, leading to a shrunk or an enlarged loop, e.g., vertices 3 ≈ 3′ (residues 9 and 15 incorporated into the adjacent helix) and 7 ≈ 7′ (residues 73, 74, 79, 80 incorporated into the adjacent helix) in Figure 3a. This condition also covers vertices that contain the 5′/3′ ends (vertices 1 ≈ 1′).
the residue numbers from two vertices and adjacent helices from one topology are redistributed amongst two vertices and adjacent helices in the second topology, e.g., vertices 6, 7 ≈ 6′, 7′ (residues 47–79, 98, 99 redistributed amongst the two vertices and adjacent 3 helices) in Figure 3b.
Once the vertices are correlated, we select residues as targets for mutation as follows:
residues of uncorrelated vertices, e.g., vertices a and b in Figure 3a and vertices a-d in Figure 3b.
residues of helices connecting uncorrelated vertices, e.g., helix between vertices a-b in Figure 3a, and helices between vertices a-b, b-c, and a-d in Figure 3b.
for any helix that connects a correlated and uncorrelated vertex (helices connecting vertices 4′ and a, 7′ and a, and 6′ and b in Figure 3a, and helices connecting vertices 3′ and b, and 6′ and a in Figure 3b), residues of base pairs near the uncorrelated vertex that are not shared by both 2D structures.
Remaining residues, i.e., residues of correlated vertices and connecting helices, are not mutated in our genetic algorithm (described next).
Genetic algorithm for mutating sequences
Once the target residues for mutation are selected as above, we apply a genetic algorithm. Inspired by Darwin’s theory of evolution, genetic algorithms (GA) were originally developed in the 1960s [42] to solve optimization and search problems. A genetic algorithm usually starts with a collection or population of candidate solutions to the optimization problem. Each individual in the population has an associated fitness equal to the objective function being optimized. Each iteration of the GA algorithm “evolves” the population by random mutations and crossover between individuals, followed by selection of the fittest individuals. The GA usually terminates when the average fitness level for the entire population has reached a pre-defined threshold, or a certain population of fit individuals is obtained.
For our purpose, the GA is run separately starting with each unsuccessful sequence. We refer to this original sequence as the ‘starting sequence’, and the residues selected for mutation in Subsection ‘Selecting target residues for mutation’ as ‘mutable or target residues’. The GA is initialized with a population of 500 RNA sequences that are generated from the starting sequence by randomly assigning one nucleotide (A, U, C, or G) to each mutable residue (rest of the residues are kept intact). In addition, 10 out of 500 sequences are identical to the starting sequence to achieve a higher success rate.
The fitness F for a sequence is defined as: F = L − H, where L is the length of the sequence, and H is the Hamming distance, measured as the number of residues with different 2D structures between the target/designed and the predicted 2D structure of the sequence [11]; the higher the fitness of a sequence, the closer its predicted and target 2D structure. For any sequence in the population, we use the MFE 2D structure from RNAfold as its predicted structure. The Hamming distance is calculated as the number of different characters between the predicted and the input target 2D structure, both represented as strings in the dotbracket format. After initialization, the following steps are performed for every iteration of the GA:
-
Mutation: For each RNA sequence in the population, we change the identity of one mutable residue to one of the other three nucleotides based on probability p, which depends on the ranking of its fitness F among the 500 RNA sequences in the population. We set p to 0.3 or 0.75 if the fitness of a sequence is in the top 20% or the bottom 30%, respectively. For the middle 50%, we mutate two mutable residues with p = 0.5.
The mutation rate is high for sequences with lower fitness and low for sequences with higher fitness. This is because we aim to make more changes to weaker candidates and only slight tweaks to good candidates. All mutation rates were set by trial and error; too low a mutation rate leads to a slow algorithm, while a very high mutation rate leads to a random sequence population.
Crossover: For each pair of RNA sequence, i.e., 124,750 pairs for 500 sequences, we associate a crossover event with a probability of 0.25. For every selected pair for crossover, we swap the identity of 4 randomly selected mutable residues. The crossover rate is set to be independent of the sequence length as the main purpose here is to exchange minor information between the sequence population.
Selection: We replace 50 sequences with the lowest fitness with 50 sequences with the highest fitness. In addition, we randomly select one sequence to be replaced by the starting sequence. This ensures correct evolution of the sequence pool.
Nomination: We nominate RNA sequences with high fitness to the “winning” pool. The probability of nomination is 1.0, 0.5, 0.4, 0.2, or 0.15 for an RNA sequence if its Hamming distance (defined above) is 0, 2, 4, 6, or 8, respectively. The nominated sequence still remains in the population, but with a single-point mutation with a probability of 0.75, with the expectation that it leads to another RNA sequence with a similar 2D structure.
For practical implementation, the probability in each of the above steps is simulated by generating a random number between 0.0 and 1.0 (using the random pseudo-random number generator module in Python). The iterations of the GA continue until there are at least 800 sequences in the winning pool, or the execution time exceeds 30 minutes. The winning sequences have a high fitness value, but they are not guaranteed to fold onto the target topology. Therefore, the winning RNA sequences are screened with RNAfold and NUPACK, and the sequences that fold onto the target topology by both programs are reported as candidate or successful sequences for mutation optimization.
Optimizing the sequence pool
Thus far, our successful RNA sequences generated by GA are predicted to fold onto the target topology as determined by both RNAfold and NUPACK folding programs. Due to the stochastic nature of GA, these RNA sequences can have a large number of mutations, all of which may not be required for the sequence to fold onto the target topology. Our computational pipeline described in Subsection “Design pipeline overview” constructs novel sequences by assembling atomic fragments of known RNA structures. Our mutated sequences are thus kept as close as possible to known RNA structures to enhance viability. Therefore, we further identify point mutations that are not necessary and remove them from a successful sequence, leading to an optimal RNA sequence with only “essential or minimal” mutations to fold the sequence onto the target topology. See Supplementary Figure S1 for two examples of the optimization procedure.
The mutation optimization consists of the following steps:
-
Each point mutation is checked determine if removing it would change the tree graph topology, as predicted by the MFE structure of both RNAfold and NUPACK; if not, this mutation is added to the list of mutations to be removed. After all mutations are checked, the list of mutations are removed.
This process is performed recursively until no further point mutations can be deleted. The topologies of the resulting sequence are then checked again, and if required, a set of minimal mutations are added back.
Second, the remaining point mutations are checked again, and removed one at a time if it does not change the topologies.
Third, if any pair of remaining point mutations form a base pair, then both are removed to determine if it changes the topologies. If so, the two mutations are retained; otherwise, the two mutations are removed.
In addition, if the set of mutations for a generated sequence contains the set of minimal mutations identified for any previous sequence, then that sequence is eliminated. Only unique sequences from the resulting optimal sequences are retained and reported as output of our RAG-IF protocol.
Overall RAG-IF protocol
As sketched in Figure 2, the route followed for a given starting sequence generated by F-RAG depends on their predicted tree graph topologies and correlated vertices. If a starting sequence generated by F-RAG is predicted to fold onto the target topology by both RNAfold and NUPACK (indicated by route  in Figure 2), the starting sequence is already a successful design (as described in Subsection ‘Design pipeline overview’), i.e., it folds onto the target graph topology. Note that different 2D structures may map onto the same graph.
If the starting sequence folds onto the target topology by RNAfold and all vertices of the designed and predicted 2D structure are correlated (Subsection ‘Selecting target residues for mutation’), but does not fold onto the target by NUPACK, then RAG-IF is applied to mutate the starting sequence and generate a pool of successful candidates (indicated by route  ).
).
If both programs predict 2D structures that do not fold onto the target topology or all vertices of the RNAfold predicted structure are not correlated (route  in Figure 2), we apply the first two components of RAG-IF to generate new sequences that fold onto the target topology by RNAfold (MFE structure). We choose the sequence with minimum number of mutations as the intermediate sequence, which is then subjected to the full RAG-IF procedure, producing a pool of successful sequences.
Implementation and performance
The three components of RAG-IF are implemented in Python programming language. For in silico folding, we use RNAfold available with the ViennaRNA Package version 2.3.5 and NUPACK version 3.2.2. All computations were performed on an iMac machine, with 3.5 GHz Intel Core i7 processor and 32 GB RAM.
The computation time for GA and the screening of generated sequences using RNAfold and NUPACK depends on the starting sequence, number of mutable residues, whether or not an intermediate sequence needs to be generated, and the number of candidate sequences generated by the GA. Similarly, the computational time for mutation optimization also depends on the number of successful sequences generated by GA and the number of mutations in each sequence. For the sequences used as input for RAG-IF in this paper (Section ‘Results’), the GA and mutation optimization each took between 15 minutes to three hours on the iMac machine.
GA and RNAInverse for comparison
One of the first programs for RNA inverse folding, RNAInverse [11] generates sequences to fold onto a target 2D structure, with the option of providing an input sequence where only specific residues are allowed to mutate. For comparison between the GA component of our RAG-IF protocol and RNAInverse, we ran RNAInverse (available with ViennaRNA version 2.3.5) with the MFE option for evaluating sequences and other default parameters as used on the RNAInverse webserver. Our GA was run as described in Subsection ‘Genetic algorithm for mutating sequences’, without the in silico screening of generated sequences by RNAfold and NUPACK.
For sequences used for comparison, we selected the target residues for mutation as described in Subsection ‘Selecting target residues for mutation’, and then submitted the same input sequence, target residues, and 2D structure to both GA and RNAInverse. Both RNAInverse and GA were run until they produced at least 800 sequences. The number of sequences generated by both GA and RAG-IF were recorded at intervals of 5 seconds. All sequences generated by GA and RNAInverse were used for comparing number of mutations. See ‘Comparison with RNAInverse’ in the Results section for sequences used and analysis of the results.
Results
We run RAG-IF and analyze the results for selected sequences generated by our design pipeline [39] that were unsuccessful, namely sequences that did not fold onto the 6 RNA-like target topologies of 7_4, 8_4, 8_6, 8_7, 8_9, and 8_12. Specifically, among the top 200 unique sequences generated for each target topology by F-RAG (Subsection ‘Design pipeline overview’), we select those sequences for RAG-IF that are predicted to fold onto the target topology by RNAfold (either the MFE or the centroid structure) but not NUPACK. For them, we calculate the number of correlated graph vertices between the target topology and the predicted topology by NUPACK (Subsection ‘Selecting target residues for mutation’), and choose sequences with ≥ 4 correlated vertices, since they are likely to accelerate the search, to perform RAG-IF (as sketched in Figure 2). These selected sequences are termed ‘starting sequences’.
Figures 4–9 show sample starting sequence for each of the 6 RNA-like topologies, along with their target and predicted topologies, residues targeted for mutation, and some resulting successful sequences. To illustrate, we discuss the results for starting sequence 13 of the 7_4 topology (Figure 4) and starting sequence 3 of the 8_12 topology (Figure 9) throughout this section and compare them to the overall trend wherever possible. For sequence 13 in Figure 4 with the target (7_4), RNAfold (7_4), and NUPACK (8_7) topologies, six vertices (namely 1′ - 4′, 6′ - 7′) are correlated, and the residues in the remaining loops/helices are selected for mutation. In cases like sequence 3 in Figure 9, where the RNAfold 2D structure has the correct topology but not all vertices are correlated with the target, we generate an intermediate sequence (Subsection ‘Overall RAG-IF protocol’) as an additional step.
Fig. 4.
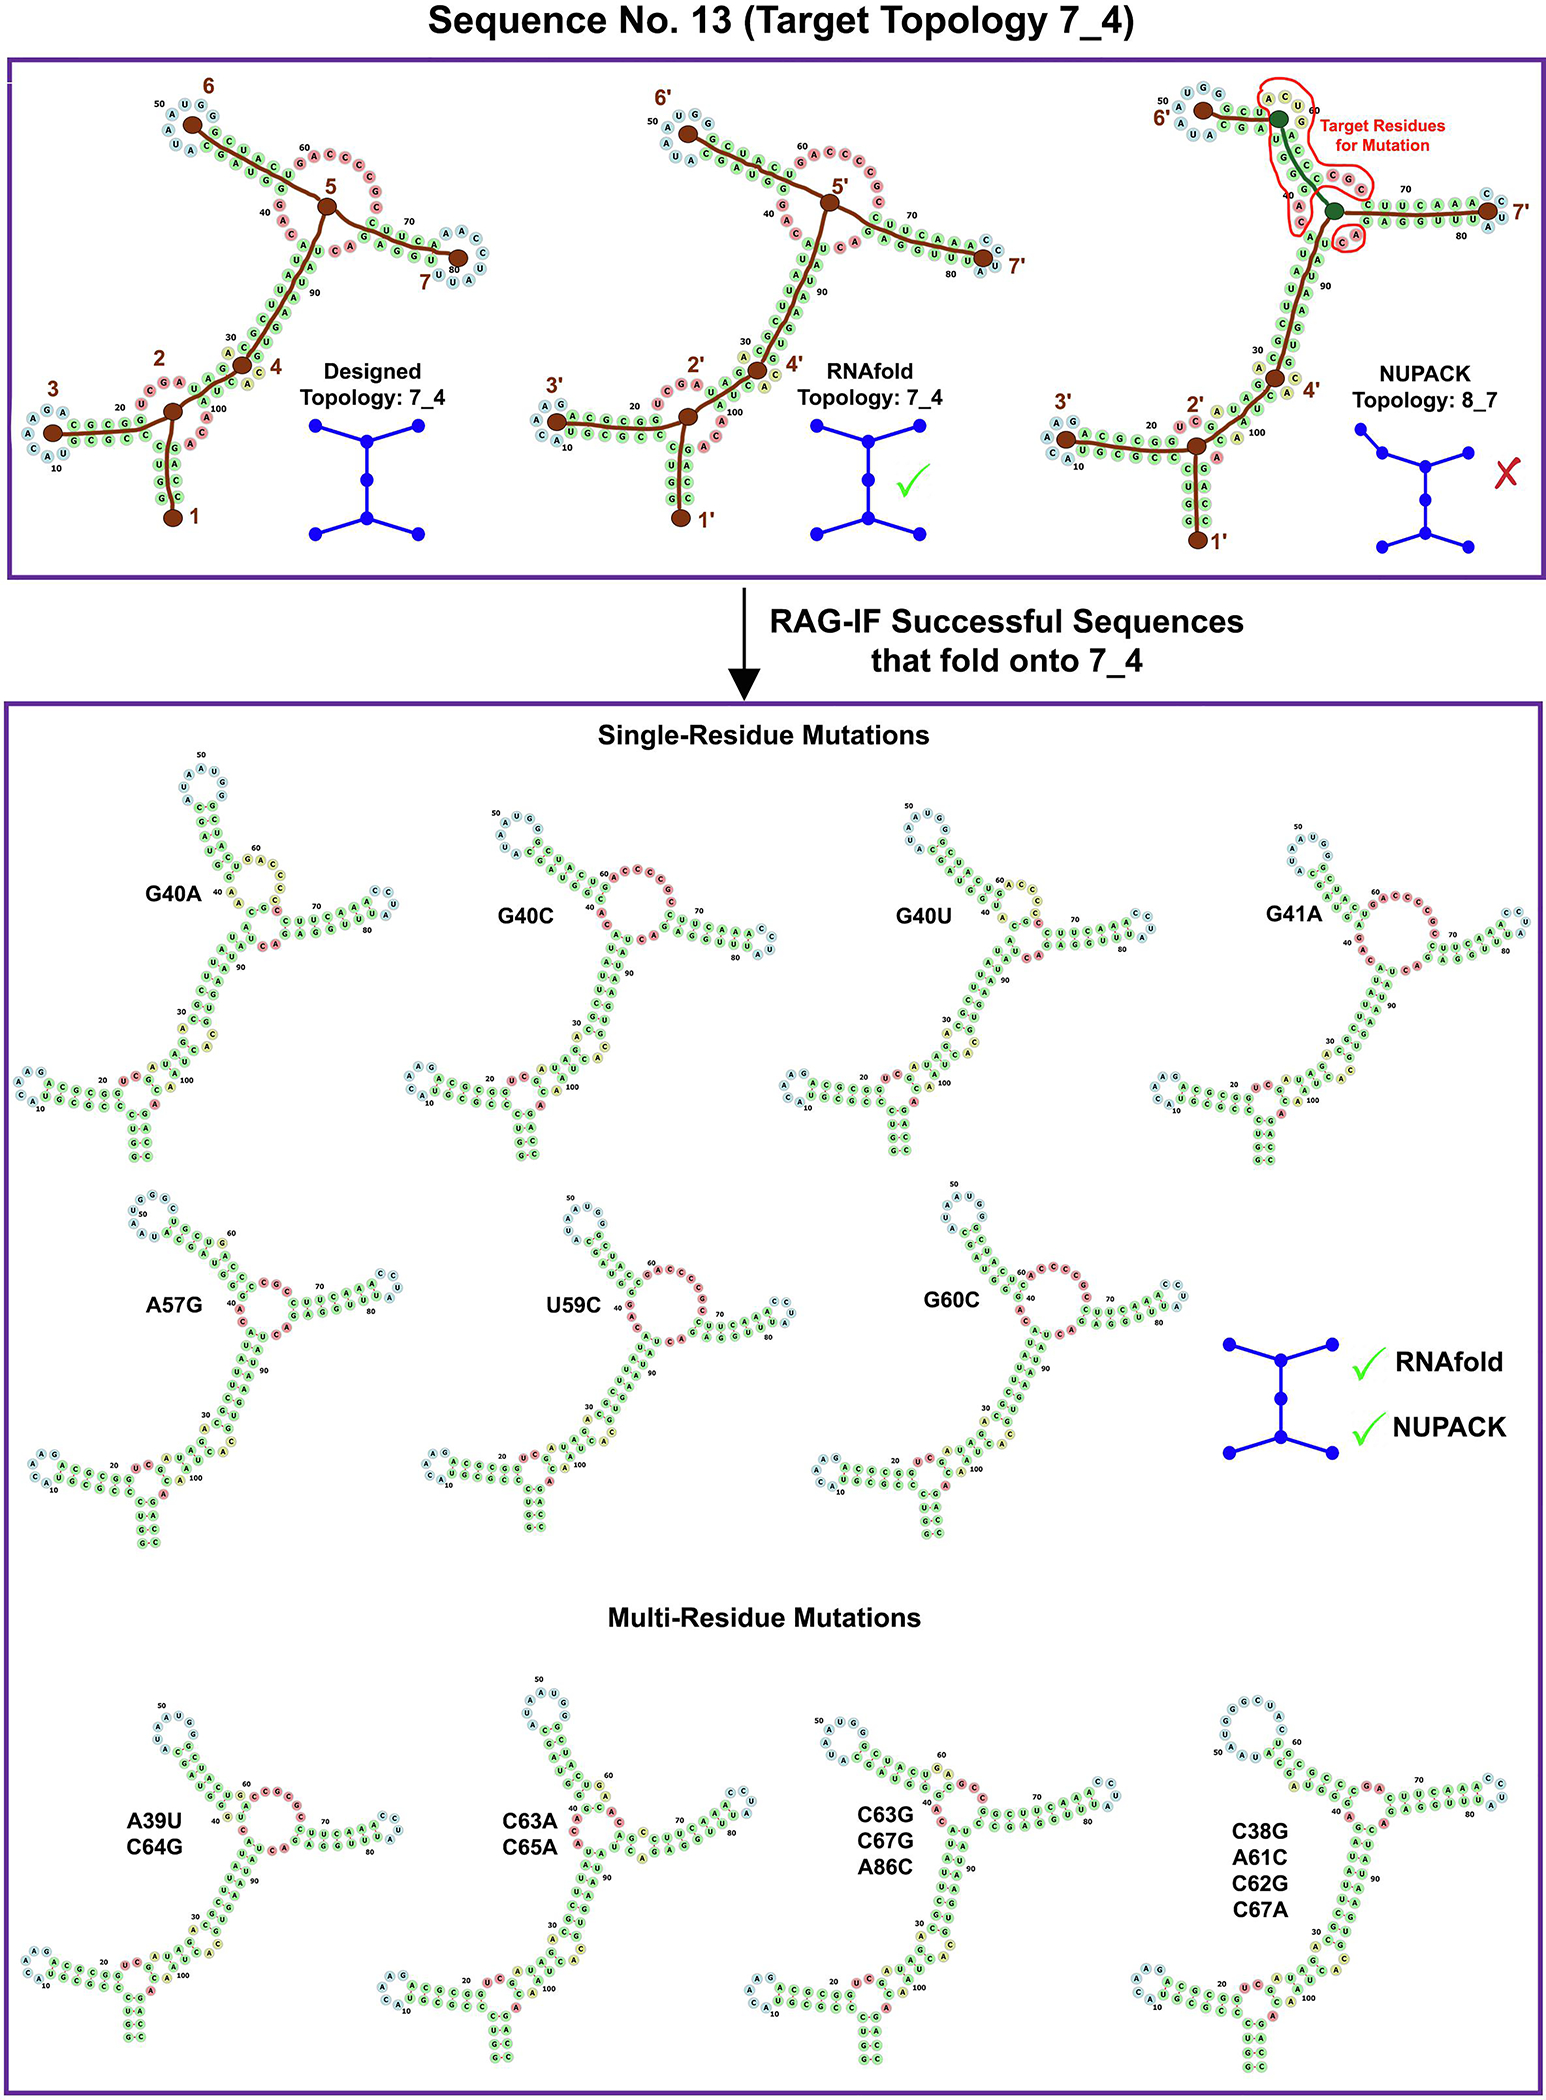
Images for RAG-IF 7_4 design. The designed (7_4), RNAfold predicted (7_4) and NUPACK predicted (8_7) tree graph topology for a sample starting sequence (sequence 13 for 7_4 topology in Figure 10). Brown vertices are correlated (labeled as n and n′), while the green vertices are uncorrelated. Residues selected for mutation are enclosed within the red curve. Also shown are all optimal sequences generated from this starting sequence, with single and multi residue mutations grouped separately. The shown 2D structures of the successful sequences was predicted with NUPACK.
Fig. 9.
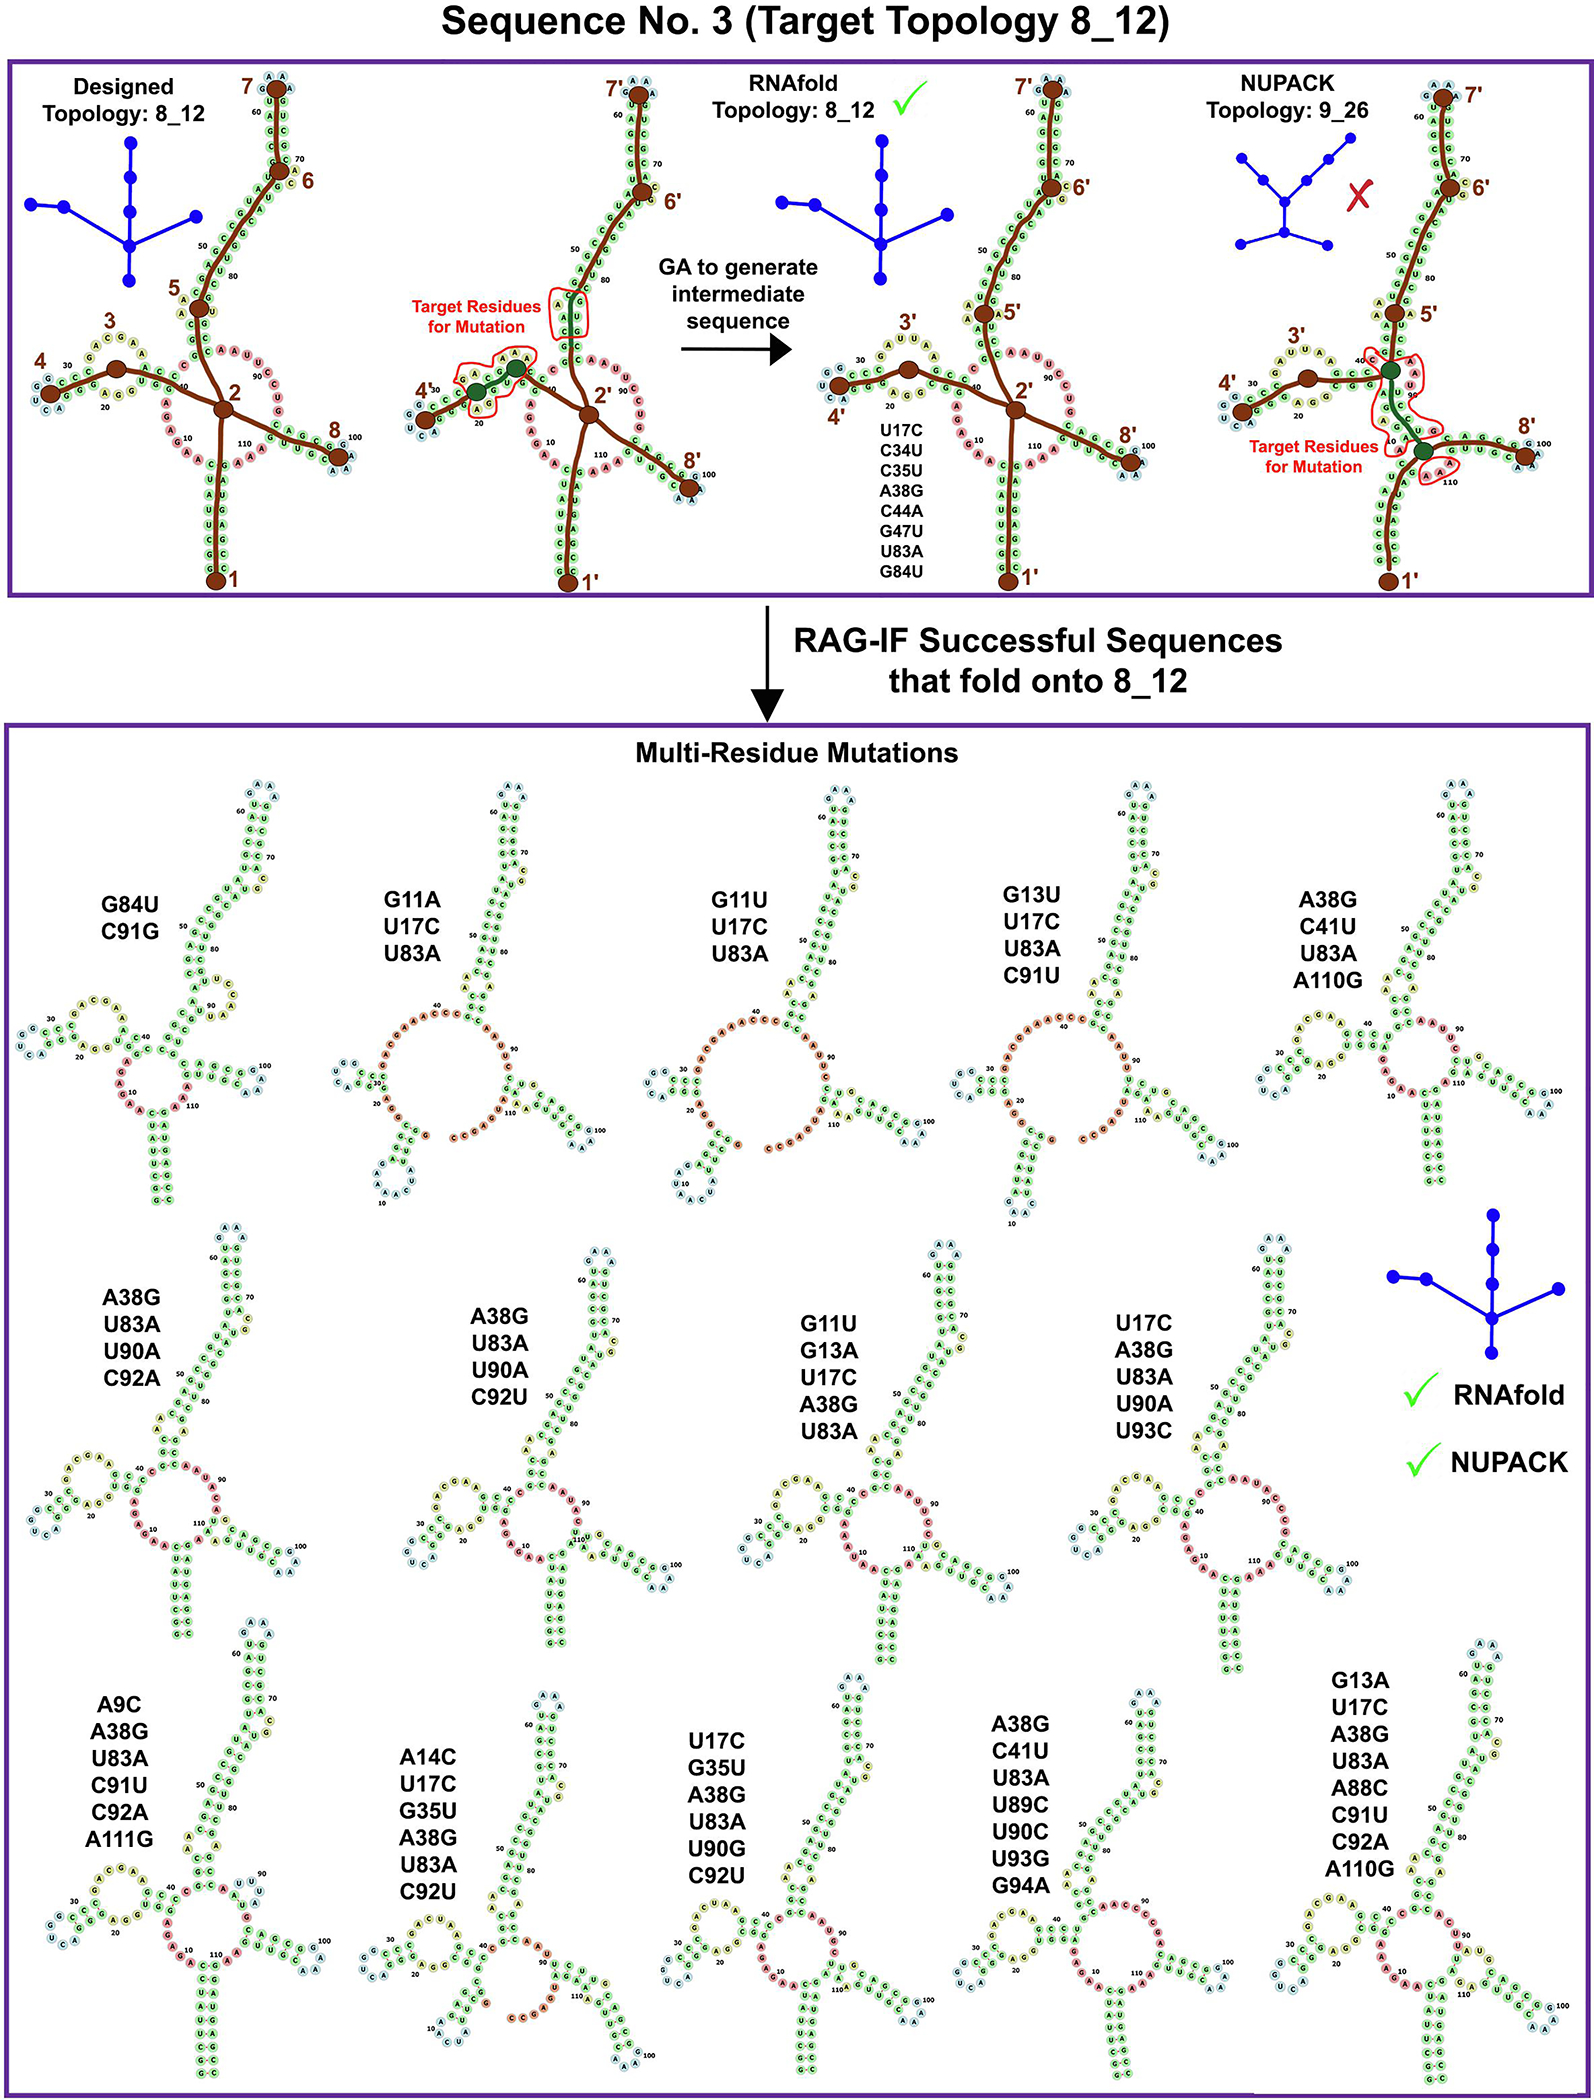
Images for RAG-IF 8_12 design. The designed sequence 3 (in Figure 10) for target topology 8_12 topology is shown. RNAfold topology is the same as the target topology (8_12) but not all vertices are correlated. GA is run to generate an intermediate sequence, with 8 mutations (the intermediate sequence is not mutation optimized). The NUPACK topology of the intermediate sequence is determined (9_26 here) and then subjected to the full RAG-IF protocol. Also shown are 14 of the 15 optimal sequences generated from this starting sequence. See Figure 4 caption for other details.
Table 1 shows the number of starting sequences selected for the 6 RNA-like topologies, number of starting sequences for which RAG-IF produced at least one successful sequence (160 of the 187 total starting sequences), and total number of new successful and optimal sequences produced by RAG-IF, i.e., sequences that fold onto the target topology as predicted by the MFE structures for both RNAfold and NUPACK.
Table 1.
Overall RAG-IF yield. Shown for each RNA-like topology and the number of starting sequences, those among them that lead to at least one successful sequence, and number of successful sequences generated.
| Target Topology | Number of Starting Sequences | Successful Starting Sequences | Optimal Sequences Generated |
|---|---|---|---|
| 7_4 | 27 | 22 | 612† |
| 8_4 | 9 | 5 | 64 |
| 8_6 | 20 | 17 | 493† |
| 8_7 | 26 | 24 | 535† |
| 8_9 | 34 | 24 | 708 |
| 8_12 | 71 | 68 | 3900 |
Some duplicate sequences generated from different starting sequences. The numbers of unique sequences are 609, 492, and 532 for graph topologies 7_4, 8_6, and 8_7, respectively.
Large pool of successful sequences
Figure 10 shows the number of correlated vertices (orange) between the target topology and the NUPACK predicted topology, along with the number of optimal sequences (blue) generated by RAG-IF for each starting sequence for the 6 target tree graph topologies. For most of the starting sequences, RAG-IF can generate multiple optimal sequences, ranging from dozens to more than one hundred. For sequence 13 shown in Figure 4 (6 correlated vertices) and sequence 3 shown in Figure 9 (7 correlated vertices), RAG-IF generates 11 and 15 optimal sequences respectively. Figure 10 also shows that, unexpectedly, the number of optimal sequences generated seems largely independent of the number of correlated vertices for the starting sequence. For the 8_12 topology, most of the starting sequences have 7 correlated vertices, but the number of optimal sequences generated varies significantly; for 7_4 and 8_7 topologies, the starting sequences with lower correlated vertices produce the largest number of optimal sequences (one would expect an opposite trend).
Fig. 10.
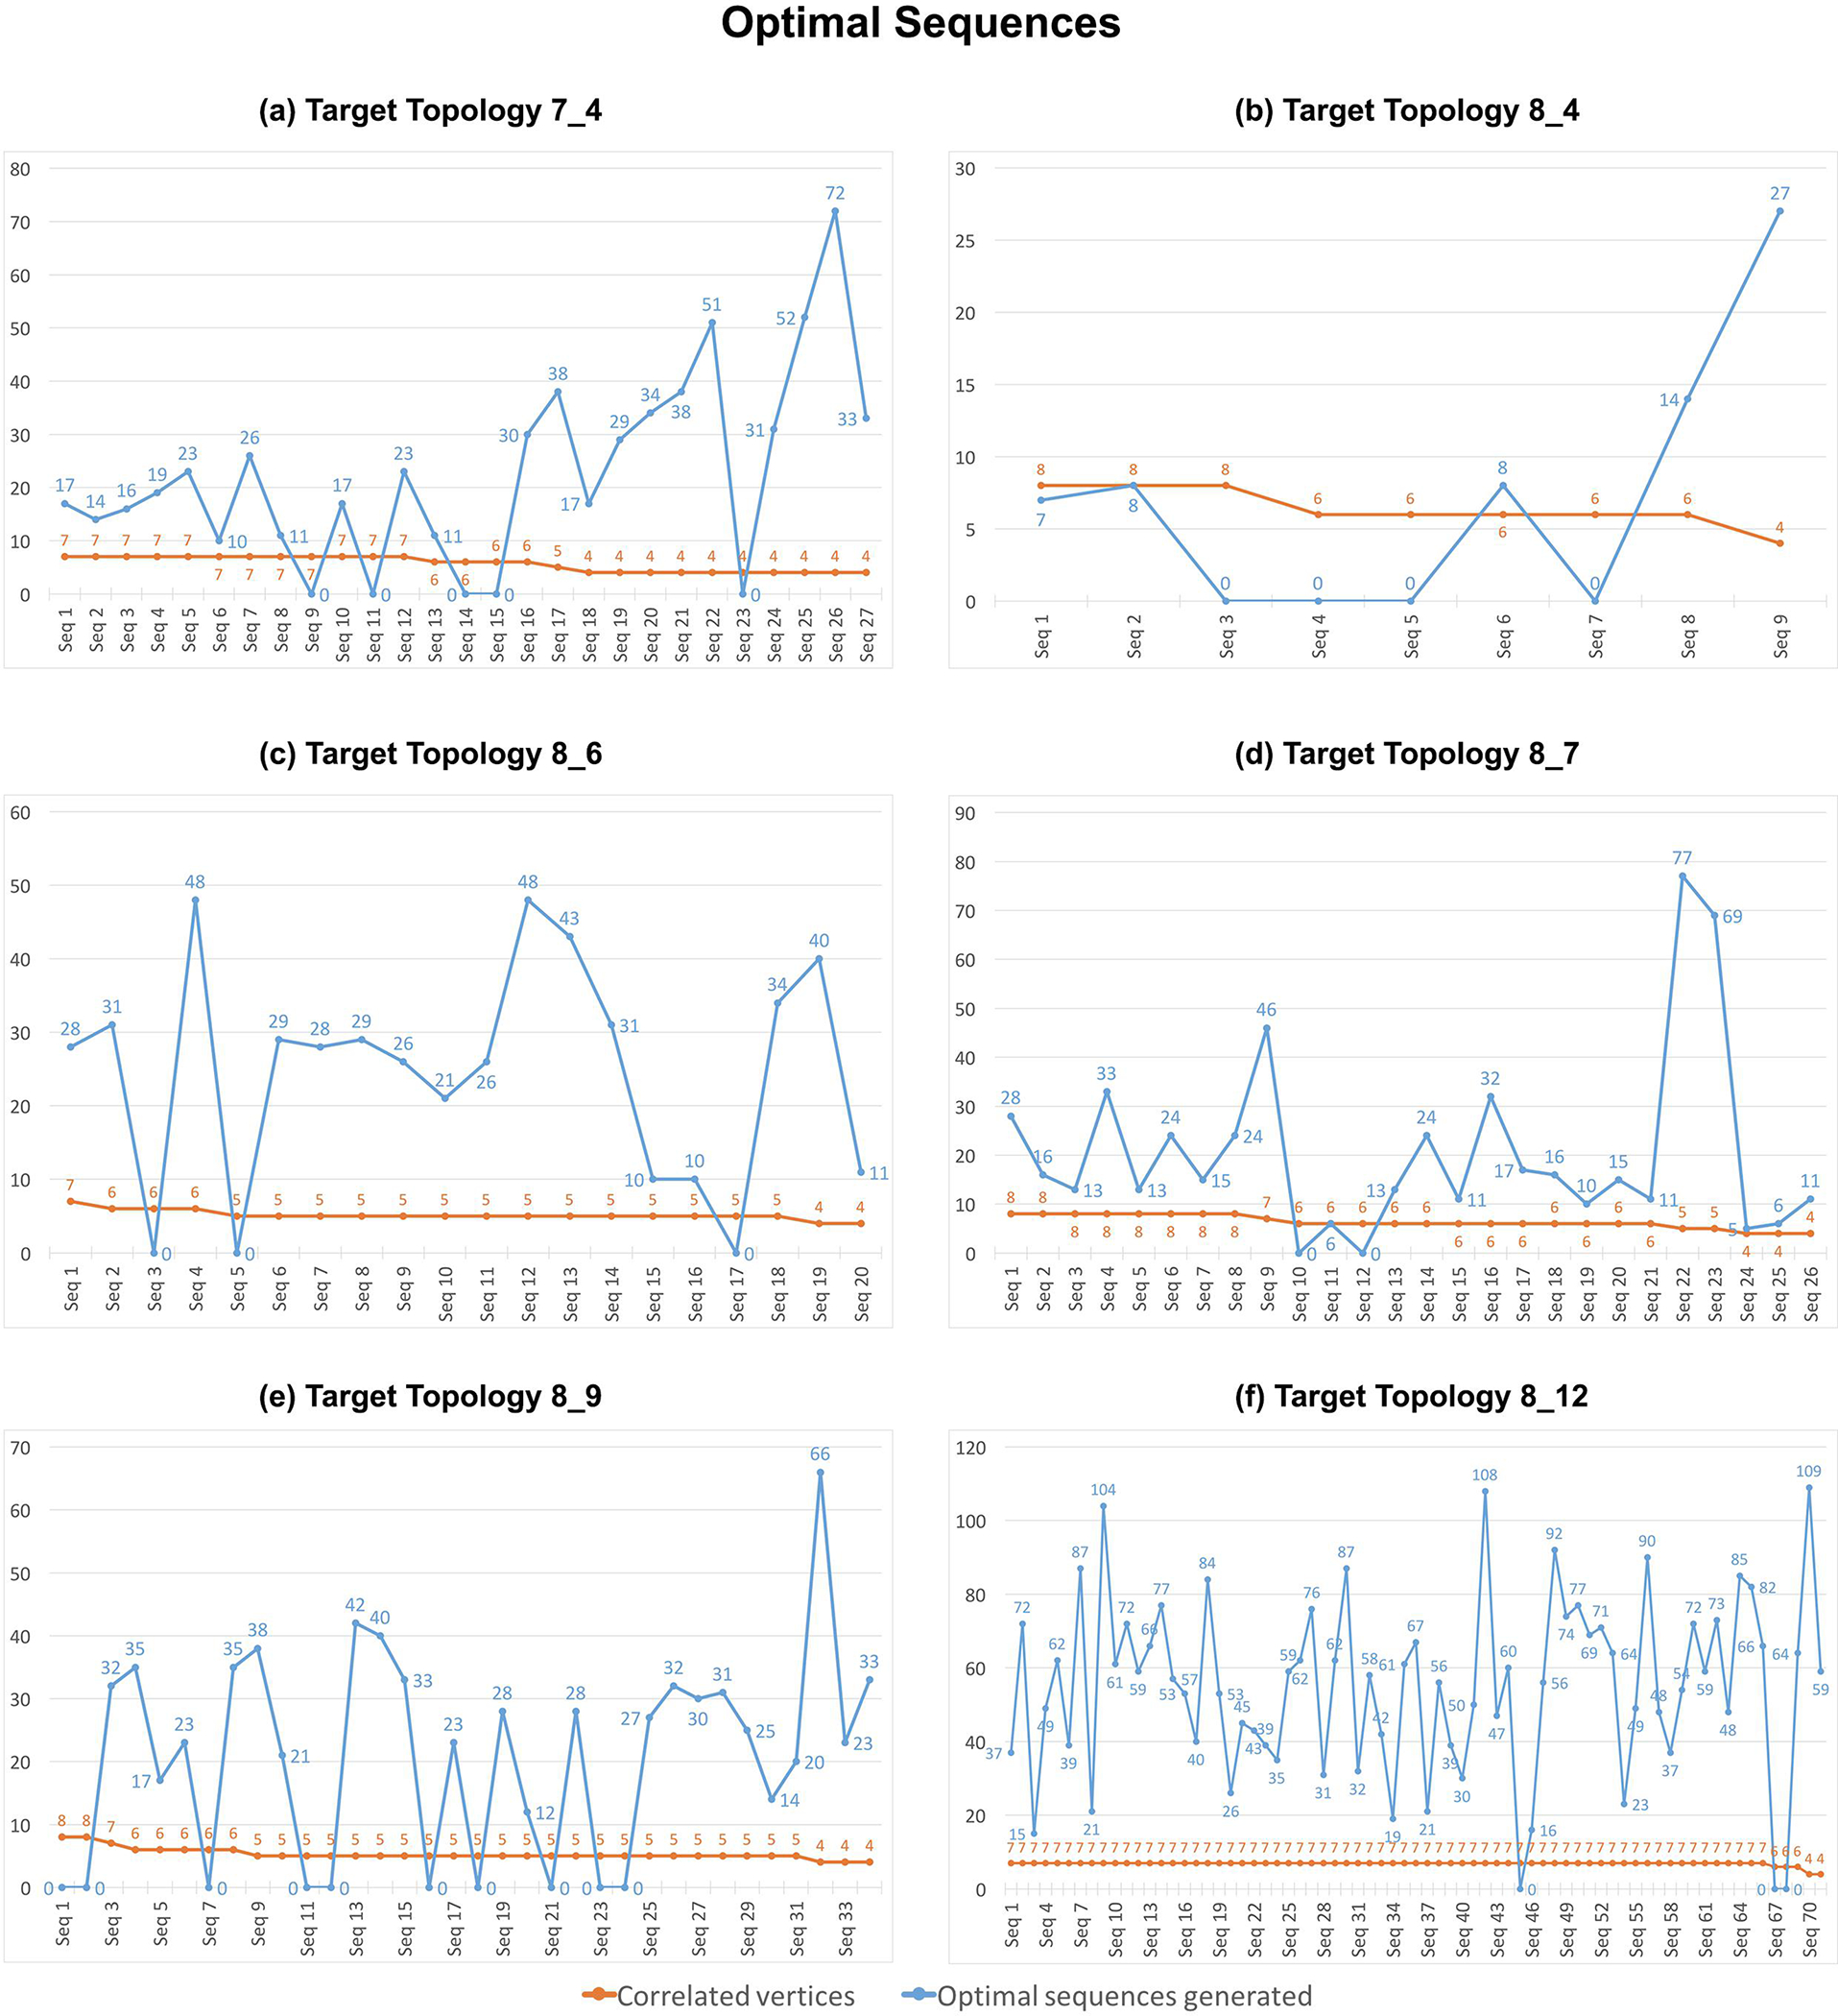
Optimal sequences and correlated vertices. Shown are the number of correlated vertices between the designed and the NUPACK predicted 2D structure (shown in orange) and number of optimal sequences that fold onto the target topology with both RNAfold and NUPACK (shown in blue) generated by RAG-IF for each starting sequence for the 6 RNA-like topologies. The value of 0 on the blue line indicates that no successful sequences were generated by RAG-IF. A sample starting sequence for each target topology, along with its correlated vertices and generated successful sequences are shown in Figures 4–9.
Even though the sequences generated by RAG-IF all fold onto the target topology, there is ample variety in their predicted 2D structures. Figure 11 shows the number of unique 2D structures for the optimal sequences in Figure 10, as predicted by RNAfold (blue) and NUPACK (orange). For example, the 11 sequences generated by RAG-IF from 7_4 topology sequence 13 (Figure 4) and 15 sequences generated from 8_12 topology sequence 3 (Figure 9) correspond to 9 and 12 unique NUPACK 2D structures, respectively. This shows that RAG-IF both generates a variety of successful sequences and a variety of 2D structures with the same graph topology. The diversity in sequences and 2D structures provides us with a greater possibility of experimentally viable sequences, showcasing the flexibility of our RAG based design approach that designs to a more general target topology.
Fig. 11.
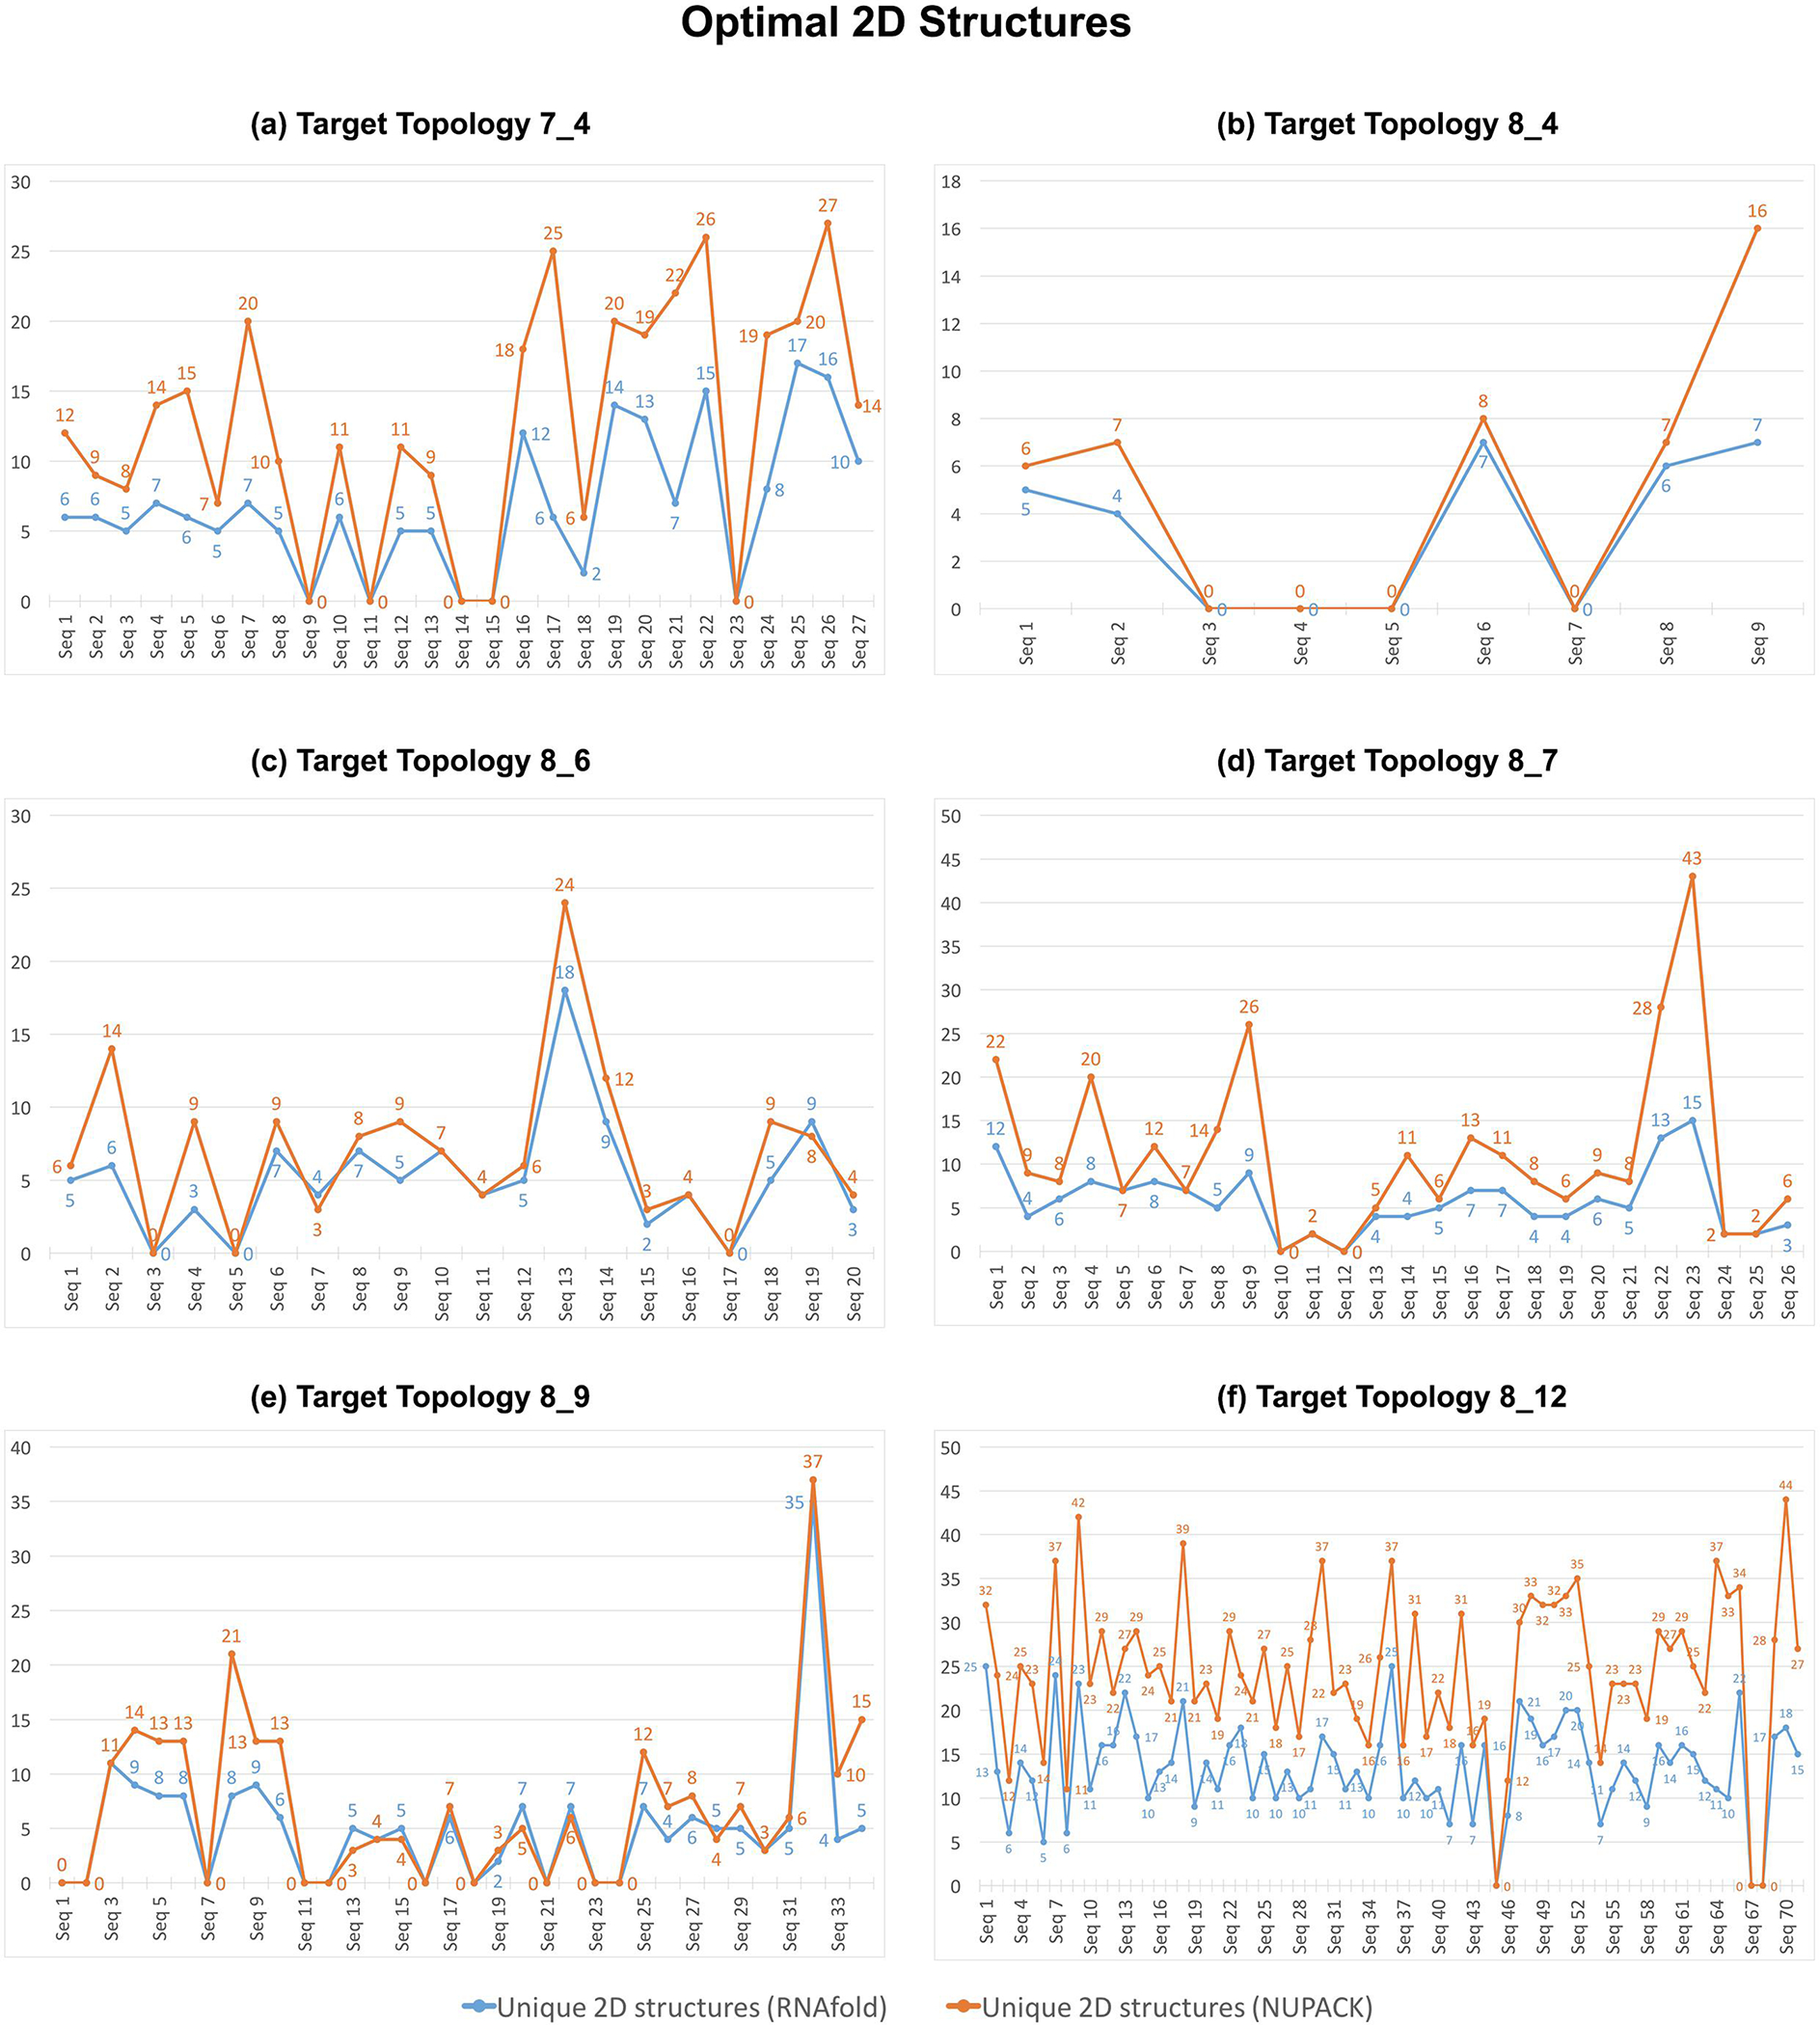
Variety of 2D structures generated. Shown are the number of unique 2D structures for optimal sequences generated (shown in Figure 10) for each starting sequence for 6 RNA-like topologies. The RNAfold 2D structures are shown in blue and NUPACK 2D structures are shown in orange. The value 0 indicates that RAG-IF did not produce any successful sequence. A sample starting sequence for each target topology, along with generated 2D structures for successful sequences are shown in Figures 4–9.
Table 1 lists the total number of optimal sequences generated by RAG-IF for the 6 target topologies. RAG-IF generates ≈ 500 optimal sequences for topologies 8_6 and 8_7, ≈ 600 sequences for 7_4 topology, and ≈ 700 sequences for 8_9 topology (with an average of 20–30 sequences per starting sequence). The number is significantly higher for 8_12 target topology, with 3900 successful sequences. This is significant as our previous computational pipeline did not generate any successful sequences for the unconstrained 8_12 design [39]. On the other hand, RAG-IF generates a smaller number of successful sequences for the 8_4 topology (64), with the average being ≈ 12, which is also lower than the average for other topologies.
For topologies 8_4, 8_9, and 8_12, all optimal sequences generated by RAG-IF are unique. However, for topologies 7_4, 8_6, and 8_7, RAG-IF generates 3, 1, and 3 pairs of duplicate sequences, respectively, by mutating different starting sequences of the same length. The fact that RAG-IF can generate the same sequence by mutating two different sequences lends additional confidence in our generated sequences.
Mutations in optimal sequences
The sequences generated by RAG-IF correspond to different number of minimal mutations. For example, for sequence 13 for 7_4 target topology (Figure 4), RAG-IF generates 7, 2, 1, and 1 sequences with 1, 2, 3, and 4 mutations, respectively. For sequence 3 for 8_12 topology (Figure 9), RAG-IF generates 15 sequences with 2–8 mutations. In Figure 12, we examine the least number of mutations required by each starting sequence that produces results, calculated as the minimum number of mutations among all optimal sequences generated from it. Of the 160 such starting sequences, only 22 sequences from 3 target topologies require at least 3 minimal mutations to fold onto the corresponding target topology. Most of these 22 starting sequences are from the 8_12 topology (18), and 8_4 and 7_4 topologies have 3 and 1 such sequence respectively (sequences listed in Figure 12 caption). This indicates that most of the starting sequences generated by our design pipeline [39] require slight alterations (one or two minimal mutations) to achieve the target fold. See Supplementary Figures S2–S7 for individual mutation distributions for different starting sequences.
Fig. 12.
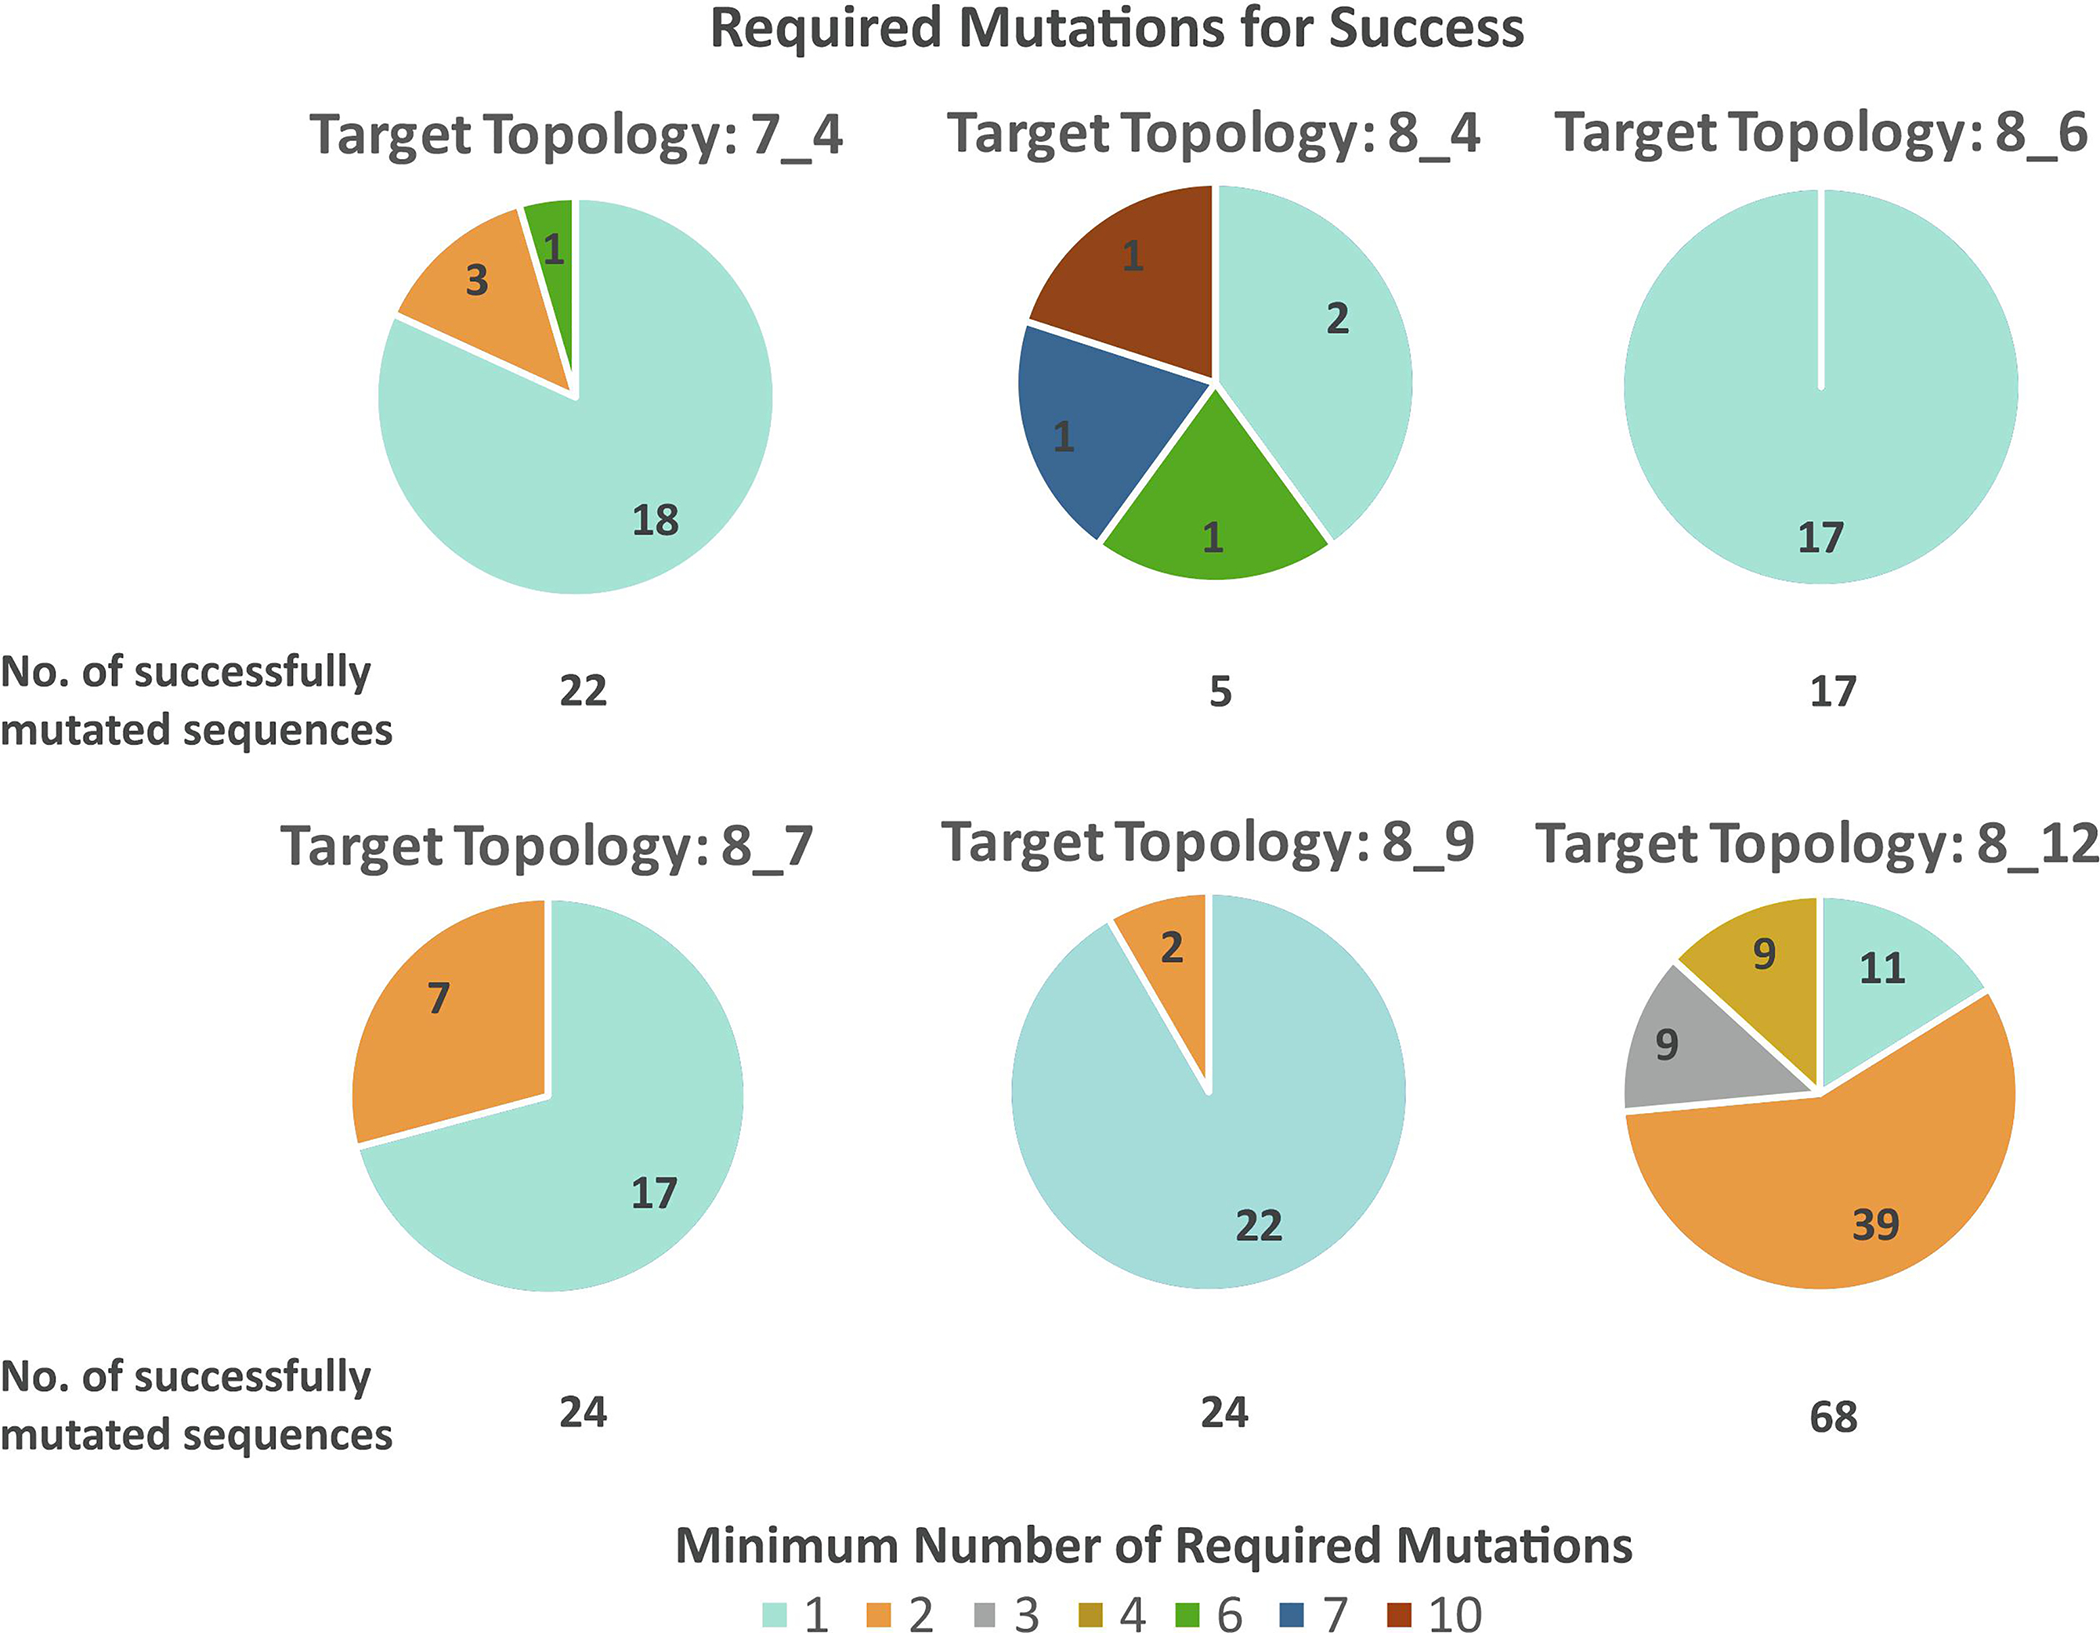
Minimal number of required mutations for successful designs. Shown are the number of required mutations for all 160 starting sequences to fold onto their corresponding target topologies. RAG-IF generates multiple successful sequences for 22, 5, 17, 24, 24, and 68 starting sequences for target topologies 7_4, 8_4, 8_6, 8_7, 8_9, and 8_12, respectively. From all successful sequences generated by RAG-IF for each starting sequence (mutation distribution shown in Supplementary Figures S2–S7), the minimum number of point mutations are considered here. The sequences that require more than two mutations are: seq. 8 for 7_4 topology (Figure S2), seqs. 1, 2, and 6 for 8_4 topology (Figure S3), and seqs. 1, 4, 8, 17, 19, 21, 22, 24, 32, 33, 34, 38, 39, 46, 60, 61, 70, and 71 for 8_12 topology (Figure S7).
Why do 27 of the 187 total starting sequences (Table 1) fail to mutate into the target topologies? Our analysis shows that failure may occur when: (a) only the centroid RNAfold structure folds onto the target topology (not the MFE), or (b) some vertices of the RNAfold 2D structure of the starting sequence are not correlated with the designed 2D structure, even with the correct topology. The first scenario is not surprising as we follow the route  in Figure 2, but our GA uses RNAfold MFE structure to calculate the Hamming distance (Subsection ‘Genetic algorithm for mutating sequences’); furthermore, our mutation optimization uses the MFE structure as the success criteria (Subsection ‘Optimizing the sequence pool’). For the second scenario, we follow the route
  in Figure 2 to generate an intermediate sequence, but results may not be produced for all cases. We emphasize, however, that neither of these scenarios imply failure. The first scenario is applicable to half of the starting sequences for the 8_12 topology, but RAG-IF still generates successful sequences for them with 1–4 mutations (as shown in Figure 12). Sequences with the second scenario can also lead to successful sequences (e.g., Figure 9). Other reasons for failure are also possible.
Comparison with RNAInverse
Similar to our GA algorithm, the flagship program for inverse folding, RNAInverse, starts from an input sequence where only specific residues are allowed to mutate [11]. To compare the results of the GA component of our RAG-IF protocol to RNAInverse performance, we ran GA and RNAInverse as described in Subsection ‘GA and RNAInverse for comparison’. For one sample sequence each for 6 target topologies, we selected the residues for mutation (sequences and target residues shown in Figures 4–9) and submitted the same input to both our GA and RNAInverse to generate mutated sequences. For sequence 3 for the 8_12 topology, the intermediate sequence shown in Figure 9 is used as the starting sequence. Both RNAInverse and GA were run until they generated at least 800 sequences. Since we test only the GA component of our RAG-IF protocol, comparisons are made before the generated sequences by both GA and RNAInverse are screened further to select successful sequences (by in silico folding), or optimize mutations.
Figure 13 compares the number of mutations for sequence products generated by GA to those from RNAInverse. Our GA generates sequences with far less mutations for 8_4, 8_6 and 8_9 topology. Although the two distributions overlap for target topologies 7_4, 8_7, and 8_12, the peak number of mutations for GA is still less than that of RNAInverse. Overall, our GA generates sequences with far less mutations than RNAInverse, which typically leads to shorter CPU times for subsequent mutation optimization. Although the time taken to generate at least 800 sequences varies for both GA and RNAInverse (Supplementary Figure S8), our limited evaluation shows that our GA algorithm in RAG-IF is advantageous if generating a large number of candidates with minimal mutations is important.
Fig. 13.
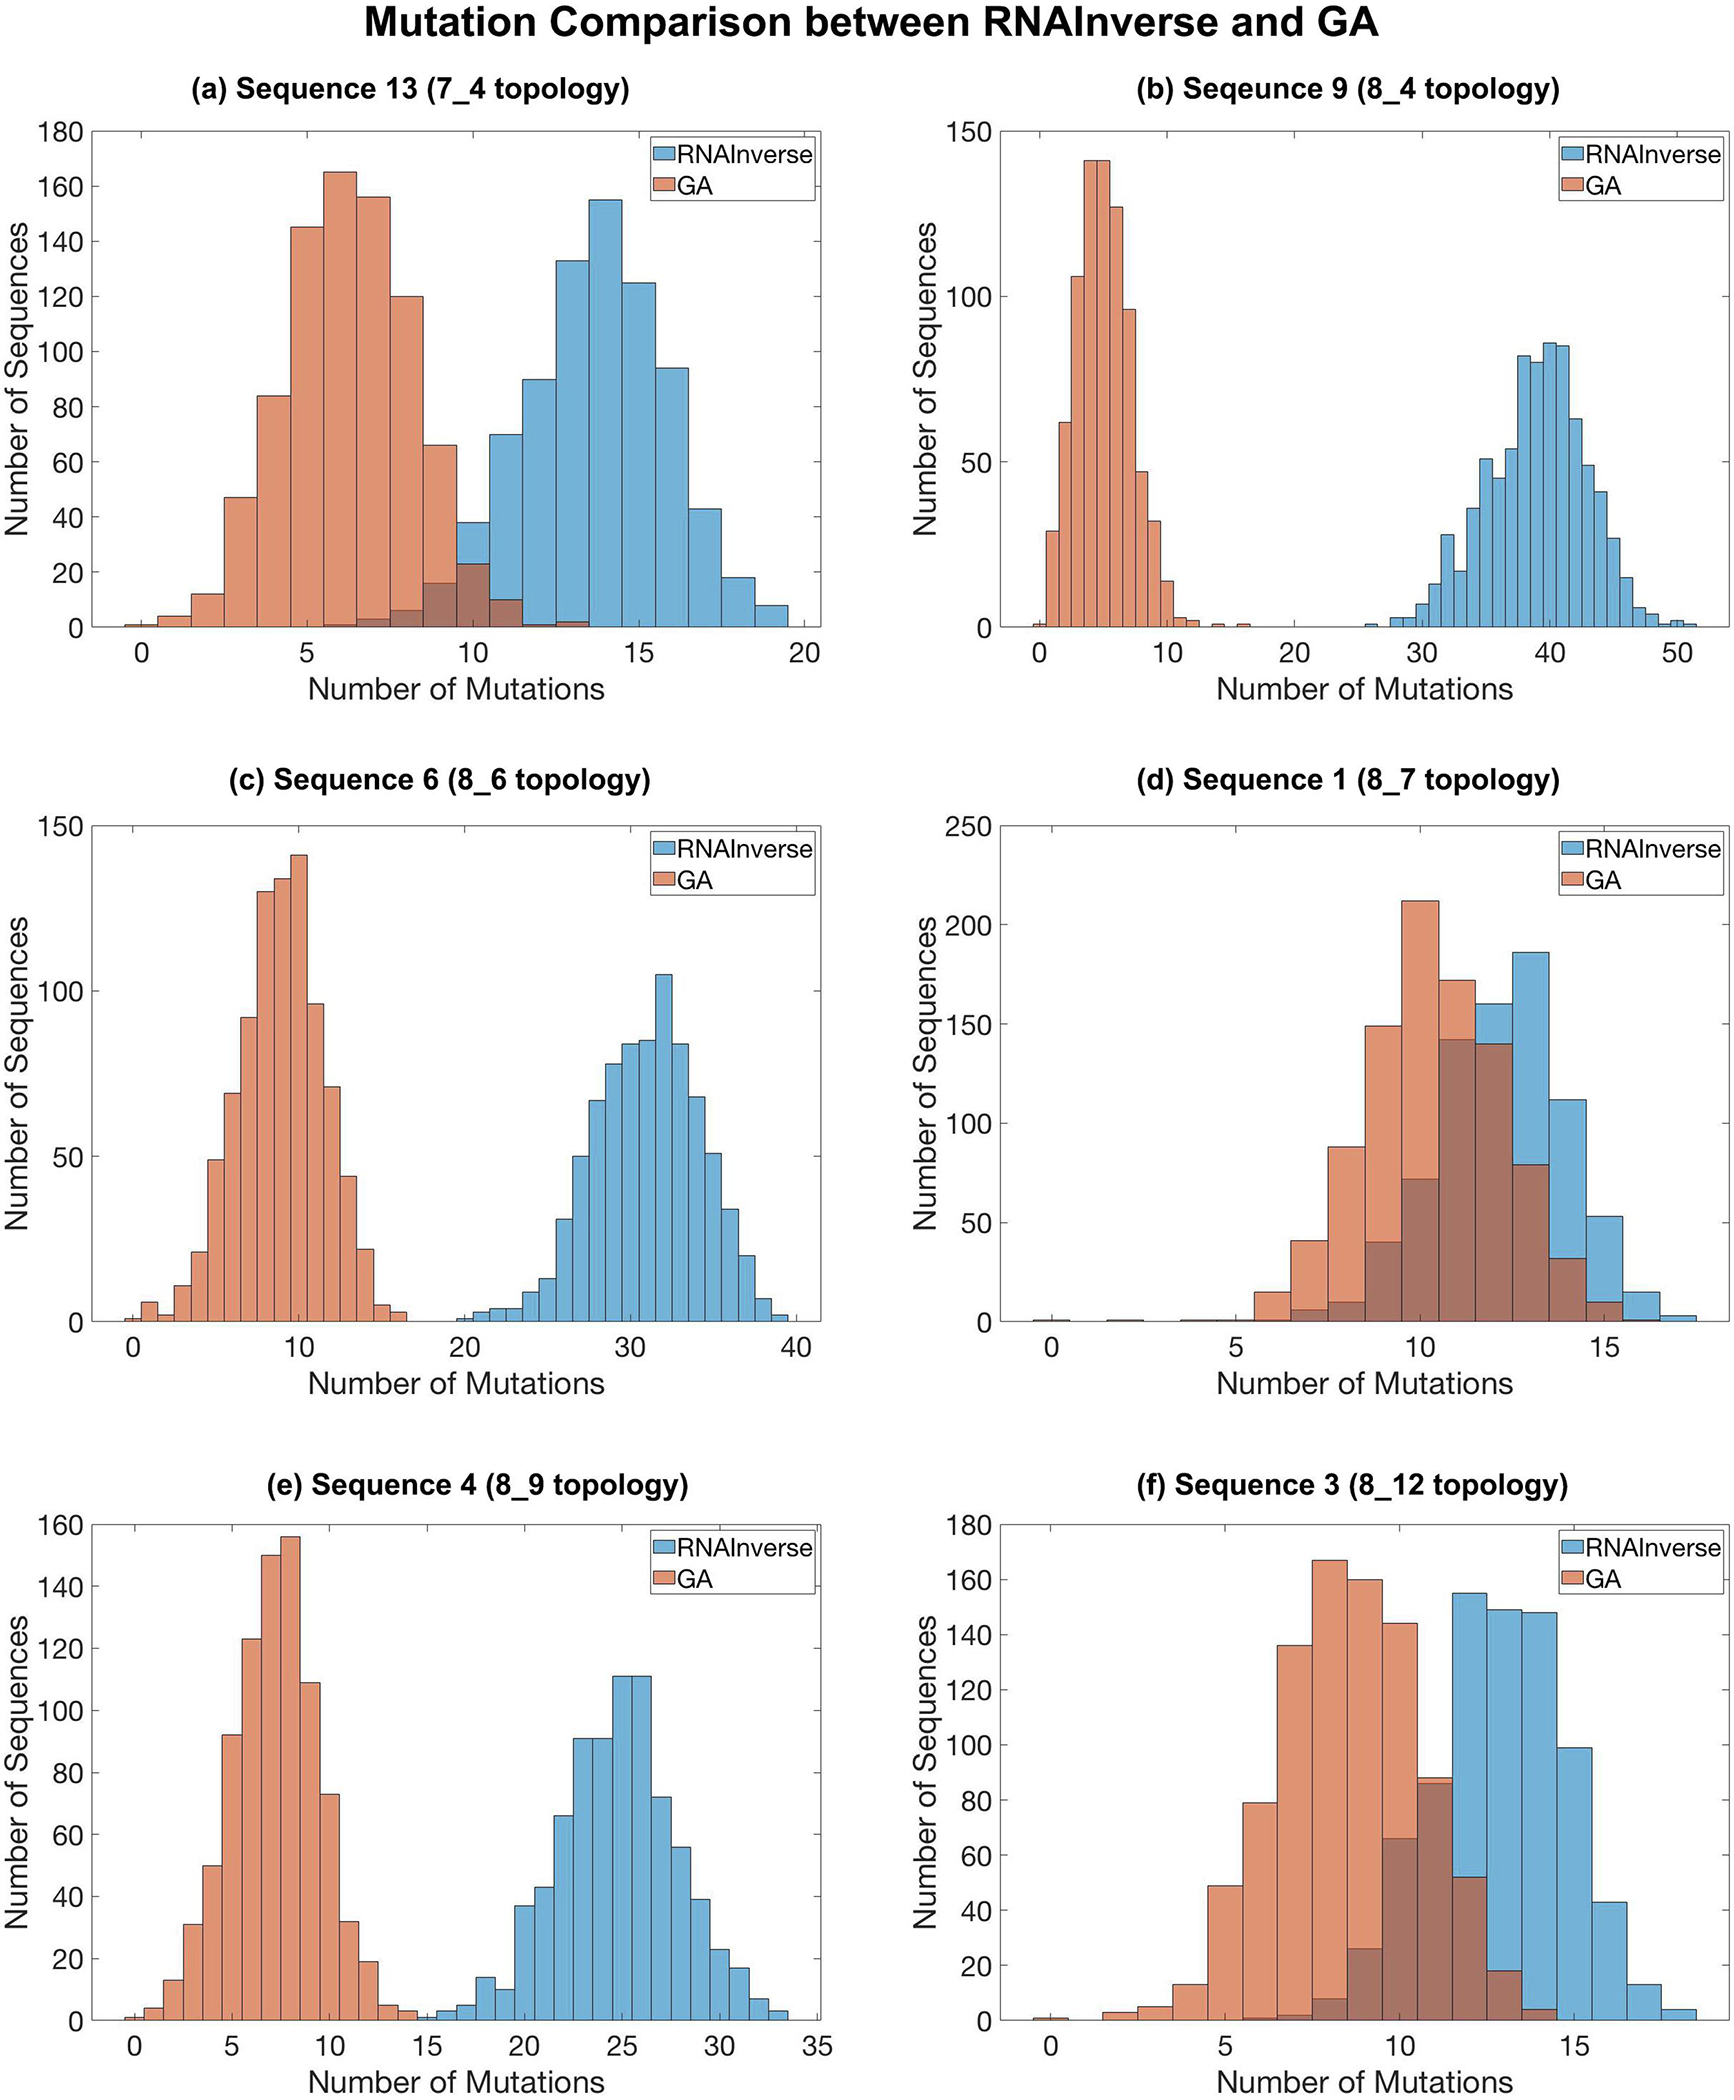
Comparison between the sequence products generated by RAG-IF GA algorithm (peach) and RNAInverse (blue) starting from a sample sequence (shown in Figures 4–9) for 6 target topologies. For sequence 3 for the 8_12 topology, the intermediate sequence shown in Figure 9 was used as the starting sequence. Both RNAInverse and GA were run until they generated at least 800 sequences. Note that the generated sequences by GA and RNAInverse shown here were not screened further to check whether they fold onto the target topologies.
Discussion
We have presented a RAG based RNA inverse folding algorithm that automatically mutates the unsuccessful sequences produced by our computational pipeline [39] to fold onto the target RNA-like graph topologies. Our approach uses graph differences between the target and predicted graph topologies to target specific residues for mutation. Starting from a relatively small number of sequences, RAG-IF can generate a large pool of successful sequences (usually a few hundred), with a variety of mutations and corresponding 2D structures.
The number of successful sequences generated from a particular starting sequence does not seem to follow any specific pattern with respect to the number of correlated/common vertices between the predicted and the target topologies (Figure 10), at least for the limited range we have here. In addition, the original NUPACK predicted 2D structures for the starting sequences for 5 of the 6 target topologies correspond to a variety of tree graph topologies (see Supplementary Figure S9). Significantly, most starting sequences required only 1–2 minimal mutations (Figures 12) to fold onto the corresponding target topology, and they were much harder to find manually. Thus, RAG-IF is very general and can generate successful sequences largely independent of the incorrect fold of the starting sequence.
Improving our vertex correlation algorithm to count the number of adjacent helices as an additional criteria may help avoid unsuccessful sequences like sequences 1 and 2 for 8_9 target topology (Figure 10) despite the 8 correlated vertices with incorrect topology. We can also run the GA twice (route  ) for starting sequences where the centroid and not the MFE RNAfold structure has the correct topology. Another interesting idea would be to mutate the original atomic models generated by F-RAG to reflect the mutations in successful sequences generated by RAG-IF, followed by energy minimization or molecular dynamics simulations, to generate plausible 3D models for our successful sequences. We also plan to develop a similar computational pipeline for designing more complex RNA structures, including pseudoknots, using our dual graph representations of RNA structures [33, 43]. Yet already, RAG-IF has great potential to generate large sequence candidate pools with desired folds quickly, especially with minimal mutations, to provide valuable starting point for designing RNA molecules with novel structures and functions.
Supplementary Material
Fig. 5.
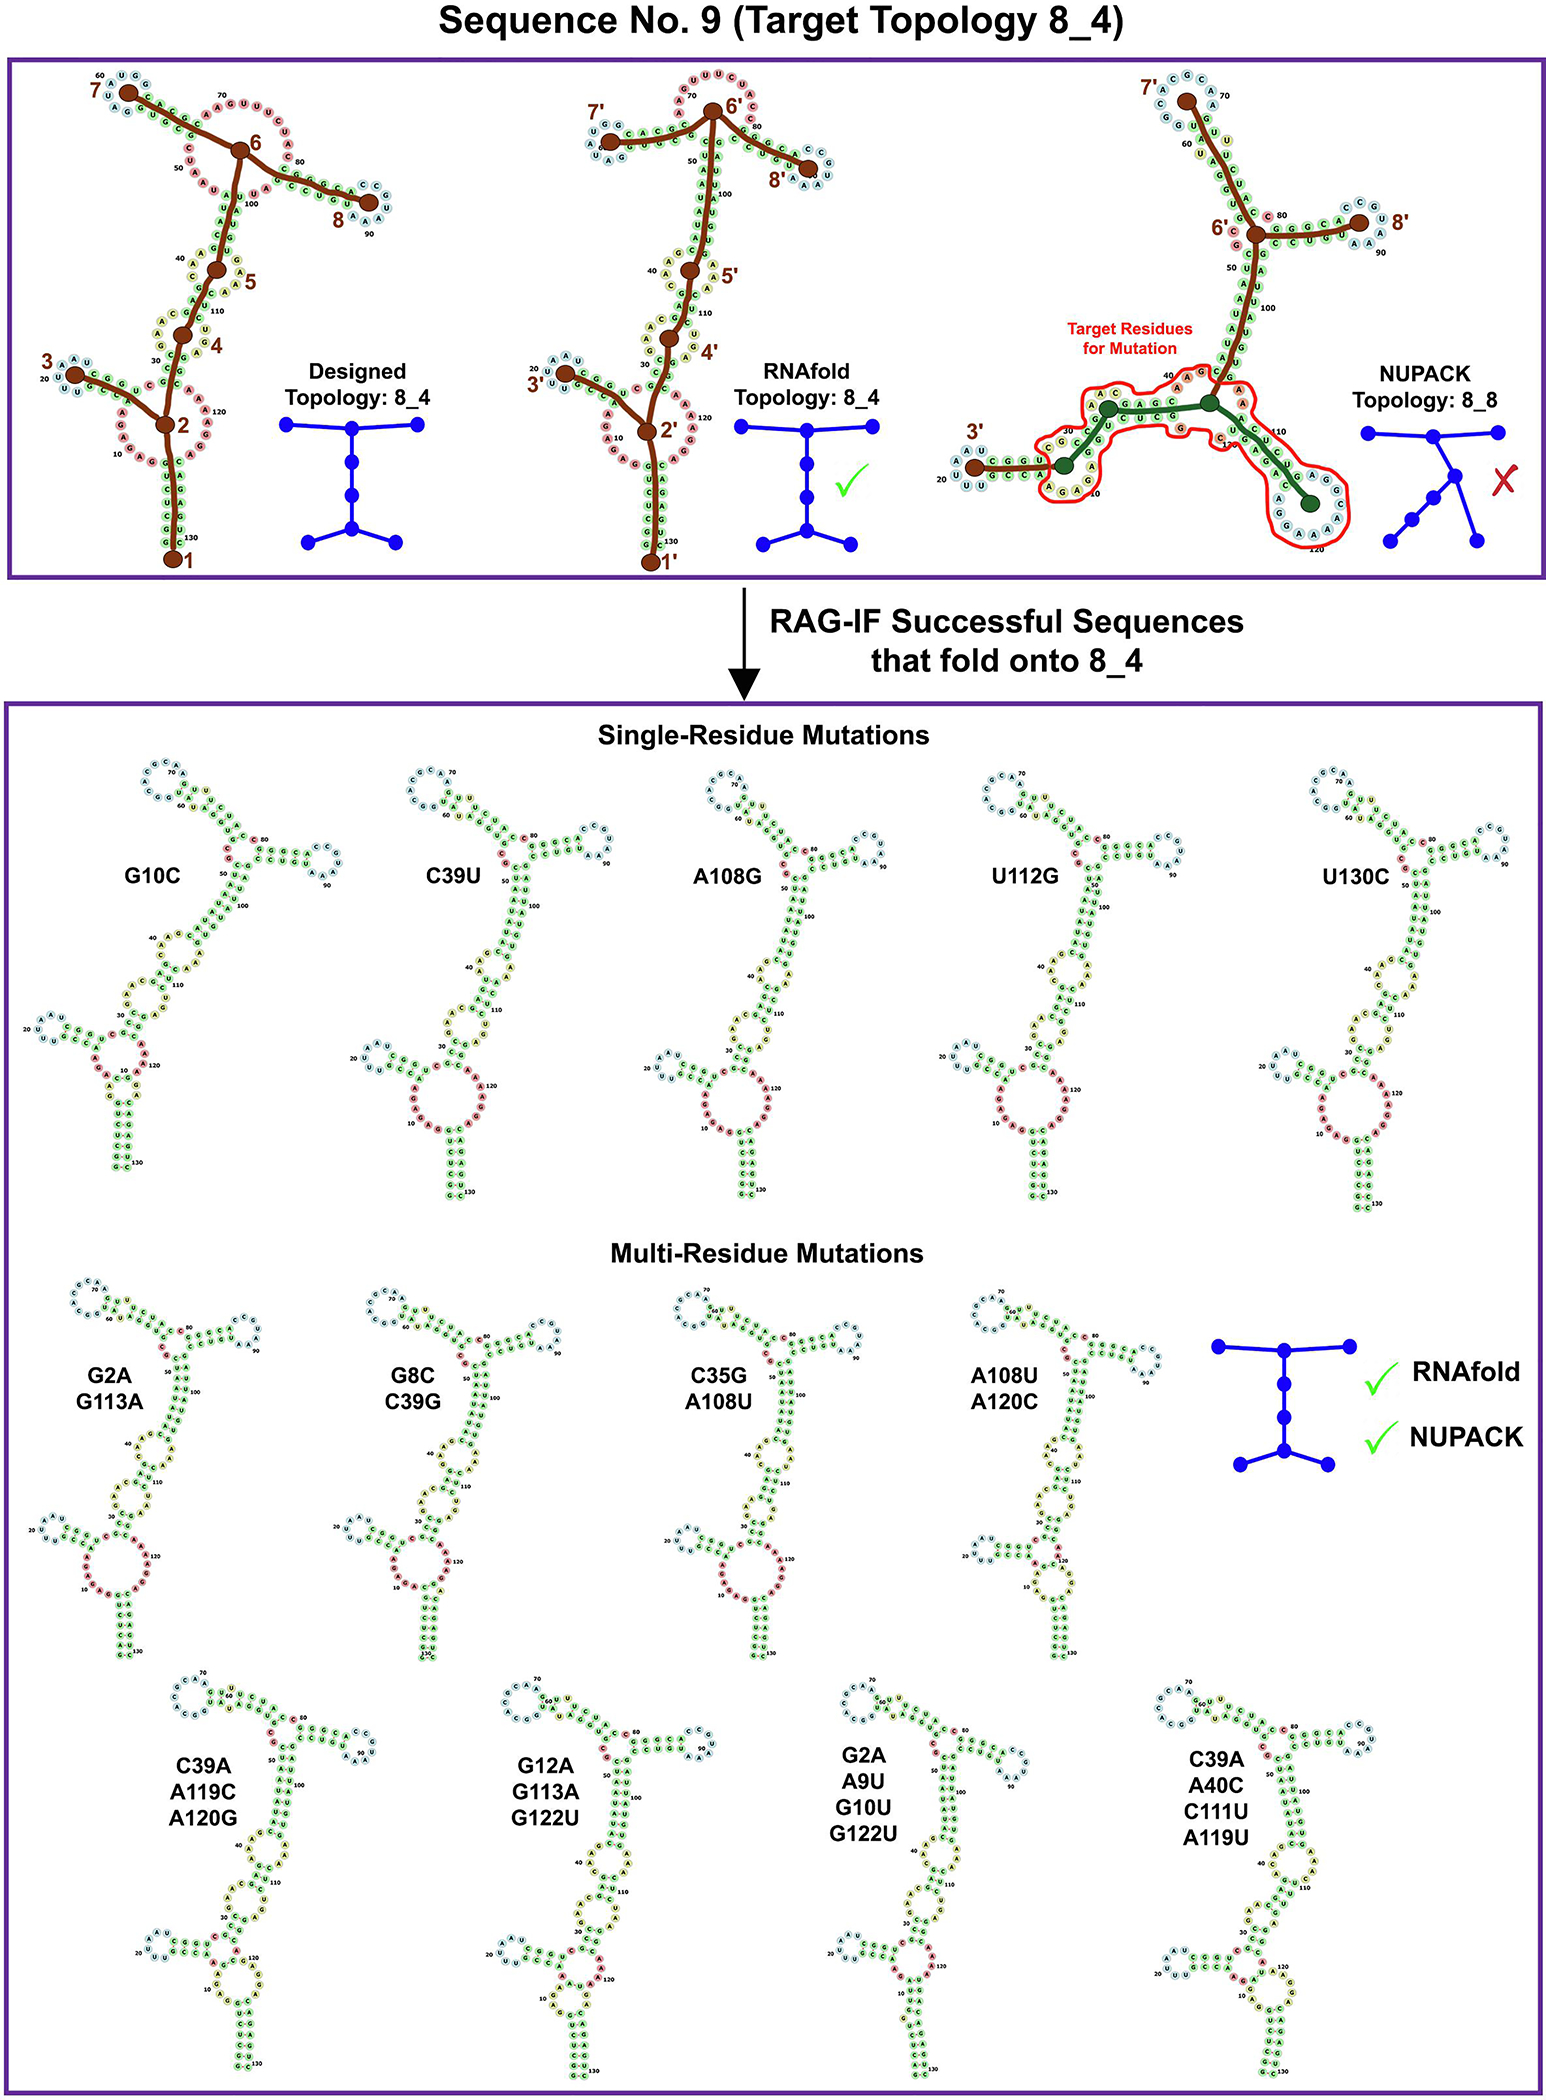
Images for RAG-IF 8_4 design. The designed (8_4), RNAfold predicted (8_4) and NUPACK predicted (8_8) tree graph topology for a sample starting sequence (sequence 9 for 8_4 topology in Figure 10). Also shown are 13 of the 27 optimal sequences generated from this starting sequence. See Figure 4 caption for other details.
Fig. 6.
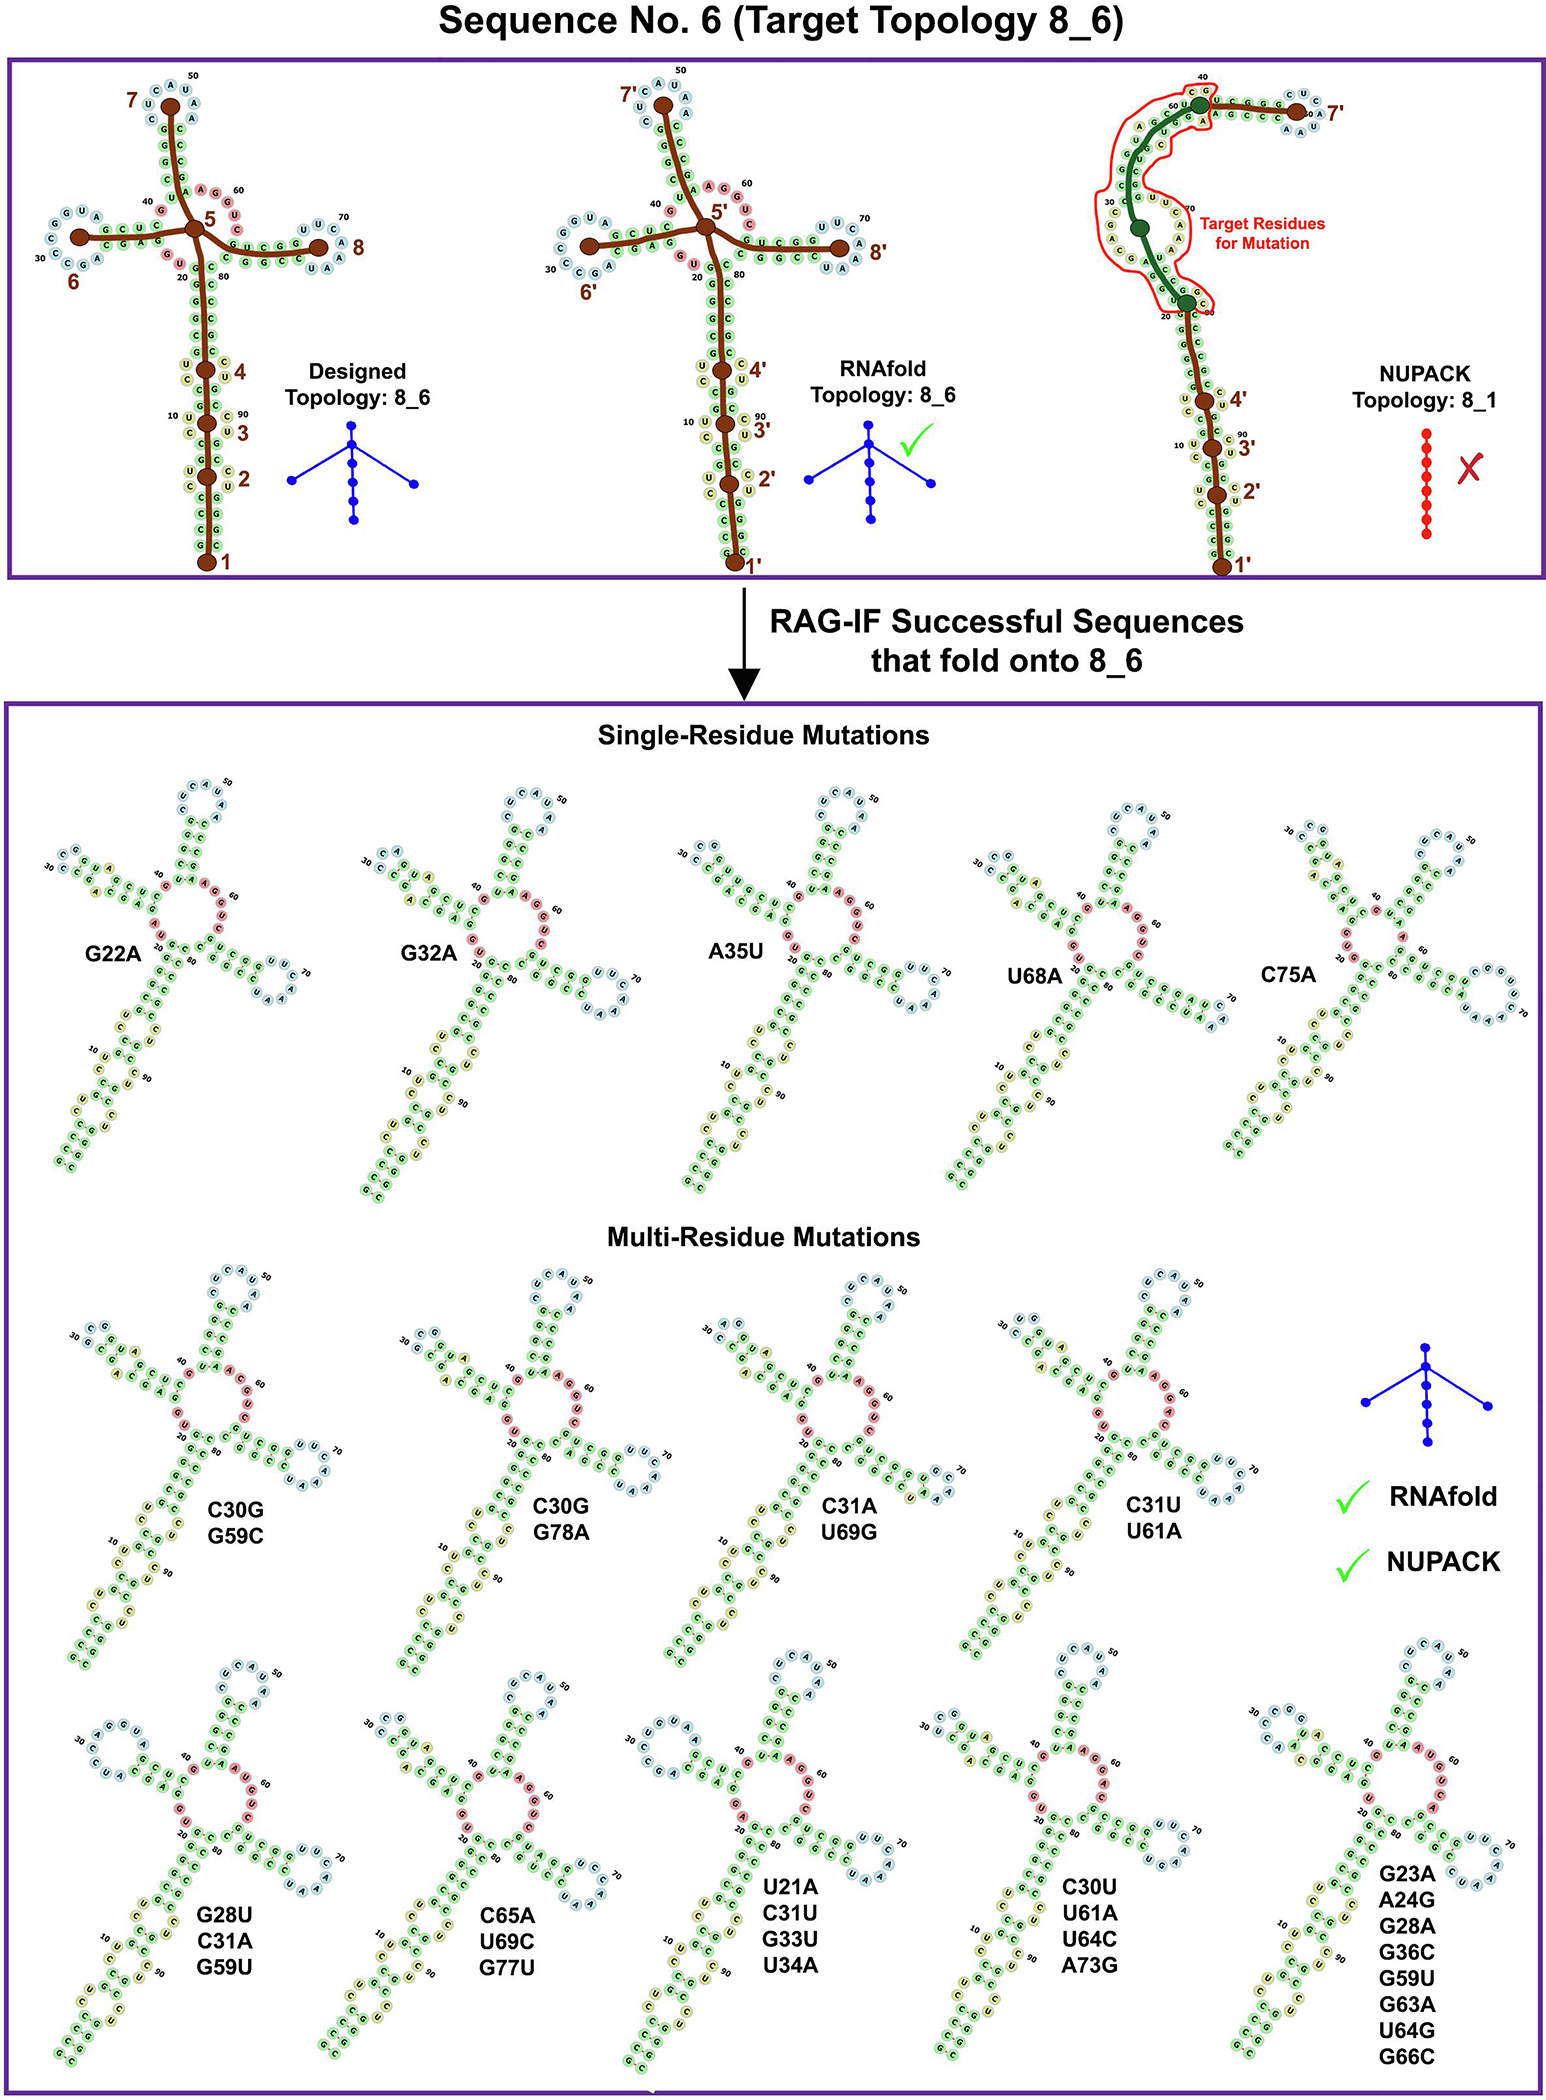
Images for RAG-IF 8_6 design. The designed (8_6), RNAfold predicted (8_6) and NUPACK predicted (8_1) tree graph topology for a sample starting sequence (sequence 6 for 8_6 topology in Figure 10). Also shown are 14 of the 29 optimal sequences generated from this starting sequence. See Figure 4 caption for other details.
Fig. 7.
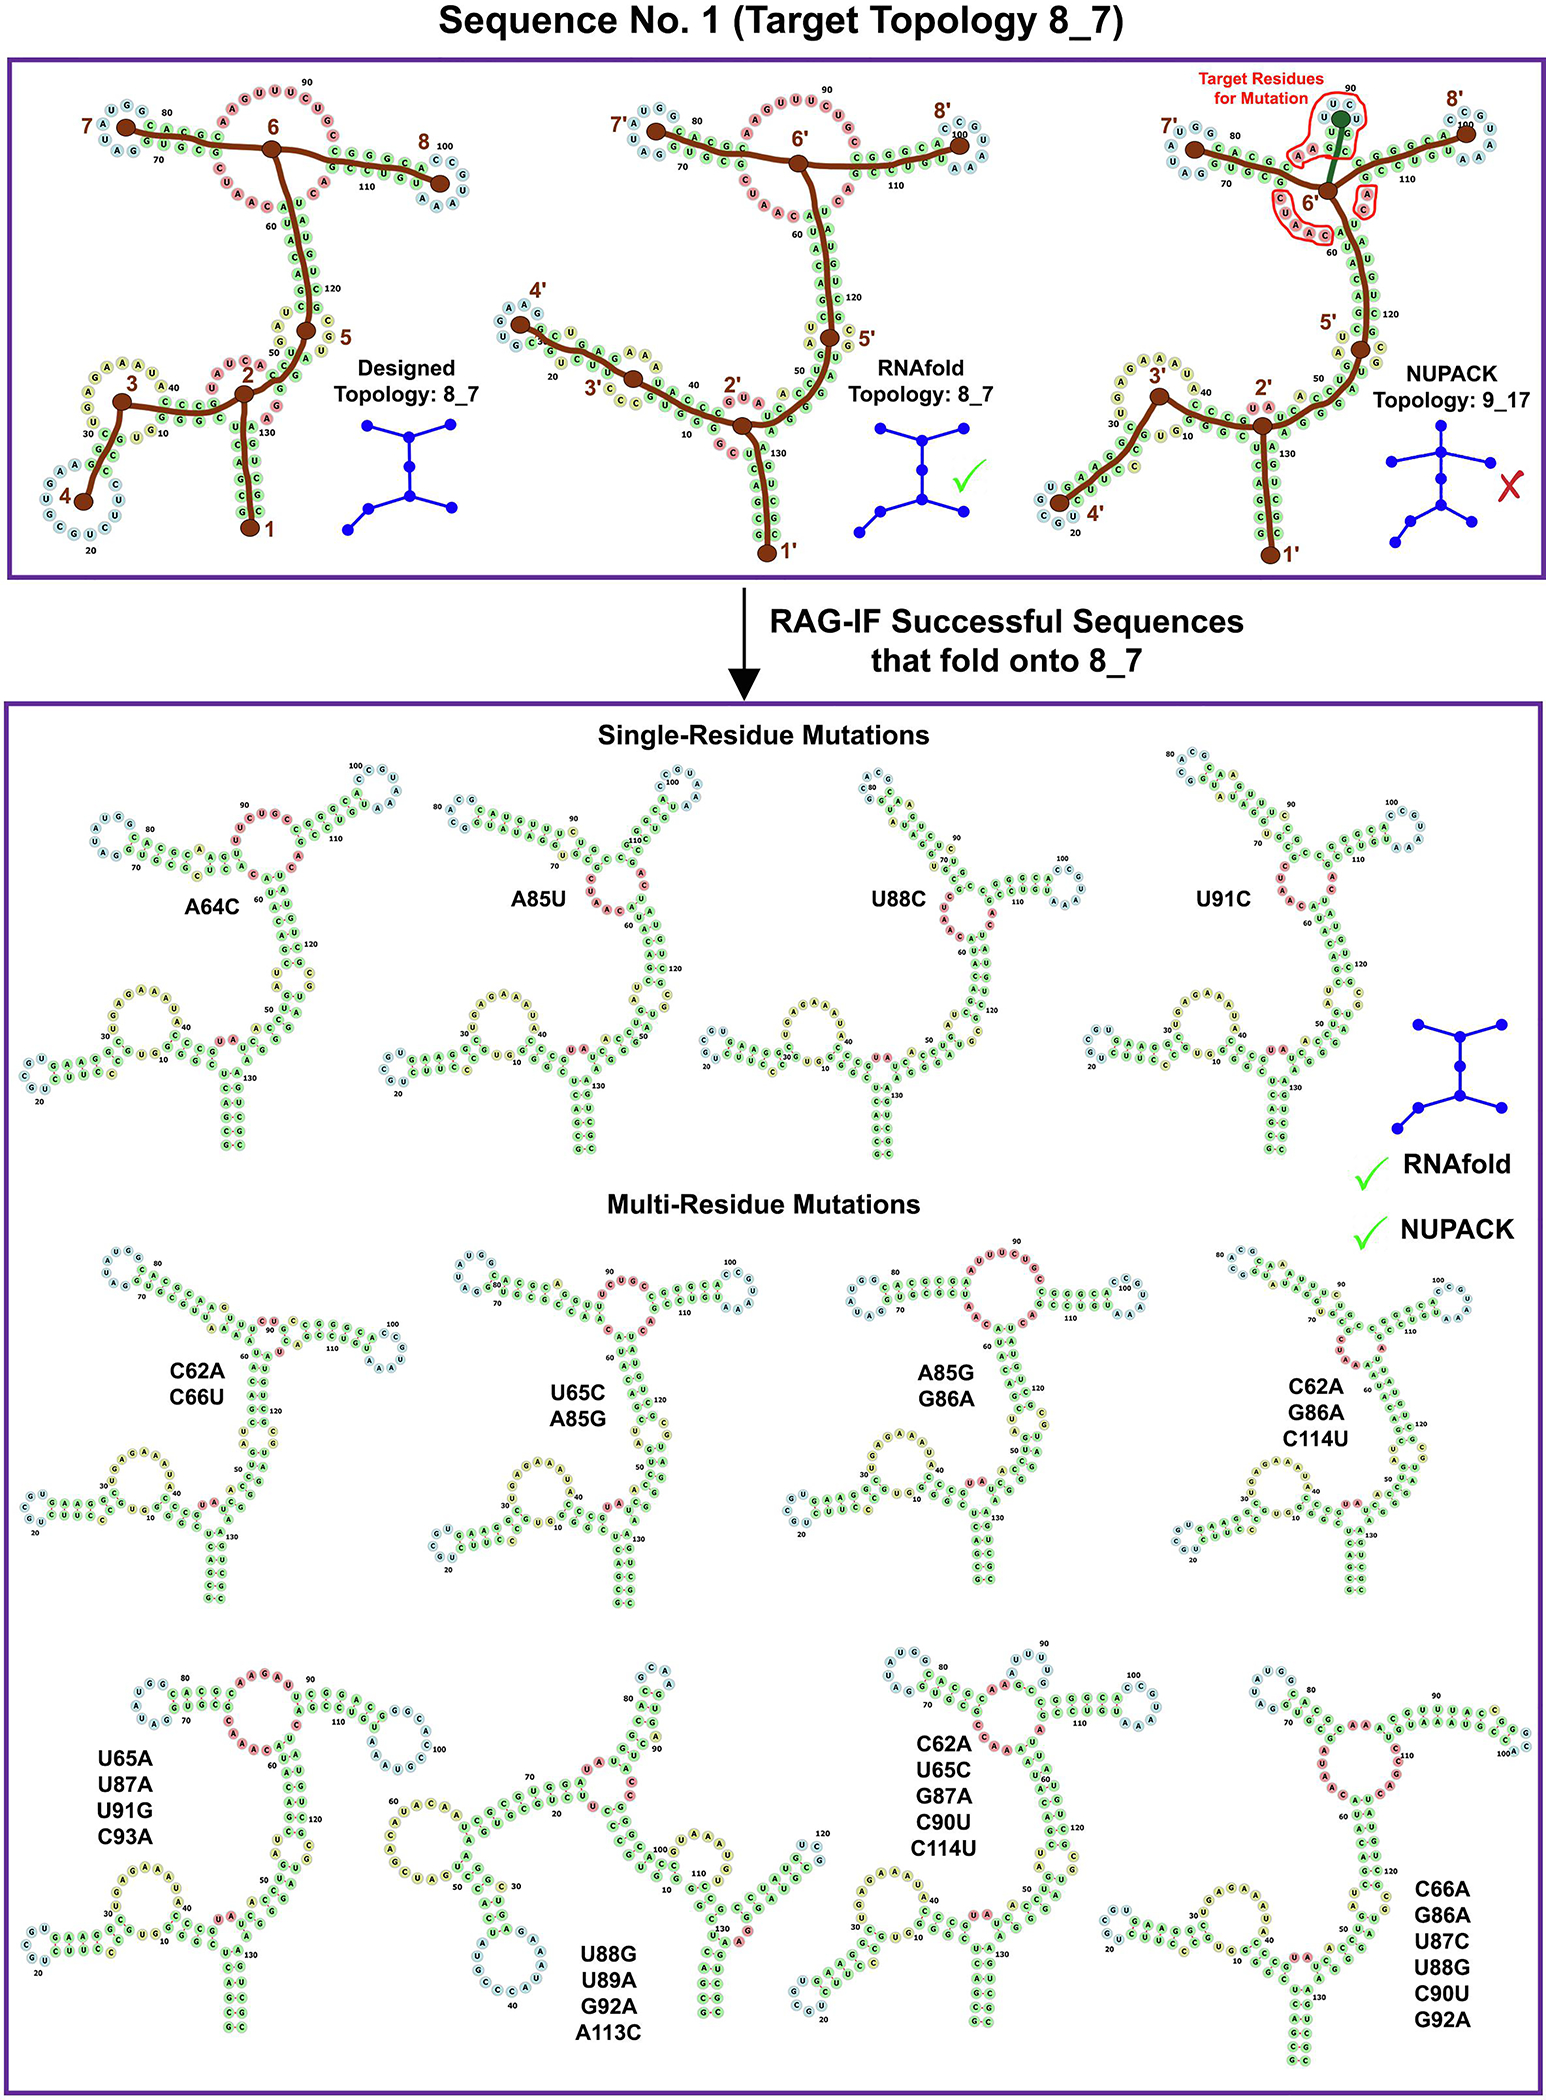
Images for RAG-IF 8_7 design. The designed (8_7), RNAfold predicted (8_7) and NUPACK predicted (9_17) tree graph topology for a sample starting sequence (sequence 1 for 8_7 topology in Figure 10). Also shown are 12 of the 28 optimal sequences generated from this starting sequence. See Figure 4 caption for other details.
Fig. 8.
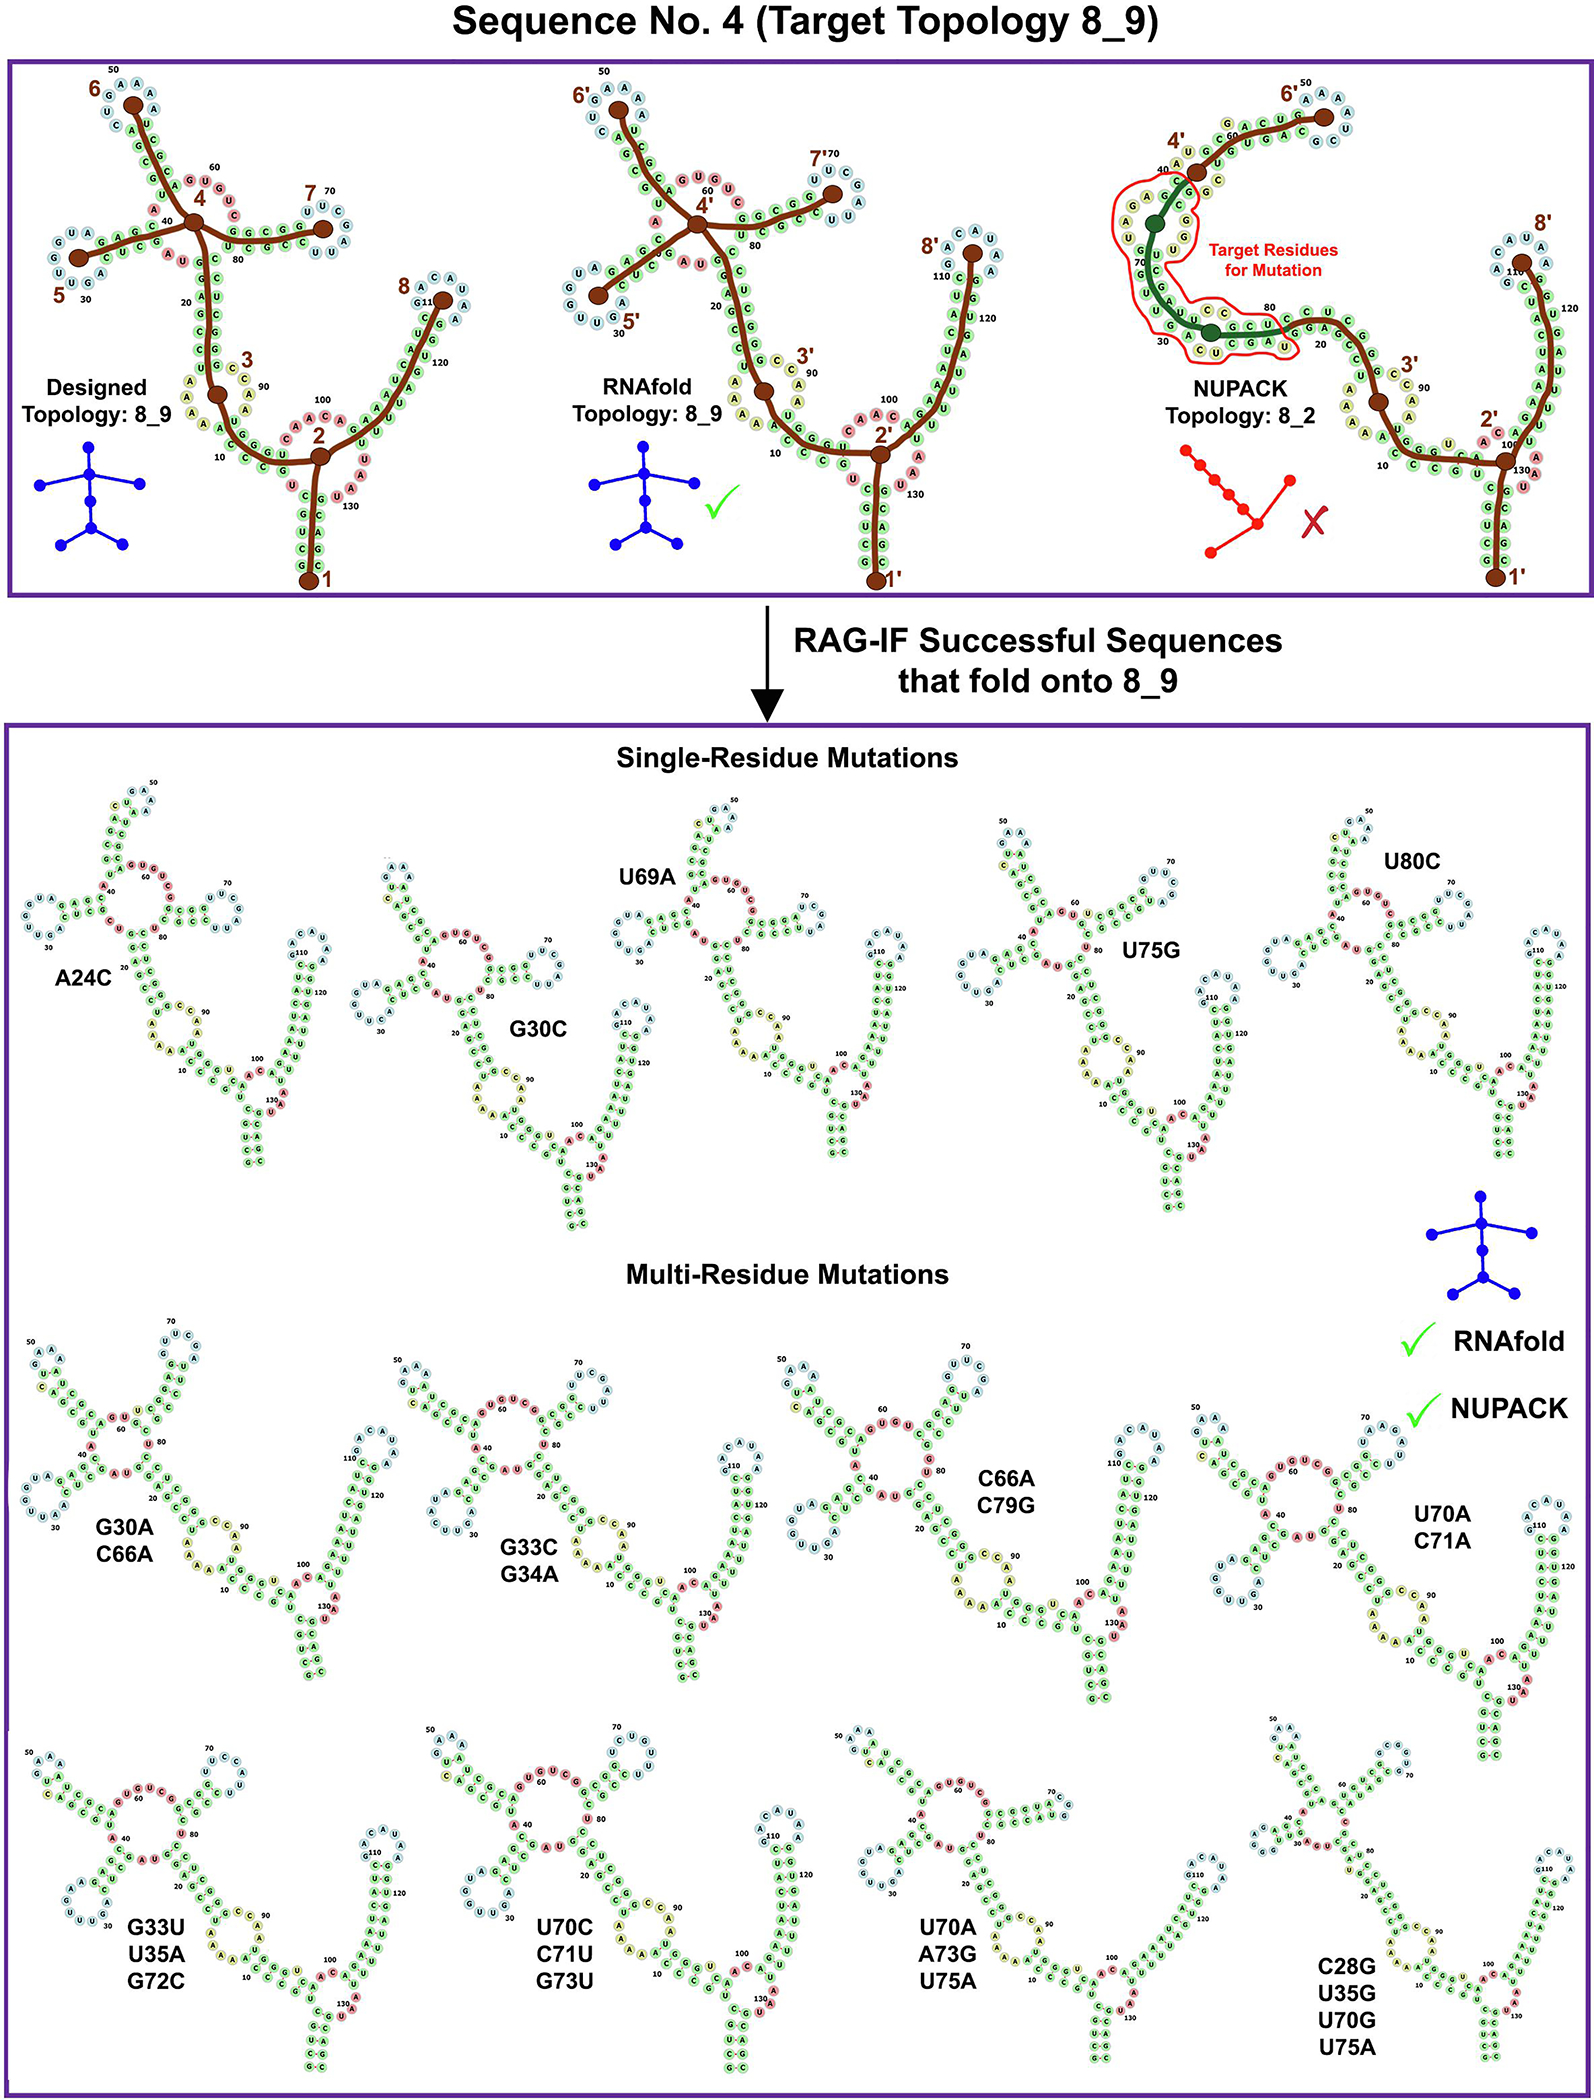
Images for RAG-IF 8_9 design. The designed (8_9), RNAfold predicted (8_9) and NUPACK predicted (8_2) tree graph topology for a sample starting sequence (sequence 4 for 8_9 topology in Figure 10). Also shown are 13 of the 35 optimal sequences generated from this starting sequence. See Figure 4 caption for other details.
Acknowledgements
We thank Mr. Shereef Elmetwaly for technical assistance.
Funding: This work has been supported by the National Institute of General Medical Sciences, National Institutes of Health (NIH) grant R35GM122562 to T.S. Research in this article was supported (in part) by Philip Morris USA Inc. and Philip Morris International. The funding institutes did not have any say in the design of the study, analysis of the results, or the decision to publish.
Abbreviations
- RNA
Ribonucleic Acid
- RAG
RNA-As-Graphs
- RAG-IF
RNA-As-Graphs Inverse Folding
- F-RAG
Fragment assembly for RNA-As-Graphs
- RAGTOP
RNA-As-Graphs Topology Prediction
- 2D
secondary
- 3D
three dimensional/tertiary
- GA
Genetic Algorithm
- MFE
Minimum Free Energy
Footnotes
Publisher's Disclaimer: This is a PDF file of an unedited manuscript that has been accepted for publication. As a service to our customers we are providing this early version of the manuscript. The manuscript will undergo copyediting, typesetting, and review of the resulting proof before it is published in its final form. Please note that during the production process errors may be discovered which could affect the content, and all legal disclaimers that apply to the journal pertain.
Declaration of Interest: None
References
- 1.Stoltenburg R, Reinemann C, and Strehlitz B 2007, SELEX-a (r)evolutionary method to generate high-affinity nucleic acid ligands. Biomol. Eng, 24(4), 381–403. [DOI] [PubMed] [Google Scholar]
- 2.Zhuo Z, Yu Y, Wang M, Li J, Zhang Z, Liu J, Wu X, Lu A, Zhang G, and Zhang B 2017, Recent advances in SELEX technology and aptamer applications in biomedicine. Int J Mol Sci, 18(10), 2142. [DOI] [PMC free article] [PubMed] [Google Scholar]
- 3.Wilson LOW, OBrien AR, and Bauer DC 2018, The current state and future of CRISPR-Cas9 gRNA design tools. Front Pharmacol, 9, 749. [DOI] [PMC free article] [PubMed] [Google Scholar]
- 4.Cui Y, Xu J, Cheng M, Liao X, and Peng S 2018, Review of CRISPR/Cas9 sgRNA design tools. Interdiscip Sci, 10(2), 455–465. [DOI] [PubMed] [Google Scholar]
- 5.Crick F 1970, Central dogma of molecular biology. Nature, 227(5258), 561. [DOI] [PubMed] [Google Scholar]
- 6.Wilson TJ, Liu Y, and Lilley DM 2016, Ribozymes and the mechanisms that underlie RNA catalysis. Front. Chem. Sci. Eng, 10(2), 178–185. [Google Scholar]
- 7.Kaikkonen MU, Lam MT, and Glass CK 2011, Non-coding RNAs as regulators of gene expression and epigenetics. Cardiovasc. Res, 90(3), 430–440. [DOI] [PMC free article] [PubMed] [Google Scholar]
- 8.Patil VS, Zhou R, and Rana TM 2014, Gene regulation by non-coding RNAs. Crit. Rev. Biochem. Mol. Biol, 49(1), 16–32. [DOI] [PMC free article] [PubMed] [Google Scholar]
- 9.Pyle AM and Schlick T 2016, Challenges in RNA structural modeling and design. J. Mol. Biol, 428(5, Part A), 733–735. [DOI] [PMC free article] [PubMed] [Google Scholar]
- 10.Schlick T and Pyle AM 2017, Opportunities and challenges in RNA structural modeling and design. Biophys. J, 113(2), 225–234. [DOI] [PMC free article] [PubMed] [Google Scholar]
- 11.Hofacker IL, Fontana W, Stadler PF, Bonhoeffer LS, Tacker M, and Schuster P 1994, Fast folding and comparison of RNA secondary structures. Monatsh. Chem. Chem. Mon, 125(2), 167–188. [Google Scholar]
- 12.Andronescu M, Fejes AP, Hutter F, Hoos HH, and Condon A 2004, A new algorithm for RNA secondary structure design. J. Mol. Biol, 336(3), 607–624. [DOI] [PubMed] [Google Scholar]
- 13.Busch A and Backofen R 2006, INFO-RNA–a fast approach to inverse RNA folding. Bioinformatics, 22(15), 1823–1831. [DOI] [PubMed] [Google Scholar]
- 14.Matthies MC, Bienert S, and Torda AE 2012, Dynamics in sequence space for RNA secondary structure design. J. Chem. Theory Comput, 8(10), 3663–3670. [DOI] [PubMed] [Google Scholar]
- 15.Zadeh JN, Steenberg CD, Bois JS, Wolfe BR, Pierce MB, Khan AR, Dirks RM, and Pierce NA 2011, NUPACK: Analysis and design of nucleic acid systems. J. Comput. Chem, 32(1), 170–173. [DOI] [PubMed] [Google Scholar]
- 16.Taneda A 2010, MODENA: a multi-objective RNA inverse folding. Adv. Appl. Bioinforma. Chem, 4, 1–12. [DOI] [PMC free article] [PubMed] [Google Scholar]
- 17.Garcia-Martin J, Clote P, and Dotu I 2013, RNAiFOLD: a constraint programming algorithm for RNA inverse folding and molecular design. J Bioinform Comput Biol, 11(2), 1350001. [DOI] [PubMed] [Google Scholar]
- 18.Lee J, Kladwang W, Lee M, Cantu D, Azizyan M, Kim H, Limpaecher A, Gaikwad S, Yoon S, Treuille A, Das R, and Participants 2014, RNA design rules from a massive open laboratory. Proc. Natl. Acad. Sci. U.S.A, 111(6), 2122–2127. [DOI] [PMC free article] [PubMed] [Google Scholar]
- 19.Churkin A, Retwitzer MD, Reinharz V, Ponty Y, Waldisphl J, and Barash D 2018, Design of RNAs: comparing programs for inverse RNA folding. Brief. Bioinform, 19(2), 350–358. [DOI] [PMC free article] [PubMed] [Google Scholar]
- 20.Hammer S, Wang W, Will S, and Ponty Y 2019, Fixed-parameter tractable sampling for RNA design with multiple target structures. BMC Bioinformatics, 20(1), 209. [DOI] [PMC free article] [PubMed] [Google Scholar]
- 21.Nussinov R and Jacobson AB 1980, Fast algorithm for predicting the secondary structure of single-stranded RNA.. Proc. Natl. Acad. Sci. U.S.A, 77(11), 6309–6313. [DOI] [PMC free article] [PubMed] [Google Scholar]
- 22.Le S-Y, Nussinov R, and Maizel JV 1989, Tree graphs of RNA secondary structures and their comparisons. Comput. Biomed. Res, 22(5), 461–473. [DOI] [PubMed] [Google Scholar]
- 23.Shapiro BA and Zhang K 1990, Comparing multiple RNA secondary structures using tree comparisons. Bioinformatics, 6(4), 309–318. [DOI] [PubMed] [Google Scholar]
- 24.Giegerich R, Voß B, and Rehmsmeier M 2004, Abstract shapes of RNA. Nucleic Acid Res, 32(16), 4843–4851. [DOI] [PMC free article] [PubMed] [Google Scholar]
- 25.Dawson WK, Maciejczyk M, Jankowska EJ, and Bujnicki JM 2016, Coarse-grained modeling of RNA 3D structure. Methods, 103, 138–156. [DOI] [PubMed] [Google Scholar]
- 26.Schlick T 2018, Adventures with RNA graphs. Methods, 143, 16–33. [DOI] [PMC free article] [PubMed] [Google Scholar]
- 27.Laing C and Schlick T 2011, Computational approaches to RNA structure prediction, analysis, and design. Curr. Opin. Struct. Biol, 21(3), 306–318. [DOI] [PMC free article] [PubMed] [Google Scholar]
- 28.Kim N, Fuhr KN, and Schlick T 2012, Graph applications to RNA structure and function In Biophysics of RNA Folding pp. 23–51 Springer; New York. [Google Scholar]
- 29.Gan HH, Pasquali S, and Schlick T 2003, Exploring the repertoire of RNA secondary motifs using graph theory; implications for RNA design. Nucleic Acids Res, 31(11), 2926–2943. [DOI] [PMC free article] [PubMed] [Google Scholar]
- 30.Fera D, Kim N, Shiffeldrim N, Zorn J, Laserson U, Gan HH, and Schlick T 2004, RAG: RNA-As-Graphs web resource. BMC Bioinformatics, 5(1), 1. [DOI] [PMC free article] [PubMed] [Google Scholar]
- 31.Kim N, Shiffeldrim N, Gan HH, and Schlick T 2004, Candidates for novel RNA topologies. J. Mol. Biol, 341(5), 1129–1144. [DOI] [PubMed] [Google Scholar]
- 32.Izzo JA, Kim N, Elmetwaly S, and Schlick T 2011, RAG: an update to the RNA-As-Graphs resource. BMC Bioinformatics, 12(219). [DOI] [PMC free article] [PubMed] [Google Scholar]
- 33.Jain S, Bayrak CS, Petingi L, and Schlick T 2018, Dual graph partitioning highlights a small group of pseudoknot-containing RNA submotifs. Genes, 9(8), 371. [DOI] [PMC free article] [PubMed] [Google Scholar]
- 34.Baba N, Elmetwaly S, Kim N, and Schlick T 2016, Predicting large RNA-like topologies by a knowledge-based clustering approach. J. Mol. Biol, 428(5), 811–821. [DOI] [PMC free article] [PubMed] [Google Scholar]
- 35.Zahran M, Sevim Bayrak C, Elmetwaly S, and Schlick T 2015, RAG-3D: a search tool for RNA 3D substructures. Nucleic Acids Res, 43(19), 9474–9488. [DOI] [PMC free article] [PubMed] [Google Scholar]
- 36.Kim N, Laing C, Elmetwaly S, Jung S, Curuksu J, and Schlick T 2014, Graph-based sampling for approximating global helical topologies of RNA.. Proc. Nat. Acad. Sci. USA, 111(11), 4079–4084. [DOI] [PMC free article] [PubMed] [Google Scholar]
- 37.Bayrak CS, Kim N, and Schlick T 2017, Using sequence signatures and kink-turn motifs in knowledge-based statistical potentials for RNA structure prediction.. Nucleic Acids Res, 45(9), 5414–5422. [DOI] [PMC free article] [PubMed] [Google Scholar]
- 38.Jain S and Schlick T 2017, F-RAG: generating atomic coordinates from RNA graphs by fragment assembly. J. Mol. Biol, 429(23), 3587–3605. [DOI] [PMC free article] [PubMed] [Google Scholar]
- 39.Jain S, Laederach A, Ramos S, and Schlick T 2018, A pipeline for computational design of novel RNA-like topologies. Nucleic Acids Res, 46(14), 7040–7051. [DOI] [PMC free article] [PubMed] [Google Scholar]
- 40.Kim N, Zheng Z, Elmetwaly S, and Schlick T 2014, RNA graph partitioning for the discovery of RNA modularity: a novel application of graph partition algorithm to biology. PLoS One, 9(9), e106074. [DOI] [PMC free article] [PubMed] [Google Scholar]
- 41.Lorenz R, Bernhart SH, Zu Siederdissen CH, Tafer H, Flamm C, Stadler PF, and Hofacker IL 2011, ViennaRNA Package 2.0. Algorithms Mol. Biol, 6(1), 26. [DOI] [PMC free article] [PubMed] [Google Scholar]
- 42.Holland JH 1992, Adaptation in natural and artificial systems: an introductory analysis with applications to biology, control, and artificial intelligence, MIT Press, Cambridge, MA, USA. [Google Scholar]
- 43.Jain S, Saju S, Petingi L, and Schlick T 2019, An extended dual graph library and partitioning algorithm applicable to pseudoknotted RNA structures. Methods, 162–163, 74–84. [DOI] [PMC free article] [PubMed] [Google Scholar]
Associated Data
This section collects any data citations, data availability statements, or supplementary materials included in this article.


