

Abstract
Background and Purpose
FK506 and rapamycin are modulators of FK‐binding proteins (FKBP) that are used to suppress immune function after organ and hematopoietic stem cell transplantations. The drugs share the unwanted side‐effect of evoking hypertension that is associated with reduced endothelial function and nitric oxide production. The underlying mechanisms are not understood. FKBP may regulate IP3 receptors (IP3R) and ryanodine receptors (RyR) to alter Ca2+ signalling in endothelial cells.
Experimental Approach
We investigated the effects of FK506 and rapamycin on Ca2+ release via IP3R and RyR in hundreds of endothelial cells, using the indicator Cal‐520, in intact mesenteric arteries from male Sprague‐Dawley rats. IP3Rs were activated by acetylcholine or localised photo‐uncaging of IP3, and RyR by caffeine.
Key Results
While FKBPs were present, FKBP modulation with rapamycin did not alter IP3‐evoked Ca2+ release. Conversely, FK506, which modulates FKBP and blocks calcineurin, increased IP3‐evoked Ca2+ release. Inhibition of calcineurin (okadiac acid or cypermethrin) also increased IP3‐evoked Ca2+ release and blocked FK506 effects. When calcineurin was inhibited, FK506 reduced IP3‐evoked Ca2+ release. These findings suggest that IP3‐evoked Ca2+ release is not modulated by FKBP, but by FK506‐mediated calcineurin inhibition. The RyR modulators caffeine and ryanodine failed to alter Ca2+ signalling suggesting that RyR is not functional in native endothelium.
Conclusion and Implications
The hypertensive effects of the immunosuppressant drugs FK506 and rapamycin, while mediated by endothelial cells, do not appear to be exerted at the documented cellular targets of Ca2+ release and altered FKBP binding to IP3 and RyR.
Abbreviations
- 2‐APB
2‐aminoethoxydiphenyl borate
- F
fluorescence intensity
- F0
baseline fluorescence intensity
- FKBPs
FK‐binding proteins
- IP3
inositol 1,4,5‐trisphosphate
- IP3R
inositol 1,4,5‐trisphosphate receptors
- RyR
ryanodine receptors
What is already known
FK506 and rapamycin modulate FK‐binding proteins (FKBP) but share the side effect of evoking hypertension.
Hypertension induced by FK506 and rapamycin is associated with reduced endothelial function and NO production.
What this study adds
FK506 increases IP3‐evoked Ca2+ release by calcineurin inhibition; rapamycin does not increase IP3‐evoked Ca2+ release.
RyR activation failed to evoke Ca2+ release, and ryanodine does not alter endothelial Ca2+ signals.
What is the clinical significance
The hypertensive effects of FK506 and rapamycin are not FKBP‐mediated in endothelial cells.
IP3‐mediated Ca2+ release may be modulated indirectly by FK506 through inhibition of calcineurin.
1. INTRODUCTION
https://www.guidetopharmacology.org/GRAC/LigandDisplayForward?ligandId=6784 (also known as tacrolimus) and https://www.guidetopharmacology.org/GRAC/LigandDisplayForward?ligandId=6031 (sirolimus) are immunosuppressant drugs that are used widely in organ transplantation to prevent tissue rejection (Jeanmart et al., 2002; Lemos et al., 2003; Wallemacq et al., 2009; Wallemacq & Reding, 1993). Rapamycin is also used in drug‐eluting stents to prevent re‐stenosis in patients with coronary artery disease (Abizaid, 2007; Serruys, Regar, & Carter, 2002). While the drugs are effective immunosuppressants, FK506 and rapamycin have the undesirable effect of causing hypertension in up to 70% of patients that are treated with the drugs (Lindenfeld et al., 2004; Lindenfeld et al., 2005; Taylor et al., 1999). The underlying causes of this immunosuppressant‐induced hypertension are not understood, but disruption of normal endothelial function and decreased production of the endogenous vasodilator https://www.guidetopharmacology.org/GRAC/LigandDisplayForward?ligandId=2509 are reported contributors (De Lima et al., 1999; Takeda, Miyamori, Furukawa, Inaba, & Mabuchi, 1999).
Endothelial function and NO production are critically controlled by the cytoplasmic Ca2+ concentration. In turn, endothelium‐derived Ca2+‐dependent mediators control vascular tone, nutrient exchange, blood cell recruitment, blood clotting, and the formation of new blood vessels (see Feletou, 2011). The endoplasmic reticulum (ER), the intracellular Ca2+ store, is of particular importance in regulating the cytoplasmic Ca2+ concentration in endothelial cells (Tran & Watanabe, 2006) from which release is controlled by two major channel receptor complexes—the inositol 1,4,5‐trisphosphate receptors (https://www.guidetopharmacology.org/GRAC/FamilyDisplayForward?familyId=123) and ryanodine receptors (https://www.guidetopharmacology.org/GRAC/FamilyDisplayForward?familyId=125). While the contribution of IP3R is of acknowledged significance in regulating Ca2+, the role of RyR in endothelial cells in intact arteries is less certain.
The cytoplasmic receptors for the immunosuppressant drugs FK506 and rapamycin have been identified as the FK‐binding proteins (https://www.guidetopharmacology.org/GRAC/ObjectDisplayForward?objectId=2609s; Bierer et al., 1990; Harding, Galat, Uehling, & Schreiber, 1989). FKBPs are accessory proteins of IP3R and RyR on the internal Ca2+ store. The association of FKBP with the IP3R and RyR is disrupted by FK506 and rapamycin and may change channel activity with consequences for Ca2+ signalling (Bultynck, De Smet, et al., 2001; Cameron, Steiner, Sabatini, et al., 1995; Dargan, Lea, & Dawson, 2002). Indeed, changes in the association of FKBPs with the channels may evoke significant effects on cardiovascular function. Genetic deletion of FKBP12.6 in mice causes hypertension (Long, Cook, Wu, & Mitchell, 2007). In rats, FK506 decreased production of the endothelium‐derived vasodilator NO and increased the production of the contractile agent endothelin (Takeda et al., 1999). In human and rat resistance arteries in vitro, FK506 increased the sensitivity to https://www.guidetopharmacology.org/GRAC/LigandDisplayForward?ligandId=484 and impaired vasodilation to https://www.guidetopharmacology.org/GRAC/LigandDisplayForward?ligandId=294 and https://www.guidetopharmacology.org/GRAC/LigandDisplayForward?ligandId=9533 (De Lima et al., 1999). Reduced endothelium‐dependent relaxation was also reported in mouse aorta after FK506 treatment (Chiasson et al., 2011; Cook, Chiasson, Long, Wu, & Mitchell, 2009). These findings raise the possibility that IP3R and RyR may contribute to the altered endothelial function induced by the immunosuppressant drugs. However, the precise nature of the control that FKBP might exert on IP3R and RyR is uncertain.
In the case of IP3R, some investigations have found removal of FKBP12 decreased https://www.guidetopharmacology.org/GRAC/LigandDisplayForward?ligandId=4222‐mediated Ca2+ release (MacMillan, Currie, Bradley, Muir, & McCarron, 2005), while (in bilayer studies) addition of exogenous FKBP12 increased IP3R channel activity (Dargan et al., 2002). These results suggest that FKBP12 potentiates IP3R activity. On the other hand, FKBP12 may inhibit channel activity, and removal of FKBP12 from the channel increased IP3R‐mediated Ca2+ release in rat cerebral microsomes and smooth muscle (Cameron, Steiner, Sabatini, et al., 1995). Despite the importance of IP3‐mediated Ca2+ release to the control of endothelial function, there are no investigations that have examined FKBP regulation of IP3‐mediated Ca2+ release in endothelial cells.
FKBP12 may also associate with RyR (Bradley, Currie, MacMillan, Muir, & McCarron, 2003; Bultynck, De Smet, et al., 2001; Carmody, Mackrill, Sorrentino, & O'Neill, 2001; MacMillan et al., 2005; MacMillan, Currie, & McCarron, 2008; Tang, Chen, Zou, Campbell, & Li, 2002; Wang et al., 2004; Zheng et al., 2004). Removal of FKBPs from RyR by either FK506 or rapamycin increased RyR channel open probability in lipid bilayers (Kaftan, Marks, & Ehrlich, 1996; Tang et al., 2002) and Ca2+ signals in intestinal, colonic, bladder, and pulmonary artery myocytes (Bielefeldt, Sharma, Whiteis, Yedidag, & Abboud, 1997; MacMillan et al., 2008; Weidelt & Isenberg, 2000; Zheng et al., 2004). In mesenteric and human small resistance arteries, FK506 induced vasoconstriction (De Lima et al., 1999; Schwertfeger, Wehrens, Oberhauser, Katzenwadel, & Rump, 2001), while in rat vas deferens, rapamycin decreased phenylephrine‐induced contractions as a result of Ca2+ leak via RyR (Scaramello, Muzi‐Filho, Zapata‐Sudo, Sudo, & Cunha Vdo, 2009). FKBP12.6 deficient mice showed increased spontaneous Ca2+ release from the internal store when compared with wild type urinary bladder myocytes (Ji et al., 2004). Rebinding either FKBP12 or FKBP12.6, following their removal, decreased channel opening (Barg, Copello, & Fleischer, 1997; Brillantes et al., 1994; Bultynck, Rossi, et al., 2001; Mayrleitner, Timerman, Wiederrecht, & Fleischer, 1994; Timerman et al., 1993). There are also reports of Ca2+ release via RyR being altered by FKBP in endothelial cells. In cultured mouse aortic endothelial cells depletion of FKBP increased endothelial intracellular Ca2+ leak via RyR, suggesting that FKBP stabilized the channel in the closed state (Cook et al., 2009; Long et al., 2007). Furthermore, rapamycin or FK506 decreased NO production and endothelium‐dependent dilation and increased systolic BP (Long et al., 2007).
However, evidence does not universally support a role of FKBPs in regulating either RyR or IP3R activity. In some studies, no interaction was found to occur between FKBP and either RyR (Carmody et al., 2001; Murayama et al., 1999; Wang et al., 2004; Zheng et al., 2004) or IP3R (Bultynck, De Smet, et al., 2001; Carmody et al., 2001; Thrower et al., 2000; Zheng et al., 2004). Functional studies also failed to detect any effect of the drug FK506 or protein FKBP on IP3‐mediated Ca2+ release (Boehning & Joseph, 2000; Bultynck, De Smet, et al., 2001; Bultynck et al., 2000; Kanoh et al., 1999) or RyR channel function (Barg et al., 1997; duBell, Wright, Lederer, & Rogers, 1997; Epstein, Beall, Wynn, Mulloy, & Brophy, 1998; Timerman et al., 1996; Xiao et al., 2007; Yasutsune et al., 1999).
In addition to binding to the IP3R and RyR, FKBPs may regulate kinase and phosphatase activity. The different modes of action of separate signalling pathways may account, in part, for the contradictory findings on IP3R and RyR modulation by FKBP. Removal of FKBP from either IP3R or RyR by FK506 results in the formation of a FK506‐FKBP complex, which inhibits the Ca2+/calmodulin‐dependent serine/threonine phosphatase calcineurin (Liu et al., 1991). Calcineurin may mediate the immunosuppressive actions of FK506 (Liu et al., 1992), contribute to various cellular functions (Guerini, 1997; Klee, Ren, & Wang, 1998), and regulate RyR and IP3R to control Ca2+ release (Bandyopadhyay, Shin, Ahn, & Kim, 2000; Cameron et al., 1997; Cameron, Steiner, Roskams, et al., 1995; Cameron, Steiner, Sabatini, et al., 1995; MacMillan et al., 2008; Shin et al., 2002). In support, calcineurin inhibitors increased https://www.guidetopharmacology.org/GRAC/LigandDisplayForward?ligandId=407‐ and ryanodine‐induced Ca2+ release and the frequency and amplitude of Ca2+ oscillations in cardiac and skeletal muscle (Bandyopadhyay, Shin, Ahn, & Kim, 2000; Shin et al., 2002). In COS‐7 cells and cerebellar microsomes, calcineurin inhibition increased ATP‐induced Ca2+ release and IP3R activity (Bandyopadhyay, Shin, & Kim, 2000; Cameron, Steiner, Roskams, et al., 1995) whereas expression of a constitutively active form of calcineurin inhibited Ca2+ release (Bandyopadhyay, Shin, & Kim, 2000). Conversely, other studies have shown that drugs that inhibit calcineurin, such as cypermethrin, cyclosporin A, or okadaic acid, did not alter Ca2+ release via either RyR or IP3R (Ashizawa, Kobayashi, Tanaka, & Nakayama, 1989; Avdonin et al., 1999; Cook et al., 2009; Frapier et al., 2001; Hirano, Kanaide, & Nakamura, 1989; Macmillan & McCarron, 2009; Zheng et al., 2004). The comparatively few studies in endothelial cells also yielded contradictory findings. In cultured endothelial cells (ECV304, BPAECs, and HPAECs), the calcineurin inhibitors okadaic acid, cyclosporin A, or calyculin A evoked Ca2+ release from the ER (Hepworth, Lawrie, & Simpson, 1997; Kolozsvari et al., 2012). However, calcineurin activity failed to alter Ca2+ in cultured aortic endothelial cells (Cook et al., 2009). Together, these studies highlight a confused picture of the regulation of endothelial Ca2+ signalling by FKBP and its disruption via the immunosuppressant drugs FK506 and rapamycin.
The present study was undertaken in view of the controversy which surrounds the effects of the drugs FK506 and rapamycin on intracellular Ca2+ release, their importance as immunosuppressant drugs, associated hypertension side effects, and the absence of information on the role of FKBP on IP3‐mediated Ca2+ release. Ca2+ was measured in endothelial cells of intact mesenteric arteries. Around 100 cells were analysed separately from each preparation and cellular responses before and after various pharmacological interventions were paired. The use of photolysed caged IP3 to activate IP3R minimized the number of second messenger systems activated. The study has shown that pharmacological modulation of FKBP from IP3R with FK506 increased IP3‐evoked Ca2+ release. Cypermethrin and https://www.guidetopharmacology.org/GRAC/LigandDisplayForward?ligandId=5349 (drugs which can inhibit calcineurin) each increased IP3‐evoked Ca2+ release and prevented the FK506‐induced increase in Ca2+ release. Rapamycin, which removes FKBP from the receptors but does not inhibit calcineurin, did not alter IP3‐evoked Ca2+ release. Thus, calcineurin is required for the potentiation of IP3‐evoked Ca2+ release by FK506. The RyR activator caffeine did not evoke Ca2+ release in the endothelium in intact arteries, suggesting that RyR does not play a role in endothelial Ca2+ modulation. Our results suggest that IP3R‐mediated Ca2+ release may be modulated (a) indirectly by FKBP through inhibition of calcineurin, and (b) FKBPs by themselves do not appear to regulate Ca2+ release in endothelial cells.
2. METHODS
2.1. Animals
All animal husbandry and experimental procedures were carried out in accordance with the prior approval of the University of Strathclyde Animal Welfare and Ethical Review Body and under relevant UK Home Office Regulations (Schedule 1 of the Animals [Scientific Procedures] Act 1986, UK). Strathclyde BPU is a conventional unit which undertakes FELASA quarterly heath monitoring. Male Sprague–Dawley rats (10–12 week old; 250–300 g), from an in‐house colony, were used for the study. The animals were housed three per cage, and the cage type was North Kent Plastic model RC2F with nesting material “Sizzle Nest.” A 12:12 light dark cycle was used with a temperature range of 19–23°C (set point 21°C) and humidity levels between 45% and 65%. Animals had free access to fresh water and SDS diet RM1 (rodent maintenance). The enrichment in the cages was aspen wood chew sticks and hanging huts. Animal studies are reported in compliance with the ARRIVE guidelines (Kilkenny, Browne, Cuthill, Emerson, & Altman, 2010) and with the recommendations made by the British Journal of Pharmacology (McGrath & Lilley, 2015).
All experiments used either the aorta or second‐order mesenteric arteries (as described) obtained from male Sprague–Dawley rats (10–12 weeks old; 250–350 g), killed by an overdose of pentobarbital sodium (200 mg·kg−1, i.p.). Sprague–Dawley rats are a widely used experimental model with a wealth of background information to aid interpretation of results. Controls and experimental treatments were carried out in the same tissue, so blinding and randomization were not used.
2.2. Mesenteric artery preparation and mounting
Arteries were prepared as previously described (Wilson, Lee, & McCarron, 2016). In brief, the mesenteric bed was removed immediately following killing. Second‐order mesenteric arteries were dissected and opened longitudinally using microscissors. The arteries were pinned out on a Sylgard block using 50‐μm diameter wire with the endothelial layer exposed. Throughout this procedure, preparations were kept in physiological salt solution (PSS; 145‐mM NaCl, 2‐mM MOPS, 4.7‐mM KCl, 1.2‐mM NaH2PO4, 5‐mM glucose, 0.02‐mM EDTA, 1.17‐mM MgCl2, 2‐mM CaCl2, pH 7.4). Arteries were then incubated with the Ca2+ indicator Cal‐520 (5 μM) with 0.02% Pluronic F‐127 for 30 min at 37°C. After washing in PSS, preparations were placed face down on 200‐μm diameter stainless steel pins on a 0 grade thickness coverslip that was fixed to the bottom of a custom bath chamber (3 cm × 1.5 cm; Wilson, Lee, & McCarron, 2016).
2.3. Mesenteric artery image acquisition and analysis
Images were acquired using a Nikon Eclipse TE300 inverted microscope body with a 40× 1.3 NA Nikon S Fluor oil‐immersion objective lens, imaged onto an Andor iXon EMCCD camera, cropped to 512 × 512 pixels. A CoolLED pE‐300 LED system with 405/488/561 nm excitation light was used in conjunction with custom‐designed FITC/TRITC excitation and emission filters and beamsplitter. All acquisition was performed through MicroManager v1.4.22 (Edelstein et al., 2014).
2.4. Localized IP3 uncaging
A Rapp Optoelectronics flash lamp (00‐325‐JML‐C2) used at 200 V produced light of ~1‐ms duration, which was passed through a 395‐nm short pass filter into a 1250‐μm diameter light guide (McCarron et al., 2010; Olson, Chalmers, & McCarron, 2012). The light guide was fixed to a spot illumination adaptor, mounted onto the epi‐illuminator of the microscope and focussed using broadband light. For each imaging session, an image was taken using this broadband light to identify the uncaging region. The uncaging region had a diameter of ~70 μm.
For uncaging, second‐order mesenteric arteries were prepared as previously described and incubated with 5‐μM Cal‐520 and 5‐μM membrane‐permeant Ins(1,4,5)P3‐caged IP3 (SiChem) in PSS for 30 min at 37°C. Image acquisition was performed at 10 fps for 1,000 frames (1 min 40s), with uncaging performed after 15 s. Fifteen minutes were left between each uncaging event to ensure Ca2+ stores had fully replenished. All uncaging events were recorded in triplicate.
The endothelium was incubated with rapamycin (10 μM), FK506 (10 μM), okadaic acid (5 μM), or cypermethrin (10 μM) for 30 min before repeat recordings on the same preparation were taken. Preparations were incubated in https://www.guidetopharmacology.org/GRAC/LigandDisplayForward?ligandId=2433 (500 μM) for 10 min.
2.5. ACh‐stimulated Ca2+ signalling
Arteries were mounted in custom‐made imaging chambers. The imaging chambers were fitted with a perfusion pump (set to 1.5 ml·min−1) to flow solutions and an aspirator to remove waste. To avoid “run‐up” of the ACh responses (Figure S1), preparations were stimulated with ACh (50 nM) in PSS (15 min), washed with PSS (15 min) twice before the experiments were started.
Experiments were performed in triplicate, with baseline recordings followed by pharmacological perturbation. Images were acquired at 10 fps for 2,000 frames (3 min 20 s) and washed for 20 min with PSS, all performed under flow (1.5 ml·min−1). Following controls, arteries were incubated with FK506 (10 μM), okadaic acid (5 μM), or cypermethrin (10 μM) for 30 min under no flow conditions before repeat recordings were taken in the same preparation. Preparations were incubated in 2‐APB (500 μM) for 10 min.
2.6. Effects of ryanodine on Ca2+ signalling
Arteries were prepared as previously described and incubated with Cal‐520 (5 μM) in PSS for 30 min at 37°C. Image acquisition was performed at 10 fps for 1,000 frames (1 min 40s), with stimulation performed after 30 s. Fifteen minutes were left between each recording session. Preparations were incubated with ryanodine (30 μM), caffeine (10 mM), or combinations of both and stimulated with ACh (50 nM) as described in the text.
2.7. Image analysis
Image analysis was performed using methods adapted from Wilson, Lee, and McCarron (2016). In brief, cell location and shift in cell position between technical replicates were initially determined using Fiji (RRID:SCR_002285) to create matched coordinates for each cell over repeated imaging sessions. A semi‐automated Python‐based code adapted from Wilson, Lee, and McCarron (2016), Wilson, Saunter, Girkin, and McCarron (2016), and Wilson, Saunter, Girkin, and McCarron (2015) was used to extract and process Ca2+ signals from regions of interest placed on each cell. Raw signals were expressed as baseline‐corrected fluorescence intensity (F/F 0) by dividing each intensity trace by an averaged 100‐frame baseline period at the start of each trace. These signals were then smoothed by a 21‐point third‐order polynomial Savitzky–Golay filter. Key curve parameters (e.g., amplitude, frequency, and number of cells) were calculated using an automated algorithm and peaks identified using a zero crossing detector for the derivative of the trace (Wilson, Lee, & McCarron, 2016). The time and amplitude of these peaks could then be extracted.
In uncaging experiments, before image analysis was performed, a mask was applied to the raw data to only analyse cells in which IP3 was directly uncaged. The uncaging region occupied a fraction of the overall field so these experiments had a lower number of cells per experiment than ACh‐evoked signalling.
To determine whether or not FK506 or rapamycin evoked “Ca2+ leak” from the internal store, the number of cells showing spontaneous Ca2+ activity at baseline (Frames 1–150) were manually counted for each biological replicate.
2.8. Endothelial patch isolation
The aorta was dissected, collected into PSS with sodium pyruvate (NaPy, 2 mM), the surrounding fat removed, washed, and pinned out, removing any remaining blood. The aorta was then cut into small strips and incubated in collagenase (Type 3, 2 mg·ml−1 in PSS + 2 mM NaPy) for 20 min at 37°C in a water bath. The collagenase was gently removed and PSS + 2 mM NaPy +1% BSA used to gently wash the tissue three times. A glass Pasteur pipette was cut to a length of ~2 cm, flame‐sterilized and rounded off, and used to titurate the tissue vigorously 20 times. Patches were then placed on an EtOH‐sterilized glass coverslip in an imaging chamber and left to settle for 3 hr.
2.9. Endothelial patch image acquisition
Patches were loaded with Cal‐520 (5 μM) for 30 min and mounted on the inverted microscope previously described. A gravity‐driven perfusion set‐up in conjunction with an aspirator was used to gently change solution without disturbing endothelial cell patches. Cells were imaged at 10 fps with PSS being gravity‐perfused to provide a baseline recording of 5000 frames (8 min 20 s). Without stopping perfusion, ACh (50 nM in PSS + 2 mM NaPy) was then administered for a further 5000 frames, to ensure endothelial cells within the patch were fully responsive. Patches were washed with PSS + 2 mM NaPy for a further 5,000 frames, and then caffeine (10 mM in PSS + 2 mM NaPy) was administered for a further 5,000 frames and the corresponding Ca2+ signals acquired.
2.10. Endothelial patch image analysis
Cells were manually identified, and the F/F 0 intracellular Ca2+ levels calculated. Data were smoothed over 20 data points and the resulting traces plotted in MATLAB R2018a (The Mathworks Inc, Natick, Massachusetts, United States; RRID:SCR_001622).
2.11. FKBP12 immunocytochemistry
The antibody‐based procedures used in this study comply with the recommendations made by the British Journal of Pharmacology (Alexander et al., 2018). Second‐order mesenteric arteries were dissected and then pinned out on Sylgard bases in six well plates, fixed with freshly prepared paraformaldehyde (4%), and left overnight at 4°C. All washes were performed for 5 min unless otherwise stated. After washing three times with 0.1‐M glycine, preparations were washed three times in PBS and permeabilized for 10 min in 0.2% Triton‐X100. Preparations were then washed three times in PBS, three times in an antibody wash solution (20× SSC, 0.05% Triton‐X100 in ddH20), and blocked in 5% BSA for 1 hr. Preparations were next washed three times in antibody wash solution and incubated overnight at 4°C either with the primary antibody (Abcam rabbit polyclonal Anti‐FKBP12, Ab2918) or without it (for a no‐primary control) in antibody buffer (20× SSC, 2% donkey serum, 1% BSA, 0.05% Triton X‐100, 0.02% sodium azide in ddH20). Preparations were then washed three times in antibody wash solution and incubated with a secondary antibody (Invitrogen AF488 donkey anti‐rabbit, A‐21206) in antibody buffer for 1 hr at room temperature then washed three times in antibody wash solution. Immediately prior to imaging, preparations were incubated in 4‐nM DAPI for 5 min and washed with PBS. A Nikon Eclipse FNI upright microscopy body with a Nikon Fluor 40× 0.8 NA water immersion objective lens, illuminated by a pE‐4000 CoolLED system at 365 and 470 nm, was used to image the preparations; 100 images were acquired and an average image intensity projection taken using Fiji (Schindelin et al., 2012).
2.12. Data and statistical analysis
The data and statistical analysis comply with the recommendations of the British Journal of Pharmacology on experimental design and analysis in pharmacology (Curtis et al., 2018). Biological replicates are presented as graphical summary data. These were averaged, paired responses in arteries from ≥5 different animals. Mean values are shown as means ± SEM. Technical replicates are the three repeat measurements of each conditions. Raw peak F/F 0 responses were log transformed to ensure normal distribution of the data, analysed statistically using either a paired Student's t test or a two‐way ANOVA with Tukey's multiple comparisons test on Prism, version 6.0 (GraphPad, La Jolla, CA, USA; RRID:SCR_005375), and the means back‐transformed for data presentation. P < .05 was considered statistically significant.
2.13. Materials
Ins(1,4,5)P3‐caged IP3 was obtained from SiChem. Cal‐520/AM, anti‐FKBP12, and donkey serum were obtained from Abcam (Cambridge, MA, USA). Pluronic F‐127 was obtained from Invitrogen (Carlsbad, CA, USA). AF488 donkey anti‐rabbit was obtained from Invitrogen. FK506, rapamycin, cypermethrin, okadaic acid, caffeine, 2‐APB, and all other chemicals were obtained from Sigma‐Aldrich (St. Louis, MO, USA). All solutions were freshly prepared each day.
2.14. Nomenclature of targets and ligands
Key protein targets and ligands in this article are hyperlinked to corresponding entries in http://www.guidetopharmacology.org/, the common portal for data from the IUPHAR/BPS Guide to PHARMACOLOGY (Harding et al., 2018), and are permanently archived in the Concise Guide to PHARMACOLOGY 2019/20 (Alexander, Fabbro et al., 2019a; Alexander, Mathie et al., 2019b).
3. RESULTS
3.1. Ca2+ release from the intracellular store
Ca2+ release from intracellular stores within endothelial cells may occur via IP3R or RyR, or both. As a first step in determining the contribution of IP3R and RyR, cells were activated with the IP3‐mobilizing agonist ACh (50 nM; Figure 1a; Video S1). ACh evoked reproducible increases in Ca2+ (Figure 1a(i–iii)). To verify that ACh‐evoked Ca2+ increases were IP3‐dependent, arteries were incubated with the IP3R antagonist 2‐APB (500 μM) for 10 min and ACh reapplied to the same preparation (Figure 1b). In the presence of 2‐APB, ACh no longer evoked Ca2+ increases (Figure 1b). To confirm that 2‐APB (500 μM for 10 min) was not cytotoxic, preparations were subsequently stained with propidium iodide (1.5 μM) then washed for >30mins and restimulated with ACh (Figure S2). After the protocol, cells were largely unaffected (one cell death occurred in a field of ~300 cells, yellow arrow, Figure S2B). The Ca2+ response to ACh was eliminated in the presence of 2‐APB but was partly restored after PSS washing (Figure S2A–D).
Figure 1.
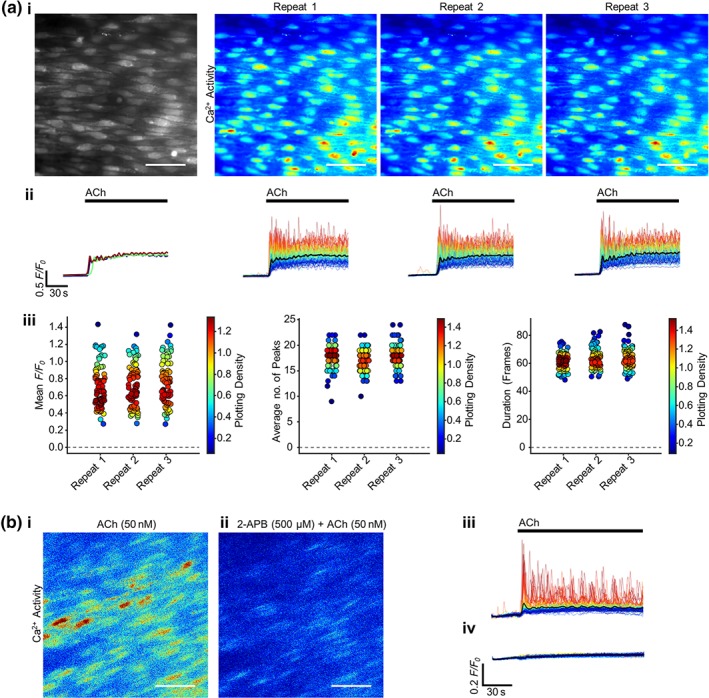
ACh evokes reproducible Ca2+ increases that are blocked by the IP3R antagonist 2‐APB. (a) Reproducible ACh‐evoked (50 nM, 1.5 ml·min−1) Ca2+ signalling in ~100 cells, (i) represented as average intensity (grayscale) and contrast‐matched images of Ca2+ activity (JET LUT) for each repeat ACh application (15 min apart). (ii) Individual F/F 0 Ca2+ traces from each cell are shown, with traces coloured according to intensity of response from red to blue, and the average signal overlaid in black. The average signal for each repeat is plotted in the graph on the left. ACh activation is indicated by bars above the traces. (iii) Summary data of the mean F/F 0 value from each cell, the average number of oscillation peaks per cell, and the mean duration of the responses for each of the three repeats. The colour of each point corresponds to the density of the plotted points. (b) Representative contrast‐matched (JET LUT) images of ACh‐evoked Ca2+ activity (i) in the absence or (ii) presence of the IP3R antagonist 2‐APB (500 μM, 10‐min incubation). The corresponding F/F 0 traces are shown (average signal overlaid in black) (iii) in the absence or (iv) presence of 2‐APB, with the ACh application indicated with a bar above the trace. Scale bars = 50 μm
To confirm the efficacy of IP3 in evoking Ca2+ release, the inositide was flash‐released using a photoactivatable form of caged‐IP3 in a localized group of endothelial cells (Figure 2a, region highlighted by yellow circle; Video S2). Photo‐release of caged‐IP3 generated rapid, reproducible Ca2+ transients in the endothelial cells targeted for photolysis. Ca2+ release evoked by photolysis of caged IP3 was also blocked by 2‐APB (Figure 2b).
Figure 2.
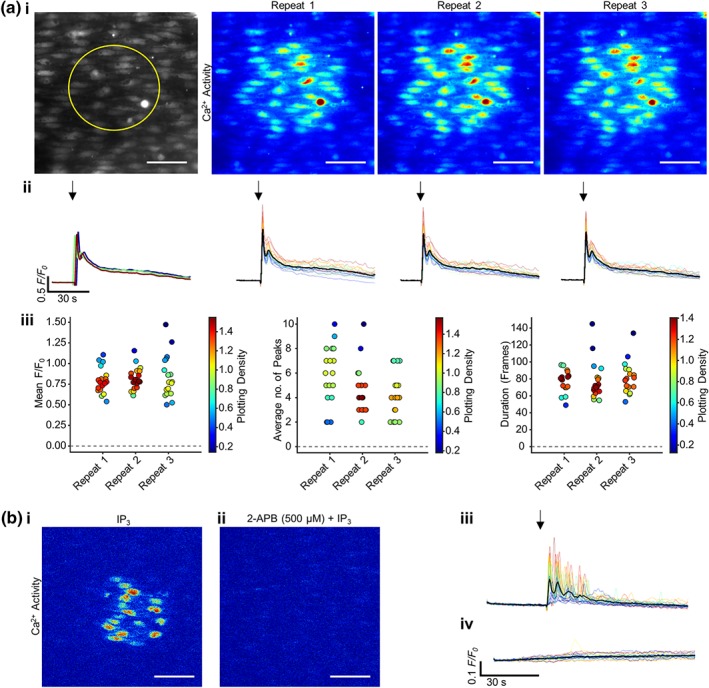
Photo‐uncaged IP3 evokes reproducible Ca2+ responses that are blocked by the IP3R antagonist 2‐APB. (a) Reproducible IP3‐activated (5 μM) Ca2+ signalling in ~30 endothelial cells, represented as average intensity (grayscale; left. Yellow circle represents the subsequent uncaging region) and contrast‐matched (JET LUT) images of Ca2+ activity each repeat application (15 min apart). (ii) Individual F/F 0 Ca2+ traces from each cell are shown, with traces coloured according to intensity of response from red to blue, and the average signal overlaid in black. The average signal for each repeat is plotted in the graph on the left. Activation is indicated by an arrow above the image. Only cells in which IP3 was directly uncaged were analysed. (iii) Summary data on the average F/F 0 value from each cell, the average number of oscillation peaks per cell, and the mean duration of the responses for the three repeats. The colour of each point corresponds to the density of the plotted points. (b) Representative contrast‐matched JET LUT images of IP3‐evoked Ca2+ activity (i) in the absence or (ii) presence of the IP3R antagonist 2‐APB (500 μM, 10‐min incubation). The corresponding F/F 0 traces are shown (average signal overlaid in black) (iii) in the absence or (iv) presence of 2‐APB, with the stimulus indicated by an arrow. Scale bars = 50 μm
3.2. RyR does not contribute to Ca2+ signals arising from the internal store
To determine the extent to which RyRs contribute to Ca2+ release from the endothelial intracellular store, the potent RyR activator, caffeine (10 mM) was applied. While the artery rapidly responded by contracting, as the smooth muscle cells activated, there was no endothelial Ca2+ signal evoked by caffeine (Figure 3a; Video S3). A quantitative analysis of caffeine‐induced signal intensity was not possible because of the arterial contraction which moved cell positions, so aortic endothelial patches were dissociated from smooth muscle cells and imaged (Figure 3b). Endothelial patches were imaged first to obtain a baseline recording (8 min) in PSS flow. Next ACh (1 μM, 8 min) was applied to the endothelial patches followed by a wash period (20‐min PSS) and finally caffeine (10 mM; 8 min; Figure 3b(i–ii); Video S4). A representative image of a patch is shown in Figure 3b(ii), and the corresponding F/F 0 traces of the highlighted cell is plotted in Figure 3b(iii). The endothelial cell showed no response to PSS flow but had a substantial Ca2+ response to ACh. As in the intact artery, there was no Ca2+ response to caffeine. On average, over five biological repeats, 96% endothelial cells analysed responded to ACh, while only 16% were active during caffeine perfusion, which was lower than the number of cells expected from baseline spontaneous activity (on average 48% cells; Figure 3b; iv). The higher percentage of cells showing basal activity is likely to be a consequence of the smaller number of cells in the endothelial patches (when compared to the intact artery), and the use of sodium pyruvate in the PSS which leads to a greater basal Ca2+ response to shear stress (Wilson, Lee, & McCarron, 2016). The lower number of cells showing baseline spontaneous Ca2+ signals in caffeine probably reflects a caffeine‐induced inhibition of IP3R activity that generates the spontaneous activity (Brown, Sayers, Kirk, Michell, & Michelangeli, 1992; Missiaen, Taylor, & Berridge, 1992; Parker & Ivorra, 1991; Wilson et al., 2019). These results show that ACh evokes a substantial Ca2+ increase while caffeine does not. Agonists of RyR do not appear to mediate Ca2+ release from the mesenteric or aortic endothelium.
Figure 3.
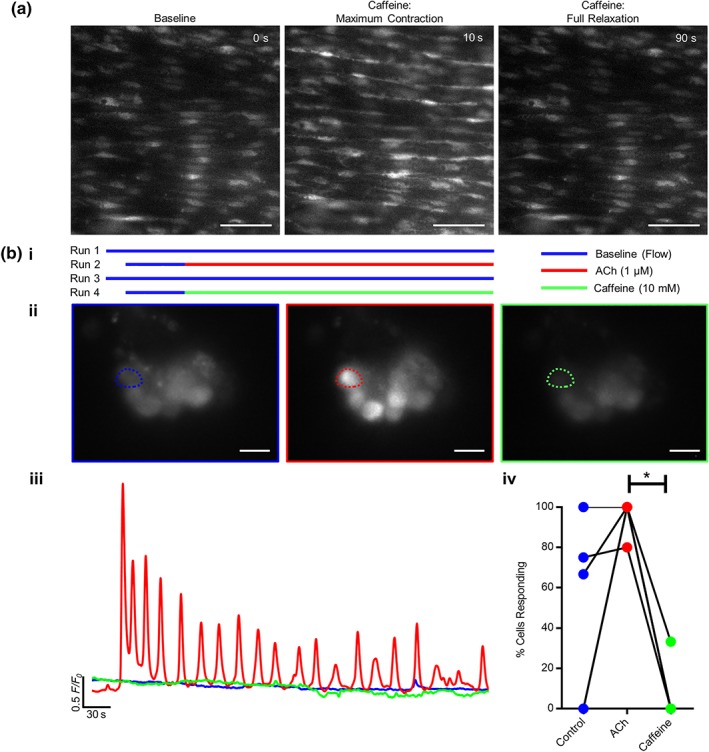
RyR do not contribute to endothelial cell Ca2+ release. (a) Representative images of endothelial Ca2+ levels in intact mesenteric arteries using the en face preparation. Caffeine (10 mM) evokes a substantial transient contraction of the artery. Endothelial Ca2+ images are shown at rest (baseline), after the maximum vessel caffeine‐evoked contraction, and after the artery returned to its initial diameter (full relaxation). All images are contrast‐level matched. The endothelial image after the maximum contraction appears brighter because of the vessel contraction squeezing the cells so that more indicator is present in the same area; see also Video S3. Scale bar = 50 μm. (b) (i) A schematic representation of the experimental protocol showing the periods of recording during each experiment. (b) (ii) Ca2+ images in isolated aortic endothelial cell patches in response to basal perfusion (control, left), perfusion with ACh (1 μM; middle), and after caffeine (10 mM; right; scale bar = 10 μm). (iii) F/F 0 Ca2+ traces from the cells indicated in (ii). (iv) Paired summary data showing the effect of each agonist on the percentage of cells exhibiting Ca2+ activity. In this analysis, any activity is counted as a responding cell, and the results show that caffeine inhibits basal Ca2+ activity (n = 5, overlapping data points appear as single circles; * P < .05, significantly different as indicated)
To confirm that RyRs do not mediate mesenteric endothelial Ca2+ regulation, after a basal ACh (50 nM) stimulation, preparations were washed and stimulated using ryanodine alone (30 μM). Preparations were washed and caffeine (10 mM) added to cause the characteristic artery contraction and relaxation. Ryanodine was then added to the caffeine‐stimulated preparations (Figure 4a–e; ). Practically no endothelial Ca2+ responses were elicited in response to ryanodine in the absence (0.05 ± 0.02 AFU; mean values ± SEM) or presence (0.006 ± 0.003 AFU) of caffeine, when compared with a basal ACh response (0.3 ± 0.06 AFU). Preparations were washed and again incubated with ryanodine for 15 min, followed immediately by ryanodine and caffeine stimulation (0.001 ± 0.001 AFU). Again, no response was seen in preparations. When caffeine was removed and ACh (50 nM) added to the ryanodine, a strong Ca2+ response was elicited (Figure 4b(i–iii); 0.54 ± 0.08 AFU). These experiments again suggest that RyR do not have a functional role in mesenteric endothelial Ca2+ regulation.
Figure 4.
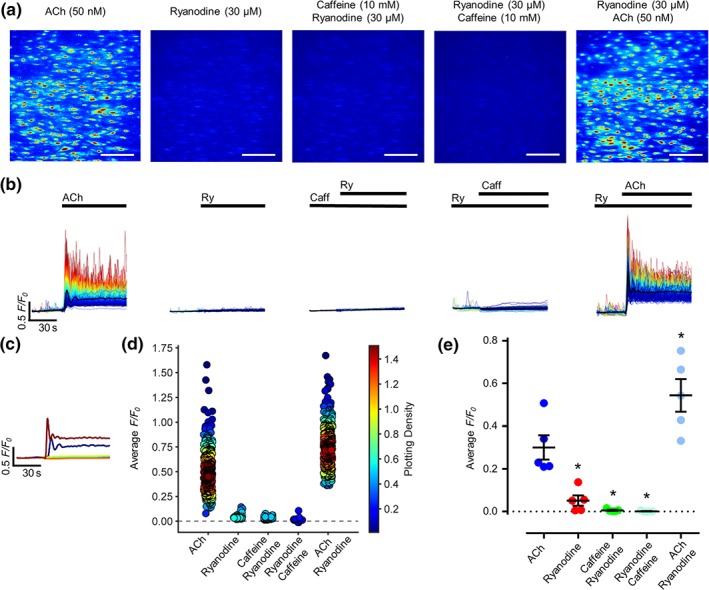
RyR does not contribute to endothelial cell Ca2+ release. (a) Representative, contrast‐matched images of endothelial Ca2+ levels in an intact mesenteric artery using the en face preparation after ACh (50 nM) or ryanodine (30 μM) administration, ryanodine added in the presence of caffeine (10 mM), caffeine added in the presence of ryanodine, or ACh added in the presence of ryanodine. Images are shown using JET LUT. Scale bar = 100 μm. (b) Individual F/F 0 Ca2+ traces from each cell are shown for each of the above conditions. Traces are coloured according to intensity of response from red to blue, and the average signal overlaid in black. Reagents present are indicated by a bar above the image. (c) Average trace for each condition plotted alone. (d) Summary data on the average F/F 0 value from each cell for each of the conditions. The colour of each point corresponds to the density of the plotted points. (e) Average F/F 0 value for each biological replicate for each condition. n = 5; * P < .05, significantly different from baseline ACh recording; all data are matched
3.3. FK506 modulates IP3‐evoked Ca2+ signals by calcineurin inhibition
In other tissues, FKBP12 has been shown to regulate Ca2+ release from the internal store. However, very little is known about the role of FKBP in endothelial cell Ca2+ modulation. To first establish whether or not FKBP12 is present in endothelial cells, immunohistochemistry was performed (Figure 5). FKBP12 (green puncta) was present throughout the endothelial cell cytoplasm (Figure 5a(i–ii)). Staining was absent in controls that lacked the primary antibody (Figure 5b). These results confirm the presence of FKBP12 in mesenteric artery endothelial cells.
Figure 5.
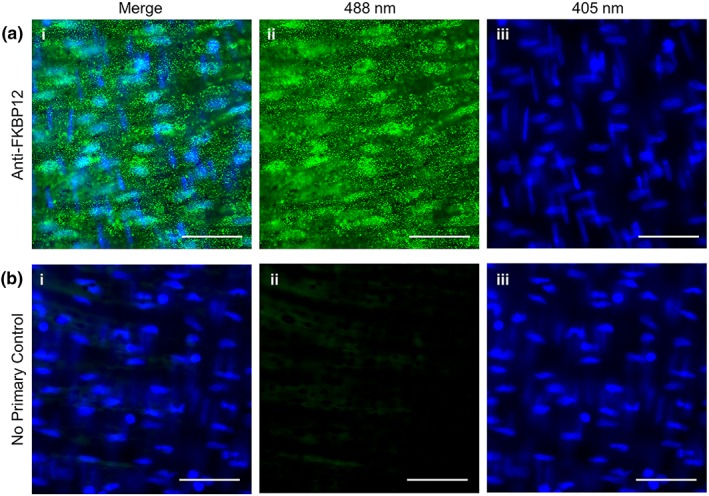
FKBP12 is present in mesenteric arterial endothelial cells. Representative en face mesenteric arterial preparations stained with (a) an anti‐FKBP12 antibody (green) or (b) with a no‐primary antibody control (non‐specific binding). Images are shown (i) merged, (ii) the 488‐nm channel alone, or (ii) the 405‐nm DAPI channel alone. Each image is an average projection of 100 images, and all images are contrast matched. Scale bars = 50 μm. Representative of three separate experiments
FK506 disrupts binding of FKBP to IP3R and may result in “leaky” channels (Liu et al., 2018) as occurs with RyR (Long et al., 2007). However, the present results showed no change in basal Ca2+ signalling activity in the presence of FK506 (Figure S3) suggesting no change in channel “leak.” To further investigate the role FKBP12 plays in endothelial Ca2+ regulation, IP3Rs were stimulated before and after incubation with FK506 (10 μM). In each experiment, ~100 endothelial cells were studied, and all comparisons were matched between cells in the same preparation. IP3R activation was achieved either by flash release of a caged form of IP3 (5 μM) in a localized group of endothelial cells (Figure 6a) or by ACh (50 nM; 1.5 ml·min−1, Figure 6b).
Figure 6.
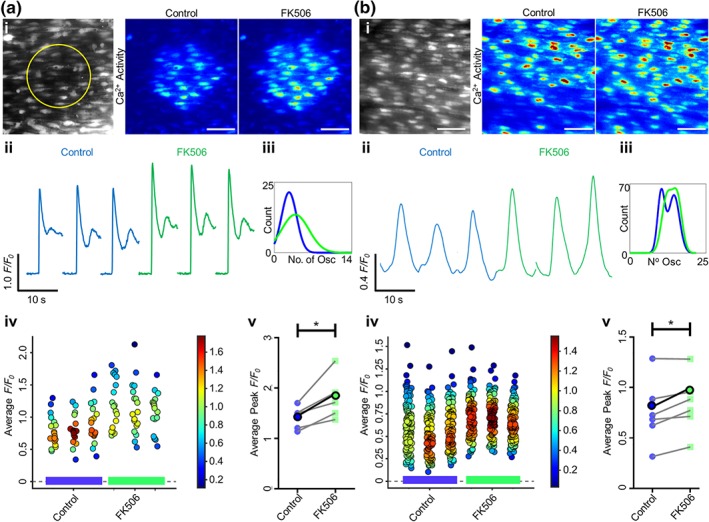
FK506 increases endothelial IP3‐ and ACh‐evoked Ca2+ release. Ca2+ release was stimulated via either (a) localized photolysis of caged IP3 (5 μM) or (b) ACh (50 nM; flow at 1.5 ml·min−1). Only cells within which IP3 was directly uncaged were analysed; therefore, more cells were analysed per artery for ACh stimulation. (i) Average intensity images of the endothelial cell field at baseline (grayscale, yellow circle represents the subsequent uncaging region) and representative contrast‐matched images (Jet LUT) of paired endothelial cell Ca2+ levels after IP3 or ACh stimulation under control conditions or after 30‐min incubation with FK506 (10 μM). Scale bars = 50 μm. (ii) Representative individual F/F 0 traces from 10‐s recordings after stimulation for a single cell are shown. Control (blue) and FK506‐treated (green) traces are compared for each technical replicate within an experiment. (iii) Fitted curves for histograms illustrating the spread of the average number of oscillations per cell for control and FK506‐incubated conditions across all technical and biological repeats. (iv) Summary data for the average F/F 0 value from each cell (colour corresponds to the density of the plotted points). Data are technical repeats from a single experiment, with control and FK506‐incubated recordings indicated with a blue or green bar beneath the data respectively. (v) Peak F/F 0 signals averaged for each cell and across three technical replicates for each biological repeat, compared between control and FK506. Each biological replicate is shown, with the average highlighted in bold. n = 5,6; * P < .05, significantly different as indicated
FK506 evoked an increase in the Ca2+ transient generated by each method of IP3R activation (Figure 6i,ii). The peak ΔF/F 0 amplitude was significantly increased after FK506 incubation for IP3‐evoked (n = 5, 1.41 ± 0.10 to 1.81 ± 0.20) and ACh‐evoked (n = 6, 0.78 ± 0.1 to 0.85 ± 0.1) signals (Figure 6v). Likewise, the average cell ΔF/F 0 (Figure 6iv) increased after FK506 incubation for both IP3 and ACh stimulation. Analysis of the distribution of Ca2+ oscillations shows a shift towards a larger number of oscillations after incubation with FK506 under both types of IP3R stimulation (Figure 6iii).
The FKBP‐FK506 complex inhibits calcineurin. To determine whether or not the FK506‐induced increase in Ca2+ store release was due to inhibition of calcineurin, the inhibitors cypermethrin (10 μM) or okadaic acid (5 μM) were each used. Ca2+ release (peak ΔF/F0) was significantly increased after incubation (30 min) with either cypermethrin (Figure 7v, n = 7, 1.45 ± 0.14 to 1.73 ± 0.14, for IP3 activation in panel a, n = 5, 0.88 ± 0.11 to 1.05 ± 0.12, for ACh activation in panel b) or okadaic acid (Figure 8v, n = 6, 1.30 ± 0.12 to 1.52 ± 0.17). The increase was also evident in the Ca2+ signal images (Figures 7a(i), 7b(i), and 8i), the individual F/F 0 traces (Figures 7a(ii), 7b(ii), and 8ii), and the average cell ΔF/F 0 values (Figures 7a(iv), 7b(iv), and 8iv). These results suggest that the phosphatase calcineurin limits IP3R activity.
Figure 7.
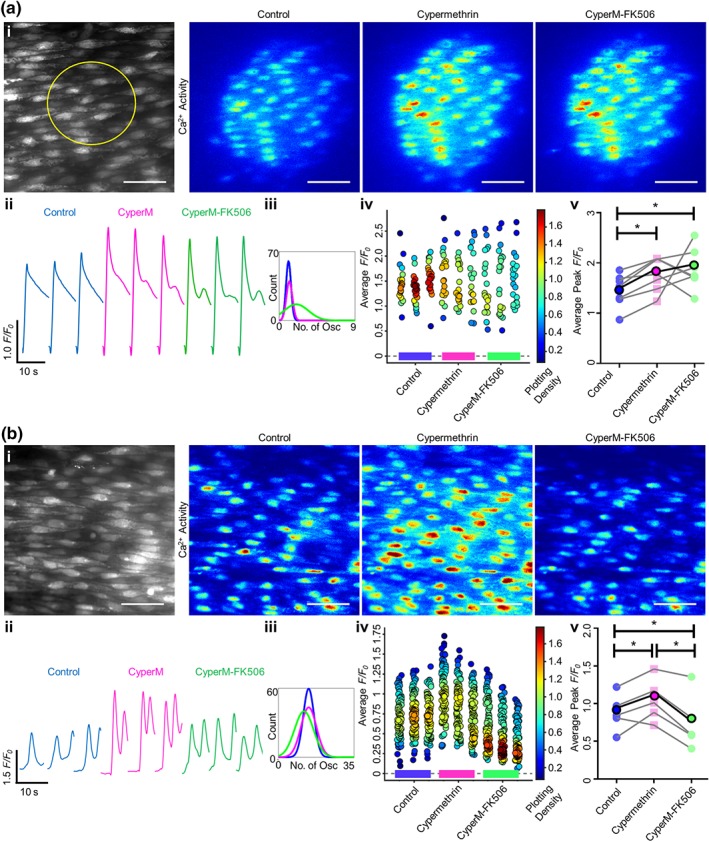
Cypermethrin increases Ca2+ release and blocks FK506‐induced increase in IP3‐ and ACh‐evoked Ca2+ release. Ca2+ release was stimulated by either localized photolysis of caged IP3 (5 μM) (a) or (b) ACh (50 nM; flow at 1.5 ml·min−1). Only cells within which IP3 was directly uncaged were analysed; therefore, more cells were analysed per artery for ACh stimulation. (i) Average intensity images of the endothelial cell field at baseline (grayscale, yellow circle represents the subsequent uncaging region) and representative contrast‐matched images (Jet LUT) of paired endothelial cell Ca2+ levels after IP3 or ACh stimulation under control, cypermethrin (CyperM; 10 μM, 30‐min incubation), or cypermethrin‐FK506 (10 μM of each drug, 30‐min incubation) conditions. Scale bars = 50 μm. (ii) Representative individual F/F 0 traces from 10‐s recordings after stimulation for a single cell are shown. Control, cypermethrin and both cypermethrin‐ and FK506‐treated traces are compared for each technical replicate within an experiment. (iii) Fitted curves for histograms illustrating the spread of the average number of oscillations per cell for control, cypermethrin‐incubated and cypermethrin‐FK506‐incubated conditions, across all technical and biological repeats. (iv) Summary data for the average F/F 0 value from each cell (colour corresponds to the density of the plotted points). Data are technical repeats from a single experiment, with control, cypermethrin‐incubated, and cypermethrin‐ and FK506‐incubated recordings indicated with a blue, pink, or green bar beneath the data respectively. (v) Peak F/F 0 signals averaged for each cell and across three technical replicates for each biological repeat, compared between control, cypermethrin and both FK506 and cypermethrin incubation. Each biological replicate is shown, with the average highlighted in bold. (n = 5 for IP3, n = 7 for ACh; *P < .05, significantly different as indicated)
Figure 8.
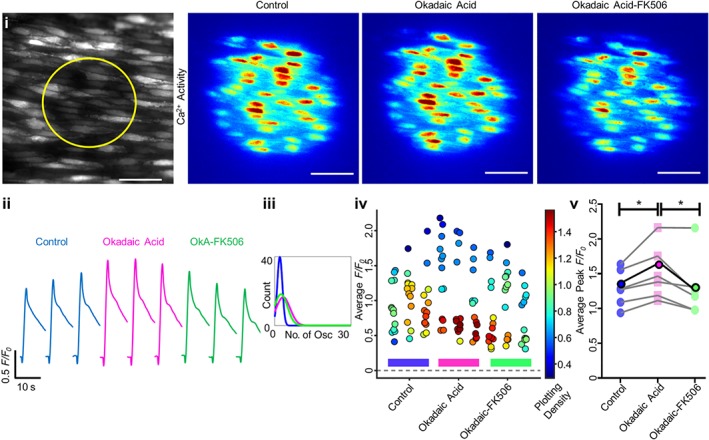
Okadaic acid increases Ca2+ release and blocks FK506‐induced increase in endothelial IP3‐ and ACh‐evoked Ca2+ release. Ca2+ release was stimulated via localized photolysis of caged IP3 (5 μM). (i) Average intensity images of paired endothelial cell field at baseline (grayscale, yellow circle represents the subsequent uncaging region) and representative contrast‐matched images (Jet LUT) of the endothelial cell Ca2+ levels after IP3 stimulation under control, okadaic acid (OkA; 10 μM, 30 min incubation), or okadaic acid‐FK506 (10 μM each drug, 30‐min incubation) conditions. Scale bar = 50 μm. (ii) Representative individual F/F 0 traces from 10‐s recordings after stimulation for a single cell are shown. Control, okadaic acid and both okadaic acid‐ and FK506‐treated traces are compared for each technical replicate within an experiment. (iii) Fitted curves for histograms illustrating the spread of the average number of oscillations per cell for control, okadaic acid and okadaic acid‐FK506, across all technical and biological repeats. (iv) Summary data for the average F/F 0 value from each cell (colour corresponds to the density of the plotted points). Data are technical replicates from a single experiment, with control, okadaic acid‐incubated, and okadaic acid‐ and FK506‐incubated recordings indicated with a blue, pink, or green bar beneath the data respectively. (v) Peak F/F 0 signals averaged for each cell and across three technical replicates for each biological repeat, compared between control, okadaic acid and both FK506 and okadaic acid conditions. Each biological replicate is shown, with the average highlighted in bold. n = 5, *; P < .05, significantly different as indicated
Significantly, in the presence of cypermethrin, FK506 failed to increase IP3‐mediated Ca2+ release (Figure 7a(v), n = 7, 1.73 ± 0.14 to 1.90 ± 0.19). After cypermethrin, FK506 also failed to increase ACh‐evoked Ca2+ release (Figure 7b(v), n = 5, 1.05 ± 0.12 to 0.75 ± 0.16). After the phosphatase inhibitor okadaic acid, FK506 significantly reduced IP3‐mediated Ca2+ release (Figure 8v, n = 6, 1.52 ± 0.17 to 1.33 ± 0.19). There was no significant difference in the number of ACh‐activated Ca2+ oscillations after incubation with FK506 and cypermethrin or okadaic acid (Figures 7a(iii), 7b(iii), and 8iii). These results suggest that the increase in IP3‐evoked Ca2+ release generated by FK506 is mediated by an effect of the drug on calcineurin rather than FKBP modulation itself.
3.4. Rapamycin does not alter IP3‐evoked Ca2+ signals
Rapamycin also disrupts FKBP12 binding to IP3R but, unlike FK506, does not inhibit calcineurin. Rapamycin did not alter IP3‐evoked Ca2+ release. Ca2+ release was stimulated by localized photolysis of caged IP3 (Figure 9). There was no difference in the peak amplitude of IP3‐evoked F/F 0 amplitude (Figure 9i–v, n = 5, 1.45 ± 0.25 to 1.48 ± 0.23), or in the characteristics of the subsequent Ca2+ oscillatory profile (Figure 9iii) after rapamycin (10 μM, 30 min). Together, these results suggest FKBP is not directly involved in endothelial IP3R regulation.
Figure 9.
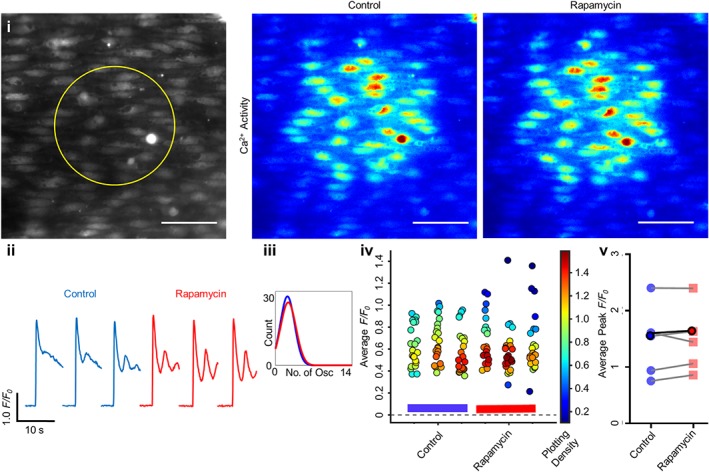
Rapamycin does not alter endothelial IP3‐evoked Ca2+ release. Ca2+ release was stimulated via localized photolysis of caged IP3 (5 μM) under no flow conditions. (i) Average intensity images of paired endothelial cell field at baseline (grayscale, yellow circle represents the subsequent uncaging region) and representative contrast‐matched images (Jet LUT) of the endothelial cell Ca2+ levels after IP3 stimulation under control or rapamycin (10 μM, 30 min incubation) conditions. Scale bar = 50 μm. (ii) Representative individual F/F 0 traces from 10‐s recordings after stimulation for a single cell are shown. Control (blue) and rapamycin (red) traces are compared for each technical replicate within an experiment. (iii) Fitted curves for histograms illustrating the spread of the average number of oscillations per cell for control and rapamycin conditions across all technical and biological repeats. (iv) Summary data for the average F/F 0 value from each cell (colour corresponds to the density of the plotted points). Data are technical replicates from a single experiment, with control and rapamycin recordings indicated with a blue or red bar beneath the data respectively. (v) Peak F/F 0 signals averaged for each cell and across three technical replicates for each biological repeat, compared between control and rapamycin conditions. Each biological replicate is shown, with the average highlighted in bold. n = 5
4. DISCUSSION
The immunosuppressant drugs FK506 and rapamycin are routinely used after organ transplantation and are effective at lowering organ rejection, though a major side effect of the treatment is hypertension (Chiasson et al., 2011; De Lima et al., 1999; Reis et al., 2009). Increased vascular resistance (Spencer, Goa, & Gillis, 1997; Textor et al., 1993) as a result of altered endothelial function and decreased production of the vasodilator NO appears central to the development of hypertension (De Lima et al., 1999; Takeda et al., 1999). However, while immunosuppressant‐induced hypertension coupled with endothelial dysfunction is significant in the systemic circulation, this may not be the case in the pulmonary circulation. Rather than being induced, pulmonary hypertension is suppressed by rapamycin (Houssaini et al., 2013) as a result of decreased smooth muscle proliferation. This finding points to significant differences in the pulmonary and systemic circulations and that the antiproliferative effects of rapamycin are insufficient to offset other effects of the drug in generating systemic hypertension.
The cellular mechanisms that give rise to decreased NO production and endothelial dysfunction evoked by FK506 and rapamycin are not fully understood though alterations in normal Ca2+ handling may be key. In other cell types, FK506 and rapamycin exert multiple effects on cellular function by modulating Ca2+ signalling. FK506 and rapamycin alter binding of FKBP to RyR and IP3R which may regulate channel activity. FK506‐FKBP additionally inhibits the phosphatase calcineurin. Here, in native endothelial cells on intact blood vessels, we explored the possibility that FKBP binding to IP3R and RyR may regulate Ca2+ signalling and thus contribute to the effects of the immunosuppressants on vascular function.
Our results suggest endothelial IP3R activity is not directly modulated by FKBP. In support, FKBP modulation with rapamycin did not alter IP3‐evoked Ca2+ release. On the other hand, FK506 did increase IP3‐evoked Ca2+ release, but that modulation was likely to be indirect and exerted via inhibition of calcineurin. Okadaic acid and cypermethrin, known inhibitors of calcineurin, also increased IP3‐evoked Ca2+ release. Significantly, calcineurin inhibitors blocked FK506‐evoked Ca2+ increases, and FK506 decreased IP3‐evoked Ca2+ release in the presence of okadaic acid. This finding raises the possibility that FK506 by itself may inhibit IP3R in the endothelium, an effect that is normally offset by potentiation of Ca2+ release, mediated by inhibition of calcineurin. The precise mechanisms by which calcineurin inhibition potentiates IP3‐evoked Ca2+ release is not clear but presumably arises from a direct or indirect influence of a dephosphorylation event on IP3R. Interestingly, caged IP3 and ACh elicited a different response to dual cypermethrin‐FK506 incubation, though the reasons behind this remain unclear. Nor are FK506 and rapamycin likely to mediate their effects on the endothelium via RyR. The RyR activator caffeine failed to evoke Ca2+ changes in the endothelium, and ryanodine itself did not alter Ca2+ release in pre‐activated preparations, suggesting that RyR is not functional in the native endothelium. Together these results suggest that FKBPs do not regulate Ca2+ release via IP3R or RyR in endothelial cells and that the hypertensive effects of FK506 and rapamycin may be exerted at sites separate from the documented effects of these two drugs on FKBP‐mediated Ca2+ release from IP3R or RyR.
While the present results suggest that FKBP modulation by FK506 and rapamycin do not alter Ca2+ release, several studies show changes in endothelial function evoked by the immunosuppressants. FK506 results in endothelial tube malformation in cell cultures (Eguchi et al., 2013; Wilasrusmee et al., 2003) and a reduced endothelium‐dependent relaxation in mouse aorta (Chiasson et al., 2011; Cook et al., 2009 ; Long et al., 2007). As relaxation in response to the smooth muscle activator sodium nitroprusside was reported to be normal (Chiasson et al., 2011), this suggests that FK506 acted via the endothelium rather than smooth muscle. Furthermore, FK506 and rapamycin each decreased NO production in mouse and rat aorta (Long et al., 2007; Takeda et al., 1999). In rat mesenteric artery, FK506 also increased the production of the endothelium‐derived smooth muscle contractile agent endothelin (Takeda et al., 1999). These studies suggest that the immunosuppressants evoke changes in endothelial function, which could underlie the development of vascular dysfunction and hypertension.
However, in other studies, more widespread effects of the drugs have been reported. In human and rat resistance arteries, in vitro exposure to FK506 for 24hr increased sensitivity to noradrenaline and impaired endothelium‐dependent relaxation to ACh (De Lima et al., 1999). However, endothelium‐independent relaxation to sodium nitroprusside was also reduced (De Lima et al., 1999), suggesting that both endothelial and smooth muscle function may be affected by FK506. In the same study (De Lima et al., 1999), rats given FK506 chronically for 8 days showed a reduced artery sensitivity to noradrenaline and a normal endothelium‐dependent relaxation (De Lima et al., 1999). These results highlight time‐dependent and complex changes in vascular responses evoked by this immunosuppressant. FK506 itself was found to evoke smooth muscle contraction in rat renal arteries (Schwertfeger et al., 2001) and to increase the sensitivity to contractile activation (noradrenaline) in rat mesenteric and human subcutaneous arteries (De Lima et al., 1999; Schwertfeger et al., 2001). However, the drug did not to induce contraction in bovine renal, mesenteric, coronary, or carotid arteries (Epstein et al., 1998) and inhibited contraction induced by high K+ depolarization and U46619 in porcine coronary artery (Yasutsune et al., 1999). Collectively, these studies create ambiguity about the vascular site on which the drugs work—the endothelium, smooth muscle, both, or neither—to produce hypertension.
The heart of the problem is that it is unclear how FKBP‐RyR and FKBP‐IP3R interactions regulate Ca2+ signalling in endothelial beds across the body. In cultured mouse aortic endothelial cells, depletion of FKBP increased intracellular Ca2+ leak via RyR (Cook et al., 2009; Long et al., 2007). In human cultured aortic endothelial cells, rapamycin increased intracellular Ca2+ which was prevented by ryanodine (Habib et al., 2013). However, no change in basal Ca2+ activity, therefore no Ca2+ leak, occurred after FK506 or rapamycin in the present study. Neither could we detect any caffeine‐ or ryanodine‐evoked RyR‐mediated Ca2+ signals, despite caffeine effectively evoking smooth muscle contraction in the same tissue. These results suggest that RyR may not be functional in native aortic or mesenteric endothelium in intact blood vessels. The reason for the difference between our results and previous findings (Cook et al., 2009; Long et al., 2007) is unclear, though it may lie in the changes undergone by endothelial cells during culture (Cook et al., 2009; Long et al., 2007). Alternatively, differences of endothelial reactivity to activators of RyR and FK506 and rapamycin may exist across species, blood vessel type, diseased state, age, and duration of exposure to the immunosuppressants. These differences could lead to different results in Ca2+ dynamics in vascular endothelial cells.
There are no previous reports on the effects of FK506 or rapamycin on IP3‐evoked Ca2+ release in endothelial cells. The present findings show that FK506 increased IP3‐evoked Ca2+ release via inhibition of calcineurin and that modulation of FKBP did not alter IP3‐evoked Ca2+ release, as shown using rapamycin. To ensure the effects of FK506 were mediated via IP3R activity rather than the generation of IP3 or surface receptors generating IP3, we directly activated IP3R using photolysis of caged IP3. The FK506‐evoked increase in IP3‐mediated Ca2+ release was prevented when the phosphatase calcineurin was blocked, which inhibited and in the case of okadaic acid, actually decreased further FK506‐mediated Ca2+ release. These findings support the suggestion that FK506 may inhibit IP3R in endothelial cells by a mechanism that is independent of either FKBP or calcineurin.
Calcineurin appears to regulate IP3‐evoked Ca2+ release in the endothelium, potentially by forming part of the FKBP‐IP3R channel complex (Bandyopadhyay, Shin, Ahn, & Kim, 2000; Cameron et al., 1997; Cameron, Steiner, Roskams, et al., 1995; Cameron, Steiner, Sabatini, et al., 1995; Shin et al., 2002) as FK506‐FKBP inhibits the phosphatase calcineurin. However, there is also a complex literature on the contribution of calcineurin to the control of IP3‐evoked Ca2+ release. Calcineurin inhibitors increased ATP‐induced Ca2+ release and IP3R activity in COS‐7 cells and cerebellar microsomes respectively (Bandyopadhyay, Shin, & Kim, 2000; Cameron, Steiner, Roskams, et al., 1995), and expression of a constitutively active form of calcineurin inhibited Ca2+ release (Bandyopadhyay, Shin, & Kim, 2000). On the other hand, the calcineurin inhibitors cypermethrin and okadaic acid did not alter Ca2+ release via either RyR (MacMillan et al., 2008) or IP3R (Macmillan & McCarron, 2009) in aortic myocytes. Neither did okadaic acid alter Ca2+ in porcine coronary artery (Ashizawa et al., 1989; Hirano et al., 1989). Cyclosporin A, a calcineurin inhibitor, did not alter Ca2+ release in pulmonary (Zheng et al., 2004) and coronary artery myocytes (Frapier et al., 2001) or SR [Ca2+] in aortic myocytes (Avdonin et al., 1999). These results suggest that there is also a complex relationship between calcineurin and regulation of Ca2+ release in the endothelium presumably as a result of the nature of the kinases that are active in cells, the phosphorylation/dephosphorylation status of IP3R, and the balance of activation and inhibition of the IP3 receptor.
In summary, the mechanisms underlying the immunosuppressant‐mediated hypertension and endothelial dysfunction in organ transplant patients remain unclear. Hypertension induced by genetic deletion of FKBP12.6 in mice is consistent with a role for FKBPs in the process (Long et al., 2007). Previous studies suggest that FK506 and rapamycin may exert vascular effects through altered Ca2+ signalling mediated by displacement of FKBP from IP3R or through FK506‐induced inhibition of calcineurin. The present findings show that rapamycin had no effect on IP3‐mediated Ca2+ release and that the increase in FK506‐mediated Ca2+ release was due to FK506‐FKBP calcineurin inhibition. Calcineurin inhibition also prevented FK506‐mediated IP3‐evoked Ca2+ release. While FK506 and rapamycin share the common side effect of evoking hypertension in patients, these immunosuppressants do not share a common effect on endothelial IP3‐evoked Ca2+ release. This raises the possibility that modulation of Ca2+ release may not be the only factor contributing to immunosuppressant drug‐induced hypertension. FK506 is also known to induce endothelial dysfunction through attenuation of https://www.guidetopharmacology.org/GRAC/FamilyDisplayForward?familyId=285 and https://www.guidetopharmacology.org/GRAC/FamilyDisplayForward?familyId=514 independently of calcineurin inhibition (Eguchi et al., 2013). Other FKBPs may also be the target of the drugs. FKBP51 and FKBP52 regulate steroid receptor signalling and store operated Ca2+ entry and some TRP channels (Hamilton et al., 2018; Kadeba et al., 2013; Sinkins, Goel, Estacion, & Schilling, 2004) to modulate cell function. The present findings suggest that rapamycin and FKBP do not modulate Ca2+ release. However, IP3‐mediated Ca2+ release may be modulated (a) by FK506 via the phosphatase calcineurin to increase Ca2+ release, and (b) by FK506 directly inhibiting IP3R.
DECLARATION OF TRANSPARENCY AND SCIENTIFIC RIGOUR
This Declaration acknowledges that this paper adheres to the principles for transparent reporting and scientific rigour of preclinical research as stated in the BJP guidelines for https://doi.org/10.1111/bph.14207, https://doi.org/10.1111/bph.14208, and https://doi.org/10.1111/bph.14206, and as recommended by funding agencies, publishers and other organisations engaged with supporting research..
CONFLICT OF INTEREST
The authors declare no conflicts of interest.
AUTHOR CONTRIBUTIONS
C.B., C.W., and J.G.M. developed the concept. C.B. performed the experiments. C.B. and J.G.M. drafted the manuscript. C.B. C.W., and J.G.M. edited the manuscript. C.W. and J.G.M. sourced funding. All authors approved the final version of the manuscript.
Supporting information
Data S1. Supporting information
Figure S1. Repeated ACh administration to mesenteric endothelial cells leads to an increase in signal (‘run‐up’) unless appropriate washes are performed
Figure S2. Endothelial function is partially recoverable after 2‐APB
Figure S3. FK506 or rapamycin did not cause Ca2+ leak
Video S1. Supporting information
Video S2. Supporting information
Video S3. Supporting information
Video S4. Supporting information
ACKNOWLEDGEMENTS
This work was funded by the Wellcome Trust (202924/Z/16/Z and 204682/Z/16/Z) and the British Heart Foundation (PG/16/54/32230 and PG16/82/32439), whose support is gratefully acknowledged. The authors would like to thank Margaret MacDonald for her excellent technical support.
Buckley C, Wilson C, McCarron JG. FK506 regulates Ca2+ release evoked by inositol 1,4,5‐trisphosphate independently of FK‐binding protein in endothelial cells. Br J Pharmacol. 2020;177:1131–1149. 10.1111/bph.14905
REFERENCES
- Abizaid, A. (2007). Sirolimus‐eluting coronary stents: A review. Vascular Health and Risk Management, 3(2), 191–201. [DOI] [PMC free article] [PubMed] [Google Scholar]
- Alexander, S. P. H. , Fabbro, D. , Kelly, E. , Mathie, A. , Peters, J. A. , Veale, E. L. , … CGTP Collaborators (2019a). The Concise Guide to PHARMACOLOGY 2019/20: Enzymes. British Journal of Pharmacology, 176, S297–S396. 10.1111/bph.14752 [DOI] [PMC free article] [PubMed] [Google Scholar]
- Alexander, S. P. H. , Mathie, A. , Peters, J. A. , Veale, E. L. , Striessnig, J. , Kelly, E. , … CGTP Collaborators (2019b). The Concise Guide to PHARMACOLOGY 2019/20: Ion channels. British Journal of Pharmacology, 176, S142–S228. 10.1111/bph.14749 [DOI] [PMC free article] [PubMed] [Google Scholar]
- Alexander, S. P. H. , Roberts, R. E. , Broughton, B. R. S. , Sobey, C. G. , George, C. H. , Stanford, S. C. , … Ahluwalia, A. (2018). Goals and practicalities of immunoblotting and immunohistochemistry: A guide for submission to the British Journal of Pharmacology. British Journal of Pharmacology, 175(3), 407–411. [DOI] [PMC free article] [PubMed] [Google Scholar]
- Ashizawa, N. , Kobayashi, F. , Tanaka, Y. , & Nakayama, K. (1989). Relaxing action of okadaic acid, a black sponge toxin on the arterial smooth muscle. Biochemical and Biophysical Research Communications, 162(3), 971–976. [DOI] [PubMed] [Google Scholar]
- Avdonin, P. V. , Cottet‐Maire, F. , Afanasjeva, G. V. , Loktionova, S. A. , Lhote, P. , & Ruegg, U. T. (1999). Cyclosporine A up‐regulates angiotensin II receptors and calcium responses in human vascular smooth muscle cells. Kidney International, 55(6), 2407–2414. [DOI] [PubMed] [Google Scholar]
- Bandyopadhyay, A. , Shin, D. W. , Ahn, J. O. , & Kim, D. H. (2000). Calcineurin regulates ryanodine receptor/Ca2+‐release channels in rat heart. The Biochemical Journal, 352(Pt 1), 61–70. [PMC free article] [PubMed] [Google Scholar]
- Bandyopadhyay, A. , Shin, D. W. , & Kim, D. H. (2000). Regulation of ATP‐induced calcium release in COS‐7 cells by calcineurin. The Biochemical Journal, 348(Pt 1), 173–181. [PMC free article] [PubMed] [Google Scholar]
- Barg, S. , Copello, J. A. , & Fleischer, S. (1997). Different interactions of cardiac and skeletal muscle ryanodine receptors with FK‐506 binding protein isoforms. The American Journal of Physiology, 272(5 Pt 1), C1726–C1733. [DOI] [PubMed] [Google Scholar]
- Bielefeldt, K. , Sharma, R. V. , Whiteis, C. , Yedidag, E. , & Abboud, F. M. (1997). Tacrolimus (FK506) modulates calcium release and contractility of intestinal smooth muscle. Cell Calcium, 22(6), 507–514. [DOI] [PubMed] [Google Scholar]
- Bierer, B. E. , Mattila, P. S. , Standaert, R. F. , Herzenberg, L. A. , Burakoff, S. J. , Crabtree, G. , & Schreiber, S. L. (1990). Two distinct signal transmission pathways in T lymphocytes are inhibited by complexes formed between an immunophilin and either FK506 or rapamycin. Proceedings of the National Academy of Sciences of the United States of America, 87(23), 9231–9235. [DOI] [PMC free article] [PubMed] [Google Scholar]
- Boehning, D. , & Joseph, S. K. (2000). Functional properties of recombinant type I and type III inositol 1, 4,5‐trisphosphate receptor isoforms expressed in COS‐7 cells. The Journal of Biological Chemistry, 275(28), 21492–21499. [DOI] [PubMed] [Google Scholar]
- Bradley, K. N. , Currie, S. , MacMillan, D. , Muir, T. C. , & McCarron, J. G. (2003). Cyclic ADP‐ribose increases Ca2+ removal in smooth muscle. Journal of Cell Science, 116(Pt 21), 4291–4306. [DOI] [PubMed] [Google Scholar]
- Brillantes, A. B. , Ondrias, K. , Scott, A. , Kobrinsky, E. , Ondriasova, E. , Moschella, M. C. , … Marks, A. R. (1994). Stabilization of calcium release channel (ryanodine receptor) function by FK506‐binding protein. Cell, 77(4), 513–523. [DOI] [PubMed] [Google Scholar]
- Brown, G. R. , Sayers, L. G. , Kirk, C. J. , Michell, R. H. , & Michelangeli, F. (1992). The opening of the inositol 1,4,5‐trisphosphate‐sensitive Ca2+ channel in rat cerebellum is inhibited by caffeine. The Biochemical Journal, 282(Pt 2), 309–312. [DOI] [PMC free article] [PubMed] [Google Scholar]
- Bultynck, G. , De Smet, P. , Rossi, D. , Callewaert, G. , Missiaen, L. , Sorrentino, V. , … Parys, J. B. (2001). Characterization and mapping of the 12 kDa FK506‐binding protein (FKBP12)‐binding site on different isoforms of the ryanodine receptor and of the inositol 1,4,5‐trisphosphate receptor. The Biochemical Journal, 354(Pt 2), 413–422. [DOI] [PMC free article] [PubMed] [Google Scholar]
- Bultynck, G. , De Smet, P. , Weidema, A. F. , Ver Heyen, M. , Maes, K. , Callewaert, G. , … De Smedt, H. (2000). Effects of the immunosuppressant FK506 on intracellular Ca2+ release and Ca2+ accumulation mechanisms. The Journal of Physiology, 525(Pt 3), 681–693. [DOI] [PMC free article] [PubMed] [Google Scholar]
- Bultynck, G. , Rossi, D. , Callewaert, G. , Missiaen, L. , Sorrentino, V. , Parys, J. B. , & de Smedt, H. (2001). The conserved sites for the FK506‐binding proteins in ryanodine receptors and inositol 1,4,5‐trisphosphate receptors are structurally and functionally different. The Journal of Biological Chemistry, 276(50), 47715–47724. 10.1074/jbc.M106573200 [DOI] [PubMed] [Google Scholar]
- Cameron, A. M. , Nucifora, F. C. Jr. , Fung, E. T. , Livingston, D. J. , Aldape, R. A. , Ross, C. A. , & Snyder, S. H. (1997). FKBP12 binds the inositol 1,4,5‐trisphosphate receptor at leucine‐proline (1400‐1401) and anchors calcineurin to this FK506‐like domain. The Journal of Biological Chemistry, 272(44), 27582–27588. [DOI] [PubMed] [Google Scholar]
- Cameron, A. M. , Steiner, J. P. , Roskams, A. J. , Ali, S. M. , Ronnett, G. V. , & Snyder, S. H. (1995). Calcineurin associated with the inositol 1,4,5‐trisphosphate receptor‐FKBP12 complex modulates Ca2+ flux. Cell, 83(3), 463–472. 10.1016/0092-8674(95)90124-8 [DOI] [PubMed] [Google Scholar]
- Cameron, A. M. , Steiner, J. P. , Sabatini, D. M. , Kaplin, A. I. , Walensky, L. D. , & Snyder, S. H. (1995). Immunophilin FK506 binding protein associated with inositol 1,4,5‐trisphosphate receptor modulates calcium flux. Proceedings of the National Academy of Sciences of the United States of America, 92(5), 1784–1788. [DOI] [PMC free article] [PubMed] [Google Scholar]
- Carmody, M. , Mackrill, J. J. , Sorrentino, V. , & O'Neill, C. (2001). FKBP12 associates tightly with the skeletal muscle type 1 ryanodine receptor, but not with other intracellular calcium release channels. FEBS Letters, 505(1), 97–102. 10.1016/s0014-5793(01)02787-9 [DOI] [PubMed] [Google Scholar]
- Chiasson, V. L. , Talreja, D. , Young, K. J. , Chatterjee, P. , Banes‐Berceli, A. K. , & Mitchell, B. M. (2011). FK506 binding protein 12 deficiency in endothelial and hematopoietic cells decreases regulatory T cells and causes hypertension. Hypertension, 57(6), 1167–1175. 10.1161/HYPERTENSIONAHA.110.162917 [DOI] [PMC free article] [PubMed] [Google Scholar]
- Cook, L. G. , Chiasson, V. L. , Long, C. , Wu, G. Y. , & Mitchell, B. M. (2009). Tacrolimus reduces nitric oxide synthase function by binding to FKBP rather than by its calcineurin effect. Kidney International, 75(7), 719–726. [DOI] [PMC free article] [PubMed] [Google Scholar]
- Curtis, M. J. , Alexander, S. , Cirino, G. , Docherty, J. R. , George, C. H. , Giembycz, M. A. , … Ahluwalia, A. (2018). Experimental design and analysis and their reporting II: Updated and simplified guidance for authors and peer reviewers. British Journal of Pharmacology, 175(7), 987–993. 10.1111/bph.14153 [DOI] [PMC free article] [PubMed] [Google Scholar]
- Dargan, S. L. , Lea, E. J. , & Dawson, A. P. (2002). Modulation of type‐1 Ins(1,4,5)P3 receptor channels by the FK506‐binding protein, FKBP12. The Biochemical Journal, 361(Pt 2), 401–407. [DOI] [PMC free article] [PubMed] [Google Scholar]
- De Lima, J. J. , Xue, H. , Coburn, L. , Andoh, T. F. , McCarron, D. A. , Bennett, W. M. , & Roullet, J. B. (1999). Effects of FK506 in rat and human resistance arteries. Kidney International, 55(4), 1518–1527. [DOI] [PubMed] [Google Scholar]
- duBell, W. H. , Wright, P. A. , Lederer, W. J. , & Rogers, T. B. (1997). Effect of the immunosupressant FK506 on excitation‐contraction coupling and outward K+ currents in rat ventricular myocytes. The Journal of Physiology, 501(Pt 3), 509–516. [DOI] [PMC free article] [PubMed] [Google Scholar]
- Edelstein, A. D. , Tsuchida, M. A. , Amodaj, N. , Pinkard, H. , Vale, R. D. , & Stuurman, N. (2014). Advanced methods of microscope control using μManager software. Journal of Biological Methods, 1(2), e10. [DOI] [PMC free article] [PubMed] [Google Scholar]
- Eguchi, R. , Kubo, S. , Ohta, T. , Kunimasa, K. , Okada, M. , Tamaki, H. , … Ogawa, H. (2013). FK506 induces endothelial dysfunction through attenuation of Akt and ERK1/2 independently of calcineurin inhibition and the caspase pathway. Cellular Signalling, 25(9), 1731–1738. [DOI] [PubMed] [Google Scholar]
- Epstein, A. , Beall, A. , Wynn, J. , Mulloy, L. , & Brophy, C. M. (1998). Cyclosporine, but not FK506, selectively induces renal and coronary artery smooth muscle contraction. Surgery, 123(4), 456–460. [PubMed] [Google Scholar]
- Feletou, M. (2011). The endothelium: Part 1: Multiple functions of the endothelial cells‐focus on endothelium‐derived vasoactive mediators. San Rafael, Morgan & Claypool Life Sciences(CA). [PubMed] [Google Scholar]
- Frapier, J. M. , Choby, C. , Mangoni, M. E. , Nargeot, J. , Albat, B. , & Richard, S. (2001). Cyclosporin A increases basal intracellular calcium and calcium responses to endothelin and vasopressin in human coronary myocytes. FEBS Letters, 493(1), 57–62. [DOI] [PubMed] [Google Scholar]
- Guerini, D. (1997). Calcineurin: Not just a simple protein phosphatase. Biochemical and Biophysical Research Communications, 235(2), 271–275. [DOI] [PubMed] [Google Scholar]
- Habib, A. , Karmali, V. , Polavarapu, R. , Akahori, H. , Cheng, Q. , Pachura, K. , … Finn, A. V. (2013). Sirolimus‐FKBP12.6 impairs endothelial barrier function through protein kinase C‐α activation and disruption of the p120‐vascular endothelial cadherin interaction. Arteriosclerosis, Thrombosis, and Vascular Biology, 33(10), 2425–2431. [DOI] [PMC free article] [PubMed] [Google Scholar]
- Hamilton, C. L. , Kadeba, P. I. , Vasauskas, A. A. , Solodushko, V. , McClinton, A. K. , Alexeyev, M. , … Cioffi, D. L. (2018). Protective role of FKBP51 in calcium entry‐induced endothelial barrier disruption. Pulmonary Circulation, 8(1), 2045893217749987. [DOI] [PMC free article] [PubMed] [Google Scholar]
- Harding, M. W. , Galat, A. , Uehling, D. E. , & Schreiber, S. L. (1989). A receptor for the immunosuppressant FK506 is a cis‐trans peptidyl‐prolyl isomerase. Nature, 341(6244), 758–760. 10.1038/341758a0 [DOI] [PubMed] [Google Scholar]
- Hepworth, T. J. , Lawrie, A. M. , & Simpson, A. W. (1997). Okadaic acid induces the release of Ca2+ from intracellular stores in ECV304 endothelial cells. Cell Calcium, 21(6), 461–467. 10.1016/s0143-4160(97)90057-9 [DOI] [PubMed] [Google Scholar]
- Hirano, K. , Kanaide, H. , & Nakamura, M. (1989). Effects of okadaic acid on cytosolic calcium concentrations and on contractions of the porcine coronary artery. British Journal of Pharmacology, 98(4), 1261–1266. 10.1111/j.1476-5381.1989.tb12672.x [DOI] [PMC free article] [PubMed] [Google Scholar]
- Houssaini, A. , Abid, S. , Mouraret, N. , Wan, F. , Rideau, D. , Saker, M. , … Adnot, S. (2013). Rapamycin reverses pulmonary artery smooth muscle cell proliferation in pulmonary hypertension. American Journal of Respiratory Cell and Molecular Biology, 48(5), 568–577. 10.1165/rcmb.2012-0429OC [DOI] [PMC free article] [PubMed] [Google Scholar]
- Jeanmart, H. , Malo, O. , Carrier, M. , Nickner, C. , Desjardins, N. , & Perrault, L. P. (2002). Comparative study of cyclosporine and tacrolimus vs newer immunosuppressants mycophenolate mofetil and rapamycin on coronary endothelial function. The Journal of Heart and Lung Transplantation: The Official Publication of the International Society for Heart Transplantation, 21(9), 990–998. [DOI] [PubMed] [Google Scholar]
- Ji, G. , Feldman, M. E. , Greene, K. S. , Sorrentino, V. , Xin, H. B. , & Kotlikoff, M. I. (2004). RYR2 proteins contribute to the formation of Ca2+ sparks in smooth muscle. The Journal of General Physiology, 123(4), 377–386. 10.1085/jgp.200308999 [DOI] [PMC free article] [PubMed] [Google Scholar]
- Kadeba, P. I. , Vasauskas, A. A. , Chen, H. , Wu, S. , Scammell, J. G. , & Cioffi, D. L. (2013). Regulation of store‐operated calcium entry by FK506‐binding immunophilins. Cell Calcium, 53(4), 275–285. 10.1016/j.ceca.2012.12.008 [DOI] [PMC free article] [PubMed] [Google Scholar]
- Kaftan, E. , Marks, A. R. , & Ehrlich, B. E. (1996). Effects of rapamycin on ryanodine receptor/Ca2+‐release channels from cardiac muscle. Circulation Research, 78(6), 990–997. 10.1161/01.res.78.6.990 [DOI] [PubMed] [Google Scholar]
- Kanoh, S. , Kondo, M. , Tamaoki, J. , Shirakawa, H. , Aoshiba, K. , Miyazaki, S. , … Nagai, A. (1999). Effect of FK506 on ATP‐induced intracellular calcium oscillations in cow tracheal epithelium. The American Journal of Physiology, 276(6 Pt 1), L891–L899. [DOI] [PubMed] [Google Scholar]
- Kilkenny, C. , Browne, W. , Cuthill, I. C. , Emerson, M. , & Altman, D. G. (2010). Animal research: Reporting in vivo experiments: The ARRIVE guidelines. British Journal of Pharmacology, 160, 1577–1579. [DOI] [PMC free article] [PubMed] [Google Scholar]
- Klee, C. B. , Ren, H. , & Wang, X. (1998). Regulation of the calmodulin‐stimulated protein phosphatase, calcineurin. The Journal of Biological Chemistry, 273(22), 13367–13370. [DOI] [PubMed] [Google Scholar]
- Kolozsvari, B. , Bako, E. , Becsi, B. , Kiss, A. , Czikora, A. , Toth, A. , … Erdődi, F. (2012). Calcineurin regulates endothelial barrier function by interaction with and dephosphorylation of myosin phosphatase. Cardiovascular Research, 96(3), 494–503. [DOI] [PubMed] [Google Scholar]
- Lemos, P. A. , Lee, C. H. , Degertekin, M. , Saia, F. , Tanabe, K. , Arampatzis, C. A. , … Serruys, P. W. (2003). Early outcome after sirolimus‐eluting stent implantation in patients with acute coronary syndromes: Insights from the Rapamycin‐Eluting Stent Evaluated At Rotterdam Cardiology Hospital (RESEARCH) registry. Journal of the American College of Cardiology, 41(11), 2093–2099. [DOI] [PubMed] [Google Scholar]
- Lindenfeld, J. , Miller, G. G. , Shakar, S. F. , Zolty, R. , Lowes, B. D. , Wolfel, E. E. , … Kobashigawa, J. (2004). Drug therapy in the heart transplant recipient: Part II: Immunosuppressive drugs. Circulation, 110(25), 3858–3865. [DOI] [PubMed] [Google Scholar]
- Lindenfeld, J. , Page, R. L. 2nd , Zolty, R. , Shakar, S. F. , Levi, M. , Lowes, B. , … Miller, G. G. (2005). Drug therapy in the heart transplant recipient: Part III: Common medical problems. Circulation, 111(1), 113–117. [DOI] [PubMed] [Google Scholar]
- Liu, J. , Albers, M. W. , Wandless, T. J. , Luan, S. , Alberg, D. G. , Belshaw, P. J. , … Schreiber, S. L. (1992). Inhibition of T cell signaling by immunophilin‐ligand complexes correlates with loss of calcineurin phosphatase activity. Biochemistry, 31(16), 3896–3901. [DOI] [PubMed] [Google Scholar]
- Liu, J. , Farmer, J. D. Jr. , Lane, W. S. , Friedman, J. , Weissman, I. , & Schreiber, S. L. (1991). Calcineurin is a common target of cyclophilin‐cyclosporin A and FKBP‐FK506 complexes. Cell, 66(4), 807–815. [DOI] [PubMed] [Google Scholar]
- Liu, L. , Yang, M. , Wang, N. , Li, L. , Chen, Z. J. , & Zhang, C. (2018). New insights of subfertility among transplanted women: Immunosuppressive drug FK506 leads to calcium leak and oocyte activation before fertilization. Journal of Cellular Biochemistry, 119(3), 2964–2977. 10.1002/jcb.26510 [DOI] [PubMed] [Google Scholar]
- Long, C. , Cook, L. G. , Wu, G. Y. , & Mitchell, B. M. (2007). Removal of FKBP12/12.6 from endothelial ryanodine receptors leads to an intracellular calcium leak and endothelial dysfunction. Arteriosclerosis, Thrombosis, and Vascular Biology, 27(7), 1580–1586. [DOI] [PubMed] [Google Scholar]
- MacMillan, D. , Currie, S. , Bradley, K. N. , Muir, T. C. , & McCarron, J. G. (2005). In smooth muscle, FK506‐binding protein modulates IP3 receptor‐evoked Ca2+ release by mTOR and calcineurin. Journal of Cell Science, 118, 5443–5451. [DOI] [PubMed] [Google Scholar]
- MacMillan, D. , Currie, S. , & McCarron, J. G. (2008). FK506‐binding protein (FKBP12) regulates ryanodine receptor‐evoked Ca2+ release in colonic but not aortic smooth muscle. Cell Calcium, 43(6), 539–549. 10.1016/j.ceca.2007.09.002 [DOI] [PubMed] [Google Scholar]
- Macmillan, D. , & McCarron, J. G. (2009). Regulation by FK506 and rapamycin of Ca2+ release from the sarcoplasmic reticulum in vascular smooth muscle: The role of FK506 binding proteins and mTOR. British Journal of Pharmacology, 158, 1112–1120. [DOI] [PMC free article] [PubMed] [Google Scholar]
- Mayrleitner, M. , Timerman, A. P. , Wiederrecht, G. , & Fleischer, S. (1994). The calcium release channel of sarcoplasmic reticulum is modulated by FK‐506 binding protein: Effect of FKBP‐12 on single channel activity of the skeletal muscle ryanodine receptor. Cell Calcium, 15(2), 99–108. 10.1016/0143-4160(94)90048-5 [DOI] [PubMed] [Google Scholar]
- McCarron, J. G. , Chalmers, S. , MacMillan, D. , & Olson, M. L. (2010). Agonist‐evoked Ca2+ wave progression requires Ca2+ and IP3 . Journal of Cell Physiology, 244, 334–344. [DOI] [PMC free article] [PubMed] [Google Scholar]
- McGrath, J. C. , & Lilley, E. (2015). Implementing guidelines on reporting research using animals (ARRIVE etc.): New requirements for publication in BJP. British Journal of Pharmacology, 172(13), 3189–3193. [DOI] [PMC free article] [PubMed] [Google Scholar]
- Missiaen, L. , Taylor, C. W. , & Berridge, M. J. (1992). Luminal Ca2+ promoting spontaneous Ca2+ release from inositol trisphosphate‐sensitive stores in rat hepatocytes. The Journal of Physiology, 455, 623–640. 10.1113/jphysiol.1992.sp019319 [DOI] [PMC free article] [PubMed] [Google Scholar]
- Murayama, T. , Oba, T. , Katayama, E. , Oyamada, H. , Oguchi, K. , Kobayashi, M. , … Ogawa, Y. (1999). Further characterization of the type 3 ryanodine receptor (RyR3) purified from rabbit diaphragm. The Journal of Biological Chemistry, 274(24), 17297–17308. 10.1074/jbc.274.24.17297 [DOI] [PubMed] [Google Scholar]
- Olson, M. L. , Chalmers, S. , & McCarron, J. G. (2012). Mitochondrial organization and Ca2+ uptake. Biochemical Society Transactions, 40(1), 158–167. 10.1042/BST20110705 [DOI] [PubMed] [Google Scholar]
- Parker, I. , & Ivorra, I. (1991). Caffeine inhibits inositol trisphosphate‐mediated liberation of intracellular calcium in Xenopus oocytes. The Journal of Physiology, 433, 229–240. 10.1113/jphysiol.1991.sp018423 [DOI] [PMC free article] [PubMed] [Google Scholar]
- Reis, F. , Parada, B. , Teixeira de Lemos, E. , Garrido, P. , Dias, A. , Piloto, N. , … Teixeira, F. (2009). Hypertension induced by immunosuppressive drugs: A comparative analysis between sirolimus and cyclosporine. Transplantation Proceedings, 41(3), 868–873. [DOI] [PubMed] [Google Scholar]
- Scaramello, C. B. , Muzi‐Filho, H. , Zapata‐Sudo, G. , Sudo, R. T. , & Cunha Vdo, M. (2009). FKBP12 depletion leads to loss of sarcoplasmic reticulum Ca2+ stores in rat vas deferens. Journal of Pharmacological Sciences, 109(2), 185–192. [DOI] [PubMed] [Google Scholar]
- Schindelin, J. , Arganda‐Carreras, I. , Frise, E. , Kaynig, V. , Longair, M. , Pietzsch, T. , … Cardona, A. (2012). Fiji: An open‐source platform for biological‐image analysis. Nature Methods, 9(7), 676–682. [DOI] [PMC free article] [PubMed] [Google Scholar]
- Schwertfeger, E. , Wehrens, J. , Oberhauser, V. , Katzenwadel, A. , & Rump, L. C. (2001). Contractile effects of tacrolimus in human and rat isolated renal arteries. Journal of Autonomic Pharmacology, 21(4), 205–210. [DOI] [PubMed] [Google Scholar]
- Serruys, P. W. , Regar, E. , & Carter, A. J. (2002). Rapamycin eluting stent: The onset of a new era in interventional cardiology. Heart, 87(4), 305–307. [DOI] [PMC free article] [PubMed] [Google Scholar]
- Shin, D. W. , Pan, Z. , Bandyopadhyay, A. , Bhat, M. B. , Kim, D. H. , & Ma, J. (2002). Ca2+‐dependent interaction between FKBP12 and calcineurin regulates activity of the Ca2+ release channel in skeletal muscle. Biophysical Journal, 83(5), 2539–2549. 10.1016/S0006-3495(02)75265-X [DOI] [PMC free article] [PubMed] [Google Scholar]
- Sinkins, W. G. , Goel, M. , Estacion, M. , & Schilling, W. P. (2004). Association of immunophilins with mammalian TRPC channels. The Journal of Biological Chemistry, 279(33), 34521–34529. [DOI] [PubMed] [Google Scholar]
- Spencer, C. M. , Goa, K. L. , & Gillis, J. C. (1997). Tacrolimus. An update of its pharmacology and clinical efficacy in the management of organ transplantation. Drugs, 54(6), 925–975. 10.2165/00003495-199754060-00009 [DOI] [PubMed] [Google Scholar]
- Takeda, Y. , Miyamori, I. , Furukawa, K. , Inaba, S. , & Mabuchi, H. (1999). Mechanisms of FK 506‐induced hypertension in the rat. Hypertension, 33(1), 130–136. 10.1161/01.hyp.33.1.130 [DOI] [PubMed] [Google Scholar]
- Tang, W. X. , Chen, Y. F. , Zou, A. P. , Campbell, W. B. , & Li, P. L. (2002). Role of FKBP12.6 in cADPR‐induced activation of reconstituted ryanodine receptors from arterial smooth muscle. American Journal of Physiology. Heart and Circulatory Physiology, 282(4), H1304–H1310. [DOI] [PubMed] [Google Scholar]
- Taylor, D. O. , Barr, M. L. , Radovancevic, B. , Renlund, D. G. , Mentzer, R. M. Jr. , Smart, F. W. , … VanVeldhuisen, P. (1999). A randomized, multicenter comparison of tacrolimus and cyclosporine immunosuppressive regimens in cardiac transplantation: Decreased hyperlipidemia and hypertension with tacrolimus. The Journal of Heart and Lung Transplantation: The Official Publication of the International Society for Heart Transplantation, 18(4), 336–345. [DOI] [PubMed] [Google Scholar]
- Textor, S. C. , Wiesner, R. , Wilson, D. J. , Porayko, M. , Romero, J. C. , Burnett, J. C. Jr. , … Krom, R. A. (1993). Systemic and renal hemodynamic differences between FK506 and cyclosporine in liver transplant recipients. Transplantation, 55(6), 1332–1339. [DOI] [PubMed] [Google Scholar]
- Thrower, E. C. , Mobasheri, H. , Dargan, S. , Marius, P. , Lea, E. J. , & Dawson, A. P. (2000). Interaction of luminal calcium and cytosolic ATP in the control of type 1 inositol (1,4,5)‐trisphosphate receptor channels. The Journal of Biological Chemistry, 275(46), 36049–36055. 10.1074/jbc.M000970200 [DOI] [PubMed] [Google Scholar]
- Timerman, A. P. , Ogunbumni, E. , Freund, E. , Wiederrecht, G. , Marks, A. R. , & Fleischer, S. (1993). The calcium release channel of sarcoplasmic reticulum is modulated by FK‐506‐binding protein. Dissociation and reconstitution of FKBP‐12 to the calcium release channel of skeletal muscle sarcoplasmic reticulum. The Journal of Biological Chemistry, 268(31), 22992–22999. [PubMed] [Google Scholar]
- Timerman, A. P. , Onoue, H. , Xin, H. B. , Barg, S. , Copello, J. , Wiederrecht, G. , & Fleischer, S. (1996). Selective binding of FKBP12.6 by the cardiac ryanodine receptor. The Journal of Biological Chemistry, 271(34), 20385–20391. 10.1074/jbc.271.34.20385 [DOI] [PubMed] [Google Scholar]
- Tran, Q. K. , & Watanabe, H. (2006). Calcium signalling in the endothelium. Handbook of Experimental Pharmacology, 176(Pt 1), 145–187. [DOI] [PubMed] [Google Scholar]
- Wallemacq, P. , Armstrong, V. W. , Brunet, M. , Haufroid, V. , Holt, D. W. , Johnston, A. , … Mourad, M. (2009). Opportunities to optimize tacrolimus therapy in solid organ transplantation: Report of the European consensus conference. Therapeutic Drug Monitoring, 31(2), 139–152. [DOI] [PubMed] [Google Scholar]
- Wallemacq, P. E. , & Reding, R. (1993). FK506 (tacrolimus), a novel immunosuppressant in organ transplantation: Clinical, biomedical, and analytical aspects. Clinical Chemistry, 39(11 Pt 1), 2219–2228. [PMC free article] [PubMed] [Google Scholar]
- Wang, Y. X. , Zheng, Y. M. , Mei, Q. B. , Wang, Q. S. , Collier, M. L. , Fleischer, S. , … Kotlikoff, M. I. (2004). FKBP12.6 and cADPR regulation of Ca2+ release in smooth muscle cells. American Journal of Physiology. Cell Physiology, 286(3), C538–C546. 10.1152/ajpcell.00106.2003 [DOI] [PubMed] [Google Scholar]
- Weidelt, T. , & Isenberg, G. (2000). Augmentation of SR Ca2+ release by rapamycin and FK506 causes K+‐channel activation and membrane hyperpolarization in bladder smooth muscle. British Journal of Pharmacology, 129(7), 1293–1300. 10.1038/sj.bjp.0703223 [DOI] [PMC free article] [PubMed] [Google Scholar]
- Wilasrusmee, C. , Da Silva, M. , Singh, B. , Siddiqui, J. , Bruch, D. , Kittur, S. , … Kittur, D. S. (2003). Morphological and biochemical effects of immunosuppressive drugs in a capillary tube assay for endothelial dysfunction. Clinical Transplantation, 17(Suppl 9), 6–12. [DOI] [PubMed] [Google Scholar]
- Wilson, C. , Lee, M. , & McCarron, J. G. (2016). Acetylcholine released by endothelial cells facilitates flow‐mediated dilatation. The Journal of Physiology, 594, 7267–7307. 10.1113/JP272927 [DOI] [PMC free article] [PubMed] [Google Scholar]
- Wilson, C. , Lee, M. D. , Heathcote, H. R. , Zhang, X. , Buckley, C. , Girkin, J. M. , … McCarron, J. (2019). Mitochondrial ATP production provides long‐range control of endothelial inositol trisphosphate‐evoked calcium signaling. The Journal of Biological Chemistry, 294(3), 737–758. 10.1074/jbc.RA118.005913 [DOI] [PMC free article] [PubMed] [Google Scholar]
- Wilson, C. , Saunter, C. D. , Girkin, J. M. , & McCarron, J. G. (2015). Pressure‐dependent regulation of Ca2+ signaling in the vascular endothelium. The Journal of Physiology, 593, 5231–5253. 10.1113/JP271157 [DOI] [PMC free article] [PubMed] [Google Scholar]
- Wilson, C. , Saunter, C. D. , Girkin, J. M. , & McCarron, J. G. (2016). Clusters of specialized detector cells provide sensitive and high fidelity receptor signaling in intact endothelium. The FASEB Journal, 30, 2000–2013. 10.1096/fj.201500090 [DOI] [PMC free article] [PubMed] [Google Scholar]
- Xiao, J. , Tian, X. , Jones, P. P. , Bolstad, J. , Kong, H. , Wang, R. , … Chen, S. R. (2007). Removal of FKBP12.6 does not alter the conductance and activation of the cardiac ryanodine receptor or the susceptibility to stress‐induced ventricular arrhythmias. The Journal of Biological Chemistry, 282(48), 34828–34838. 10.1074/jbc.M707423200 [DOI] [PMC free article] [PubMed] [Google Scholar]
- Yasutsune, T. , Kawakami, N. , Hirano, K. , Nishimura, J. , Yasui, H. , Kitamura, K. , & Kanaide, H. (1999). Vasorelaxation and inhibition of the voltage‐operated Ca2+ channels by FK506 in the porcine coronary artery. British Journal of Pharmacology, 126(3), 717–729. 10.1038/sj.bjp.0702339 [DOI] [PMC free article] [PubMed] [Google Scholar]
- Zheng, Y. M. , Mei, Q. B. , Wang, Q. S. , Abdullaev, I. , Lai, F. A. , Xin, H. B. , … Wang, Y. X. (2004). Role of FKBP12.6 in hypoxia‐ and norepinephrine‐induced Ca2+ release and contraction in pulmonary artery myocytes. Cell Calcium, 35(4), 345–355. [DOI] [PubMed] [Google Scholar]
Associated Data
This section collects any data citations, data availability statements, or supplementary materials included in this article.
Supplementary Materials
Data S1. Supporting information
Figure S1. Repeated ACh administration to mesenteric endothelial cells leads to an increase in signal (‘run‐up’) unless appropriate washes are performed
Figure S2. Endothelial function is partially recoverable after 2‐APB
Figure S3. FK506 or rapamycin did not cause Ca2+ leak
Video S1. Supporting information
Video S2. Supporting information
Video S3. Supporting information
Video S4. Supporting information