Abstract
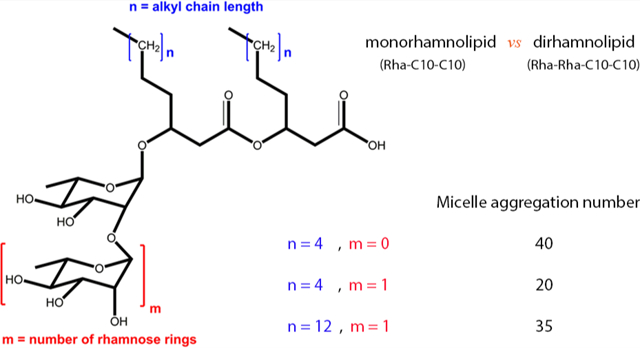
The rhamnolipids are a unique class of biosurfactants produced by the bacteria Pseudomonas aeruginosa. These molecules display a high level of surface activity as well as biodegradability. In this study nonionic dirhamnolipid was investigated by utilizing molecular dynamics simulation at the air–water interface as well as in bulk water. Detailed structural analysis is presented for both the interfacial simulations and the simulations in solution. A systematic comparison was made between our previous work on the monorhamnolipid at the air–water interface and in bulk water. The presence of a second rhamnose group in dirhamnolipid did not show any significant change in the aggregation at the air–water interface. An increase in the molecular weight resulted in the larger surface area per monomer for dirhamnolipid compared to monorhamnolipid at the air–water interface. However, aggregation of dirhamnolipid in bulk water was affected by the presence of a second rhamnose group. Dirhamnolipid aggregates into micellar structure around ~N22 which was lower than the monorhamnolipid aggregation number ~N40. The hydrophobic component of the dirhamnolipid was enhanced to balance the higher hydrophilic component. An increase in alkyl chain length has shown that the enhanced hydrophobic component supports the formation of micellar aggregates up to ~N30 and above, which was not observed in dirhamnolipid with a shorter alkyl chain length.
Graphical Abstract
1. INTRODUCTION
Surfactants are an important class of molecules that reduce the surface tension between two phases. Because of the remarkable ability to reduce repulsive forces between dissimilar phases, surfactants have become an integral part of the modern world. Some of the many applications where they may be found include cleaning products, cosmetics, pharmaceuticals, agriculture, enhanced oil recovery, wetting agents, paints, and emulsifiers. Although surfactants are a broad class of a number of molecules containing a hydrophilic and hydrophobic moiety, the majority of consumed surfactants are anionic molecules of anthropogenic origin.1 Because of this high usage, surfactants inevitably enter our wastewater where they eventually aggregate in our underground water resources and pose a risk for aquatic organisms.2 It was these limitations that motivated our work. The present paper focuses on a neutral surfactant molecule.
The question then naturally arises: are there more environmentally friendly, readily biodegradable surfactants? The answer lies in a class of molecules known as biosurfactants, or surfactants of biological origin. Since the characterization of the first biosurfactant “surfactin” in 1968,3 production of biological surfactants has become a multibillion dollar industry.4 Although there are many types of biosurfactants, our research has focused on the rhamnolipids, composed of a β-hydroxyalkanoyl-β-hydroxyalkanoate fatty acid connected through the hydroxyl in the β-position to the ester to one or two rhamnose sugar molecules (see Figure 1 for details).5 The great advantage of rhamnolipid surfactants is that they are produced naturally by the bacteria Pseudomonas aeruginosa and show great surface activity including low critical micelle concentrations. Up until now our group has performed extensive computational studies on the monorhamnolipid forms produced by this bacteria, but strains of Pseudomonas aeruginosa produce a heterogeneous mixture containing both the mono- (mRL) and dirhamnolipid (dRL) forms.6 In the present paper we study the aggregation properties of dRL to compare with the well studied mRL. Thus, the focus of this article is on the aggregation behavior of dirhamnolipid surfactants at the air–water interface and in solution.
Figure 1.
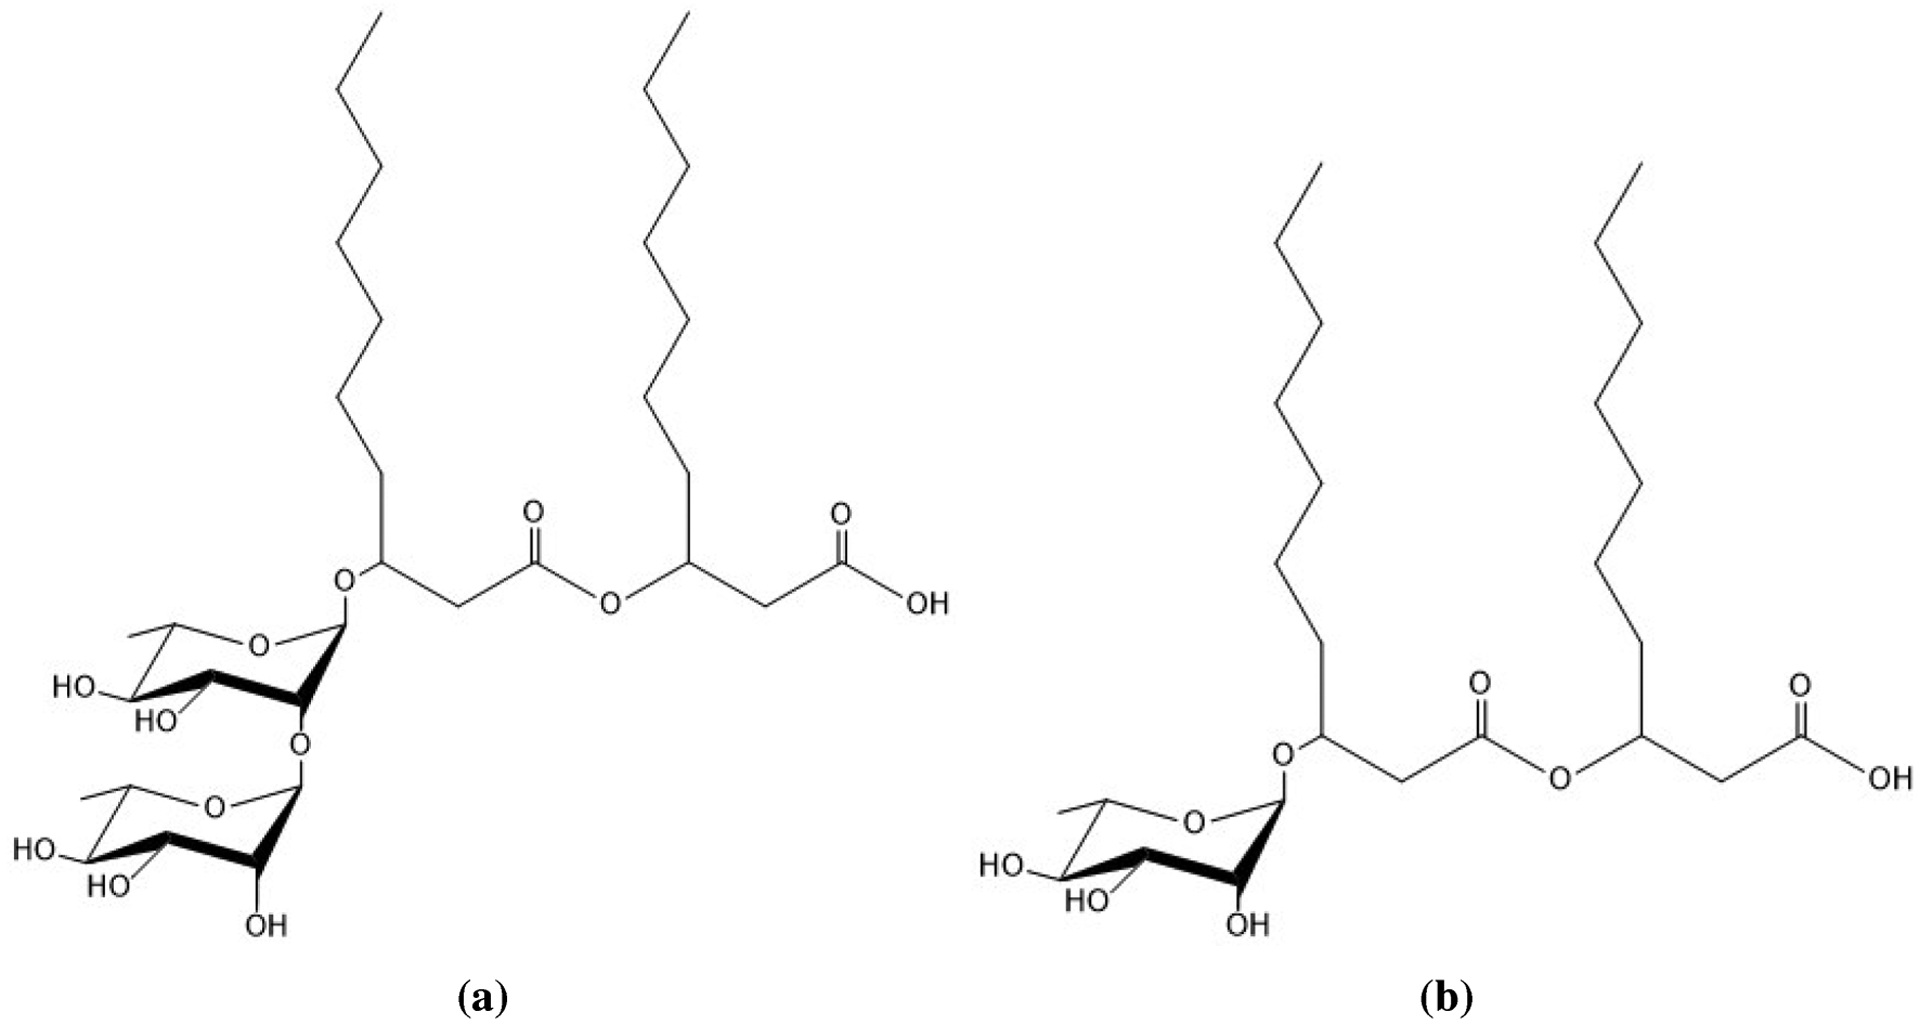
Structures of (a) dRL-C10-C10 and (b) mRL-C10-C10, two common forms of rhamnolipid produced by Pseudomonas aeruginosa.
In this study, the nonionic forms of dirhamnolipid of alkyl chain length 10, 14, and 18 are investigated. We begin with an in-depth analysis of these surfactants at the air–water interface. Utilizing a simple energetic heuristic and comparing with our previous work on monorhamnolipid, we determine an optimal surface packing concentration. Throughout the interfacial section three concentrations are presented: a low surface concentration regime which falls below this optimal concentration, the optimal concentration, and a high surface concentration regime. These three regions illustrate the changes in conformation and packing as more surfactant monomers are placed at the interface. We have given various geometrical measurements as well as an analogue to NMR spectroscopic order parameters to detail the interfacial behavior.
The article also details the micellar behavior of these surfactants as they aggregate in water. We use the same three dirhamnolipid molecules for this section as well and present atomistic detail of the aggregates these molecules form. This section illustrates the effect that chain length has on the aggregation size of these molecules. We utilize geometrical arguments to determine the onset of micellization for a given aggregate as well as probe the fluxionality (the level of shape fluctuations) of a given aggregate.
2. SIMULATION METHODS
2.1. Molecular Dynamics Interface Simulation.
Force field parameters were first obtained for dRL-C10-C10, dRLC14-C14, and dRL-C18-C18 by utilizing the CHARMM General Force Field7 and optimized according to the CHARMM force field8 to reproduce the properties of these surfactants at a high level of ab initio calculation. We have used this force field for our previous work on the nonionic and anionic forms of mRL and have found it to adequately reproduce experimental observations.9,10 These include accurate aggregation numbers for a given surfactant as well as correct elucidation of interfacial behavior.11
Table 1 outlines the systems that were prepared to analyze the aggregation of dRL at the air–water interface. All starting structures were prepared by utilizing the PACKMOL software package,12 and a water region of dimensions 60 × 60 × 150 Å3 was constructed by using 17094 TIP313 molecules. The entire system stretches 340 Å in the z-direction to allow for a large gap between periodic images, and a surfactant monolayer was placed above and below the water region. Table 1 also gives the surface area per monomer for each system (SAPM). A schematic is outlined in Figure 3.
Table 1.
System Setup for Surfactant Monolayer Simulationa
| no. DRL | water molecules | initial box size (Å × Å × Å) | SAPM (Å2) |
|---|---|---|---|
| 10 | 17094 | 60 × 60 × 340 | 360 |
| 20 | 17094 | 60 × 60 × 340 | 180 |
| 25 | 17094 | 60 × 60 × 340 | 144 |
| 30 | 17094 | 60 × 60 × 340 | 120 |
| 35 | 17094 | 60 × 60 × 340 | 102.9 |
| 37 | 17094 | 60 × 60 × 340 | 97.3 |
| 39 | 17094 | 60 × 60 × 340 | 92.3 |
| 40 | 17094 | 60 × 60 × 340 | 90 |
| 42 | 17094 | 60 × 60 × 340 | 85.7 |
| 44 | 17094 | 60 × 60 × 340 | 81.8 |
| 45 | 17094 | 60 × 60 × 340 | 80 |
| 47 | 17094 | 60 × 60 × 340 | 76.6 |
| 49 | 17094 | 60 × 60 × 340 | 73.5 |
| 50 | 17094 | 60 × 60 × 340 | 72 |
| 52 | 17094 | 60 × 60 × 340 | 69.2 |
| 55 | 17094 | 60 × 60 × 340 | 65.4 |
| 60 | 17094 | 60 × 60 × 340 | 60 |
| 65 | 17094 | 60 × 60 × 340 | 55.4 |
| 70 | 17094 | 60 × 60 × 340 | 51.4 |
The same parameters were used for DRL surfactants of chain length C10-C10, C14-C14, and C18-C18. Note that the water region was the same for all simulations and that the concentration was changed with the addition of monomers. SAPM = surface area per monomer.
Figure 3.
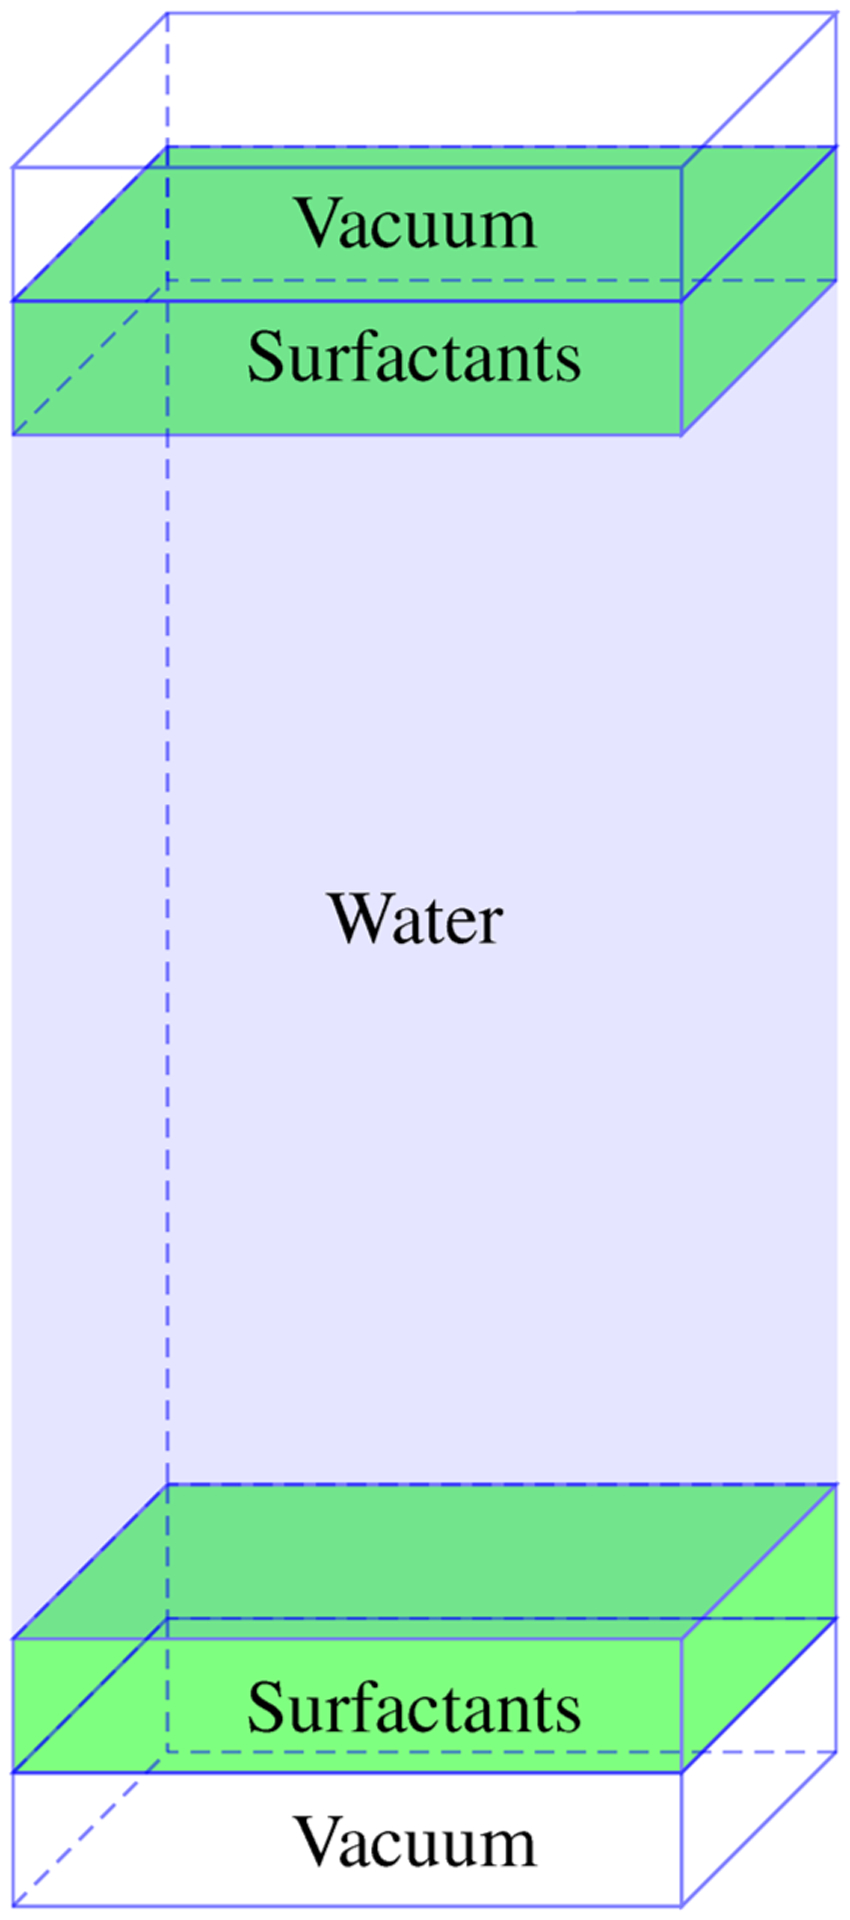
A starting configuration to determine interfacial properties is given as two monolayers separated by a large water region and vacuum across the boundary in the z-direction. Note that periodic boundary conditions are used in each dimension; image not drawn to scale.
The size of the simulation box was kept constant across all simulations, and the concentration was modulated by changing the number of monomers at the interface.
Once an initial structure was prepared, the system was energy minimized. The systems were then heated to 300 K by using a Langevin thermostat14 over 300 ps. Following heating, the systems were equilibrated in the NVT ensemble with periodic boundary conditions. A cutoff for nonbonded interactions was set at 10 Å, and a switch function starting at 8 Å was employed for van der Waals interactions. The temperature was maintained at 300 K, and all bonds involving hydrogen atoms were constrained with the SHAKE algorithm.15 A time step of 1 fs was employed for all MD integration. Each system was allowed to equilibrate for 30 ns under these conditions, and a final run of 5 ns was used for all subsequent analysis. We have found this to be sufficient time for the monomers to relax at the air–water interface.
2.2. Molecular Dynamics Simulation of Dirhamnolipid in Water.
The same parameters were used to simulate the micellar behavior in solution. An initial structure was built by randomly placing varying dRL monomers (from 10 to 100 by increments of 10) in a 100 × 100 × 100 Å3 cubic box once again using PACKMOL software. This setup was repeated for each of the three chain length dirhamnolipids investigated in this study. Each initial arrangement was then solvated with TIP3 water molecules ensuring at least 2.8 Å separation from the heavy atoms of dirhamnolipid. Upon solvation, the system is first energy minimized, followed by heating in the isobaric–isothermal ensemble (NPT) at 1 atm. Micelle formation lies at the limits of the accessible time scales available to MD simulation, so simulated annealing16 was used to induce micelle formation. The annealing schedule was as follows: (i) the temperature is increased from 300 to 400 K in 200 ps, (ii) the system is equilibrated at constant pressure at 400 K for 800 ps, and (iii) the system is slowly cooled to 300 K. Upon the completion of the simulated annealing, aggregates begin to form. At this point, individual aggregates were identified, and the coordinates were used to prepare new systems to study the properties of these aggregates. The system is further equilibrated for 30 ns in the NPT ensemble utilizing the Nosé–Hoover Langevin barostat.17 An additional 5 ns equilibration was used for the final analysis. All analysis was performed either with custom scripts in VMD18 or with the aid of the MDAnalysis software package.19,20
3. RESULTS AND DISCUSSION
3.1. Simulation of DRL Surfactant at the Air–Water Interface.
Surfactant molecules will aggregate between two different phases and reduce the interfacial tension. Understanding the behavior at the interface is vital to providing insight into the efficacy of a given surfactant. Figure 4 shows the representative snapshots of simulated dRL-C10-C10 surfactant at the air–water interface varying from a few to more molecules. In the text, dRL-C10-C10 will be referred as dRL and mRL stands for mRL-C10-C10. We have provided a detailed conformational analysis of both the hydrophobic alkyl chains as well as the hydrophilic rhamnose and carboxylic headgroups below.
Figure 4.
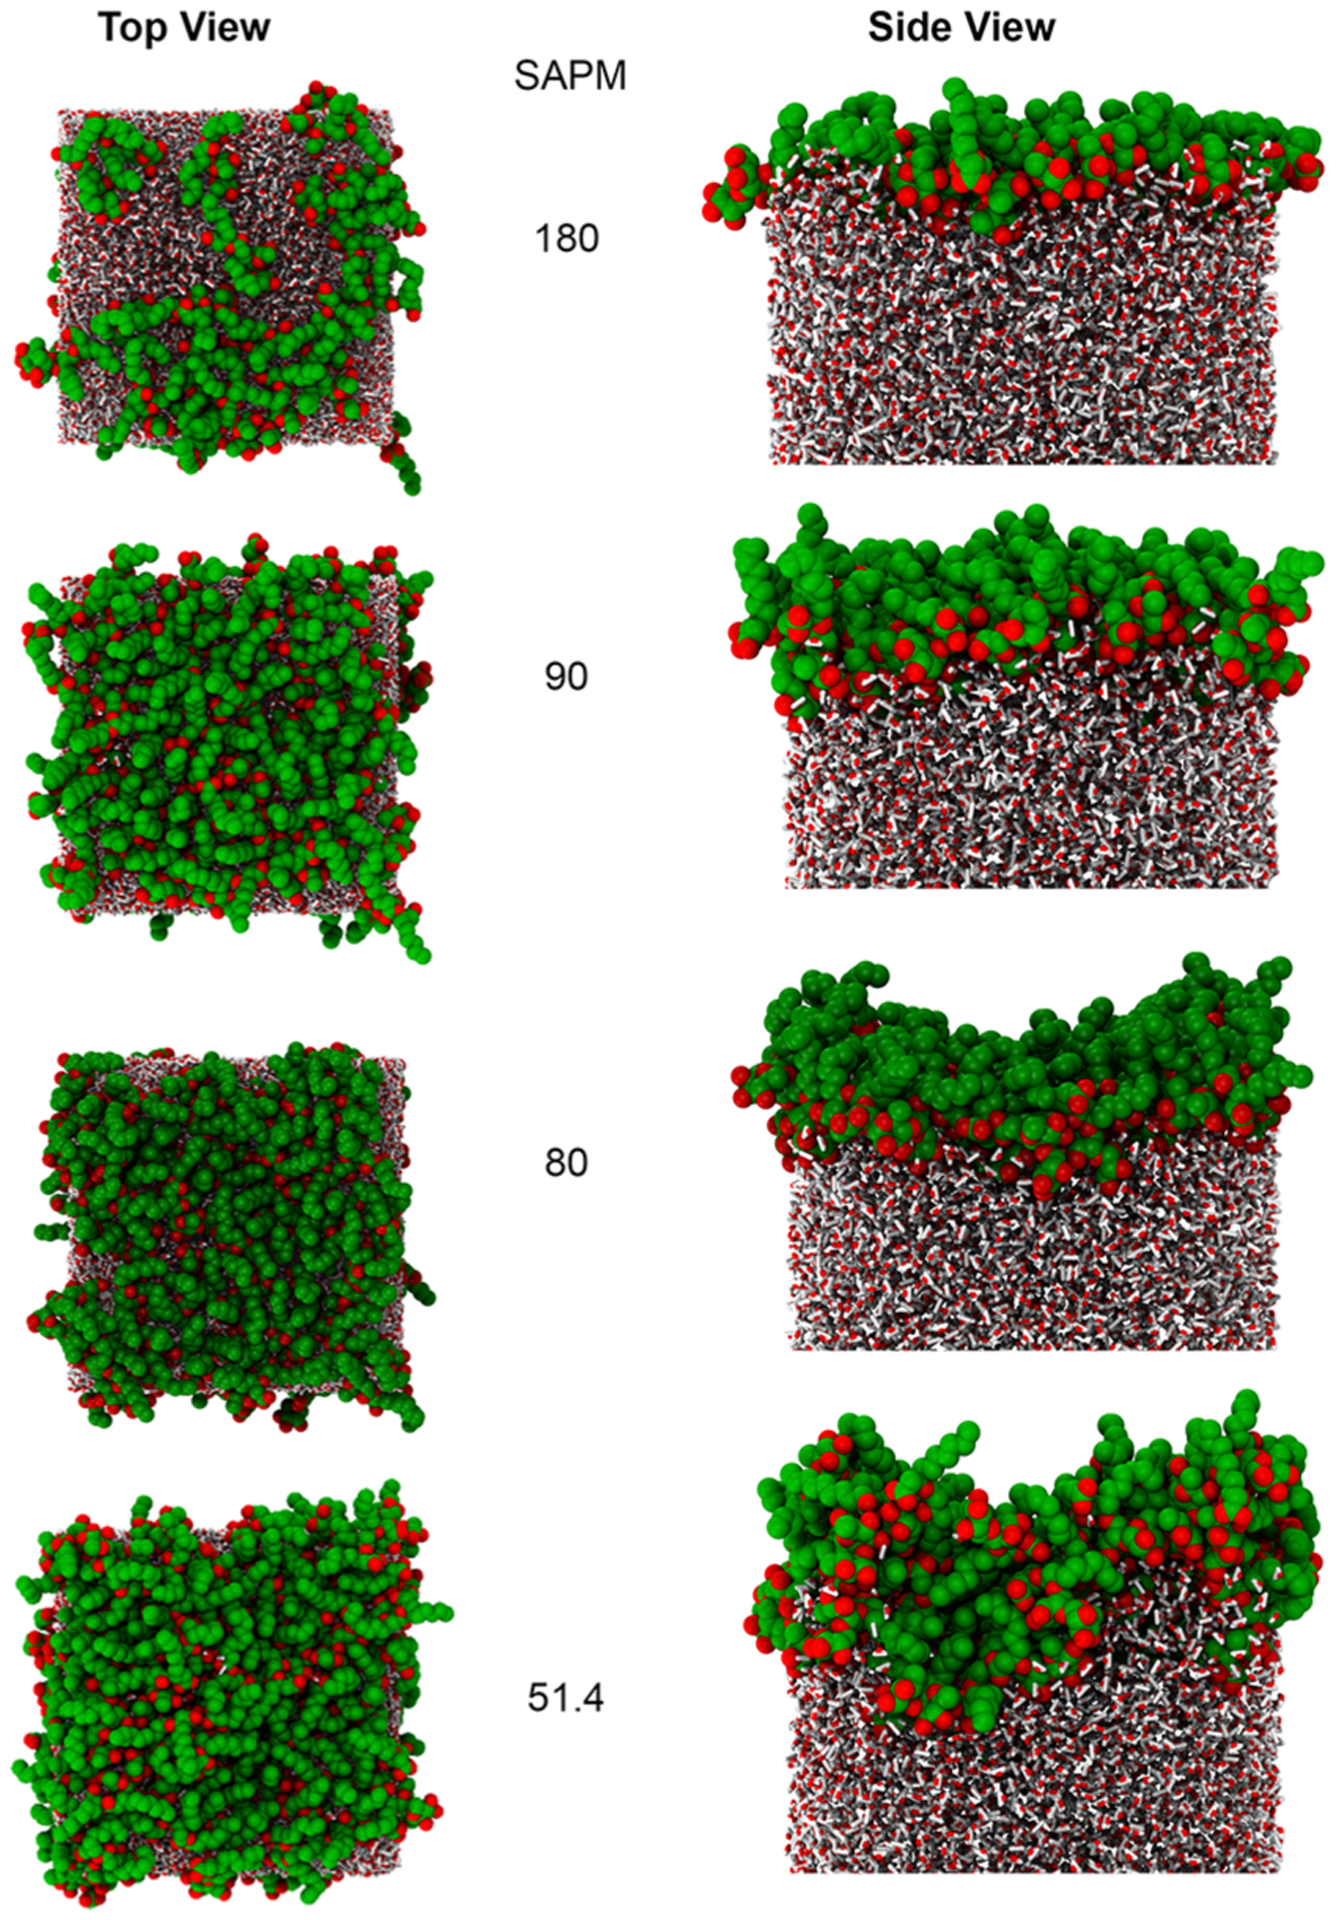
Snapshots of the dRL monolayers at different surface coverages. dRL are shown as VDW spheres, and water molecules are shown as smaller tubes. SAPM values are given in Å2. It should be noted that there is a vacuum of length 157 Å above the surfactant, making sure that the monolayers are separated long enough.
3.1.1. Interface Formation Energy.
We may gauge the energetics of the monolayer system by determining the interface formation energy (IFE) for a given concentration.21 This is defined as the following:
| (1) |
where Etotal is the energy of the entire system, Esurfactant,single is the energy of a single surfactant molecule determined by a separate MD simulation run in vacuum at the same temperature, and Eair–water is the energy of water box determined from its own MD simulation at the same temperature.
Figure 5 presents the results of dRL at the air–water interface, and for comparison with mRL, previously published work from our group is also included. We first note that dRL shows a local minimum near a surface area per monomer (SAPM) of 90 Å2, whereas mRL has a local minimum near 80 Å2. We refer to this minima in the IFE as complete surface coverage concentration in the text. This observed difference in SAPM is to be expected since dRL contains an additional rhamnose group, thus increasing the overall volume of the molecule and the number of interactions. A smaller molecular weight of mRL leads to more densely packed interface compared to dRL. The result is a larger surface area per monomer for dRL at complete surface coverage compared with the mRL.
Figure 5.
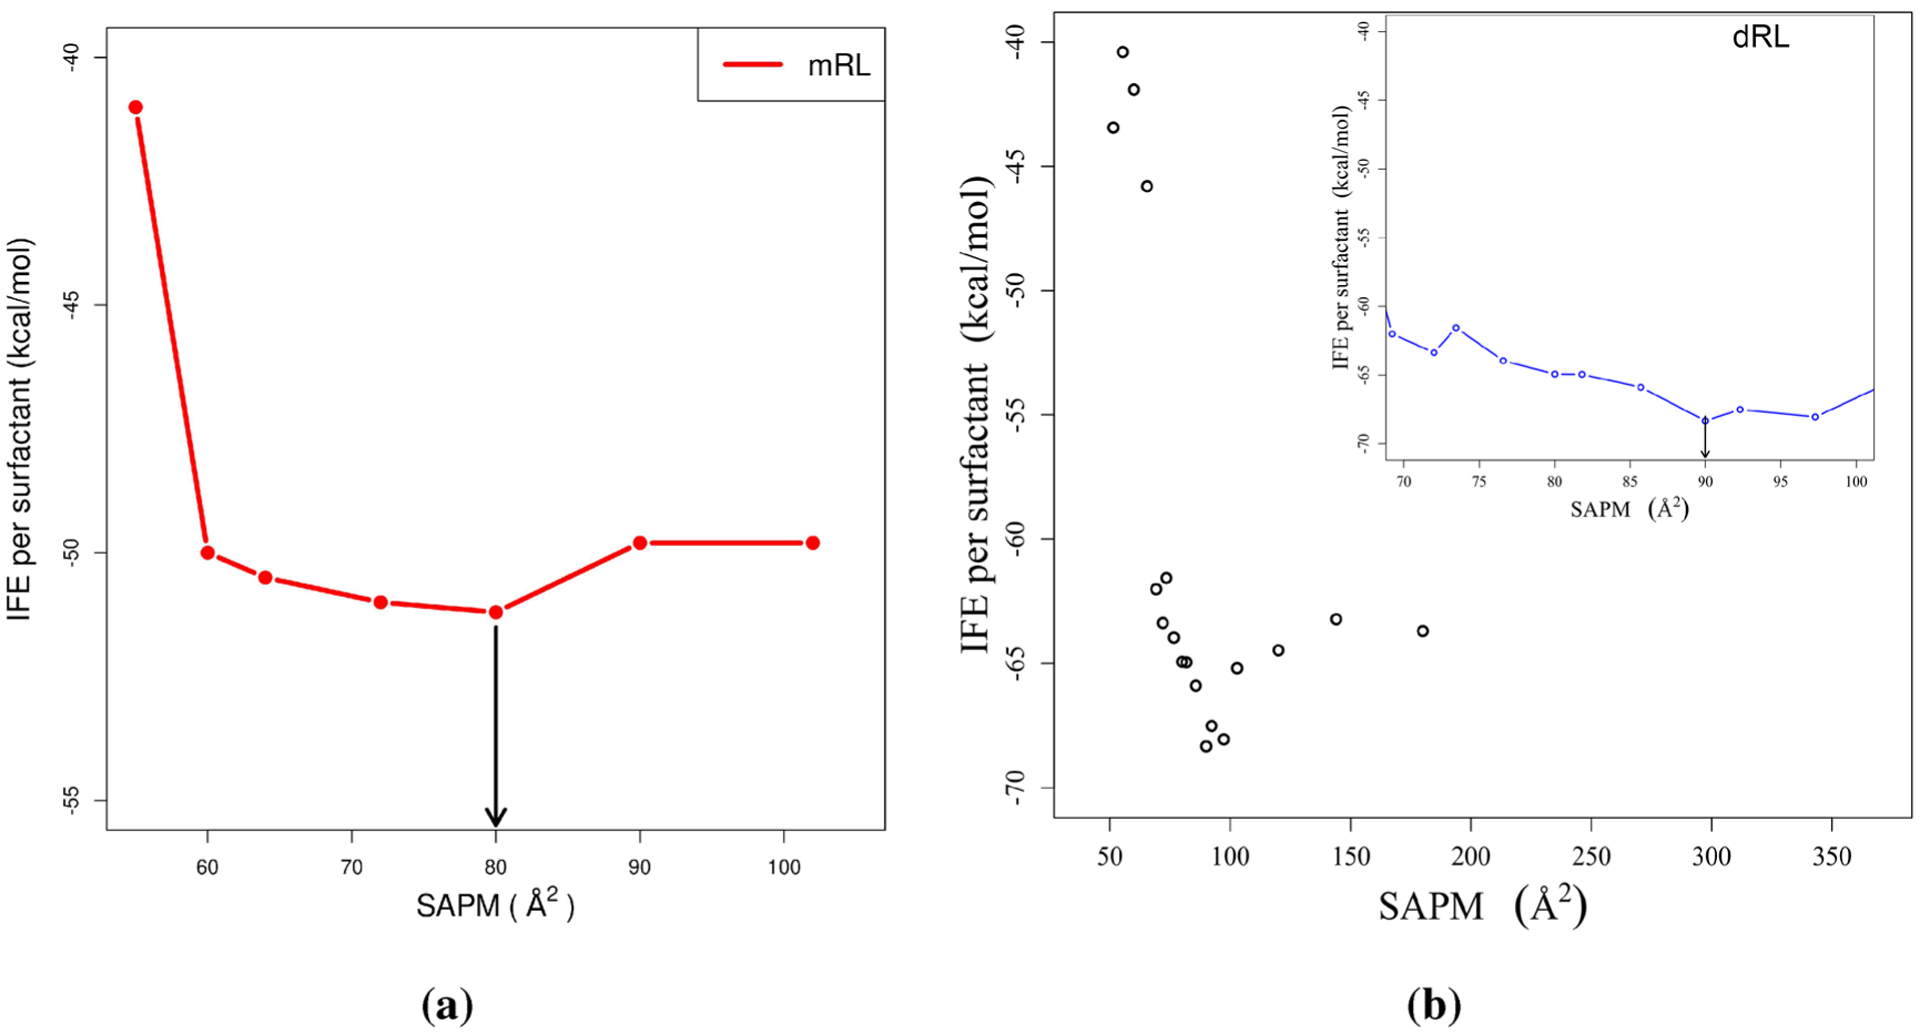
Interface formation energy for (a) mRL and (b) dRL as a function of surface area per monomer (SAPM). All the points are shown for dRL, and the inset picture shows a clear minimum near 90 Å2. The downward arrow indicates the point that corresponds to the complete surface coverage concentration.
3.1.2. Surface Pressure–Area Isotherm.
The predicted surface pressure–area isotherms for dRL and mRL are depicted in Figure 6. The procedure to obtain surface pressure can be found elsewhere and references therein.22,23 The surface pressure of a monolayer is a more convenient quantity for direct comparison between molecular dynamics simulations and experimental data. The results indicate that mRL and dRL at the air–water interface have different pressure–area isotherms. The surface pressure decreases with increasing area per molecule systematically for mRL, and it is not the case with dRL. The bulkier dirhamnose headgroup of dRL is clearly playing an important role in closer packing at the surface.
Figure 6.
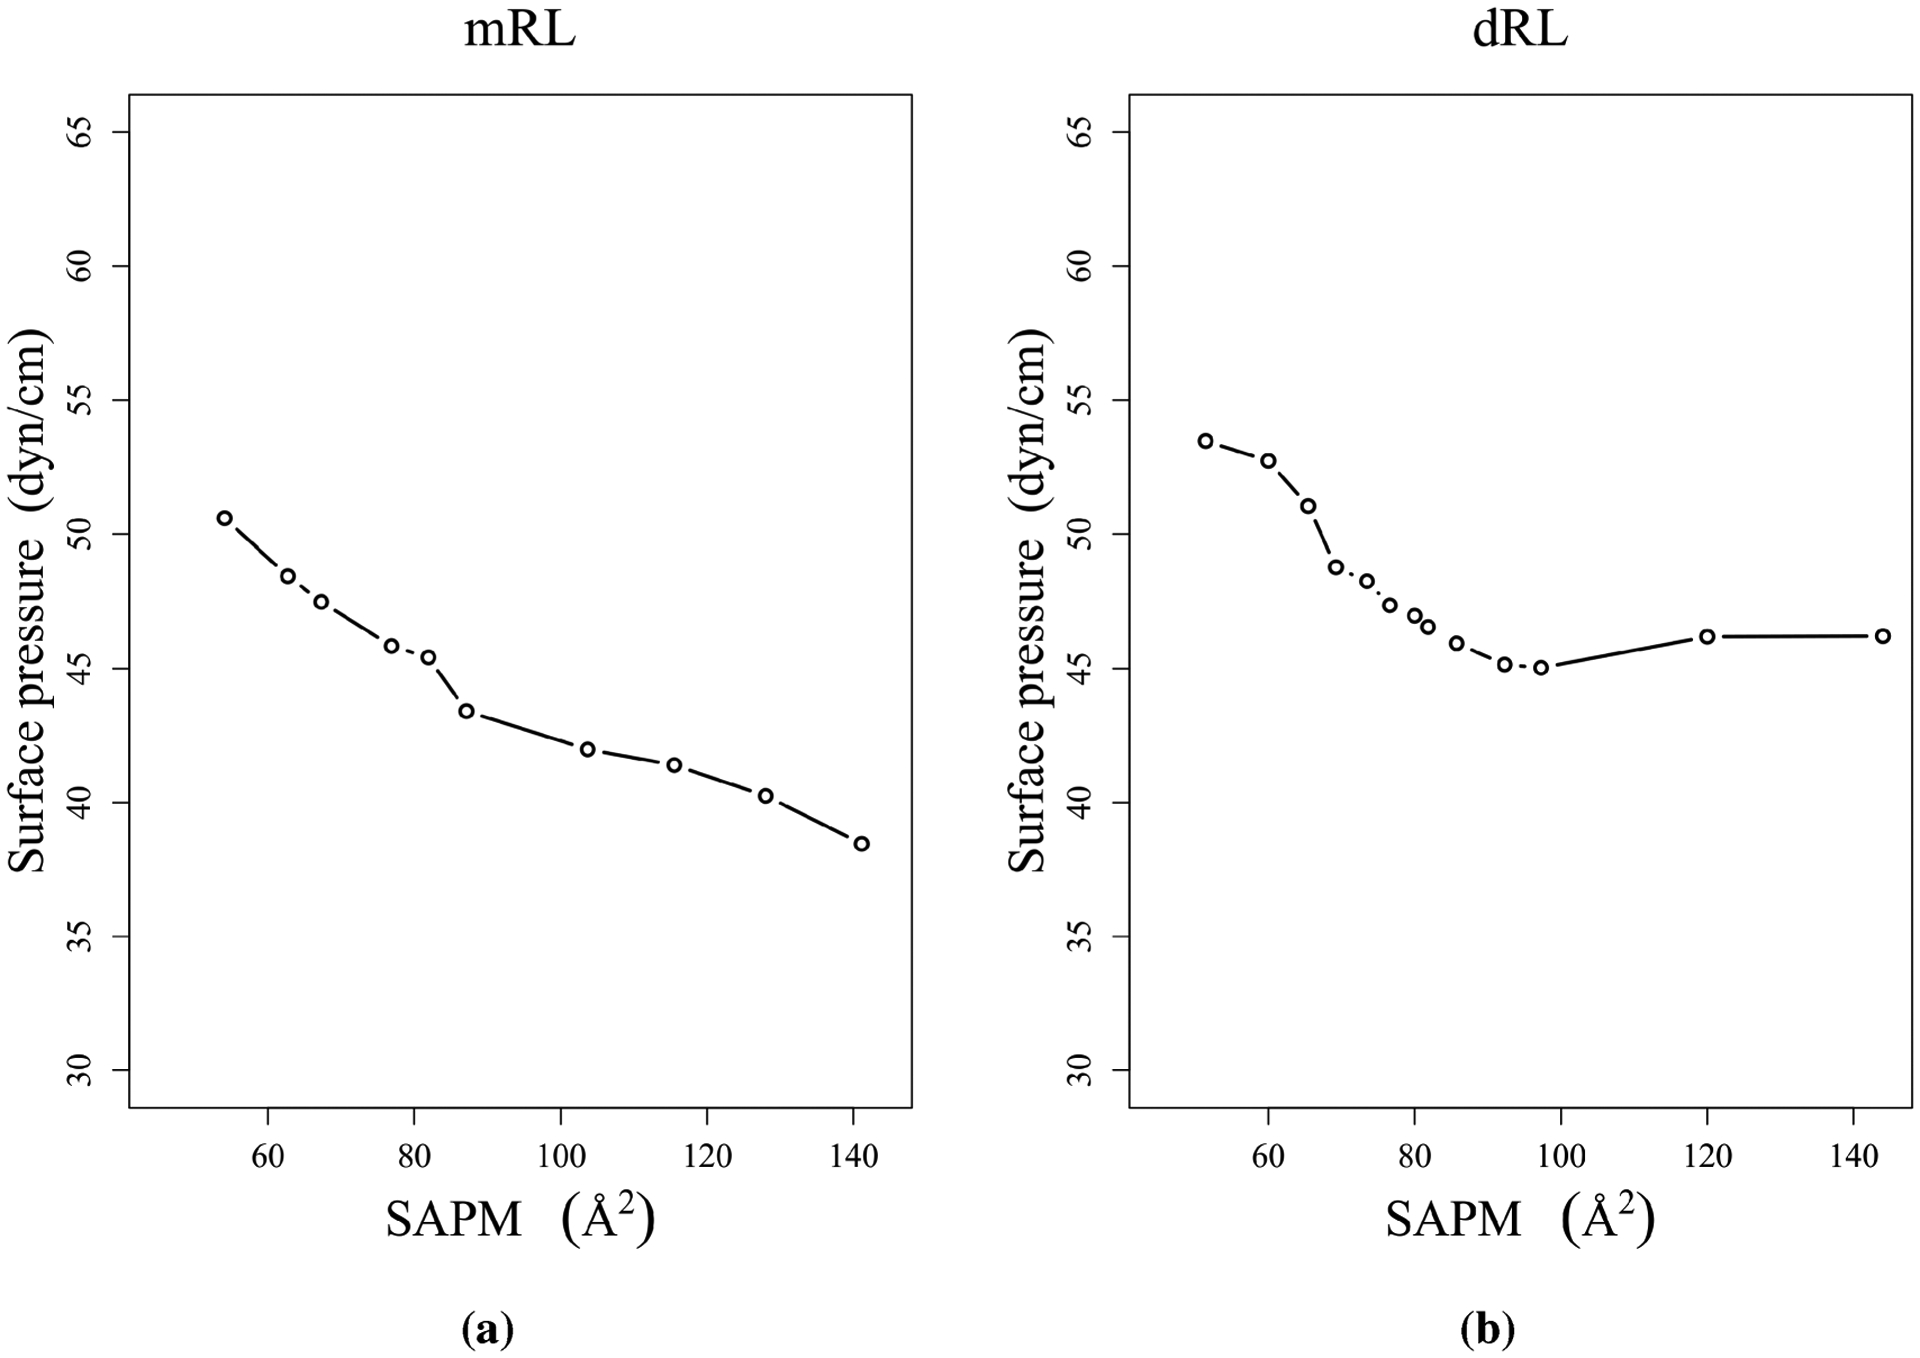
Pressure–area isotherms for mRL and dRL at the air–water interface.
3.1.3. Alkyl Chain Alignment.
Surfactant molecules are highly dynamic in nature at the interface and also in solution. To understand the dynamics at the interface, we begin with an in-depth analysis of the alkyl chains for mRL and dRL. The carbon–hydrogen order parameter is frequently used in deuterium or carbon-13 NMR experiments24 and gives a measure of the anisotropy of given carbon on a lipid chain. The order parameter may range from −0.5 to 1.0 where a value of unity corresponds to a fully extended lipid chain, and a value closer to −0.5 corresponds to a globular configuration. For our purposes it is defined as the following:
| (2) |
where θ is the angle between a given C–H bond vector and the monolayer normal (z-axis in all simulations), and the angle brackets denote an average over the length of the trajectory and the ensemble of atoms. Results are plotted in Figure 7 for dRL at the complete surface coverage concentration, and for comparison results for mRL are also provided. We should note that although we refer to the chain lengths of mRL and dRL by the total number of carbons (10 in this case) in a given alkyl chain, the first three carbon atoms of each chain are not effectively part of the alkyl chain and therefore not used for order parameter analysis. Consequently, our indexing scheme begins with carbon number 4 for each chain.
Figure 7.
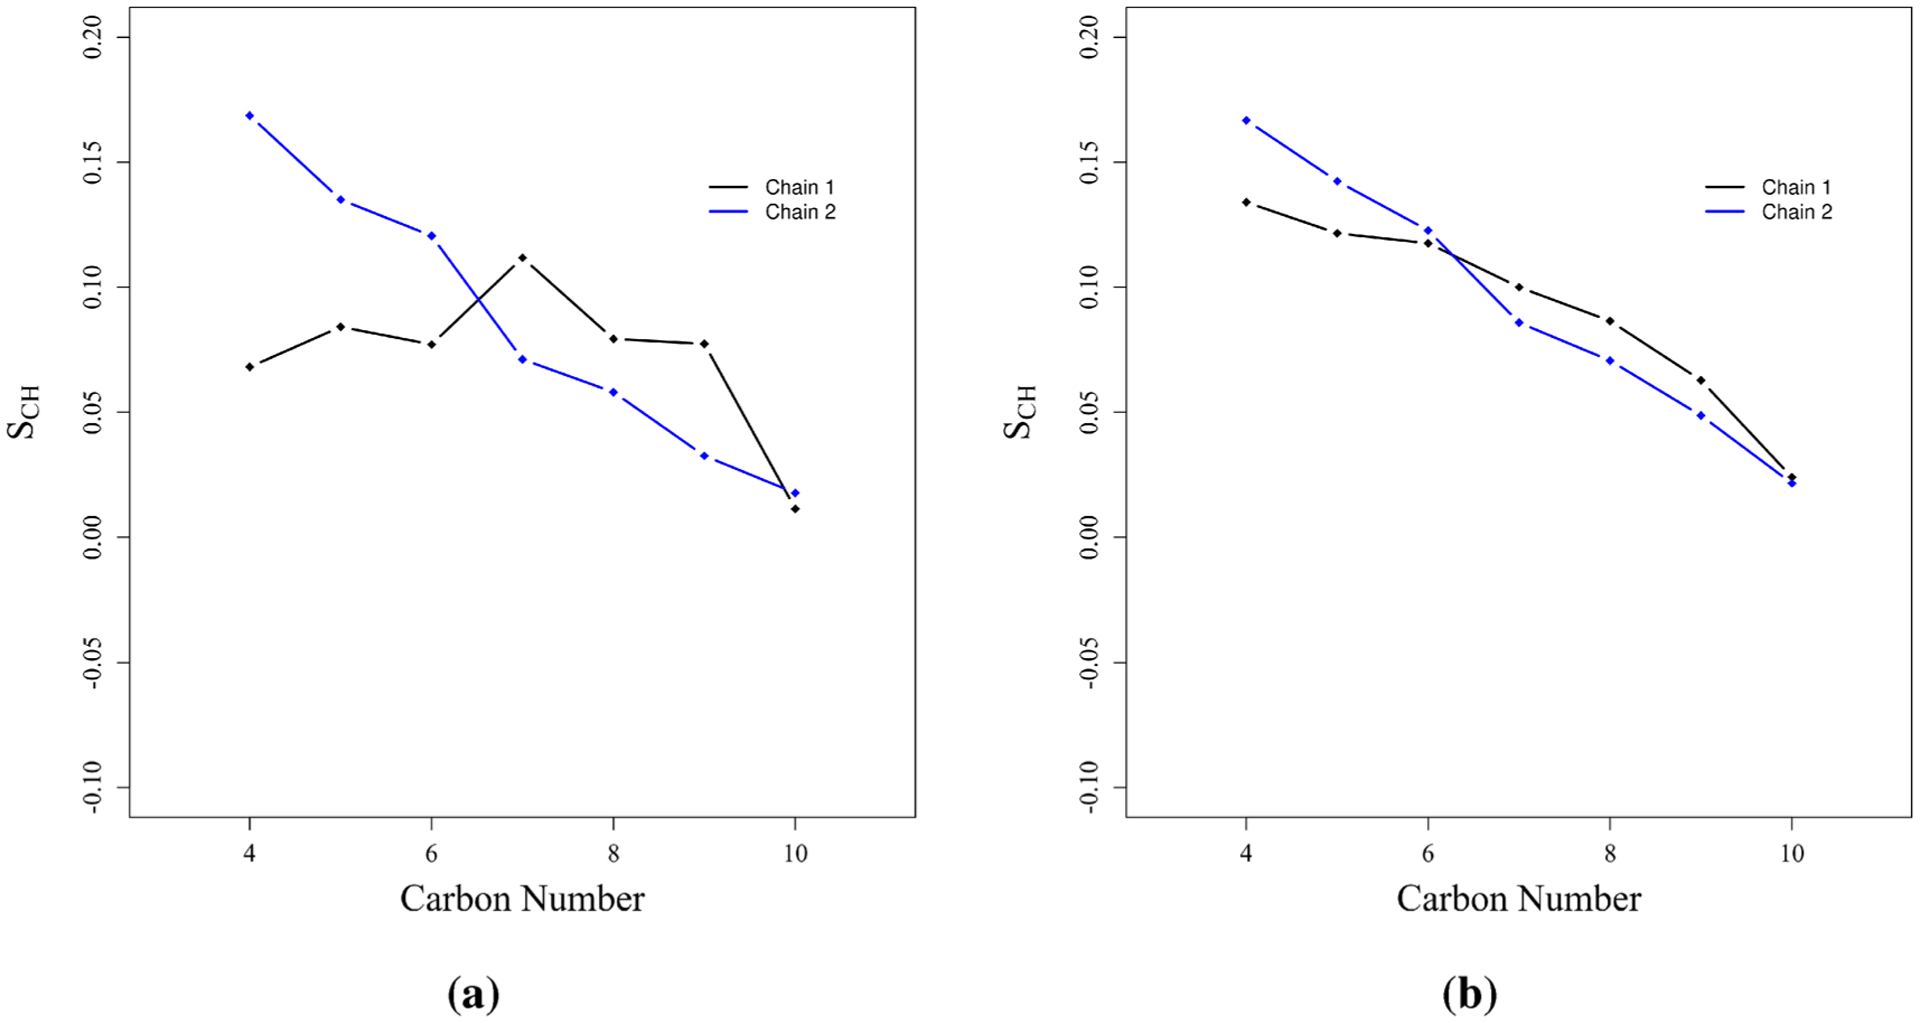
Carbon–hydrogen order parameter presented for (a) dRL and (b) mRL. Results are given for complete surface coverage concentration (SAPM = 90 Å2).
Because of the asymmetric geometry of the dRL headgroup, the two chains behave rather differently. The first chain (chain 1) is positioned closer to the rhamnose headgroup while the second chain (chain 2) is both farther away from the rhamnose group and also restricted by the first chain. The order parameter reflects this as we observe chain 2 is initially more ordered than chain 1 for the lower indexed carbon atoms. Chain 1 is more closely coupled to the fast dynamics of the water, and thus the lower indexed carbon atoms have order parameters close to zero. Qualitatively, we can understand this difference as a preference for chain 2 to remain more extended while chain 1 is more compacted. In the case of mRL the two alkyl chains behave similarly to a larger extent. Therefore, these results gives us a clue that the presence of a second rhamnose ring does have some effect on the orientation of the alkyl chain 1 in dRL.
3.1.4. Alkyl Chain Tilt.
A complementary analysis was performed on the tilt angles of the alkyl chains. This is accomplished by creating a vector between the base of the chain (carbon 4) and the terminal carbon. With this vector defined we may take the projection on the monolayer normal to determine the degree of tilt of a given alkyl chain. The angle data are presented in Figure 8. We observe that at complete surface coverage concentration the tilt angle of dRL is about 50° normal to the surface. On the other hand, mRL also shows a similar result. There is no significant difference between the tilt angle of chain 1 and chain 2 in mRL as well as dRL. We could say that the presence of a second rhamnose group in dRL does not contribute to the tilt angle of the alkyl chains at the interface aggregation.25
Figure 8.
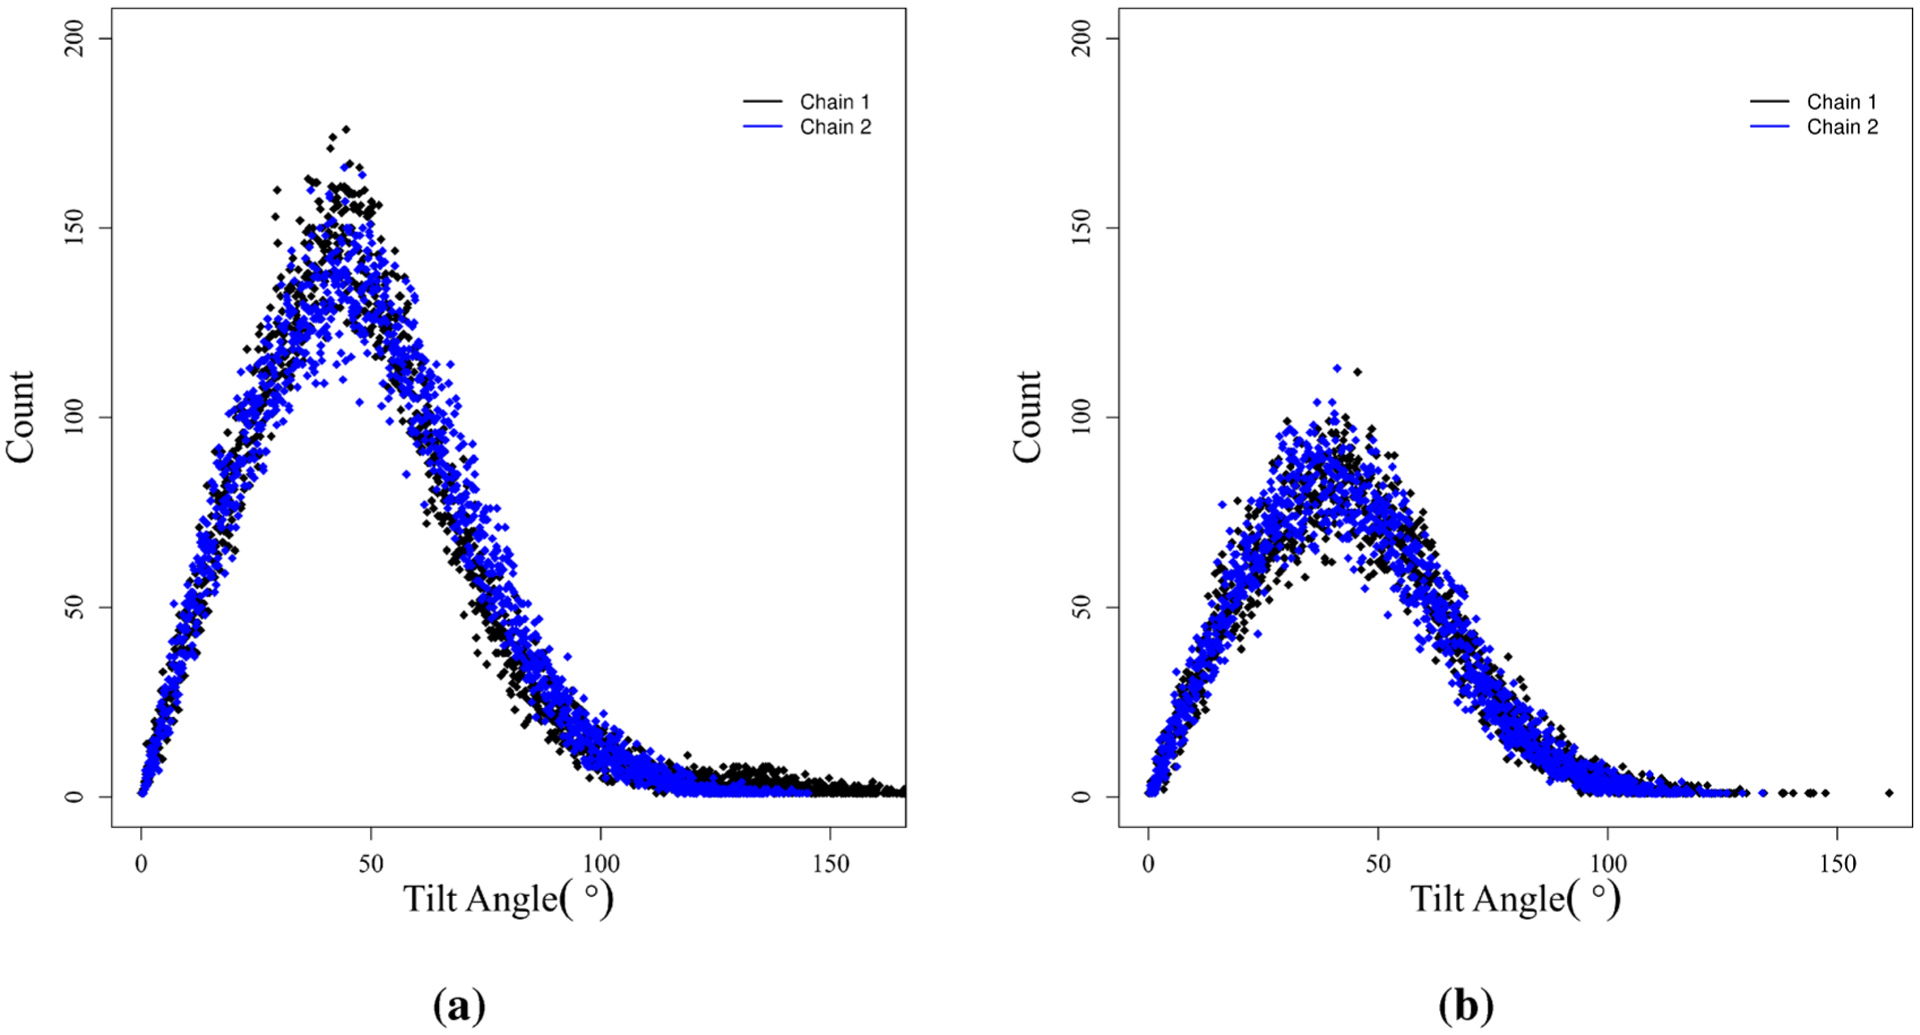
Tilt of alkyl chains with respect to the monolayer normal for (a) dRL and (b) mRL. Results are given for complete surface coverage concentration (SAPM = 90 Å2).
3.1.5. Mass Density Profiles.
Analysis of the dirhamnolipid mass density along the z-axis was done utilizing the density profile plugin for VMD.26 The results of this analysis are presented for dRL in Figure 9, and for comparison with mRL results from our published work are also included.
Figure 9.
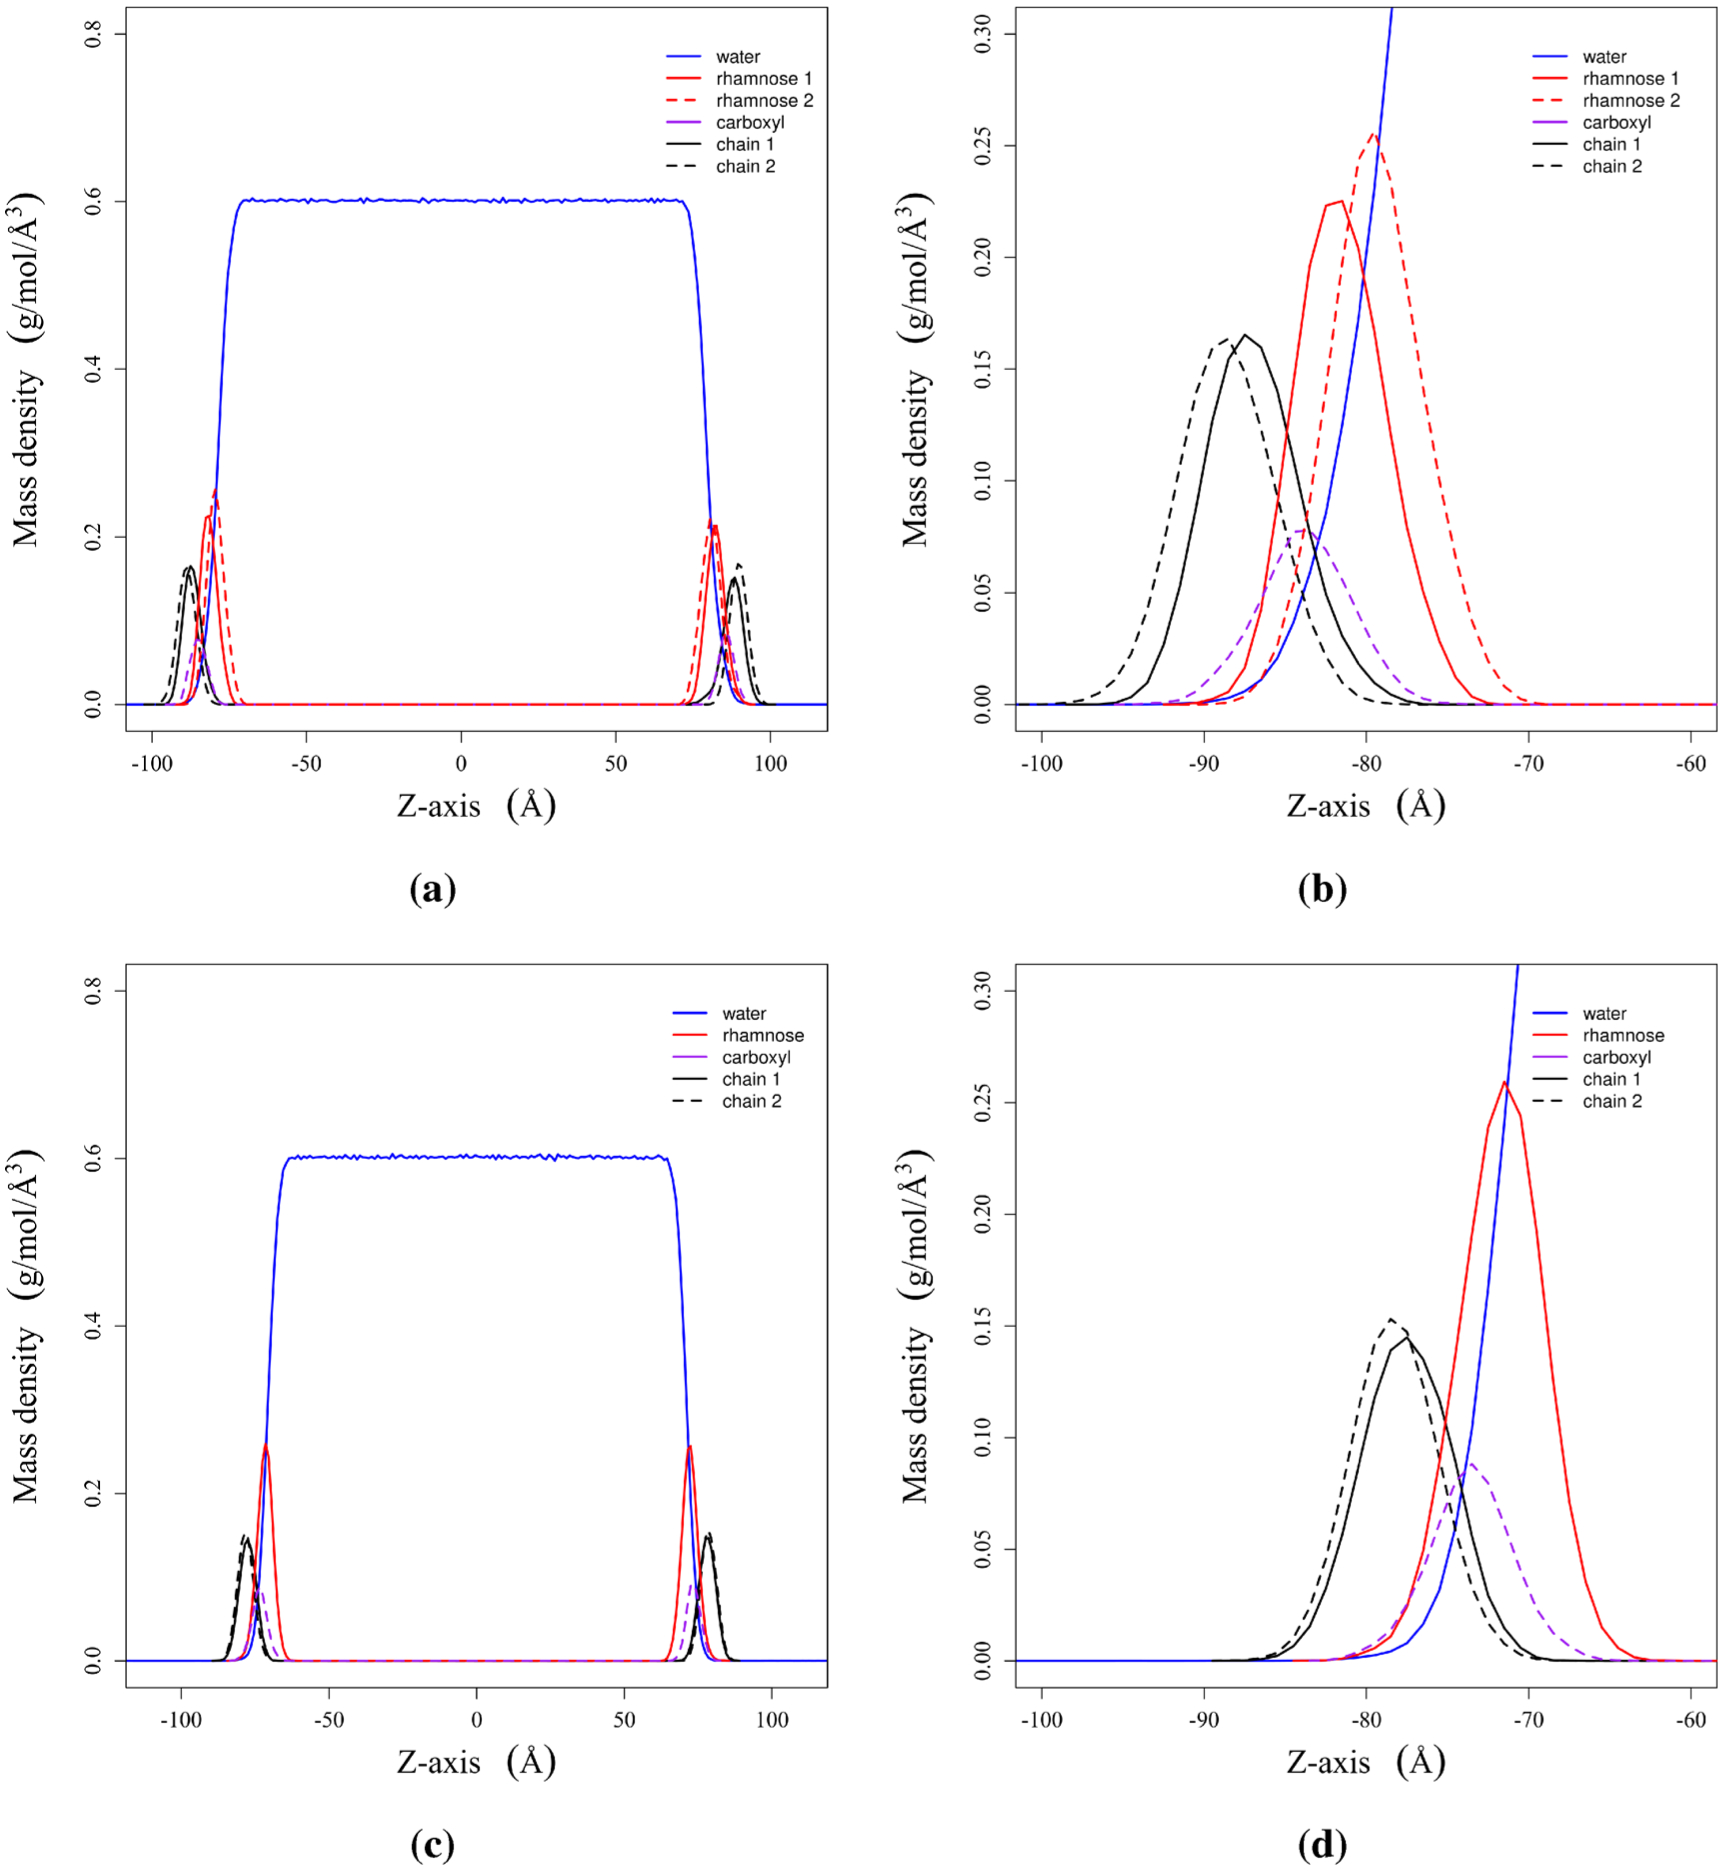
Mass density plots for (a) dRL and (c) mRL aggregation at the air–water interface. Plots (b) and (d) are enlarged versions of the same figures to the immediate left. See Figure 2 for the molecular components that are referenced.
We observe that mass density plots of dRL and mRL look very much similar from Figure 9a,c. There is water separating the two interfaces; the hydrophobic components are above the water surface, and hydrophilic components are solvated to a larger extent. We have made an attempt to see how the solvation of various components of mRL and dRL differs at the complete surface coverage concentration. We have provided an enlarged version of the mass density plot focusing on one monolayer to gain insight into the effect of the second rhamnose group on the surface aggregation. It is observed that rhamnose 2 overlaps more with the bulk water than rhamnose 1. The only rhamnose group in mRL is hydrated to the same extent as rhamnose 2 in dRL. There are no significant changes in the position of alkyl chains 1 and 2. Similarly, the terminal carboxyl group has a better overlap with the solvent in mRL than dRL. These observations indicate that the second rhamnose group in dRL does have some effect on the aggregation at the interface, but it is not significant.
3.2. Headgroup Conformational Analysis.
The headgroup of a surfactant plays a critical role in its interfacial behavior as it is the main region of contact between the molecule and the solvent. Our group has previously examined the headgroup conformations of mRL. Using the same method outlined in our previous article, we measured the closest oxygen–oxygen distance between the terminal carboxylic acid and the hydroxyl oxygen on the rhamnose group (see Figure 10). It should be noted that we measured all possible hydrogen-bonding interaction distances and chose the shortest distance for discussion. Another point of interest is to see which of the two rhamnose rings prefers to interact strongly with the carboxylic group and what is the role of conformation of rhamnose–rhamnose. Figure 11 presents the headgroup conformations of dRL and mRL at complete surface coverage concentration. It is clear from the figure (a) that rhamnose 2 interacts more strongly with the carboxyl group than rhamnose 1. Rhamnose 2 forms intramolecular hydrogen bonds with the carboxyl group, thereby allowing the rhamnose 1 to either interact with water or neighboring monomers. In the case of mRL aggregation at the air–water interface, there are two headgroup conformations that compete with each other. This is slightly different in dRL wherein a closed conformation is highly preferred over an open conformation. This is clearly an effect of the presence of the additional rhamnose group in dRL.
Figure 10.
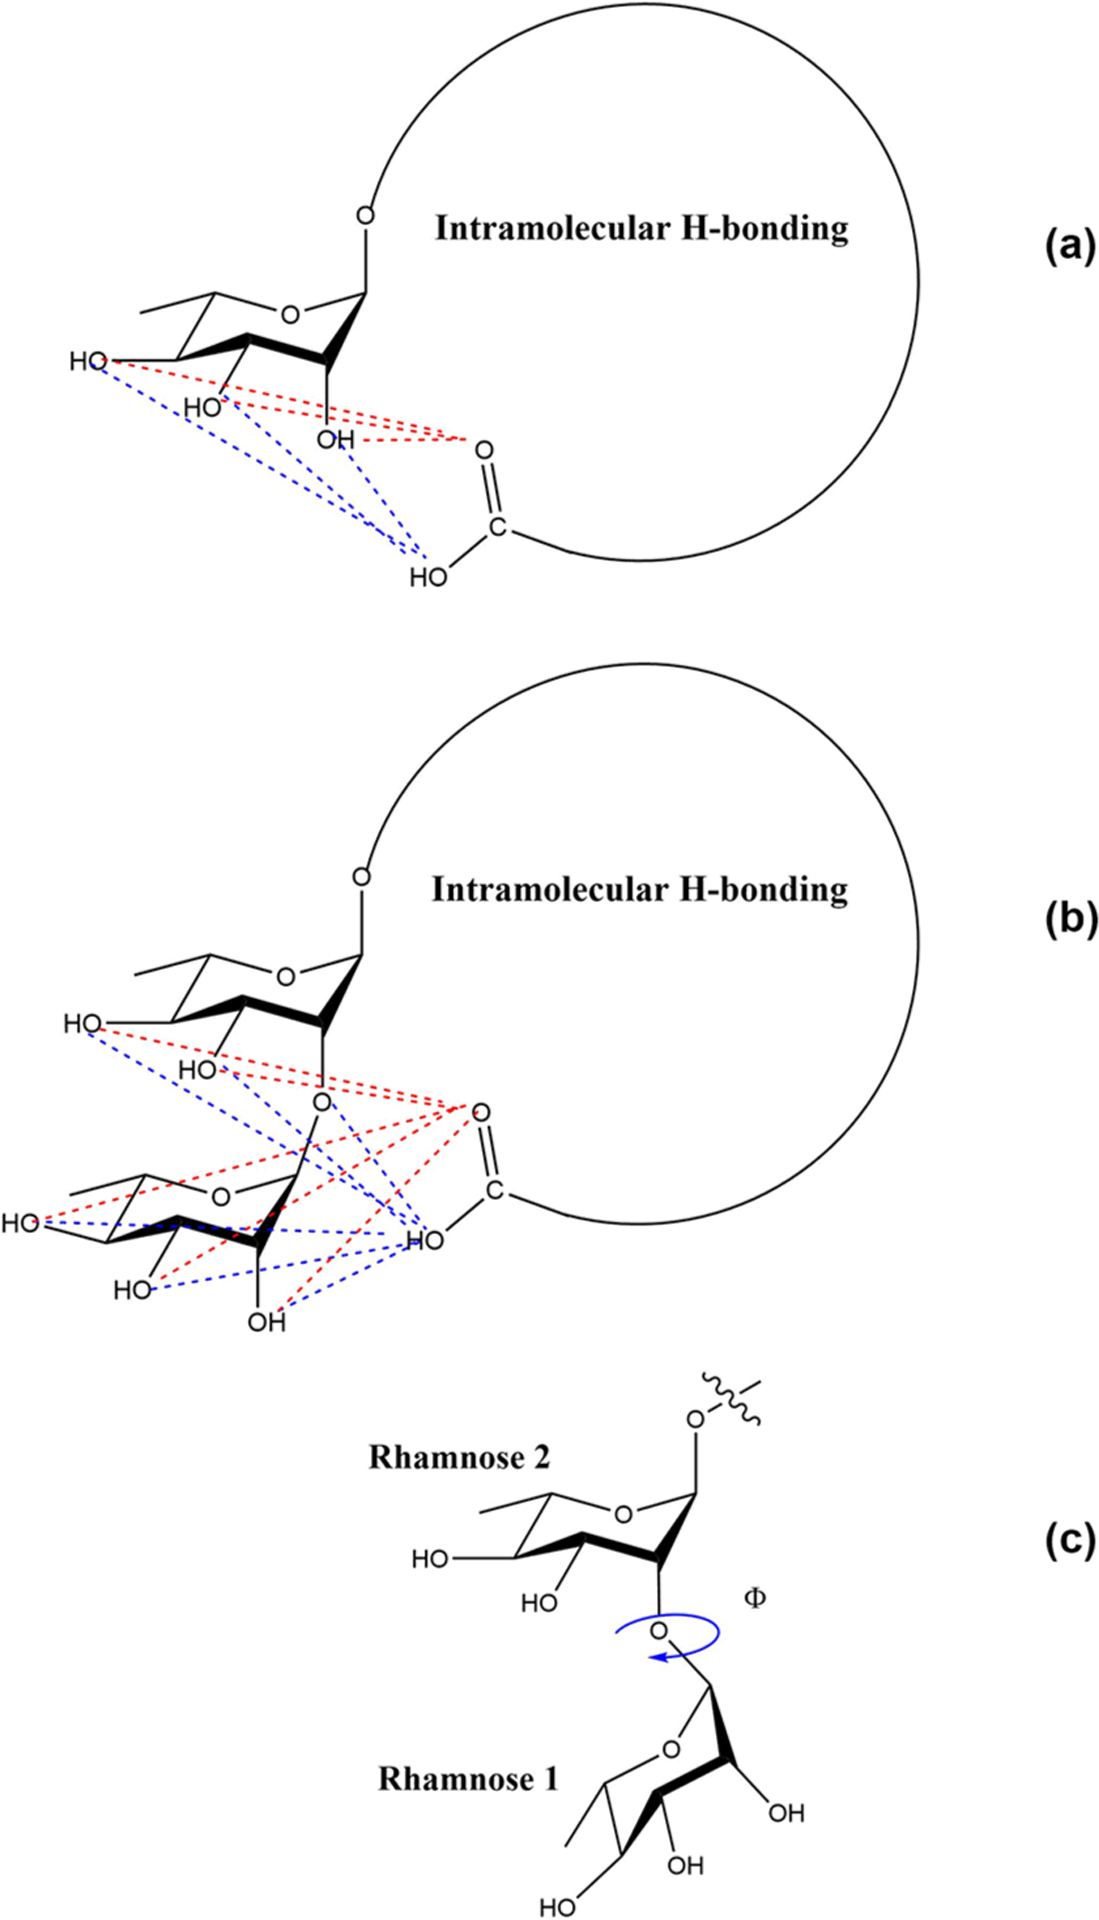
Cartoon representation of all possible intramolecular hydrogen-bonding interactions between carboxyl group and rhamnose group in mRL and dRL. Red and blue dotted lines depict the H-bonds of carbonyl oxygen and hydroxyl oxygen of carboxyl group, respectively. The figure also depicts the dihedral angle used to study the dRL rhamnose–rhamnose configuration.
Figure 11.
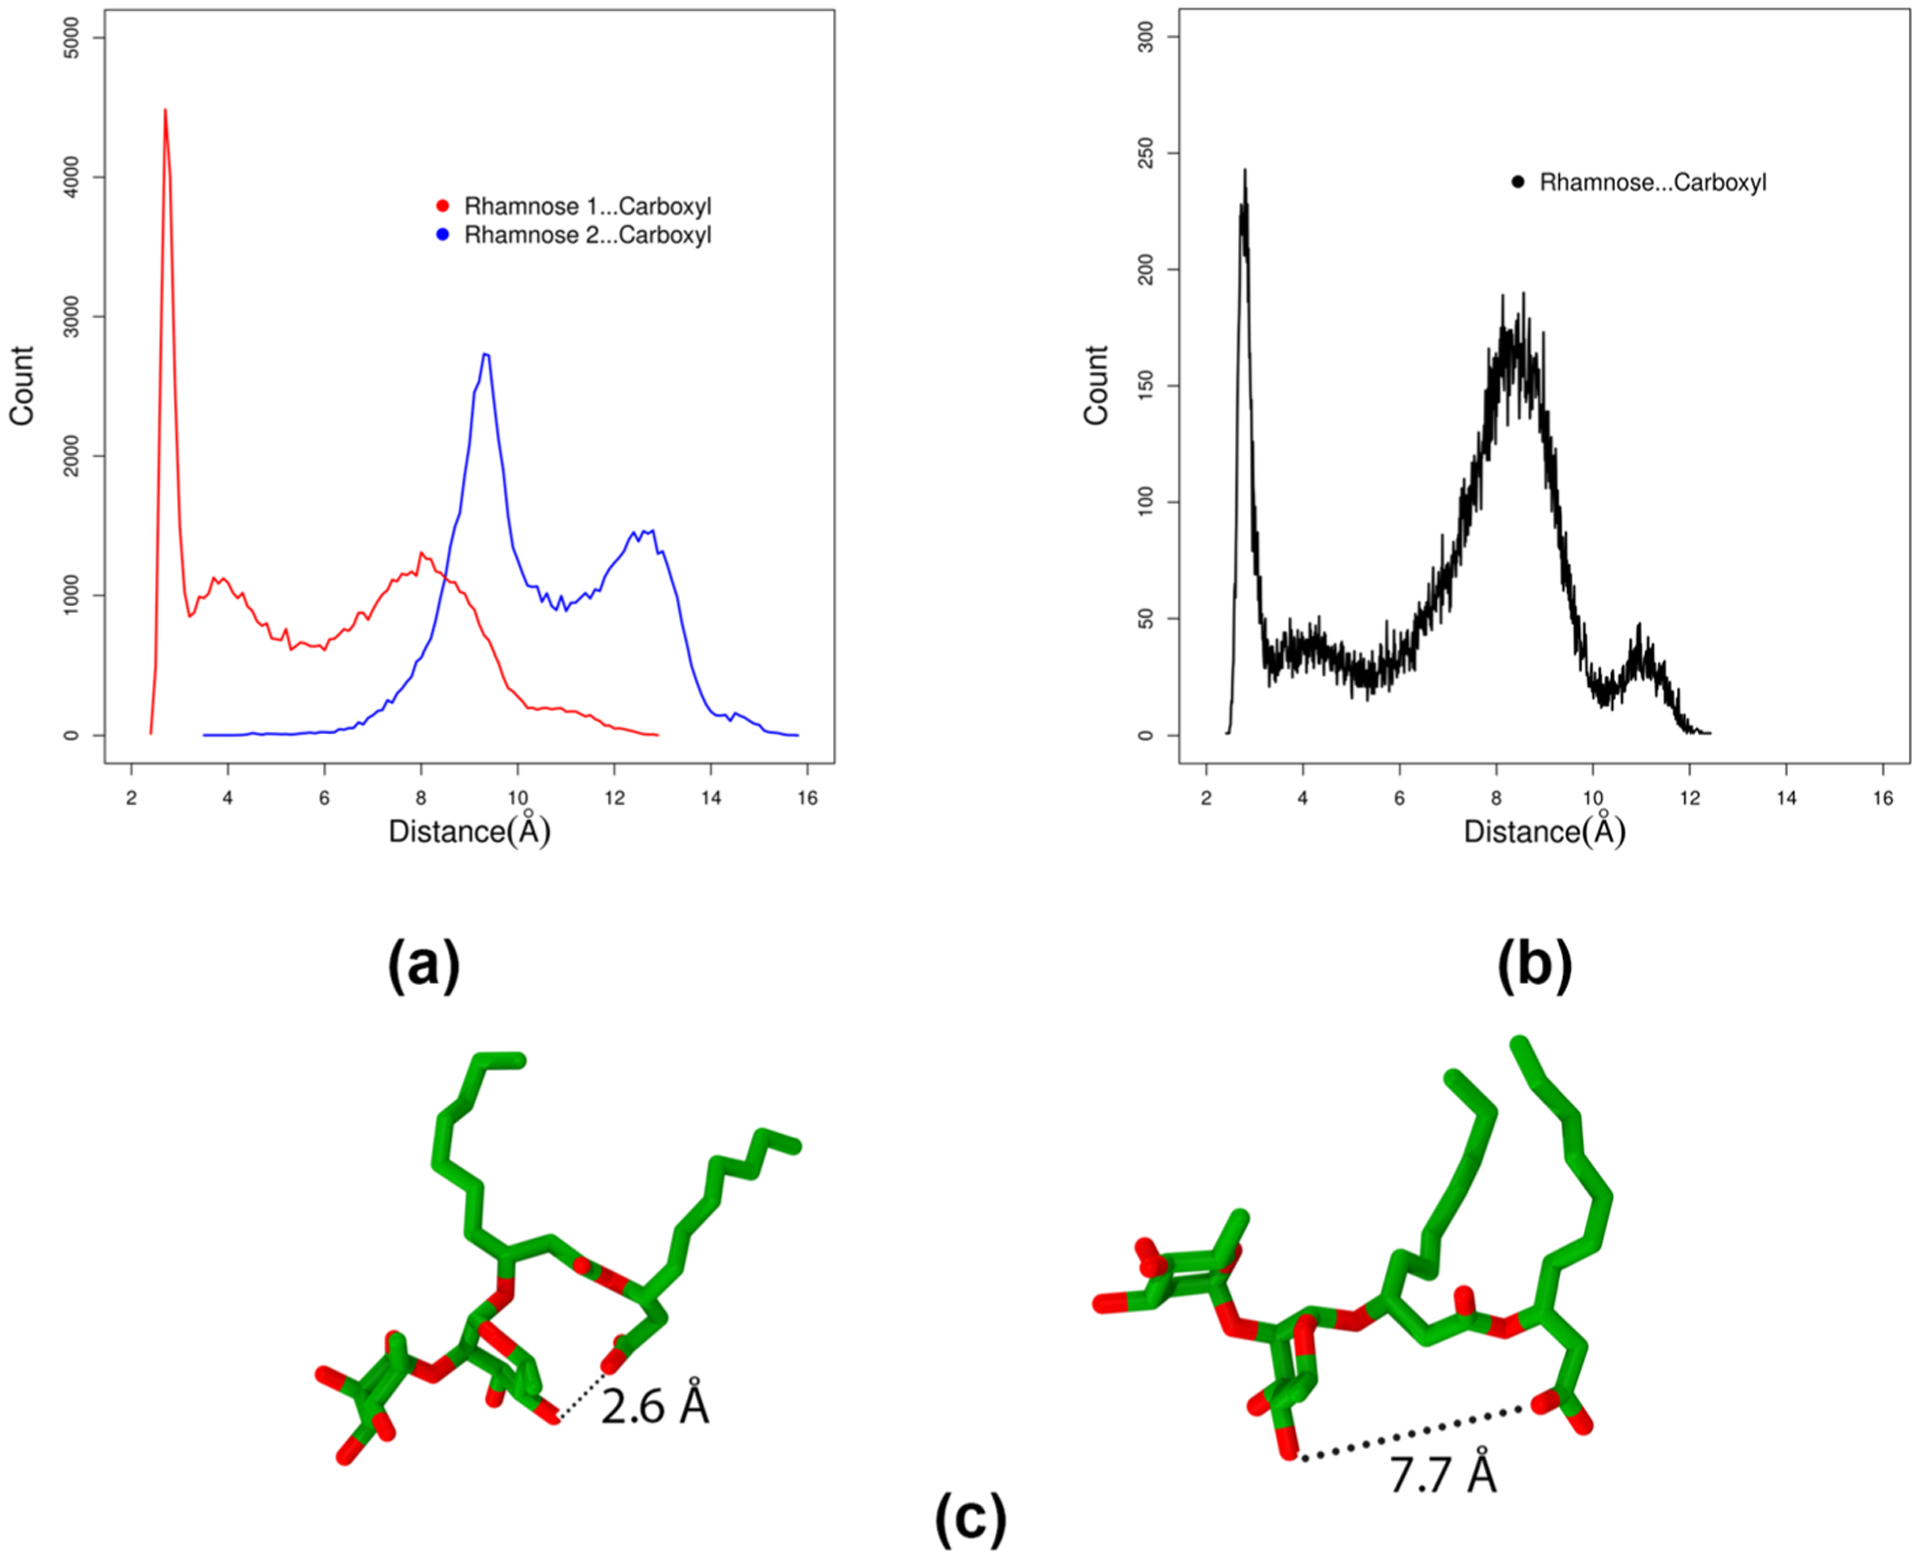
Comparison of headgroup conformations of mRL and dRL at the air–water interface. Representative structures of closed and open conformations of dRL are shown in (c).
The results of the above analysis led us to look at the conformations of two rhamnose rings in dRL. We studied the dihedral angle between the two rhamnose rings using rotation around the C–O bond connecting the two rings as depicted in Figure 10. This behavior is plotted in Figure 12. It is clear from the plot that the orientations of the two rhamnose rings are mostly populated around a dihedral value of ~80°. This could also be the dihedral angle between the two rhamnose groups corresponding to the intramolecularly hydrogen-bonded conformation of the headgroup shown in Figure 11a.
Figure 12.
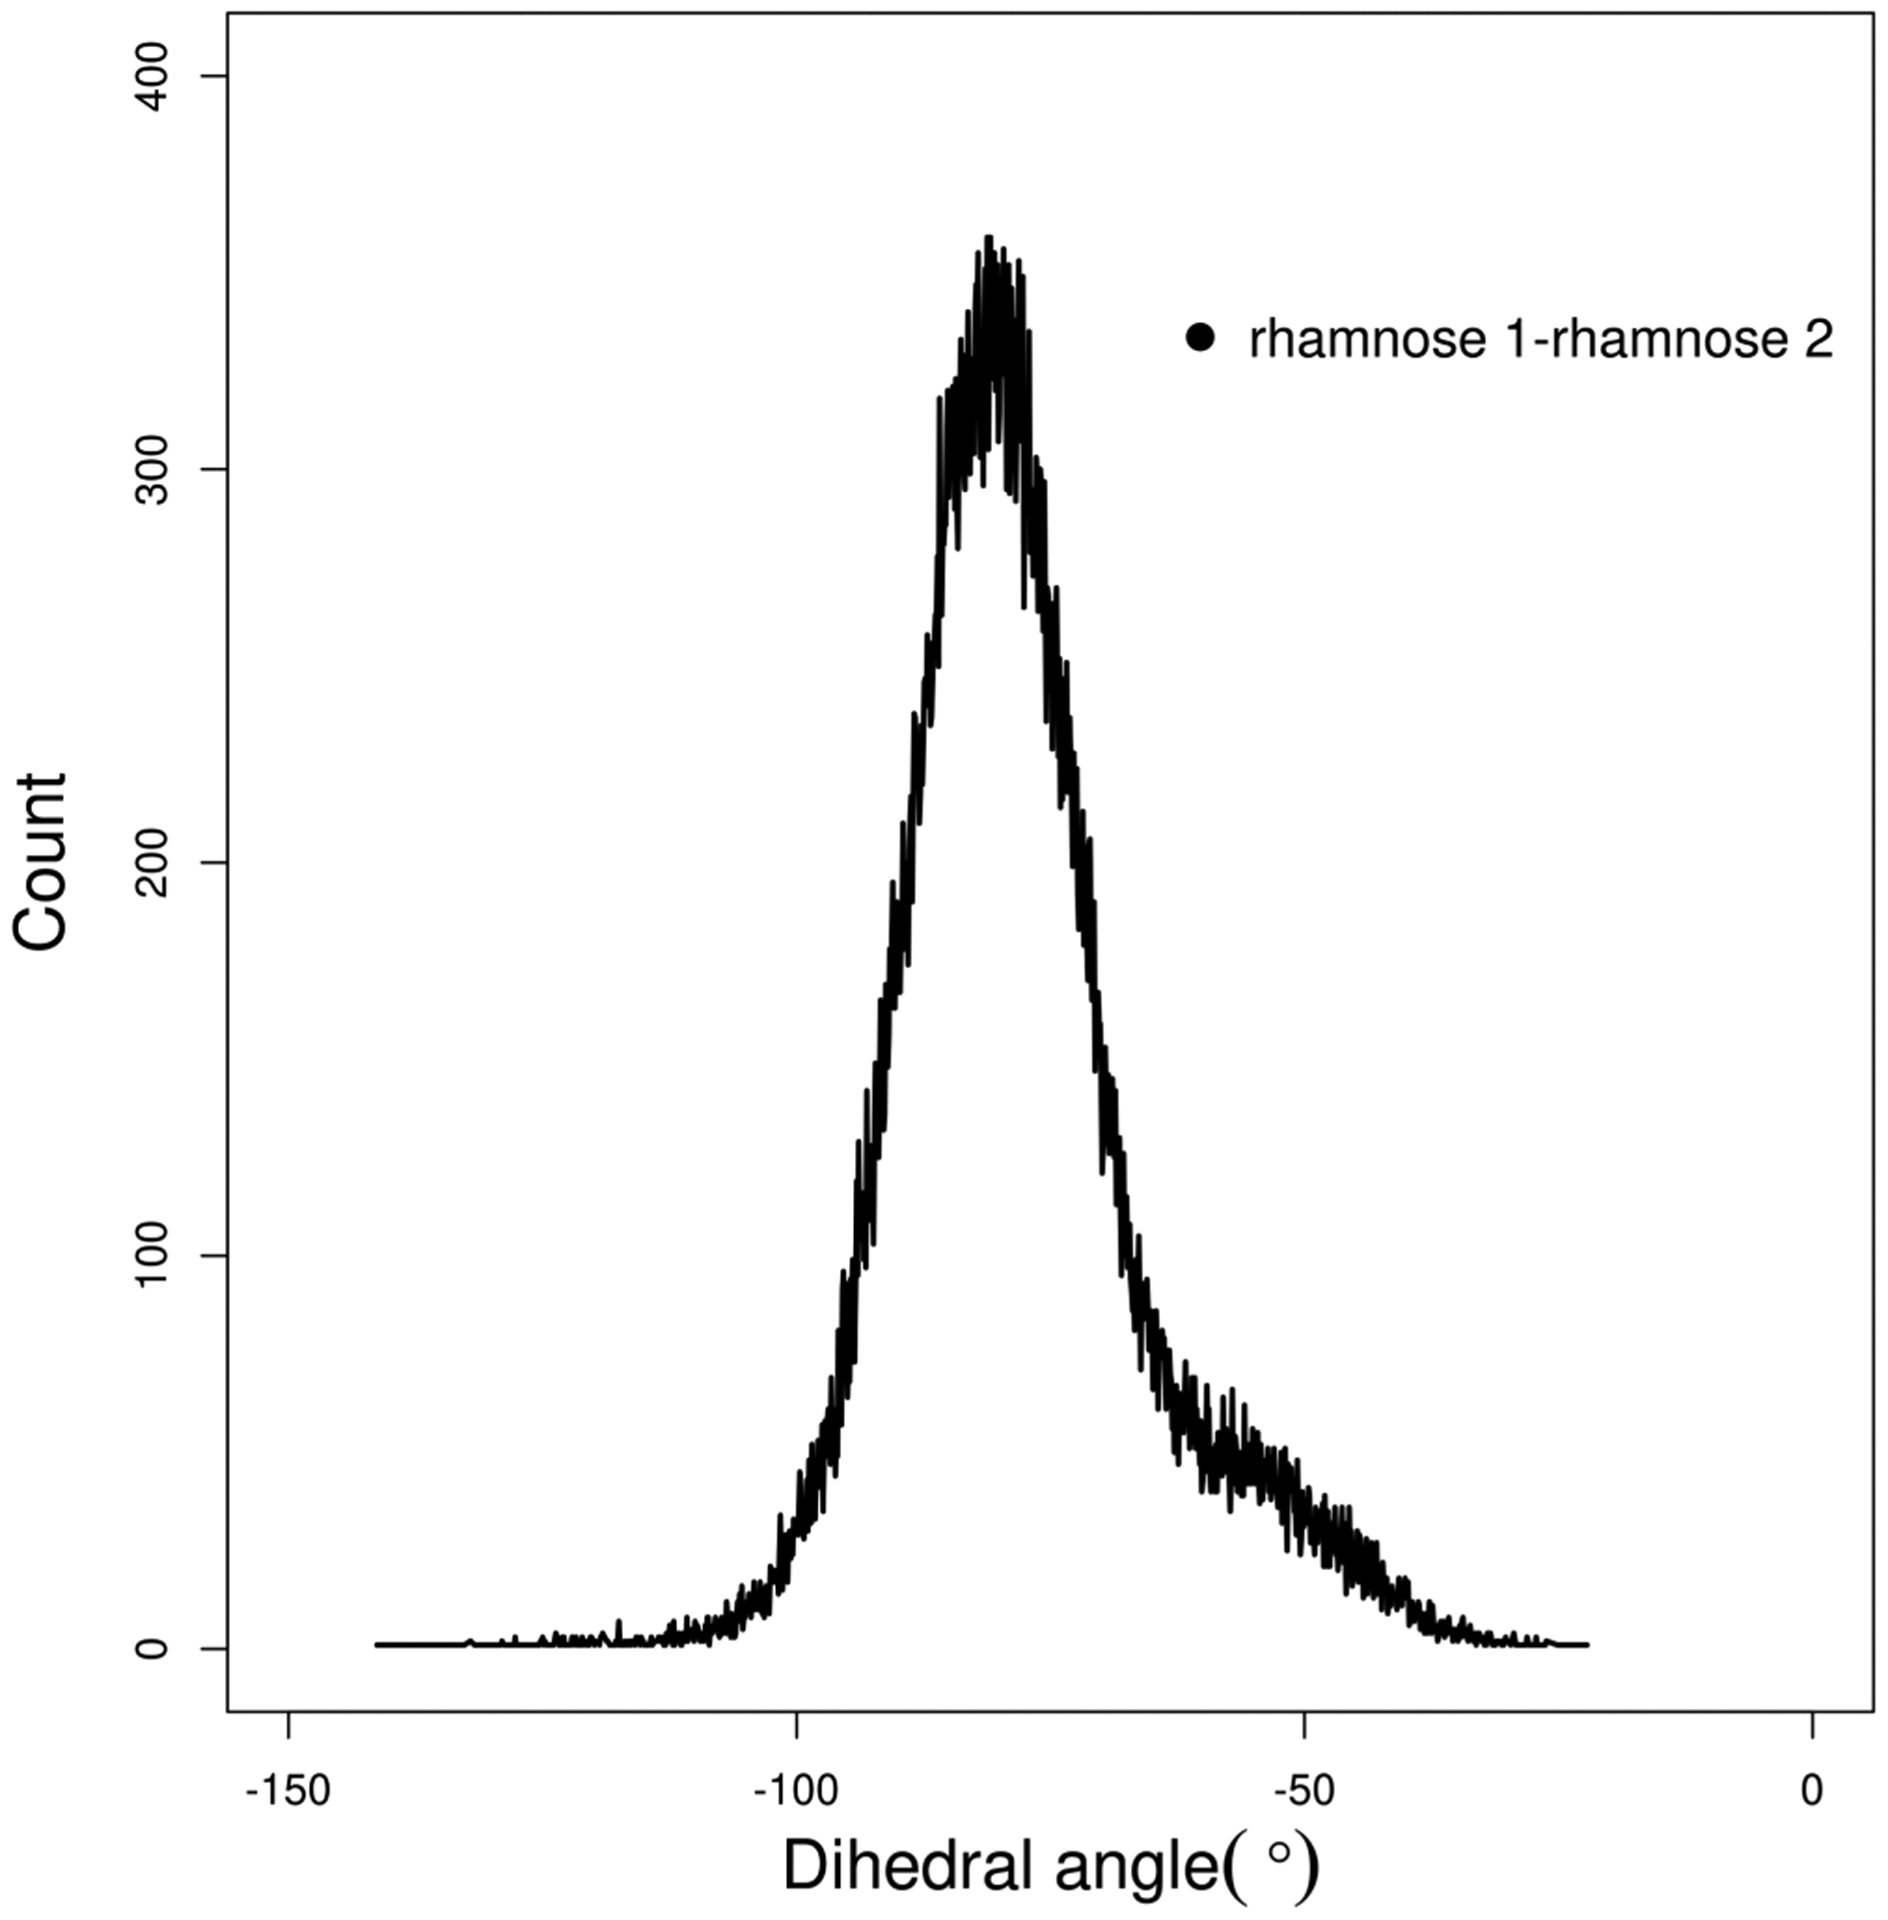
Distribution of rhamnose 1–rhamnose 2 dihedral angle obtained from dRL aggregation at the air–water interface.
To put things together, structural properties of dRL do show some changes from mRL due to the presence of the additional rhamnose group. We also studied how the aggregation properties of mRL and dRL change in bulk water.
4. AGGREGATION PROPERTIES OF DIRHAMNOLIPID IN WATER
Detailed structural analysis was performed on dRL aggregates in water. Hydrophilic and hydrophobic components of a surfactant play crucial roles in the formation and stability of micellar structures. When compared to mRL, there is an increased hydrophilic component in dRL in the form of a rhamnose group. The present study aims to understand the aggregation properties of dRL and compare it with our previous study of the aggregation of mRL. We have also extended this study by increasing the hydrophobic component of dRL in the form of longer alkyl chains and observed the effect of micelle formation and stability. In the following section, results of dRL will be presented and compared with mRL as well as two longer alkyl chain derivatives of dRL, namely dRL-C14-C14 and dRL-C18-C18.
The difficulties associated with identifying a micellar aggregate are well-known. The time scale for the formation of micellar and larger vesicle aggregates are of the order of seconds to minutes. Simulations cannot be run that long to predict the size and shape of the aggregates. We have used the simulated annealing technique to overcome this difficulty. Second, these aggregates are constantly evolving as a function of time; smaller aggregates come together to form larger cylindrical, wormlike micelles and even larger unilamellar vesicles. It should be agreed that the probability of finding micellar aggregates of sizes presented in this article cannot be ignored. At larger scale, these smaller micelles do exist along with larger aggregates which are formed by the merging of small micellar aggregates. From our previous knowledge on monorhamnolipid aggregates in water and at the interface, which had strong experimental evidence, we focus our attention on the small aggregates of dirhamnolipid in this study. Herein we used the same methodology to distinguish an aggregate as micelle or not. We also used simulated annealing followed by a simulation run for about 100 ns for all of the aggregates presented.
4.1. Aggregate Size.
The first property of note is the size of the aggregates produced for the different dirhamnolipid chain lengths. In Figure 13 we have plotted the radius of gyration for each of the aggregates observed in this study. It is clear from the figure that similarly sized aggregates in general have a radius of gyration proportional to the molecule’s chain length. More interestingly, dRL-C10-C10 showed a preference to form smaller aggregates across all simulations and concentration regions. This is evident from the plot in Figure 13a, which shows a lack of aggregates in the size region of N = 35−70 as denoted by the pink shaded region. While the longer alkyl chains produced aggregates in this region, dRL-C10-C10 aggregates tended to break apart in this region, producing multiple smaller aggregates as shown in Figure 13a. At only the highest concentration regime were larger aggregates produced. The aggregates composed of dRL-C14-C14 and dRL-C18-C18 were not subject to this restriction and tend to grow with the concentration. This is a purely due to the increase in the hydrophobic component of the surfactant.
Figure 13.
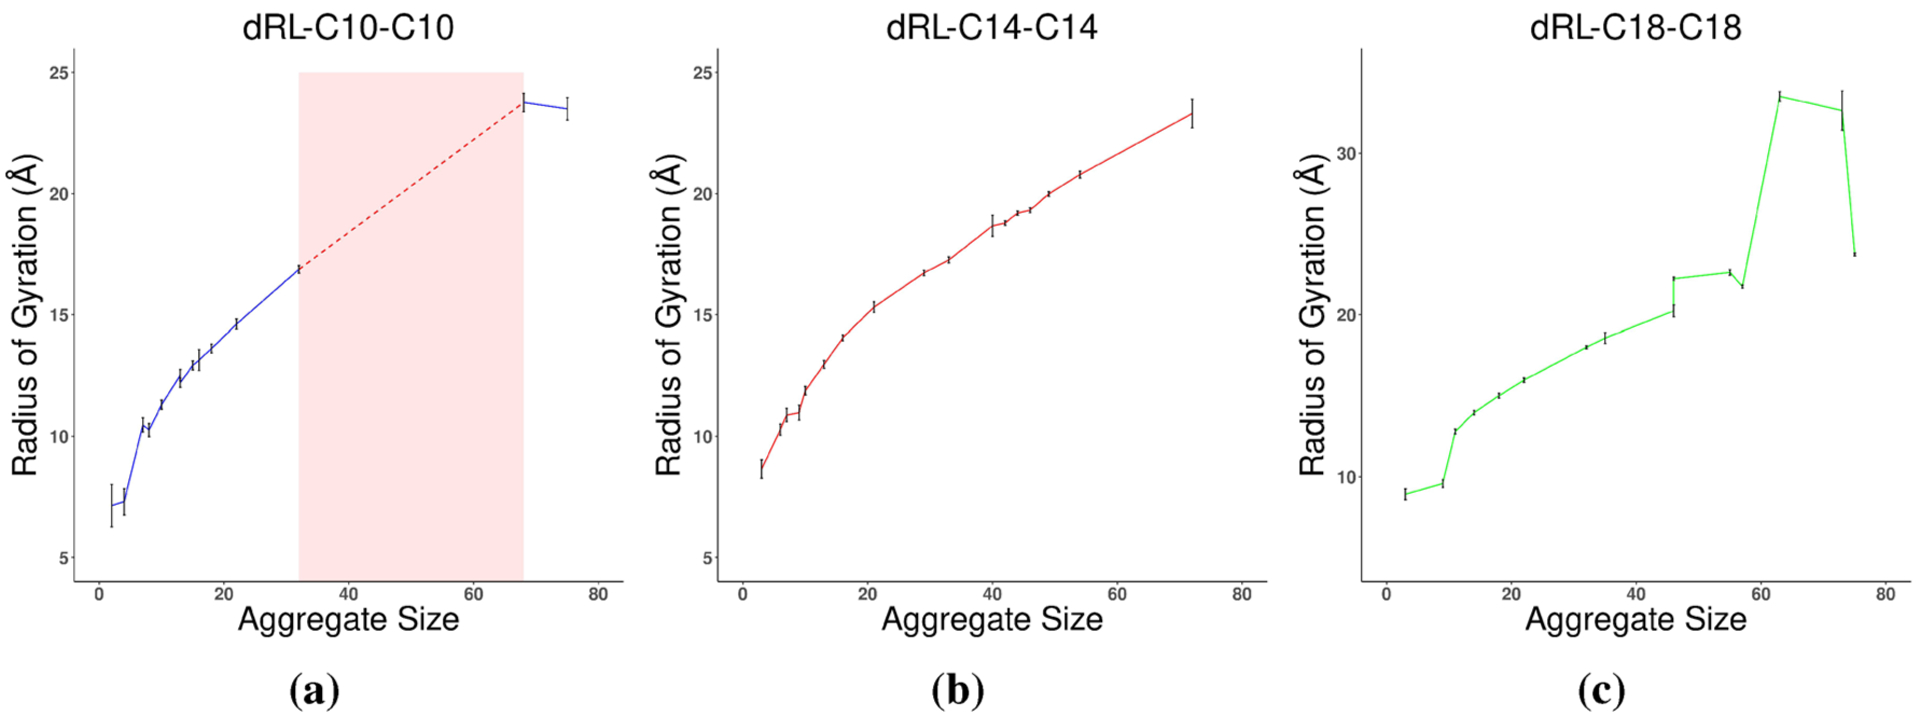
Magnitude of the radius of gyration as a function of aggregate size for (a) dRL-C10-C10, (b) dRL-C14-C14, and (c) dRL-C18-C18. Error bars drawn as the standard deviation for the trajectory data. The pink shaded region represents the lack of aggregation of dRL-C10-C10.
4.2. Aggregate Dynamics.
We can monitor the dynamics of individual aggregates over time with the following analysis. The eccentricity parameter (e) of an object is defined as
| (3) |
where Imin is the principal moment of inertia with the smallest magnitude and Iavg is the average of all three principal moments of inertia. The parameter e provides a measure of the anisometry of an aggregate, with an e of zero corresponding to a spherical object. Although in principle stable aggregates could take on any value of e, smaller aggregates will have eccentricities that vary considerably in time. Figure 14 presents the eccentricity values calculated for dRL and two longer alkyl chain derivatives. While the blue color corresponds to less fluctuation of an aggregate, the red color corresponds to high fluctuation. It is evident from the plot that smaller aggregates of dRL show high fluxionality as they take on a wider range of e values than larger aggregates’ values. Increase in the alkyl chains does not help in reducing the fluctuation of smaller aggregates but definitely produces medium aggregates with less fluxionality. Therefore, the main conclusion from this section is that increasing the hydrophobic component of dRL allows the formation of medium-sized aggregates with less fluxionality.
Figure 14.
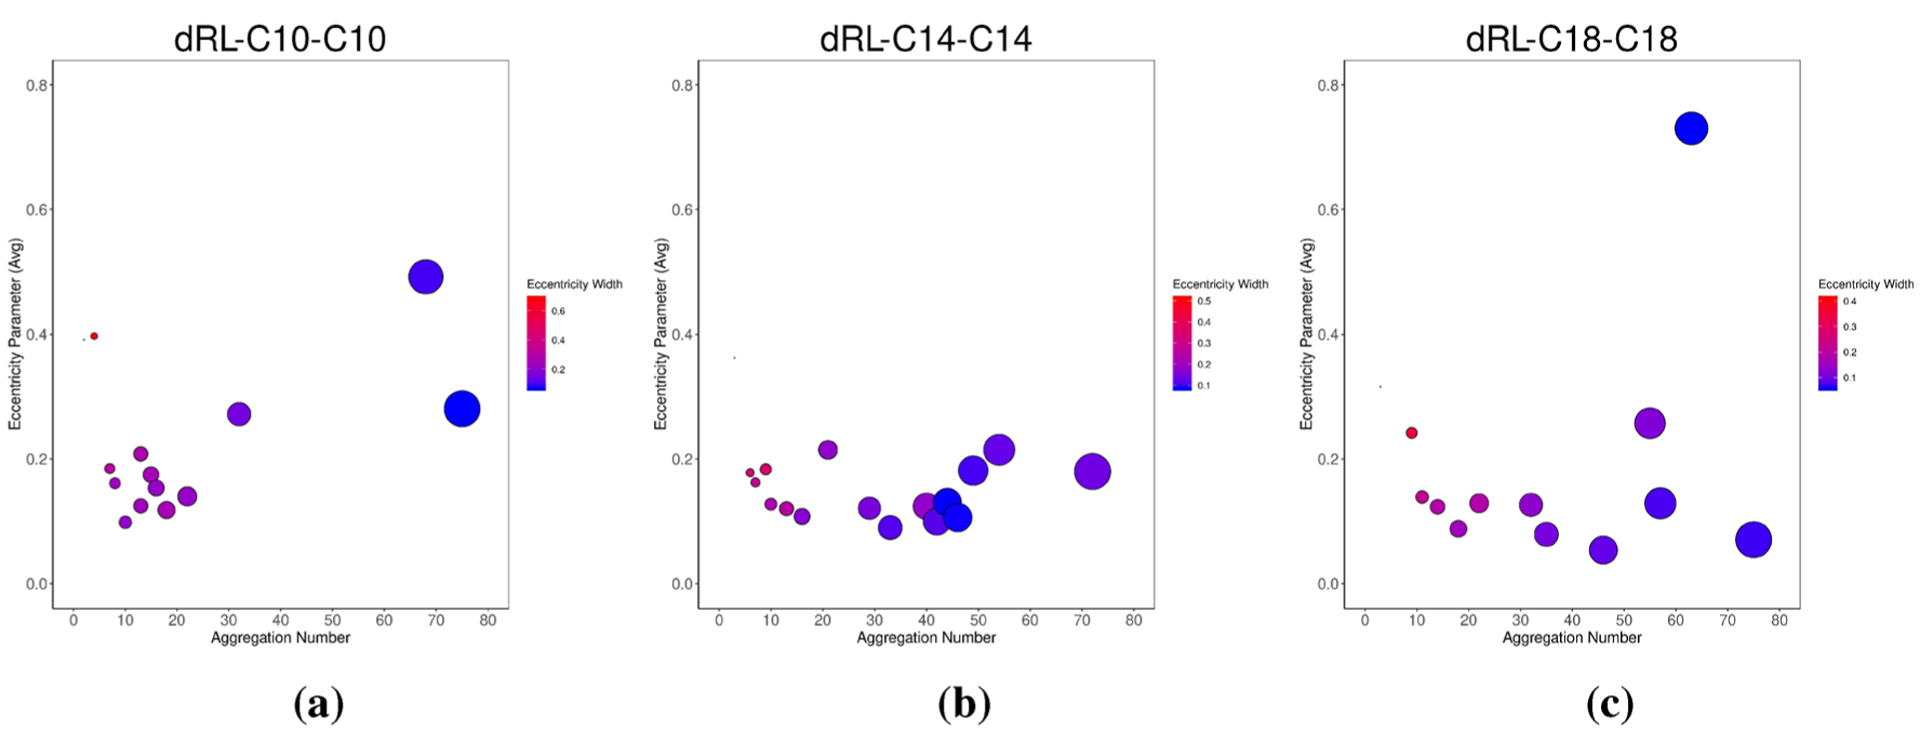
Eccentricity values for each aggregate over the length of the analysis trajectory.
4.3. Radial Distribution of Components.
The results of aggregate size and dynamics do not have the information about the classification of these aggregates as premicelle or micelle or larger structures. In this section we use radial density distribution of various components of surfactant to identity whether an aggregate is a true micelle or not. A proper micelle aggregate can separate and keep hydrophobic components shielded from unfavorable contacts with the bulk water while at the same time keeping the hydrophilic headgroup solvated. We have extensively utilized a radial density plot to visualize the three-dimensional composition of each aggregate. In this analysis an aggregate is a sphere, and individual components are binned as a function of distance from the center of mass. The result is a smoothed two-dimensional histogram which allows for the visualization of components from the center of mass. It should be pointed out here that we started our simulations with a starting structure, where rhamnolipids were randomly distributed in water. As the simulation progressed, we observed that smaller aggregates were formed first which then evolved into larger aggregates with time. This section simply focuses on what aggregate size is better described as micelle. There is always the possibility that the aggregates discussed here will either break down into monomers or larger aggregates.
Figure 15 presents the radial density plot of three representative aggregates of dRL, with aggregation numbers N7, N15, and N22 along with a picture of the aggregate. It is clear from the plot that N7 is not a micelle as there is water density overlapping the hydrophobic components. However, a larger aggregate N14 shows a slightly better separation of water from the hydrophobic core. There is at least ~5 Å distance from center of mass of the aggregate that is devoid of water density. The hydrophobic and hydrophilic components overlap to a larger extent, and hence it does not make a proper micelle. The situation is much better in the case of the N22 aggregate. The shape is also nearly spherical. There is a hydrophobic core of about ~8 Å distance from the center of the aggregate, a better separation between hydrophobic and hydrophilic components. Therefore, it could be said that dRL aggregates into micelles in water near the aggregation number N22. Looking at the aggregates that are above and below N22, they are merely the interaction of monomers, and there is no clear separation of hydrophilic and hydrophobic components. This observation clearly indicates that there is an imbalance between the hydrophilic and hydrophobic components of dRL to form micelles larger than N22. The presence of an extra rhamnose group in dRL is the reason for this aggregation behavior. So we engineered the balance between hydrophobic and hydrophilic components in dRL by increasing the alkyl chain length from C10-C10 to C14-C14 and C18-C18. It should be noted that in our previous study we have shown that nonionic mRL prefers to form aggregates of approximate size N < 40.11,27
Figure 15.
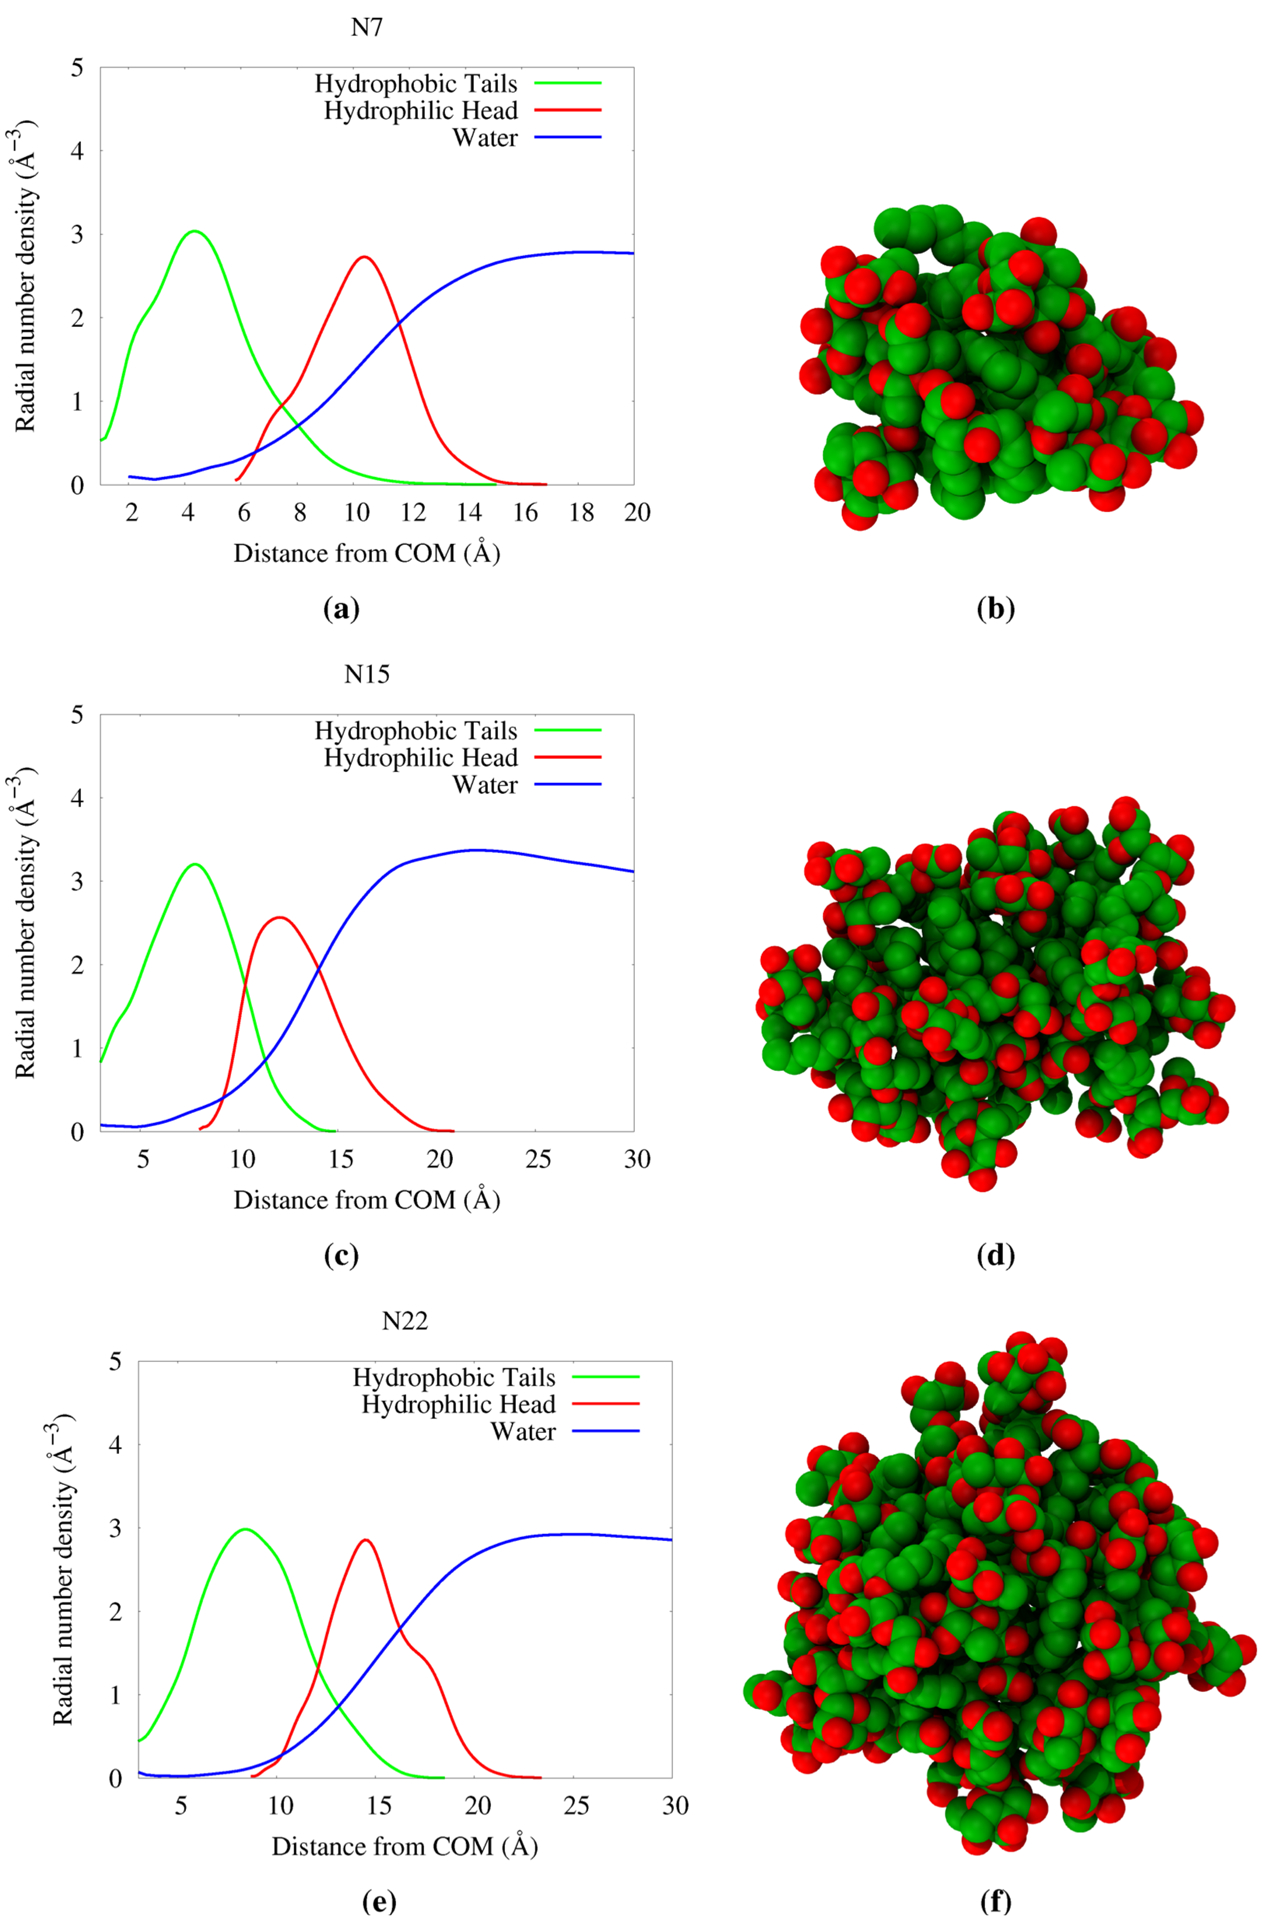
Radial distribution of components from various sized aggregates for dRL-C10-C10. The corresponding snapshot of the aggregate is provided on the right side of each plot.
The effect of increasing the hydrophobic density on the aggregation property was studied by looking at aggregates of similar size for dRL-C10-C10, dRL-C14-C14, and dRL-C18-C18. We have plotted the radial density of components for three large aggregates for all chain lengths in Figure 16. It can be seen from the figure that N32(dRL-C10-C10) does not clearly separate the hydrophobic and hydrophilic components, and the change in the water density near the surface of the aggregate is not sharp. The image of the aggregate also looks cylindrical. An increase in the alkyl chain length does seem to work well as seen from N33(dRL-C14-C14) and N32(dRLC18-C18) aggregate plots and images. There is a clear separation of hydrophobic and hydrophilic density, and the hydrophobic core is devoid of water for about ~10 Å from the center. The snapshot shows that the aggregate is more spherical. In fact, the C18–C18 aggregate is better than C14–C14 in terms of the radial density plots. The hydrophobic and hydrophilic distributions are sharp and clearly separated from each other. Therefore, we can conclude that increasing the hydrophobic density of dRL re-forms micellar aggregates near N30 which were absent. Note also that the radial distribution plot for dRL-C10-C10 N32 is nonideal since this structure has become elongated along a principal axis.
Figure 16.
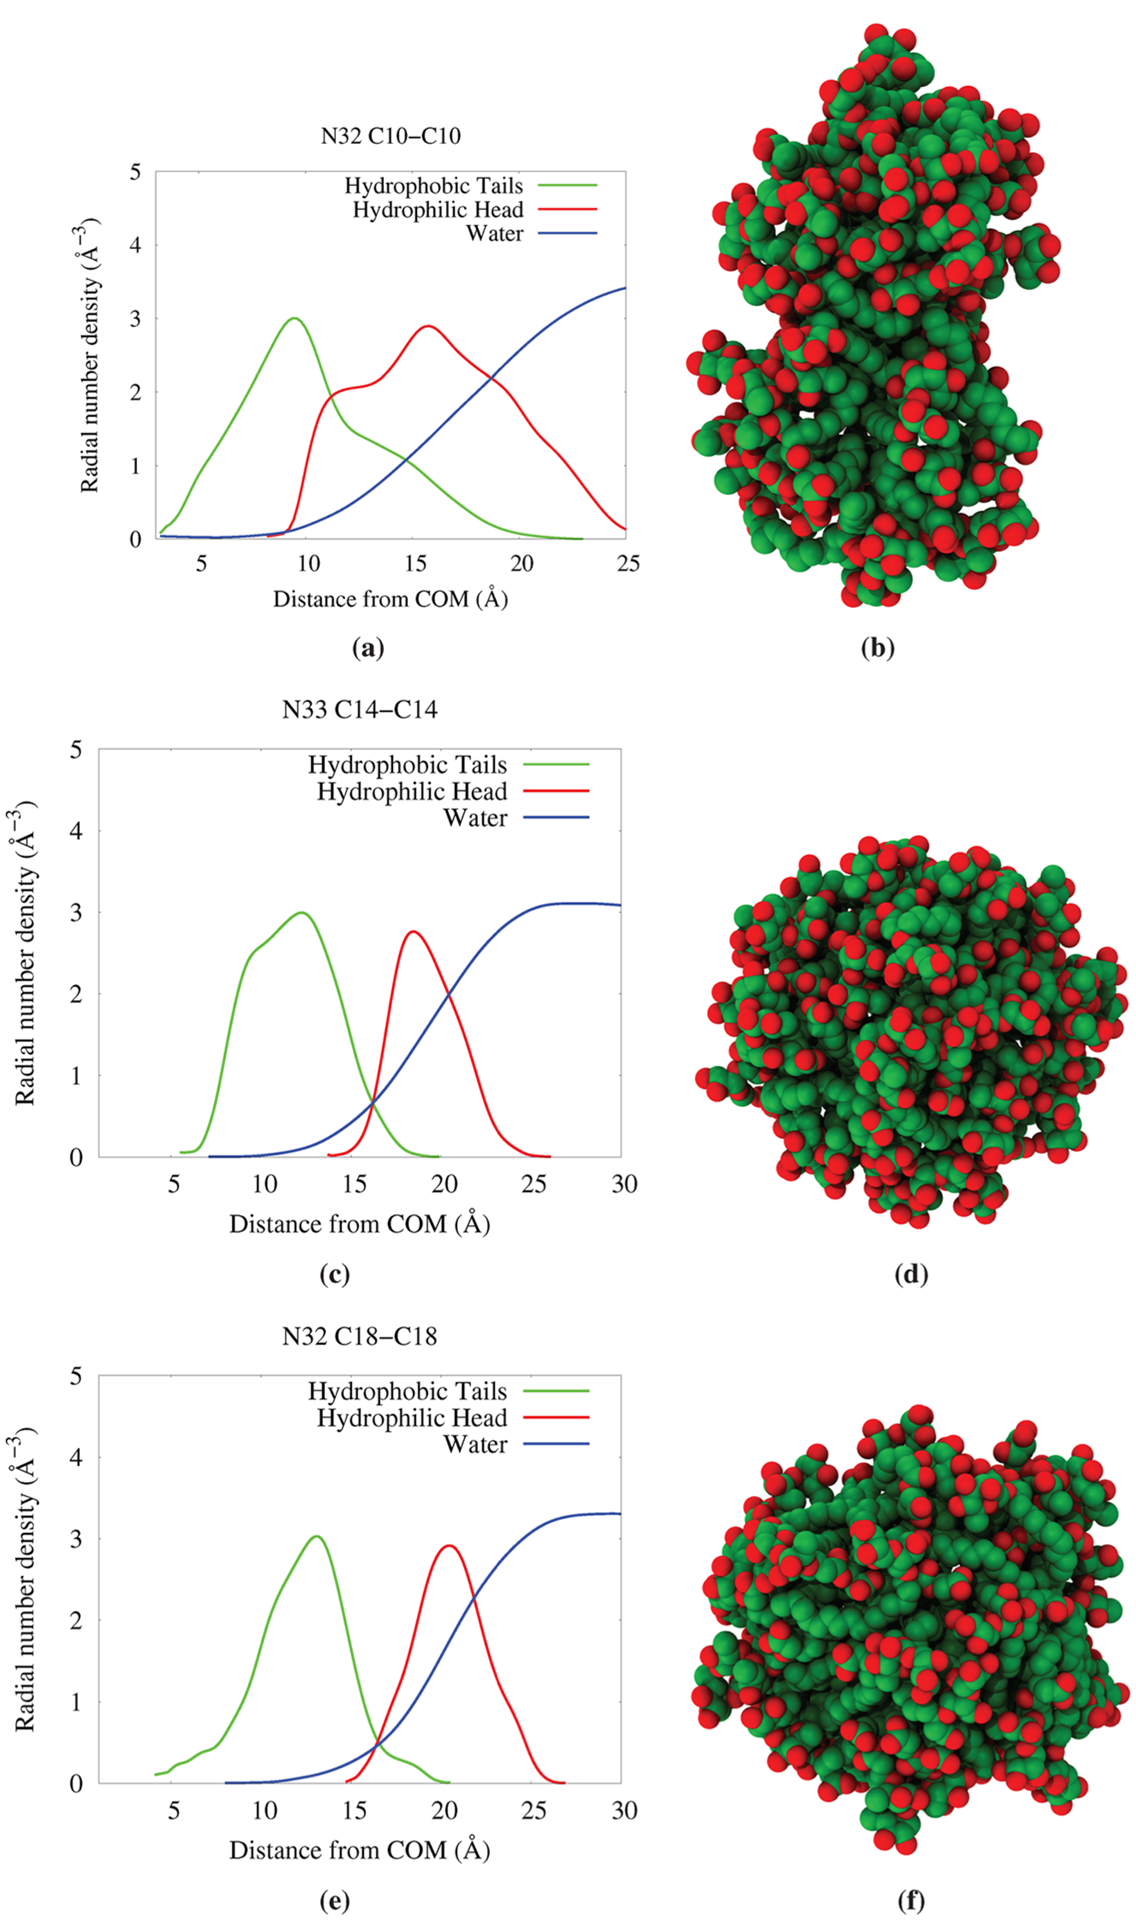
Radial density plots for aggregates with similar aggregation numbers but increasing chain lengths.
4.4. Micelle Shape.
The radius of gyration tensor contains useful information regarding the shape of the observed aggregates as well. We have used the classification scheme presented by Daful et al.28 in our previous work and briefly describe it here. By constructing the radius of gyration tensor for each aggregate, upon diagonalization, it will yield three principal moments R1,2,3 which are then ordered such that R1 > R2 > R3. The ratios of these eigenvalues will uniquely classify the shape of the aggregate as a sphere, disk, or cylinder. In the case of this study, all of the different dirhamnolipid molecules undergo a change in aggregation shape upon increase in concentration. This is presented in Table 2 and shows the preference to form spherical aggregates at small aggregation number for all three molecules. dRL-C10-C10 in particular tends to form smaller spherical aggregates before growing to larger cylinders which tend to fracture. Only at very high concentrations are these aggregates found in larger cylindrical micelles. Both dRL-C14-C14 and dRL-C18-C18 are strictly spherical before undergoing a change to a cylindrical aggregate at a size of ~55 monomers.
Table 2.
Shape Data for Isolated Aggregates Averaged over a Trajectory Studied in This Work
| dRL-C10-C10 monomers | shape | dRL-C14-C14 monomers | shape | dRL-C18-C18 monomers | shape |
|---|---|---|---|---|---|
| 10 | sphere | 10 | sphere | 18 | sphere |
| 13 | sphere | 13 | sphere | 22 | sphere |
| 15 | sphere | 16 | sphere | 32 | sphere |
| 16 | sphere | 21 | sphere | 35 | sphere |
| 18 | cylinder | 29 | sphere | 46 | sphere |
| 22 | cylinder | 33 | sphere | 55 | sphere/cylinder |
| 32 | cylinder | 40 | sphere | 57 | sphere/cylinder |
| 68 | cylinder | 42 | sphere | 63 | cylindera |
| 75 | cylinder | 44 | sphere | 73 | cylindera |
| 46 | sphere | 75 | sphere | ||
| 49 | sphere | ||||
| 54 | cylinder | ||||
| 72 | cylinder |
Wormlike aggregate.
5. CONCLUSIONS
Detailed molecular level knowledge of surfactant behavior at the interface and in solution is critical toward the design of better surfactants. Rhamnolipids and their complex structure offer a rich avenue for investigation, and molecular dynamics simulations enable us to probe structural information. From this detailed analysis we have offered insight into the aggregation properties of a less investigated dirhamnolipid and provided possible comparisons with aggregation properties of a well-studied monorhamnolipid.
Dirhamnolipid surfactants aggregate at the interface similar to monorhamnolipid aggregation, with a slightly higher surface area per molecule value because of its higher molecular volume. The two alkyl chains of dirhamnolipid show different conformational preferences. It is observed that one of the chains is more elongated than the other. We do not observe this behavior in monorhamnolipid, and it could be attributed to the presence of a second rhamnose ring. Further analysis reveals no significant difference in the tilt angle of the alkyl chain with respect to the surface. Mass density profiles of various hydrophilic and hydrophobic components of the dirhamnolipid show very little change from monorhamnolipid. The intramolecular hydrogen-bonding distance was measured to predict the headgroup conformations of dirhamnolipid. These results show that the presence of a second rhamnose ring has significant change in the major conformations. While there are two competing headgroup conformations in monorhamnolipid, there is only one dominating headgroup conformation in dirhamnolipid. The second rhamnose group which is farther from the terminal carboxyl group does not have the possibility to form intramolecular hydrogen bonding with carboxyl group. The analysis also shows that the two rhamnose rings are controlled by a dihedral angle of 80° measured along the rotation of the C–O bond connecting them. These structural properties of dirhamnolipid at the interface are not very different from monorhamnolipid.
Interestingly the aggregation of dirhamnolipid in water is significantly different from monorhamnolipid. In comparison to the monorhamnolipid-C10-C10 which was found to prefer to form micellar aggregates of size N ≤ 40, the dirhamnolipid-C10-C10 forms micellar aggregates of size N ≤ 22. Although we observed aggregates of size smaller and larger than N22, they are not micelles as evidenced by the radial density plots of the various components. This is to be expected as the larger headgroup requires greater solvation than the monorhamnolipid form and should drive the mean aggregation number down. Increasing the alkyl chains mitigates this burden and allows for the formation of aggregates across a larger variety of sizes. It is clear from the results that increasing the hydrophobic component in the form of dirhamnolipid-C14-C14 and dirhamnolipid-C18-C18 shows micellar aggregates larger than N22. The radial density plots show clear separation of hydrophobic and hydrophilic components and the hydrophobic core devoid of any water molecules. We could observe large aggregates that are spherical and cylindrical in shape. This study shows that dirhamnolipid is lacking the hydrophobic component that creates a balance between hydrophilic and hydrophobic density to form micellar aggregates. We have also shown that engineering the hydrophobic component of dirhamnolipid could make it an effective surfactant in bulk water.
To conclude, molecular dynamics is a direct approach to observing the aggregation structures formed by a surfactant in the presence of water. Because of the presence of both the monorhamnolipid and dirhamnolipid in nature, it is important to have fundamental understanding of structure and aggregation properties of both of these molecules. The presence of one rhamnose group and shorter alkyl chain is adequate for monorhamnolipid to form spherical and cylindrical micellar aggregate in water. A second rhamnose group in dirhamnolipid creates an imbalance between hydrophilic and hydrophobic components, resulting in the limitation to form micellar aggregates in water. Elongation of the alkyl chains in dirhamnolipid recreates the balance between hydrophobic and hydrophilic groups, and hence dirhamnolipid forms spherical and cyclindrical micellar aggregates in water. These structural differences in mono- and dirhamnolipid have no significant effect on the aggregation at the air–water interface.
Figure 2.
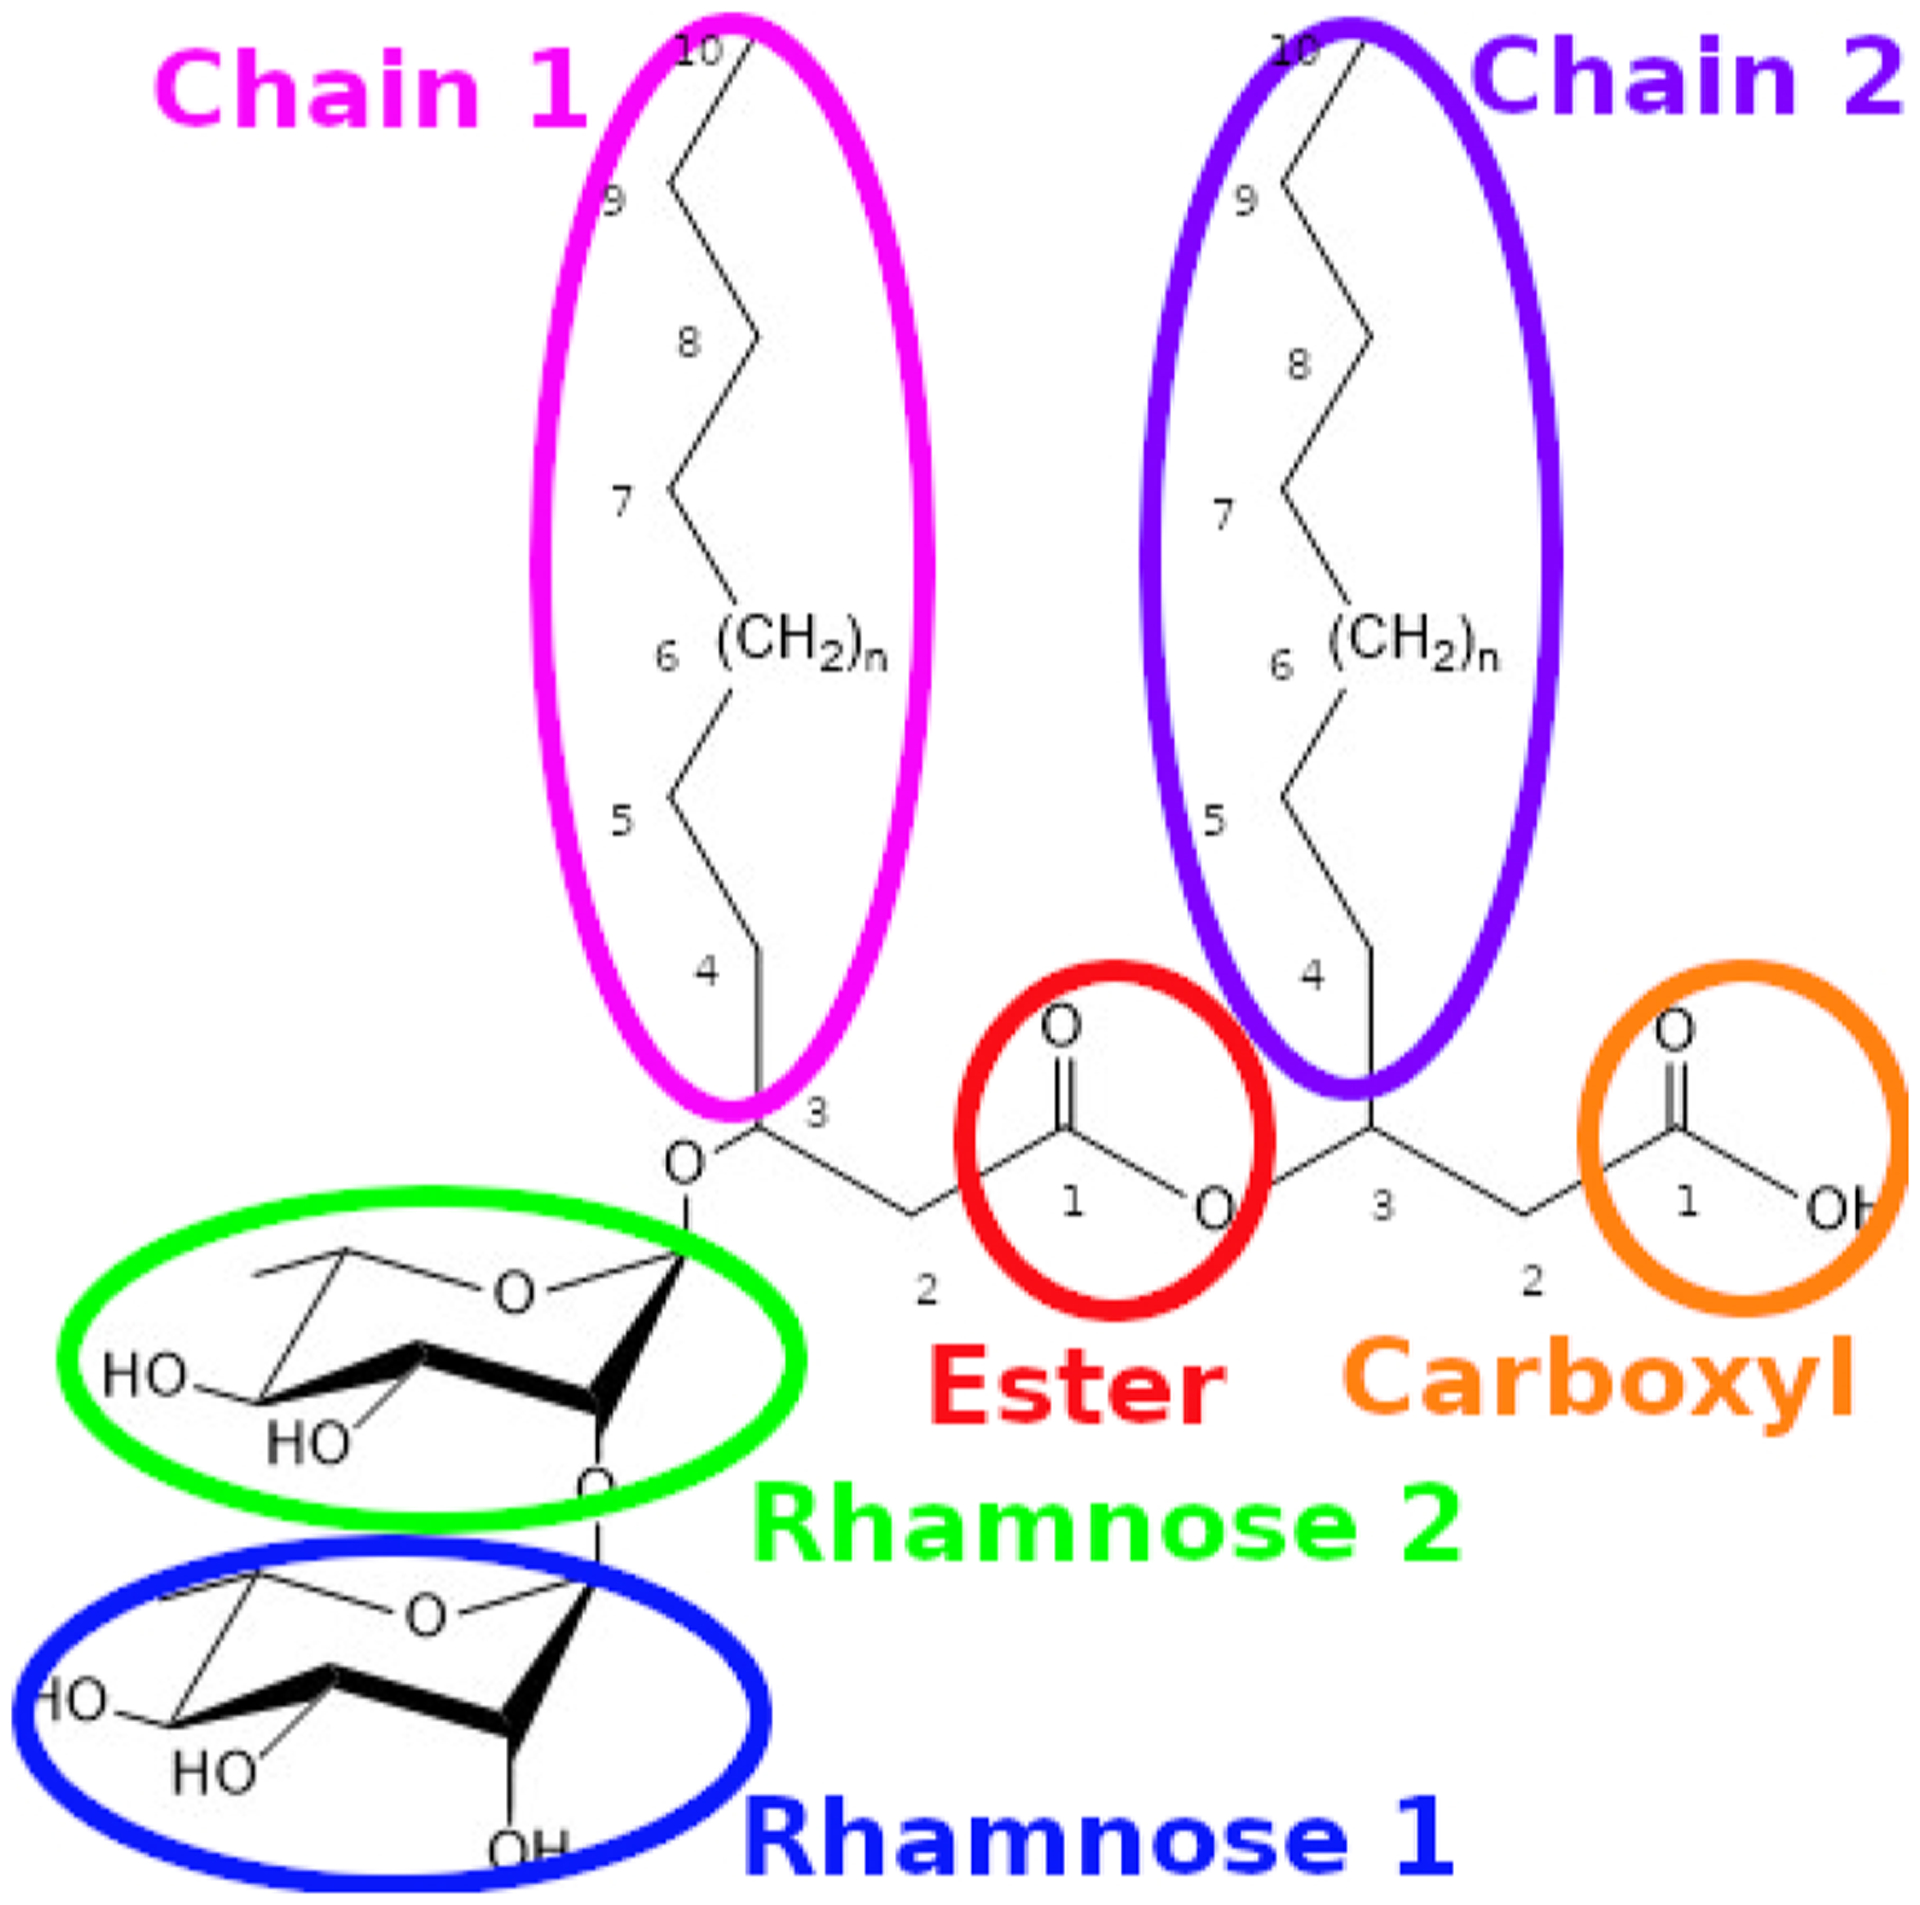
Structure of the dirhamnolipid molecules studied in this work. The molecules are the same but differ in chain length such that n = 1 for dRL-C10-C10, n = 5 for dRL-C14-C14, and n = 9 for dRLC18-C18. Different components are circled as the shorthand is used to refer to individual components of the surfactant in subsequent sections.
ACKNOWLEDGMENTS
All computer simulations were performed at the University of Arizona High Performance Computing Center on a SGI Altix ICE 8400 supercomputer and a Lenovo NeXtScale nx360 M5 supercomputer. The authors gratefully acknowledge support of this research through a grant award from the National Science Foundation (CHE-1339597) jointly funded by the EPA.
Footnotes
Complete contact information is available at: https://pubs.acs.org/10.1021/acs.jpcb.9b08800
The authors declare no competing financial interest.
REFERENCES
- (1).Liwarska-Bizukojc E; Bizukojc M Effect of selected anionic surfactants on activated sludge flocs. Enzyme Microb. Technol 2006, 39, 660–668. [Google Scholar]
- (2).Ambity PS; Jisha MS Biodegradation of anionic surfactant, sodium dodecyl sulphate by pseudomonas aeruginosa MTCC 10311.J. Environ. Biol 2012, 33, 717–20. [PubMed] [Google Scholar]
- (3).Arima K; Kakinuma A; Tamura G Surfactin, a crystalline peptidelipid surfactant produced by bacillus subtilis: Isolation, characterization and its inhibition of fibrin clot formation. Biochem. Biophys. Res. Commun 1968, 31, 488–494. [DOI] [PubMed] [Google Scholar]
- (4).GVR Inc. Biosurfactants market by product (Market Research Report Code: GVR20); https://www.grandviewresearch.com/industry-analysis/biosurfactants-industry.
- (5).Sekhon Randhawa KK; Rahman PKSM Rhamnolipid biosurfactants- past, present, and future scenario of global market. Front. Microbiol 2014, 5, 454. [DOI] [PMC free article] [PubMed] [Google Scholar]
- (6).Aranda FJ; Espuny MJ; Marqués A; Teruel JA; Manresa A; Ortiz A Thermodynamics of the interaction of a dirhamnolipid biosurfactant secreted by pseudomonas aeruginosa with phospholipid membranes. Langmuir 2007, 23, 2700–2705. [DOI] [PubMed] [Google Scholar]
- (7).Vanommeslaeghe K; Hatcher E; Acharya C; Kundu S; Zhong S; Shim J; Darian E; Guvench O; Lopes P; Vorobyov I Jr.; Mackerell AD CHARMM general force field: A force field for drug-like molecules compatible with the CHARMM all-atom additive biological force field. J. Comput. Chem 2009, 31, 671–690. [DOI] [PMC free article] [PubMed] [Google Scholar]
- (8).Brooks BR; Brooks CL; Mackerell AD; Nilsson L; Petrella RJ; Roux B; Won Y; Archontis G; Bartels C; Boresch S; et al. CHARMM: The biomolecular simulation program. J. Comput. Chem 2009, 30, 1545–1614. [DOI] [PMC free article] [PubMed] [Google Scholar]
- (9).Munusamy E; Luft CM; Pemberton JE; Schwartz SD Structural properties of nonionic monorhamnolipid aggregates in water studied by classical molecular dynamics simulations. J. Phys. Chem. B 2017, 121, 5781–5793. [DOI] [PMC free article] [PubMed] [Google Scholar]
- (10).Eismin RJ; Munusamy E; Kegel LL; Hogan DE; Maier RM; Schwartz SD; Pemberton JE Evolution of aggregate structure in solutions of anionic monorhamnolipids: Experimental and computational results. Langmuir 2017, 33, 7412–7424. [DOI] [PMC free article] [PubMed] [Google Scholar]
- (11).Munusamy E; Luft CM; Pemberton JE; Schwartz SD Unraveling the differential aggregation of anionic and nonionic monorhamnolipids at air-water and oil-water interfaces: A classical molecular dynamics simulation study. J. Phys. Chem. B 2018, 122, 6403–6416. [DOI] [PMC free article] [PubMed] [Google Scholar]
- (12).Martínez L; Andrade R; Birgin EG; Martínez JM PACKMOL: A package for building initial configurations for molecular dynamics simulations. J. Comput. Chem 2009, 30, 2157–2164. [DOI] [PubMed] [Google Scholar]
- (13).Jorgensen WL; Chandrasekhar J; Madura JD; Impey RW; Klein ML Comparison of simple potential functions for simulating liquid water. J. Chem. Phys 1983, 79, 926–935. [Google Scholar]
- (14).Grest GS; Kremer K Molecular dynamics simulation for polymers in the presence of a heat bath. Phys. Rev. A: At., Mol., Opt. Phys 1986, 33, 3628–3631. [DOI] [PubMed] [Google Scholar]
- (15).Ryckaert J-P; Ciccotti G; Berendsen HJ Numerical integration of the cartesian equations of motion of a system with constraints: Molecular dynamics of n-alkanes. J. Comput. Phys 1977, 23, 327–341. [Google Scholar]
- (16).Bertsimas D; Tsitsiklis J Simulated annealing. Statist. Sci 1993, 8, 10–15. [Google Scholar]
- (17).Martyna GJ; Tobias DJ; Klein ML Constant pressure molecular dynamics algorithms. J. Chem. Phys 1994, 101, 4177–4189. [Google Scholar]
- (18).Humphrey W; Dalke A; Schulten K VMD: Visual molecular dynamics. J. Mol. Graphics 1996, 14, 33–38. [DOI] [PubMed] [Google Scholar]
- (19).Michaud-Agrawal N; Denning EJ; Woolf TB; Beckstein O MD Analysis: A toolkit for the analysis of molecular dynamics simulations. J. Comput. Chem 2011, 32, 2319–2327. [DOI] [PMC free article] [PubMed] [Google Scholar]
- (20).Gowers R; Linke M; Barnoud J; Reddy T; Melo M; Seyler S; Domanski J; Dotson D; Buchoux S; Kenney I; Beckstein O MDAnalysis: A python package for the rapid analysis of molecular dynamics simulations. Proceedings of the 15th python in science conference 2016, 98–105. [Google Scholar]
- (21).Jang SS; Jang YH; Kim Y-H; Goddard WA; Flood AH; Laursen BW; Tseng H-R; Stoddart JF; Jeppesen JO; Choi JW; et al. Structures and properties of self-assembled monolayers of bistable [2]rotaxanes on Au (111) surfaces from molecular dynamics simulations validated with experiment. J. Am. Chem. Soc 2005, 127, 1563–1575. [DOI] [PubMed] [Google Scholar]
- (22).Gullingsrud J; Babakhani A; McCammon JA Computational investigation of pressure profiles in lipid bilayers with embedded proteins. Mol. Simul 2006, 32, 831–838. [Google Scholar]
- (23).Jang SS; Lin S-T; Maiti PK; Blanco M; Goddard WA; Shuler P; Tang Y Molecular dynamics study of a surfactant-mediated decane-water interface: Effect of molecular architecture of alkyl benzene sulfonate. J. Phys. Chem. B 2004, 108, 12130–12140. [Google Scholar]
- (24).Piggot TJ; Allison JR; Sessions RB; Essex JW On the calculation of acyl chain order parameters from lipid simulations. J. Chem. Theory Comput 2017, 13, 5683–5696. [DOI] [PubMed] [Google Scholar]
- (25).Wang H; Coss CS; Mudalige A; Polt RL; Pemberton JE A PM-IRRAS investigation of monorhamnolipid orientation at the air-water interface. Langmuir 2013, 29, 4441–4450. [DOI] [PubMed] [Google Scholar]
- (26).Giorgino T Computing 1-D atomic densities in macro-molecular simulations: The density profile tool for VMD. Comput. Phys. Commun 2014, 185, 317–322. [Google Scholar]
- (27).Luft CM; Munusamy E; Pemberton JE; Schwartz SD Molecular dynamics simulation of the oil sequestration properties of a nonionic rhamnolipid. J. Phys. Chem. B 2018, 122, 3944–3952. [DOI] [PMC free article] [PubMed] [Google Scholar]
- (28).Daful AG; Avalos JB; Mackie AD Model shape transitions of micelles: Spheres to cylinders and disks. Langmuir 2012, 28, 3730–3743. [DOI] [PubMed] [Google Scholar]


