Abstract
We present newly measured spectra of the X-ray emission of a molybdenum metal anode subject to electron bombardment, using a very high dispersion silicon double-crystal spectrometer. The measurement includes the dipole-allowed KL, KM, and KN emission lines, based on an energy scale traceable to the Système International (SI) definition of the meter with a systematic uncertainty below ΔE/E = 10−6. The data are presented as parametrized multi-Lorentzian fits to the results, and as supplementary data with the complete spectrum of each line group, corrected for instrumental effects. The MoKL3 (Kα1) line energy was in complete statistical agreement with published measurements, and it showed no asymmetry. Other lines showed varying discrepancies with the literature which lie outside the bounds of probable experimental errors.
I. INTRODUCTION
Accurately-measured x-ray emission spectra from electron-bombarded targets are critical for a wide variety of metrological and analytical applications. Previous best-practice publications of such information have presented parametrized fits to sums of Lorentzian peaks [1–3] or, often, the position of the measured brightest point on the spectrum [4]. This has been sufficient for most x-ray diffraction (XRD) purposes and for the current applications of x-ray fluorescence (XRF). However, for lines which have complex shapes, this parametrization may not fully contain the information of the underlying measurement [5]. Current applications of both XRD and XRF are beginning to demand higher quality line shapes and positions to allow fitting of spectra, particularly those that include KM and KN lines, which can be shifted by chemical effects. Modern developments in superconducting transition-edge sensors (TES) [6, 7] for energy-dispersive XRF measurements will allow very high precision, but such devices require calibration against very well known lines, and both the shape and position of observed lines need to be monitored. At NIST, a project is underway to use our two fully-traceable x-ray energy spectrometers to measure a wide range of x-ray lines which can be used to calibrate TES devices, which have the potential of high-throughput, high-accuracy XRF measurements.
In this work, we have continued with development of the techniques set forth in [5].Because of the much higher photon energy of the Mo K-series x-rays compared to those of Cu, and the available angular ranges of our channel-cut crystals, the signal available is much weaker, requiring long count times to accumulate necessary statistics. We operated our crystals in both 1-bounce-per-crystal (no channel), which we designate the 1+1 configuration, and for the KL3 line, the 3-bounce channel mode used in the previous work, which we designate 3+3. The Si 880 reflection was used, resulting in a rocking curve angular full width at half maximum of only about 0.2″ to 0.3″. Note on notation: we use the symbol ‘″ ‘ to represent seconds of plane angle, and ‘s’ to represent seconds of time.
II. EXPERIMENTAL SETUP
A. General Mechanical
The measurements described herein were carried out on the NIST Parallel-Beam Diffractometer (PBD), configured as a double-crystal spectrometer and aligned according to the procedures of [5]. Since that paper was published, a change to the mounting of the second (γ) crystal was implemented which allowed the camera base and the crystal orientation with respect to the camera to be rotated; this allows a wider range of angles to be passed through the channel crystals, but does not otherwise change the optics.
3D printed bismuth-ABS [GMASS Bismuth Metal ABS, Turner MedTech]1 anti-scatter beam stops were installed, which reduce air scatter back into the x-ray camera, especially in dispersive mode.The shield, by stopping high-energy primary beam from passing entirely through crystal 1, reduced the backscatter into the camera an order of magnitude.
The X-ray source was a Rigaku UltraX rotating anode, with a sintered molybdenum metal band on a copper water-cooled head.2 The source was operated at a potential of 50kV, and beam currents between 200mA and 300mA. The beam was imaged vertically through a 1mm slit approximately 500mm from the anode, resulting in a well-defined relationship between the vertical divergence angle ϕ of a ray and its detected position on the x-ray camera face. A horizontal limiting slit was used at the same location placed to eliminate scattered beam, and so that the resulting horizontal beam had a full angular divergence of 0.03° at its edges. This allowed the γ-offset scanning to cover 0.02° (cf. ref. [5]), which covered 2 full pixels on the camera, which was a Dectris Pilatus 100K with 172μm square pixel pitch. In the previous work, we scanned twice as far to cover 4 pixels, but because of the weak signal in this configuration, we reduced the scattered background by narrowing the beam.
The measurement of the non-dispersive zero of the system for the Mo lines presented challenges which surpassed those of our previous copper measurements. The Mo lines are just below 20keV, and to bring them into an angular range which our channel crystals can transmit required the use of an 880 reflection. The resulting non-dispersive curves were only about 0.2″ wide, requiring a very fine scan to locate them, and excellent vertical crystal alignment to get full transmitted intensity.
Because of the expectation of a weak signal, most of the data were taken with the lamella as the first (ω) crystal, and using a single bounce off the face of the second crystal as the second reflection; this allowed a somewhat improved throughput for the system due to the reduced number of bounces. As a final run, the lamella was replaced with the same channel crystal used in ref. [5], and the KL3 line was re-measured with the new optical setup. This allowed us to compare the results with two very different optical setups, and verify consistency within reasonable statistical bounds, improving confidence in the measurements.
Other than these differences, the experimental setup was as previously described.
B. Crystal Alignment
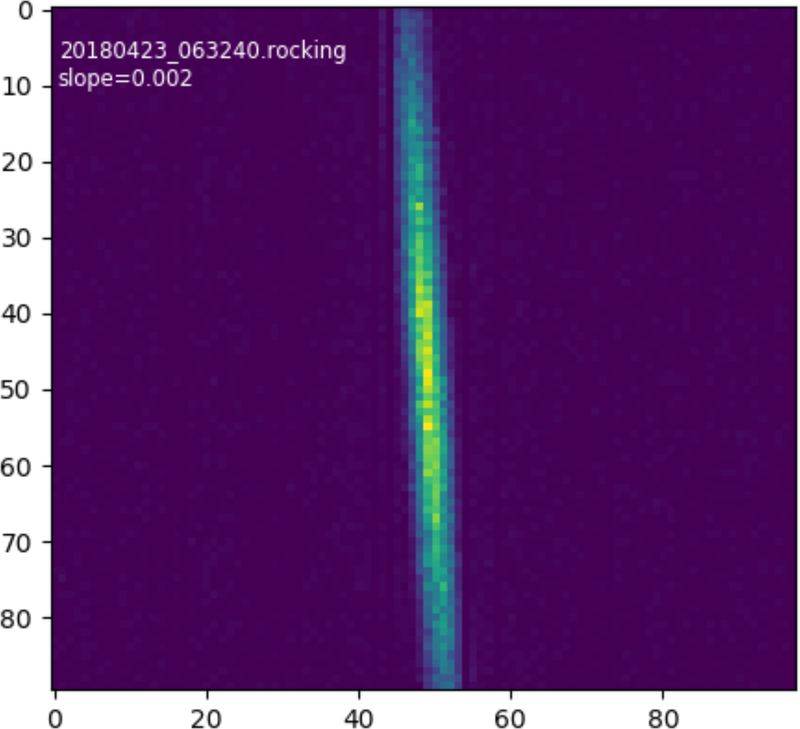
Vertical alignment of the crystals was carried out using the lamella-flipping method of ref. [5] in non-dispersive mode. Since the data were taken for [5], we have developed an more automated and faster method of carrying out the vertical alignment of the crystal axes. The fundamental procedure is the same, but we now use a script to analyze the results of a non-dispersive scan and quantify the slope dθB/dψ of the non-dispersive pattern, in ″/pixel, which allows more rapid estimation of the requisite adjustment of the crystals to make them parallel. A typical output of our code for a well-aligned set of crystals is shown in figure 1. This is not an image of the camera face; it is I(ω, γ, ψ), summed along the rows within the region of interest, as described in section 4.1 of [5]. To understand this diagram, we refer to equation 24 of [5], which describes the shift in diffraction angle θB due to tilts δ1 and δ2 on crystals 1 and 2, respectively:
| (1) |
This can be used to estimate bounds on the tilts of the crystals by differentiating with respect to ψ:
| (2) |
and considering the constant part of this (assuming ψ is near its central value). This gives
| (3) |
Typical values of this slope are bounded by ±0.005″/pixel for the molybdenum work (where the rocking curve is very narrow, so it is easy to measure the misalignment) and our angular pixel size is approximately 35″ so the actual slope dθB/dψ is bounded by ±1.4×10⁻⁴ (dimensionless). Since we obtain the initial alignment by flipping crystal 1, the difference in the slopes between the positive and negative side of the crystal will be ±2δ1 sin2θB/cosθB; this bounds the error δ1 on crystal 1 to ±6×10⁻⁵ radian or ±12″ of tilt. Crystal 2 is aligned to similar accuracy.
Figure 1:
Crystal alignment image of I(γ, ω, ψ), summed along rows within the region of interest, as per section 4.1 of [5]. Vertical axis unit is pixels. Horizontal unit is 1×10⁻⁵ degree/step. The units on the slope in the ‘slope’ text are ″/pixel. This figure shows the output as seen from our realtime analysis tool.
III. DATA ANALYSIS
A. Axial Divergence Correction
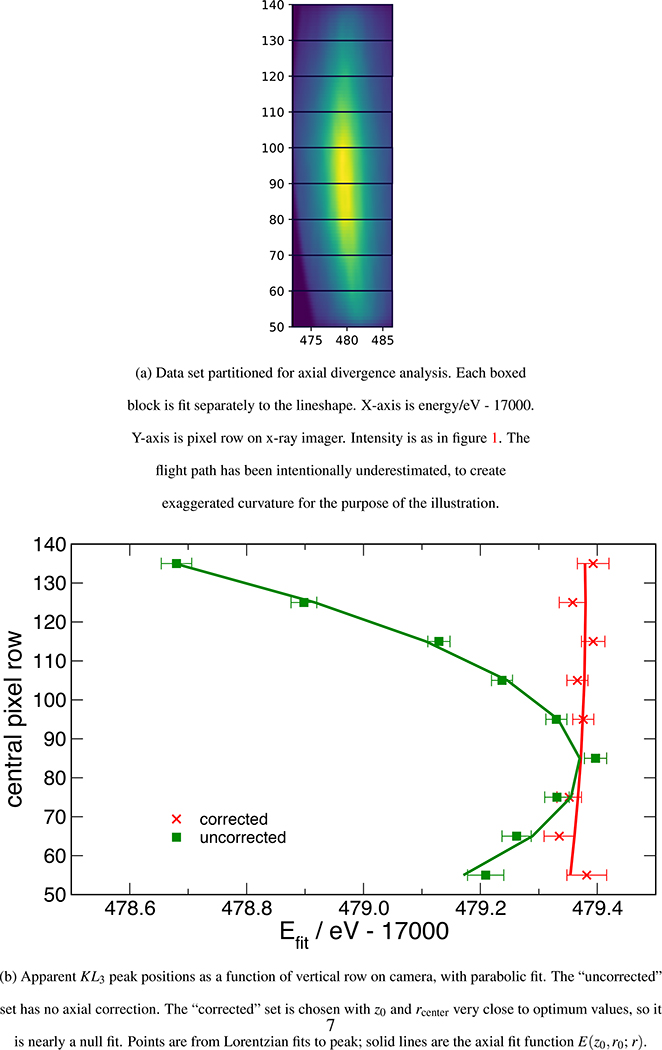
The process of analyzing the data sets from this measurement is somewhat modified from that of ref. [5]. This procedure allows direct determination of the uncertainty due to the determination of the length of the flight path. The process starts from the procedure used to generate figure 16 of [5], except that the number of slices along ψ is increased, and the slice width decreased. This is illustrated in the partitioned image of figure 2a. This process yields figure 2b, a set of measurements of the apparent peak position of the KL3 peak as a function of the vertical position of the beam on the camera face. The error bars shown are pure statistical errors, and are larger than would be seen in the final result, since each slice of the data set is small and has limited counting statistics. However, a properly weighted polynomial fit to these results will return parameters with uncertainties which reflect the uncertainties associated with the complete data set. For reference, we define the input quantities used below as follows:
Figure 2.
Illustration of process used for determining correction due to axial divergence.
| E0 | actual energy of the photons being measured |
| ΔE | energy correction due to axial divergence |
| Δy | height of one row pixels in the x-ray detector |
| ψ | the angle of the photon path from the perpendicular to the crystal axes (assuming crystals are aligned) |
| r0 | the row number on the camera which is estimated to correspond to a photon path perpendicular to the crystal axes |
| r1 | corrected central row number as a result of one pass of the calculation |
| z0 | an estimate of the distance from the slit to the x-ray detector |
| z1 | corrected distance from the slit to the x-ray detector as a result of one pass of the calculation |
| Emax | corrected energy for a ray measured at ψ = 0 (extremum of parabola) |
Simplifying equation 1 with δ1 = δ2 = 0 (crystals aligned), we get a correction ΔE for a peak at photon energy E0 that satisfies the diffraction condition at angle ψ:
| (4) |
The angle ψ is defined as
| (5) |
where r is the row number on the camera (in pixels). The axial fit is used to determine improved values of r0 and z0 from some starting estimates. Thus, we fit the center, incompletely corrected energy E(z0, r0; r) of the Lorentzian peak from the slice centered on camera row r in the plot to
| (6) |
The fit parameters a, b, c are correlated through the resulting variance-covariance matrix parameters , , , σab, σac, and σbc. Since this curve has already been adjusted by the estimates r0 and z0 in the data extraction, as described in ref. [5], the full solution to the parabola with no axial correction is:
| (7) |
| (8) |
| (9) |
| (10) |
| (11) |
The expression E(0, 0; r) describes the shape that the parabola would have had if no axial correction had been pre-applied through the estimates r0 and z0. More importantly, from the variance-covariance terms and usual error propagation, we can compute the statistical uncertainty on the extremum Emax from the usual full expression for correlated error:
| (12) |
Inserting the derivatives of equation 9, and defining shortened names ya, yb, and yc for these derivatives,
| (13) |
| (14) |
| (15) |
| (16) |
This is the full uncertainty on the energy scale, including the uncertainty resulting from the fit to the flight path z0 and the beam axis height r0. To test the stability of this procedure, table I shows the parameters for various initial path lengths z0 and center rows r0 for the final data collection runs with both crystals in channel configuration. As can be seen from the variation of the result relative to the statistical uncertainty, Emax is very well determined by this fitting procedure. Note that the variation is much less than the quoted 1σ statistical error; these results are all derived from the same data set, so the errors are all fully correlated among the calculated values, and there is no reason to expect variation to be as large as 1σ.
Table I:
Comparison of computed beam path parameters for different starting values of parameters.
| z0 / mm | z1 / mm | r0 / pixel | r1 / pixel | Emax / eV - 17479 |
|---|---|---|---|---|
| 1 bounce + 1 bounce mode | ||||
| 965 | 965 | 83 | 83.76 | 0.3944±0.005 |
| 3 bounce + 3 bounce mode | ||||
| ∞ | 1005 | 82 | 82.91 | 0.3708±0.009 |
| 1000 | 989 | 82 | 82.85 | 0.3706±0.009 |
| 1000 | 996 | 85 | 82.51 | 0.3733±0.009 |
| 800 | 995 | 82 | 82.35 | 0.3721±0.009 |
| 1200 | 997 | 85 | 82.80 | 0.3718±0.009 |
B. Efficiency Corrections
In [5], we corrected for a number of factors relating to the efficiency of x-ray transport and detection through the system. The corrections for air absorption, anode self-absorption, and detector efficiency, are exactly as in the previous work. It is worth noting that at the higher energies of these lines, the air absorption becomes a very small correction (it was large for the copper work), but the detector efficiency has fallen due to the lower photoelectric cross section.
In the previous work, we estimated the efficiency of diffraction from the crystals by using a full McXTrace [8] Monte-Carlo ray tracing model. For this work, we compared the results of that model to a direct calculation from the silicon rocking curves, using code which implements Batterman and Cole [9] for the dynamical diffraction. If the rocking curve from a single reflection, ε(θ),as a function of offset angle θ from the dynamical center, then for the n+n bounce system, we computed the transport reflection acceptance εn as
| (17) |
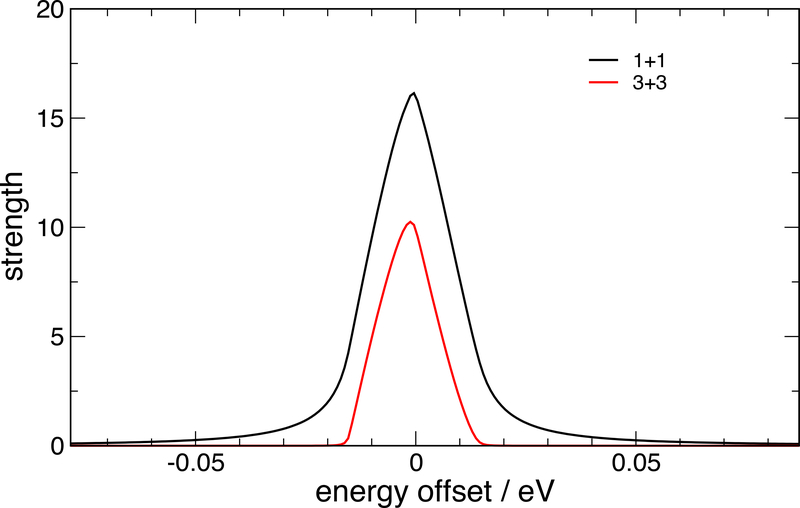
Equation 17 is valid for the case of a line source parallel to the diffraction axis, with an angular and energy spread each larger than than the rocking curve limits for the crystals, and results from noting that the area of the convolution of two functions (the rocking curve of an n-bounce optic, in this case) is the product of the area of the functions. This quantity is the product of angular acceptance in the equatorial plane and energy acceptance. Comparison to full Monte-Carlo results indicate that this approach yields results which indicate no significant discrepancy due to this approximation. Table II shows the contribution from the various components of the system as a function of photon energy, and the total efficiency η(E). The dispersive rocking curves for the 1+1 and 3+3 mode are compared in figure 3. The wider tails on the 1+1 relative to the 3+3 optical system are immediately evident; however, in both cases, the rocking curves are extremely narrow compared to the peak widths of interest.
Table II:
Contributions to system efficiency
| energy / keV | anode | crystal εn | air | filter | detector | efficiency η(E) meV×″ |
|---|---|---|---|---|---|---|
| 1+1 setup no brems filter n = 2 | ||||||
| 17.0 | 0.534 | 1.774 | 0.870 | 1.000 | 0.413 | 0.341 |
| 17.5 | 0.560 | 1.707 | 0.879 | 1.000 | 0.387 | 0.325 |
| 18.0 | 0.584 | 1.677 | 0.887 | 1.000 | 0.363 | 0.315 |
| 18.5 | 0.607 | 1.634 | 0.894 | 1.000 | 0.340 | 0.302 |
| 19.0 | 0.629 | 1.614 | 0.901 | 1.000 | 0.320 | 0.292 |
| 19.5 | 0.649 | 1.618 | 0.907 | 1.000 | 0.300 | 0.286 |
| 20.0 | 0.668 | 1.586 | 0.912 | 1.000 | 0.282 | 0.273 |
| 1+1 setup 750μm Si brems filter n = 2 | ||||||
| 17.0 | 0.534 | 1.774 | 0.870 | 0.287 | 0.413 | 0.098 |
| 17.5 | 0.560 | 1.707 | 0.879 | 0.318 | 0.387 | 0.103 |
| 18.0 | 0.584 | 1.677 | 0.887 | 0.348 | 0.363 | 0.110 |
| 18.5 | 0.607 | 1.634 | 0.894 | 0.377 | 0.340 | 0.114 |
| 19.0 | 0.629 | 1.614 | 0.901 | 0.406 | 0.320 | 0.118 |
| 19.5 | 0.649 | 1.618 | 0.907 | 0.433 | 0.300 | 0.124 |
| 20.0 | 0.668 | 1.586 | 0.912 | 0.460 | 0.282 | 0.125 |
| 3+3 setup no brems filter n = 6 | ||||||
| 17.0 | 0.534 | 0.731 | 0.870 | 1.000 | 0.413 | 0.140 |
| 17.5 | 0.560 | 0.712 | 0.879 | 1.000 | 0.387 | 0.136 |
| 18.0 | 0.584 | 0.726 | 0.887 | 1.000 | 0.363 | 0.136 |
| 18.5 | 0.607 | 0.702 | 0.894 | 1.000 | 0.340 | 0.130 |
| 19.0 | 0.629 | 0.714 | 0.901 | 1.000 | 0.320 | 0.129 |
| 19.5 | 0.649 | 0.731 | 0.907 | 1.000 | 0.300 | 0.129 |
| 20.0 | 0.668 | 0.696 | 0.912 | 1.000 | 0.282 | 0.120 |
| 3+3 setup 750μm Si brems filter n = 6 | ||||||
| 17.0 | 0.534 | 0.731 | 0.870 | 0.287 | 0.413 | 0.040 |
| 17.5 | 0.560 | 0.712 | 0.879 | 0.318 | 0.387 | 0.043 |
| 18.0 | 0.584 | 0.726 | 0.887 | 0.348 | 0.363 | 0.047 |
| 18.5 | 0.607 | 0.702 | 0.894 | 0.377 | 0.340 | 0.049 |
| 19.0 | 0.629 | 0.714 | 0.901 | 0.406 | 0.320 | 0.052 |
| 19.5 | 0.649 | 0.731 | 0.907 | 0.433 | 0.300 | 0.056 |
| 20.0 | 0.668 | 0.696 | 0.912 | 0.460 | 0.282 | 0.055 |
Figure 3:
Computed dispersive rocking curves for silicon 880 reflections in our 1+1 and 3+3 geometries at 17500eV
C. Fitting Procedure
The efficiency corrections from above were included in the fits by computing the fitting function for a peak indexed j at energy Ej with half-width at half-maximum (HWHM) wj and scale factor aj as
| (18) |
The underlying Lorentzian peak with this shape function has area aπ/w. The total fit function for a data set (on-peak or background) is then:
| (19) |
where the constants c0 and c1 set the continuum shape and Ecenter is just an energy near the center of the spectral region being analyzed, to make the polynomial coefficients more meaningful.
The overall procedure is somewhat simplified from that of [5]. Because of the new shielding which reduces scatter, our broadband background is very small and can be treated in a simpler manner than before. However, in our 1+1 optics, there is significant Compton-scattering “glow” from the illumination of the second crystal by the beam from the first crystal, which result in features in the measured background which follow the main peaks. These have a different origin than the background leakage discussed in our previous work. In the previous work, if the beam integration window on the detector was set too close to the actual beam, one would see beam in the background, but this fell off very rapidly as the window was widened. This is because the 3+3 channel crystals removed much of the stray beam. In the 1+1 configuration, beam leaks into the background even with wide integration windows, since the Compton scattering from the second crystal has a wide angular spread. To mitigate this, we fit the measured background to a polynomial (linear in this case) plus a simplified sum of Lorentzians
Our current procedure involves fitting the measured background B(E) from outside the diffracted beam to the form of equation 19, producing the function Bf (E). We assume then that Bf (E) has an error band much smaller than the statistical uncertainty in the on-peak intensity. We then fit the on-peak net intensity I(E) − Bf (E) to another function of the form of equation 19 to produce If (E). This is simpler to implement than the procedure of [5], and seems to work as well.
D. Dynamical corrections and energy scale
The corrections for dynamical scattering [10, 11] are made in the same manner as in [5]. The parameters used are presented in table III and come from [12, 13]. The interpolation of f1 is done linearly in logE vs. f1; f2 is interpolated as logE vs. log f2. Because of the narrow rocking curves, the dynamical asymmetry correction in this energy range is not significant; it is calculated to be of order 0.01″. We use the exact value of hc/e from the 2018 SI definition of hc/e = 1239.841984332eVnm for conversion of wavelength to energy; this is slightly different than the CODATA 2010 value used in our previous work, although not significantly so at our level of accuracy.
Table III:
FFAST values for the atomic scattering factors for silicon, bracketing the relevant energy range
| E / keV | f1 | f2 |
|---|---|---|
| 16.46362 | 14.1047 | 0.077990 |
| 17.59961 | 14.0947 | 0.068113 |
| 18.81398 | 14.0851 | 0.059487 |
| 20.11215 | 14.0772 | 0.051955 |
IV. DATA AND RESULTS
The data for these measurements were taken in a series of dispersive runs, interspersed with verifications of the position of the non-dispersive peak. All the peaks were initially measured with the lamella in the center, and the second crystal providing a single reflection (the 1+1 configuration). A final measurement of the Mo KL3 (Kα1) line was made with the system configured with both channel crystals (the 3 + 3 configuration), as in [5], as a cross check on any dependence on optics. Runs marked as having a filter were taken with a 750μm silicon wafer in the beam to reduce lower-order-diffraction bremsstrahlung background. All runs took 10 steps in γ of 0.002° each. All data are plotted with a vertical intensity scale of counts/(pixel·A·s). The areas for peaks reported on the plot legends are corrected for the efficiency, as discussed above. The uncertainties in the plot legends are from the diagonal of the variance-covariance matrix, and do not include correlation effects between parameters. The final summary table does include these corrections.
A. KL3 (Kα1) and KL2 (Kα2) with 1+1 optics
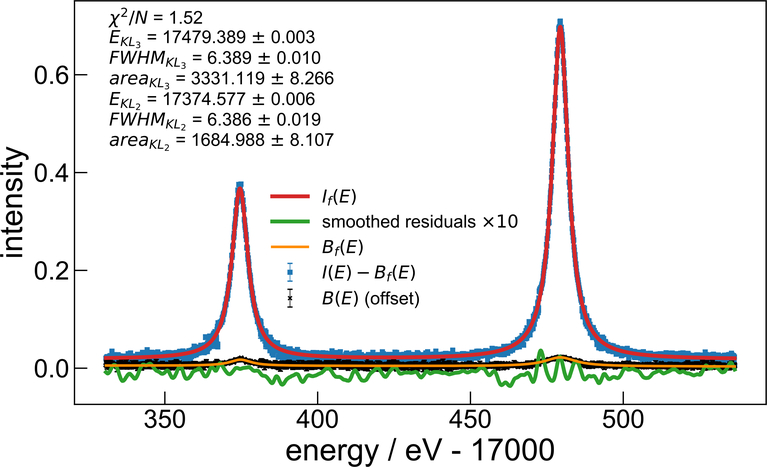
In our earlier paper on the Cu Kα spectrum, the KL3 and KL2 lines were heavily overlapped, and needed to be collected as a single unit. Although the molybdenum spectrum has a much larger spacing of the equivalent lines relative to their FWHM, we will fit KL3 and KL2 together to assure that the overlap of the tails does not bias the peak position. The data sets used for this analysis are sets 1–4 in table IV. Axial corrections were made as per table I. The sets were rebinned into fixed width bins. The data and fit are shown in figure 4. The parameter uncertainties displayed on the figure are pure 1σ statistical uncertainties. The effect of the repeated narrow scans over the centers of the peaks can be seen in the reduced scatter of the data around the peak centers relative to that in the tails. We can see no sign, at this statistical level, of any asymmetry in these peaks or any contributions from satellites; the smoothed residuals appear quite random. The intensity ratio is at significant odds with the theoretical calculations in [14], although it is within the 1σ bounds of the combined experimental uncertainties. Both line positions are fully consistent with the previously published values in NIST SRD128 [4]. This is the data set, because of its high statistical significance, which was used to determine the axial divergence beam path length for the 1+1 mode. Because that mode does not have the second crystal on its rotation axis, there can be small changes in the flight path as we realign the system for different wavelengths. Because of this uncertainty, we allow an extra 50mm of path uncertainty in the other 1+1 measurements, which corresponds to an extra ΔE/E = 5×10⁻⁶ in the type B error contribution.
Table IV:
Catalog of data runs used for all measurements
| index | designation | E0 / eV | E1 / eV | steps | count time / s | repeats | anode current / mA | filter |
|---|---|---|---|---|---|---|---|---|
| 1 | KL3,2 | 17330 | 17536 | 600 | 5 | 5 | 300 | no |
| 2 | KL3 wide | 17445 | 17514 | 500 | 5 | 1 | 300 | no |
| 3 | KL3 narrow | 17472 | 17486 | 500 | 5 | 3 | 300 | no |
| 4 | KL2 | 17367 | 17381 | 500 | 5 | 2 | 300 | no |
| 5 | KM3,2 wide | 19549 | 19646 | 500 | 5 | 1 | 300 | yes |
| 6 | KM3,2 narrow | 19583 | 19613 | 600 | 5 | 3 | 300 | yes |
| 7 | KM3,2 wide | 19549 | 19646 | 500 | 5 | 1 | 250 | yes |
| 8 | KN3,2 narrow | 19965 | 19972 | 150 | 10 | 6 | 250 | yes |
| 9 | KN3,2 wide | 19949 | 19980 | 150 | 10 | 6 | 250 | yes |
| 10 | KL3 3+3 filtered | 17465 | 17492 | 400 | 5 | 7 | 200 | yes |
| 11 | KL3 3+3 unfiltered narrow | 17465 | 17492 | 400 | 5 | 5 | 200 | no |
| 12 | KL3 3+3 unfiltered wide | 17451 | 17506 | 400 | 5 | 11 | 200 | no |
Figure 4:
data and fits for KL3 (Kα1) and KL2 (Kα2) with 1+1 system
B. KM3,2 with 1+1 optics
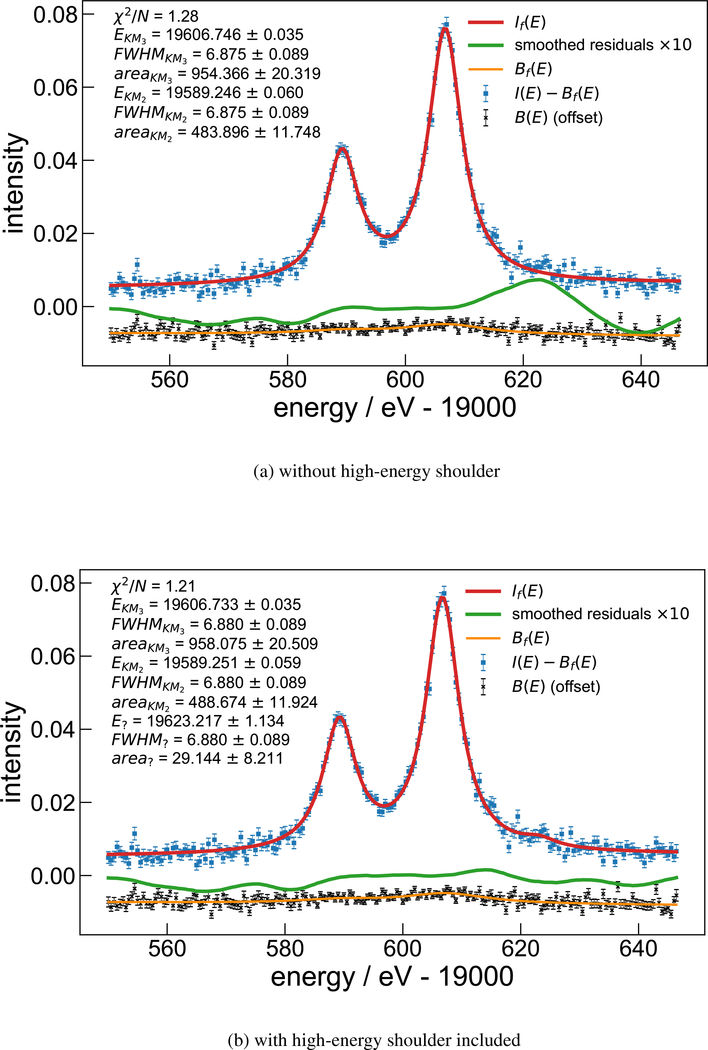
This data set was collected in exactly the same manner as that of the KL3,2 system, and includes runs 5–7 of table IV. The crystals were rotated on their bases to allow them to operate at the appropriate angles, realigned vertically, and data taken. These data were collected with the 750μm silicon filter in place to reduce lower-order bremsstrahlung reflections; the reported peak areas have been corrected for this. The fits were carried out with the FWHM of the peaks linked to a common value; there was no statistically significant change in the parameters when the peaks were allowed to have different widths. There is a hint of a shoulder to the high-energy side of the system, as can be seen in the residuals in figure 5a. We present plots in figure 5 of the data fitted without and with this shoulder, to allow comparisons of how much it affects conclusions about fit reliability. At the available level of statistical information, the 3 Lorentzian peaks appear to be a complete description of this system, but including or omitting the shoulder peak did not change the parameters of the Mo peaks in a statistically-significant way. The line positions are significantly different (> 1eV) than those reported in [4], and the spacing between the lines is even different by almost 0.5eV.
Figure 5:
data and fits for KM3 (Kβ1) and KM2 (Kβ3) with 1+1 system
C. KN3,2 with 1+1 optics
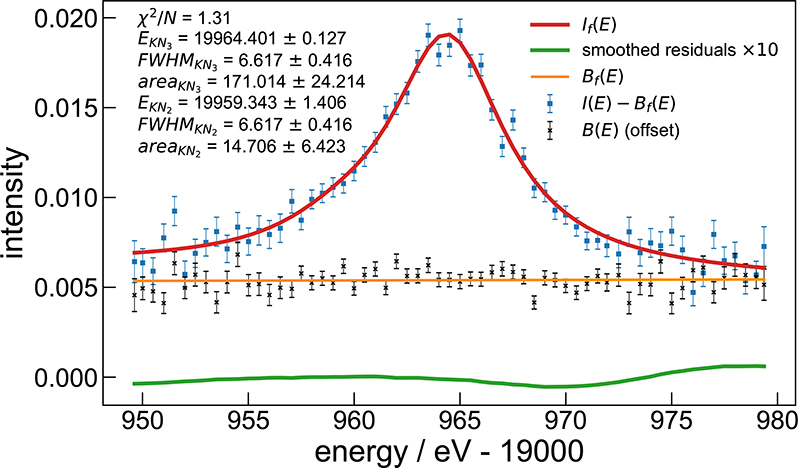
This data set consist of runs 8 and 9 of table IV. These data were collected with the 750μm silicon filter in place to reduce lower-order bremsstrahlung reflections; the reported peak areas have been corrected for this. The actual signal is quite weak compared to the multiple scattering background. In figure 6, the background B(E) and Bf (E) have been shifted down 0.007 units from its actual value, to make the plot readable. Also, the bremsstrahlung continuum under the peak (even with filtering to remove lower orders) is comparable to the peak intensity itself, as can be seen by the level on the tails of I(E) − Bf (E). For this fit, Bf (E) contains only the polynomial terms; no Lorentzian peaks are included since the statistics are not sufficient to support it.
Figure 6:
data and fits for KN3 and KN2 with 1+1 system
D. KL3 with 3+3 optics
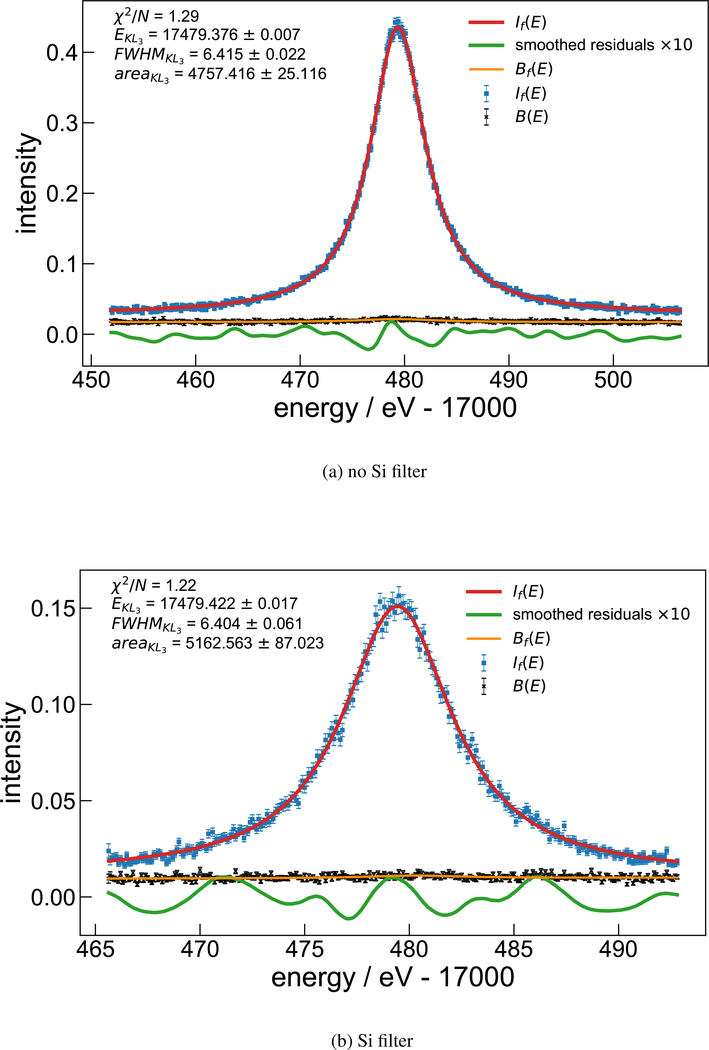
This data set consists of runs 10–12 of table IV. The machine was set up exactly as in [5], with the channels in the crystal being used so each optic had 3 bounces. This results in very short tails on the rocking curve, as shown in figure 3, and lower background from scattering, relative to the 1+1 arrangement. Data were taken both with open beam, and with the 750μm thick silicon filter described above. The available collection time for these runs was not long, so they have reduced statistical significance relative to the KL3 1+1 runs above, but serve as a useful cross check on whether our optics are performing as expected, and that the attenuation introduced by the filter is being correctly computed. Difficulties with the operation of the source required data collection at reduced beam current. These data were not included in the final evaluation of the parameters for the KL3 and KL2 peaks, since they did not include the two peaks together.
V. DISCUSSION
A. Uncertainty Analysis
The analysis of sources of uncertainty in this measurement follows that of [5]. The much higher energy of the Mo spectrum reduces the uncertainty due to the absorption corrections and the dynamical asymmetry. Table V shows the contributions from various terms. As before, the axial divergence correction, the angular uncertainty, and the temperature uncertainty dominate. Because of the lower count rates in these measurements, relative to those in [5], the pure statistical uncertainties are larger in most cases than those in the table. The statistical uncertainties are not included in table V, since they vary from measurement to measurement, but are combined with these in table VI.
Table V:
Contributions to type B uncertainty
| correction | magnitude | uncertainty | explanation |
|---|---|---|---|
| axial divergence | ≈ −5 | 0.25 | axial fit statistics compared to pooled data statistics (actual value depends on which crystal setup) |
| slit height | −0.002 | 0.00 | Δθ = a2 tan θ / (24L2) |
| temperature | −6.63 | 0.05 | (t = tlab) – (t = 22.5) lattice parameter shift from crystal lattice reference temperature, limited by 0.02C temp uncertainty |
| index of refraction | −2.6 | 0.005 | δ / sin2 θ, limited by form factor uncertainty estimated at 0.2 % |
| dynamical asymmetry | 0.015 (1+1), 0.055 (3+3) | 0.01 | previous Monte-Carlo models with copper agree with measured non-dispersive curve. With Mo, non-dispersive curve is too narrow to resolve directly. |
| efficiency slope T(E) | 0.03 | 0.05 | from atmospheric pressure 10 % bounds |
| angle errors | 0.00 | 0.09 | assuming 0.05″ k=1 uncertainty [15] |
| Si d-spacing | 0.00 | 0.03 | in vacuo uncertainty |
| Si atmospheric compression | 0.35 | 0.015 | 95 kPa to 105 kPa atmospheric pressure range (extreme limits) |
Table VI:
Recommended values for parameters of the molybdenum K spectrum. Widths marked ’frozen’ are constrained to be the same as in the row above in the fit. Uncertainties quoted after the quantities have the same units as the base quantities.
| E0 /eV | type A k=1 | total k=2 | FWHM /eV | type A k=1 | total k=2 | rel. intensity | type A k=1 | total k=2 | |
|---|---|---|---|---|---|---|---|---|---|
| KL3 | 17479.389 | 0.005 | 0.01 | 6.389 | 0.01 | 0.02 | 3330 | 3.8 | |
| KL2 | 17374.577 | 0.007 | 0.015 | 6.3876 | 0.02 | 0.04 | 1685 | 3.7 | |
| intensity ratio KL2/KL3 | 0.506 | 0.0013 | 0.0026 | ||||||
| KM3 | 19606.746 | 0.035 | 0.2 | 6.88 | 0.09 | 0.2 | 954 | 10 | |
| KM3 brightest point (top of KM3+KM2 tail) | 19606.734 | ||||||||
| KM2 | 19589.246 | 0.060 | 0.2 | frozen | 484 | 7.7 | |||
| KM2 brightest point (top of KM2+KM3 tail) | 19589.294 | ||||||||
| intensity ratio KM2/KM3 | 0.507 | 0.011 | 0.022 | ||||||
| KN3 | 19964.401 | 0.127 | 0.25 | 6.62 | 0.42 | 0.8 | 171 | 14 | |
| KN2 | 19959.343 | 1.405 | 2.8 | frozen | 15 | 6 | |||
| KN3 + KN2 brightest point | 19964.361 | ||||||||
| intensity ratio KN2/KN3 | 0.085 | 0.036 | 0.07 |
B. Recommended values
Because all of the molybdenum lines are consistent with sums of pure Lorenztians, we present a table of the positions, widths, and intensities of the components of the KL, KM, and KN spectrum, and can recommend these values as being fully usable for future data analysis. Table VI shows this. The total (A+B) uncertainties in energy include the effect of uncertainty of the beam path length derived from the axial curvature fits. Note that for all of these, the type ‘A’ errors dominate the type ‘B’. The uncertainties on the summed relative intensities are estimated from the uncertainty of the anode self-absorption correction. Measurements carried out by other techniques (photo-excitation and an energy-dispersive detector) are more appropriate for determining these intensities.
VI. CONCLUSION
A new measurement of the molybdenum K-shell x-ray spectrum has been carried out, resulting in peak shape data on an energy scale which is directly traceable to SI base units through the heritage of the diffraction crystals used and through the angular and temperature scales used for the measurements. We provide a rigorous analysis of the determination of the effects of axial divergence on the energy scale. The components of the molybdenum spectrum are very well described by pure Lorentzian peak-shape models; nonetheless, supplemental data sets are provided with the intensity data corrected for instrumental effects.
VII. APPENDIX: DESCRIPTION OF SUPPLEMENTARY DATA SETS
The data collected from this project are being provided for further analysis and for inclusion in a future database. Within the limits of our statistical sensitivity, the Lorentzian models appear complete for this system, so these sets may contain no significant new information, but are included for completeness. This is quite different from the case of the copper spectra, where multi-Lorentzian models showed very significant deviations from the measurements. The intensities have been corrected as per table II. The data sets are in a 8-column format, consisting of the corrected energy scale, the efficiency factor used for corrected data, the uncorrected count rate inside the ROI (i.e. the signal) and the standard error of the signal, the uncorrected count rate outside of the ROI (background) and its standard error, and the efficiency-corrected net signal and its standard error. The energy bins are not quite uniformly spaced, due to the corrections from axial divergence, and the rebinning of the data from angular space to energy space. This rebinning was carried out using the algorithm of [16], without the adaptive component, but in a manner which preserves the exact first moment of peaks and the true Poisson statistics of aggregated bins.
Supplementary Material
Figure 7:
data and fits for KL3 with 3+3 system
Table VII:
Description of supplementary data files
| filename | data set description |
|---|---|
| mo_kl32_11.dat | runs 1–4 |
| mo_km32_11.dat | runs 5–7 |
| mo_kn32_11.dat | runs 8–9 |
| mo_kl32_33_filt.dat | run 10 |
| mo_kl32_33_nofilt.dat | runs 11–12 |
ACKNOWLEDGMENT
Author C.I. Szabo performed this work under the financial assistance award No. 70NANB15H051 from U.S. Department of Commerce, National Institute of Standards and Technology.
Footnotes
Certain commercial equipment, instruments, or materials are identified in this paper in order to specify the experimental procedure adequately. Such identification is not intended to imply recommendation or endorsement by the U.S. government, nor is it intended to imply that the materials or equipment identified are necessarily the best available for the purpose.
Thanks to Rigaku USA, Woodlands, TX for the loan of the Mo anode for this project.
Official contribution of the National Institute of Standards and Technology; not subject to copyright in the United States draft date: Friday 16th August, 2019 08:25
References
- [1].Härtwig J, Grosswig S, Becker P and Windisch D 1991. phys. stat. sol. (a) 125 79–89 [Google Scholar]
- [2].Härtwig J, Hölzer G, Förster E, Goetz K, Wokulska K and Wolf J 1994. phys. stat. sol. (a) 143 23–34 ISSN 1521–396X [Google Scholar]
- [3].Hölzer G, Fritsch M, Deutsch M, Härtwig J and Förster E 1997. Phys. Rev. A 56 4554–4568 [Google Scholar]
- [4].2016. NIST SRD 128, X-ray transition energies Standard Reference Database NIST U.S. Department of Commerce, Gaithersburg, MD, USA: URL https://www.nist.gov/pml/x-ray-transition-energies-database [Google Scholar]
- [5].Mendenhall MH, Henins A, Hudson LT, Szabo CI, Windover D and Cline JP 2017. Journal of Physics B: Atomic, Molecular and Optical Physics 50 115004. [DOI] [PMC free article] [PubMed] [Google Scholar]
- [6].Fowler JW, Alpert BK, Bennett DA, Doriese WB, Gard JD, Hilton GC, Hudson LT, Joe YI, Morgan KM, O’Neil GC, Reintsema CD, Schmidt DR, Swetz DS, Szabo CI and Ullom JN 2017. Metrologia 54 494. [DOI] [PMC free article] [PubMed] [Google Scholar]
- [7].Doriese WB, Abbamonte P, Alpert BK, Bennett DA, Denison EV, Fang Y, Fischer DA, Fitzgerald CP, Fowler JW, Gard JD, Hays-Wehle JP, Hilton GC, Jaye C, McChesney JL, Miaja-Avila L, Morgan KM, Joe YI, O’Neil GC, Reintsema CD, Rodolakis F, Schmidt DR, Tatsuno H, Uhlig J, Vale LR, Ullom JN and Swetz DS 2017. Rev. Sci. Instr 88 053108. [DOI] [PubMed] [Google Scholar]
- [8].Bergbäck Knudsen E, Prodi A, Baltser J, Thomsen M, Kjær Willendrup P, Sanchez del Rio M, Ferrero C, Farhi E, Haldrup K, Vickery A, Feidenhans’l R, Mortensen K, Meedom Nielsen M, Friis Poulsen H, Schmidt S and Lefmann K 2013. J. Appl. Cryst 46 679–696 [Google Scholar]
- [9].Batterman BW and Cole H 1964. Rev. Mod. Phys 36 681–717 [Google Scholar]
- [10].Hönl H 1933. Zeitschrift für Physik 84 1–16 [Google Scholar]
- [11].Authier A 2001. Dynamical Theory of X-Ray Diffraction (IUCr / Oxford Science; ) ISBN 0–19-855960–7 [Google Scholar]
- [12].Chantler CT 2000. Journal of Physical and Chemical Reference Data 29 597–1056 [Google Scholar]
- [13].2016. Detailed tabulation of atomic form factors, photoelectric absorption and scattering cross section, and mass attenuation coefficients for Z = 1–92 from E = 1–10 eV to E = 0.4–1.0 MeV Standard Reference Database 66 NIST U.S. Department of Commerce, Gaithersburg, MD, USA: URL http://physics.nist.gov/ffast [Google Scholar]
- [14].Diamant R, Huotari S, Hämäläinen K, Sharon R, Kao CC, Honkimäki V, Buslaps T and Deutsch M 2009. Phys. Rev. A 79 062512 [Google Scholar]
- [15].Mendenhall MH, Henins A, Windover D and Cline JP 2016. Metrologia 53 933–944 [DOI] [PMC free article] [PubMed] [Google Scholar]
- [16].Mendenhall MH. Pow. Diff. 2018:33. doi: 10.1017/S0885715618000726. [DOI] [PMC free article] [PubMed] [Google Scholar]
Associated Data
This section collects any data citations, data availability statements, or supplementary materials included in this article.


