

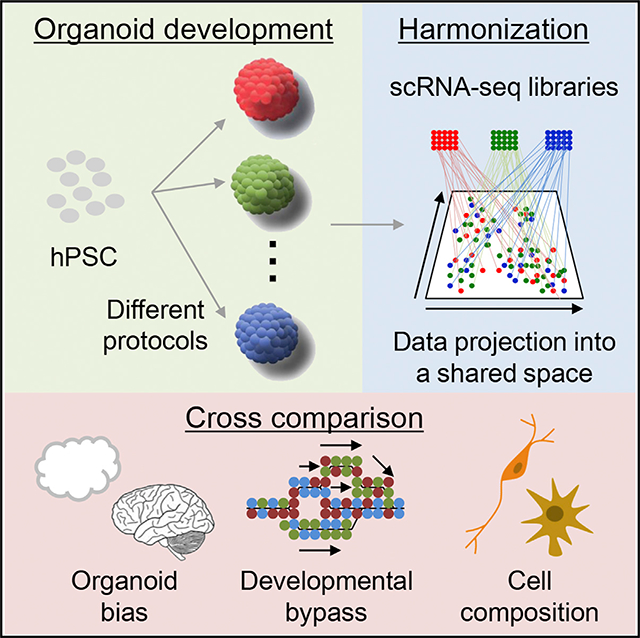
SUMMARY
Human brain organoid systems offer unprecedented opportunities to investigate both neurodevelopmental and neurological disease. Single-cell-based transcriptomics or epigenomics have dissected the cellular and molecular heterogeneity in the brain organoids, revealing a complex organization. Similar but distinct protocols from different labs have been applied to generate brain organoids, providing a large resource to perform a comparative analysis of brain developmental processes. Here, we take a systematic approach to compare the single-cell transcriptomes of various human cortical brain organoids together with fetal brain to define the identity of specific cell types and differentiation routes in each method. Importantly, we identify unique developmental programs in each protocol compared to fetal brain, which will be a critical benchmark for the utility of human brain organoids in the future.
In Brief
Tanaka et al. report integrative analyses of single-cell RNA-seq for human brain organoids derived from different protocols. They find a unique preference of cell differentiation routes across protocols and provide a benchmark for the use and the improvement of human brain organoids.
Graphical Abstract
INTRODUCTION
Neural tissues differentiated from human pluripotent stem cells (hPSCs) have been utilized to probe early human embryonic brain development. Early studies used human embryonic stem cell (hESC)-derived embryoid bodies (EBs) to generate neural precursors, which were isolated, expanded, and directed to neurons, astrocytes (ASs), and oligodendrocytes (OLs) (Zhang et al., 2001). Further refinement led to the efficient production of neural progenitors by dual SMAD inhibition (transforming growth factor β [TGFβ] and bone morphogenetic protein [BMP] signaling pathways) under two-dimensional (2D) conditions (Chambers et al., 2009; Emdad et al., 2012; Hu et al., 2009). Although the utility of pure neuronal populations produced in 2D has a number of useful applications, such as disease modeling, they do not recapitulate key features of brain physiology. This has led the field to develop advanced three-dimensional (3D) in vitro structures that recapitulate the environment of the developing brain, so-called brain organoids (human cortical organoids [hCOs]; cortical spheroids) (Kelava and Lancaster, 2016; Lancaster and Knoblich, 2014).
The majority of protocols used to produce brain organoids are comprised of three common steps: (1) induction, (2) differentiation, and (3) maturation (Figure 1). In brief, for induction, EBs are produced and directed toward a cortical neuroectoderm fate with or without chemical inhibitors for up to 18 days in serum-free suspension culture. After the neuroectodermal induction, brain organoids are cultured in the differentiation medium containing supplements (e.g., N2 or B27), providing ideal conditions for cell survival and developmental progression to neuron and glial cells. To support morphogenesis and nutrient absorption, extracellular-matrix-based hydrogels and rotational bioreactors are applied during neuronal differentiation (Lancaster et al., 2013). Once patterned into a specific brain region, the organoids are matured in medium supplemented with retinoic acid and maintained long term.
Figure 1. Schematic View of the Culture System Generating hCOs.

Guided protocols are originated from Eiraku et al., 2008, while non-guided protocols are from Lancaster et al., 2013. Timeline of neural induction, differentiation, and maturation step is shown across protocols.
Recent advances in the brain organoid field have led to the development of protocols that allow efficient and rapid formation of brain organoids. These methods devised by multiple laboratories are broadly classified into either a guided or non-guided approach with regard to neuroectoderm initiation/commitment (Table 1). Sasai and colleagues established the first guided protocol by using a combination of inhibitors of the WNT, BMP, and TGFβ pathways, driving a rostral-dorsal pallial fate upon neuronal induction (Eiraku et al., 2008). Another study used inhibition of the sonic hedgehog (SHH) pathway to direct the formation of dorsal cortical organoids (Fiddes et al., 2018). For robust survival of neuronal progenitors, the above Sasai method was further modified by incorporating lipid concentrate, serum, heparin, and Matrigel, which facilitated the robust survival of neuronal progenitors (Kadoshima et al., 2013). Another study using this protocol showed the production of organoids exhibiting low variability in structure and gene expression (Velasco et al., 2019). To improve cortical lamination and functional synaptogenesis, the Pasca group used growth factors either during neuronal differentiation (FGF2 and EGF) or maturation (BDNF [brain-derived neurotrophic factor] and NT-3 [neurotrophin-3]), which supported lineage commitment and morphogenesis of organoids (Birey et al., 2017; Paşca et al., 2015). This method was also used to generate OL-containing cortical organoids (Madhavan et al., 2018) and establish oscillatory networks in these organoids under long-term culture with additional nutrients (e.g., cyclic AMP [cAMP] and vitamin C) (Trujillo et al., 2019). Xiang et al. (2017) used a guided approach to generate dorsal forebrain using a cocktail of WNT, BMP, and TGFβ inhibitors without Matrigel. The Knoblich group pioneered a non-guided method of brain organoid generation using the intrinsic property of hPSCs to differentiate toward the neuroectodermal lineage under serum-free conditions (Lancaster et al., 2013). The non-guided organoids did not display a specific regional identity but broadly contained clusters of cells representing the regions of a diverse rostral forebrain. Large-scale single-cell transcriptional sequencing revealed cellular diversity, maturity, and spontaneous neural networks in non-guided brain organoids (Quadrato et al., 2017). Recent complementation with air-liquid interface culture methods improved neuronal survival and outgrowth in non-guided brain organoids (Giandomenico et al., 2019).
Table 1.
Comparison of Medium Compositions and Single-Cell Transcriptome Libraries across Different Protocols
| Components | Fiddes et al. (2018) | Velasco et al. (2019) | Birey et al. (2017) | Madhavan et al. (2018) | Trujillo et al. (2019) | Xiang et al., (2017) | Quadrato et al. (2017) | Giandomenico et al. (2019) |
|---|---|---|---|---|---|---|---|---|
| Induction | ||||||||
| Basal medium | DMEM-F12 | Glasgow-MEM | DMEM-F12 | DMEM-F12 | Neurobasal | DMEM-F12 | DMEM-F12 | DMEM-F12 |
| Supplement | KSR | KSR | KSR | KSR | Gem21 NeuroPlex | KSR | KSR + N2 | KSR + N2 |
| β-Me | O | O | O | O | O | |||
| TGFβ inh. | O | O | O | O | O | O | ||
| BMP inh. | O | O | O | O | O | |||
| WNT inh. | O | O | O | |||||
| SHH inhi. | O | |||||||
| Differentiation | ||||||||
| Basal medium | Neurobasal | DMEM-F12 | Neurobasal | Neurobasal | Neurobasal | DMEM-F12 + Neurobasal (1:1) | DMEM-F12 + Neurobasal (1:1) | DMEM-F12 + Neurobasal (1:1) |
| Supplement | N2 | N2 + LC | B27 (−A) | B27 (−A) | Gem21 NeuroPlex + NEAA | N2 + B27 (−A) + NEAA | N2 + B27 (−A) + NEAA | N2 + B27 (−A) + NEAA |
| β-Me | O | O | O | |||||
| Insulin | O | O | O | |||||
| SHH inh. | O | |||||||
| Growth factor | FGF2/EGF | FGF2/EGF | FGF2 | |||||
| Matrigel | Yes | Yes | ||||||
| Maturation | ||||||||
| Basal medium | Neurobasal | DMEM-F12 | Neurobasal | Neurobasal | Neurobasal | DMEM-F12 + Neurobasal (1:1) | DMEM-F12 + Neurobasal (1:1) | DMEM-F12 + Neurobasal (1:1) |
| Supplement | N2 | N2 + FBS+ LC+ B27 (+A) | B27 (+A) | B27 (+A) | Gem21 NeuroPlex + NEAA | N2 + B27 (+A) + NEAA | N2 + B27 (+A) + NEAA | N2 + B27 (+A) + NEAA |
| β-Me | O | O | O | |||||
| Insulin | O | O | O | |||||
| Growth factor | BDNF, NT-3 | BDNF, NT-3 | BDNF. GDNF. NT-3 | BDNF | BDNF | |||
| Matrigel | Yes | Yes | Yes | |||||
| Others | PDGF-AA, IGF-1, T3, Ketoconazole, Clemastine, GSK2656157 | cAMP + Ascorbic acid | cAMP + Ascorbic acid | Ascorbic acid + HEPES + Sodium bicarbonate, air-liquid interface | ||||
| Single-cell RNA sequencing | ||||||||
| SRA ID | SRA: SRP121791 | SRA: SRP191528 | SRA: SRP096997 | SRA: SRP131980 | SRA: SRP139859 | SRA: SRP105219 | SRA: SRP083140 | SRA: SRP174405 |
| Age | ~5 weeks | ~6 months | 105 days | 10 weeks | 6 months | ~79 days | ~6 months | 75 days |
| Cell count | 13,747 | 81,524 | 4,953 | 3,743 | 3,295 | 23,707 | 43,706 | 13,009 |
PDGF, platelet-derived growth factor; KSR, KnockOut™ Serum Replacement; β-Me, β-mercaptoethanol; Inh., inhibitor; SRA ID, short read archive ID; N2, N-2 Supplement; LC, liquid concentrate; B27, B-27™ supplement; NT-3, neurotrophin-3; PDGF-AA, platelet-derived growth factor-AA; T3, triiodothyronine; NEAA, non-essential amino acid; BDNF, brain-derived neurotrophic factor; GDNF, glial cell line-derived neurotrophic factor; +A, with vitamine A; −A, without vitamine A.
Each study on brain organoids reported the comprehensive analysis of structure and function, including an analysis of cellular composition. However, no studies have yet evaluated how different methods gave rise to distinctive features in the brain organoids, which will be essential to determine the appropriate method for a specific purpose. Here, we have composited single-cell RNA sequencing (scRNA-seq) datasets from brain organoids generated by different approaches and dissected the state and heterogeneity of individual cells within these organoid models.
RESULTS
Organoids Derived from a Non-guided Protocol Possess a More Divergent Cell Composition
Microdroplet-based single-cell transcriptome profiles of cortical organoids from eight different protocols were collected from public resources (Table 1; Birey et al., 2017; Fiddes et al., 2018; Giandomenico et al., 2019; Madhavan et al., 2018; Quadrato et al., 2017; Trujillo et al., 2019; Velasco et al., 2019; Xiang et al., 2017). scRNA-seq from the developing human prefrontal cortex in gestational weeks 8 to 26 was added as a in vivo benchmark (Zhong et al., 2018). After filtering out the cells by quality control, a total of 190,022 cells were projected into an adjusted 2D space by Uniform Manifold Approximation and Projection (UMAP). All cells were classified into 24 distinct clusters (Figure S1A) and systematically labeled as 13 cell types based on the following combined parameters, including expression patterns of cell-type-specific gene signatures (Darmanis et al., 2015), Gene Ontology (GO) annotation, amino acid neurotransmitter transporters, and several unique markers (Xiang et al., 2019; Figures 2A, S1B, and S1C; see STAR Methods). We also implemented the web-based interface together with University of California Santa Cruz (UCSC) Cell Browser and provided a powerful interactive tool to explore all the composited scRNA-seq datasets (https://cells-test.gi.ucsc.edu/?ds=organoidatlas) that provide the identity of cell clusters, reference genes for each cluster, composition of each datasets, and aging of organoids among other important information. Overall, these diverse protocols produced brain organoids that exhibit similar cell repertoires, except for a few cell types (Figures 2B and 2C). In all cases, cortical neuron (CN), immature neuron (Neuron), neuroepithelial cell (NEC), and AS clusters were identified. A cluster of mesodermal cells (MEs) was identified in the Quadrato dataset (Quadrato et al., 2017). This is probably due to the non-guided and prolonged culture condition. Although endothelium and microglia cell are derived from the mesoderm, no substantial expression of these markers were detected in the majority of organoids, including the Quadrato study (Figure S1D). Cell clusters represented by cilium (cilia-bearing cell [CBC]) and BMP signaling (BMP-related cell [BRC]), which are crucial for early neurogenesis and survival (Guemez-Gamboa et al., 2014), were observed both in fetal brain and in all hCOs (Figure 2D). In the developing early brain, OLs originate in the ventral brain and migrate to the dorsal cortex (Kessaris et al., 2006). Because the dorsal origin of OLs arises at the postnatal stage, mature OL markers are absent in most of the region-specific brain organoids (Figure S1E). OLs cluster with the myelination factors (APOD and CSPG4) and were only identified in Quadrato’s non-guided organoids after long-term culture and in the fetal cortex where OL precursors have already migrated from the ventral side and matured (Figure S1E). ME or OL clusters were not detected in early stage non-guided organoid described by Giandomenico et al. (2019), implying that these cell types arose at a later stage of development.
Figure 2. Comparative Analyses of Cell Compositions among Different hCO Protocols.

(A and B) UMAP plot of 190,022 single cells distinguished by cell types (A) and protocols (B). AS, astrocyte; BRC, BMP-related cell; CBC, ciliabearing cell; CN, cortical excitatory neuron; GPC, glia progenitor cell; IN, interneuron; ME, mesodermal cell; NEC, neuroepithelial cell; OL, oligodendrocyte; PGC, proteoglycan-expressing cell; RGC, radial glia cell; UPRC, unfolded-protein-response-related cell.
(C) The presence of cell types in each organoid protocol and human fetal brain. Cell types with >0.25% of cells are denoted with a plus sign F, Fiddes et al. (2018); V, Velasco et al. (2019); B, Birey et al. (2017); M, Madhavan et al. (2018); T, Trujillo et al. (2019); X, Xiang et al., (2017); Q, Quadrato et al. (2017); G, Giandomenico et al. (2019).
(D) UMAP-based heatmap showing representative genes of cilium, BMP signal, and proteoglycan.
(E) Gene set enrichment analysis (GSEA) of gene signatures for neuron, replicating NPC, astrocyte, oligodendrocyte, endothelial cell, and microglia. The enrichment and depletion (−log10(FDR)) are scaled with red and blue color, respectively.
(F) Comparison of organoid ages and brain developing stage. Dots represent scRNA-seq datasets. Color scheme for protocols corresponds to Figure 2B. Pearson correlation coefficient and its statistical significance are also shown.
See also Figure S1.
In addition to the well-defined cell populations, previously uncharacterized cell types were identified in this unbiased analysis of scRNA-seq transcriptomes. In one of our previous studies, we identified clusters of cells that were different from both neurons and astrocytes but expressed genes for proteoglycan ([PGC] proteoglycan cluster) (Xiang et al., 2019; Figure 2D). We also found that PGCs were detectable in the human fetal cortex and indeed most of the hCOs datasets (Figure 2C). In particular, the long-term organoids from the Quadrato study produced a large number of cells categorized to the PGC clusters. The PGC clusters also highly expressed endothelial gene signatures, although none of the organoid systems reported here had any evidence of a vascular system, which was confirmed also by the lack of induction of the transcription factor ETV2, which facilitates endothelial commitment (Figures 2E and S1D; Cakir et al., 2019). PGCs, however, do not express any vasculogenesis markers (Figure S1C), suggesting that PGCs are potentially clusters of precursor cells for the endothelial lineage (Wurmser et al., 2004).
Developing human fetal brains display progressive change in transcription at different time points (Zhong et al., 2018). Likewise, developing brain organoids are expected to represent a certain developmental stage. We asked at which developing brain stage the given organoids represent and whether the different protocols used affect the developmental stage of the organoid. To estimate the developmental stage of the respective organoids, we compared the expression of the stage-specific genes obtained from fetal brains at 8 to 37 post-conceptual week (pcw) with those from each organoid scRNA-seq dataset. We then assigned the brain stage to the respective brain organoids with the highest enrichment of gene signatures corresponding to the “age.” Albeit the diversity in protocols, a significant correlation between organoid age and time point of fetal brain could be assigned (Figure 2F).
Together, these results suggest that hCOs generated from different protocols produce similar cell types and non-guided methods give rise to organoids with more heterogeneous cell compositions than those made by guided methods. Additionally, unbiased analysis in scRNA-seq revealed the presence of unique cell types derived from brain organoids.
Developmental Bypasses for Brain Development
Although similar cell clusters were found in hCOs developed from different protocols (Figure 2A), neuroectoderm commitment by different inhibitors in guided or non-guided differentiation are likely to follow different routes. To investigate this, we analyzed the dynamic process of cell fate transition and determined the differentiation trajectory during brain organoid development among the different protocols (Figure 3A; Lun et al., 2016). Pseudo-temporal modeling ordered cells from proliferative NECs to post-mitotic neuron and glia (Figure S2A; Cao et al., 2019). The reconstructed trajectory revealed the existence of multiple developmental bypasses (B1, B2, and B3) at the early stage of development (Figures 3B and S2B). Because the majority of NECs passed B1 bypass in all protocols, B1 is interpreted as the major neuronal differentiation route. One of the alternative routes, B2, also contains many mitotic NECs, and the minor alternative route B3 is mainly composed of CBCs and BRCs. Surprisingly, organoids from each protocol displayed a difference in selecting these bypasses (Figure 3C). The Sasai-based methods from Fiddes et al. (2018) and Velasco et al. (2019) showed the highest preference (>25%) for the B2 bypass but also produced a limited number of cells in B3. In contrast, our protocol (Xiang et al., 2017) and the non-guided approach of Quadrato et al. (2017) preferentially generated cells passing through the B3 bypass. To characterize transcriptional features among these developmental bypasses, we analyzed the dynamics of gene regulation in each bypass. Cells in B1 induced several replication genes related to the proliferation of neuronal stem cells (e.g., GINS2 and CDT1) and transcription factors controlling early neurogenesis and self-renewal (e.g., HELLS) (Figure 3D). In B2 bypass, cell cycle regulators (e.g., CCNB1 and CDC20) were preferentially expressed. The expression of genes for insulin response (e.g., IGFBP7 and TTR) were found in the B3 bypass that may be induced by insulin contained in the medium (Table 1). Our results underline that alternative differentiation routes that may exist during brain development can be selectively induced during organoid formation.
Figure 3. Comparative Analyses of Developmental Paths and Transcriptional Biases among Different Protocols.

(A–C) SNN graph visualization for differentiation trajectory.
(A) Color scheme for cell types corresponds to that in Figure 2A. Differentiation directions (arrows) were determined by pseudotime in Figure S2A.
(B) Estimated trajectory backbone from the SNN graph.
(C) Comparison of differentiation trajectory among different protocols.
(D) SNN-graph-based heatmap showing the expression of representative genes in each bypass.
(E) The number and characteristics of differentially expressed genes in each organoid protocol. The analysis was performed with the oldest organoid in each protocol.
(F) GSEA of Gene Ontology (GO) terms between in vivo fetal brain and in vitro organoid.
(G) Enrichment of disease-related genes in each organoid.
(H) The ratio of excitatory and inhibitory neurons among different protocols.
(I) Comparison of regional identify with NKX2–1 expression among the dorsal and ventral brain organoid. scRNA-seq datasets for the ventral organoid were obtained from Birey et al. (2017) and Xiang et al. (2017).
See also Figure S2.
Transcriptional Biases in Organoid Protocols
Next, we addressed whether specific biological processes are induced by different organoid protocols. scRNA-seq data from each organoid was compared with its corresponding developmental brain stage (Figure 2F). A small number of genes (approximately 10–100 genes) were differentially regulated for brain organoids derived from each protocol (Figure 3E). All organoid protocols showed a significant upregulation of genes related to either focal adhesion or endoplasmic reticulum (ER) that regulates protein trafficking in dendritic spines (Ramírez and Couve, 2011). In addition, a significant downregulation of aerobic respiration and an upregulation of apoptotic genes were observed in the organoids (Figure 3F). This observation may be a result of the limited exchange of oxygen and nutrient into the innermost regions of the organoids, given the lack of vascular structures in the system. This is also consistent with the previous findings that organoid models preferentially express glycolysis-related genes (Pollen et al., 2019). In terms of the utility of hCOs in modeling neuropsychiatric or other related diseases, we investigated whether the respective organoid systems have evidence of enrichment of disease-related genes. The majority of the protocols reported thus far did not display an inclination of gene expression involved in the given disorders (Figure 3G). Taken together, we conclude that current hCO systems are applicable for disease modeling or drug screening without concerns in the transcriptional biases toward specific disease-related genes.
Developmental Origin of Interneurons
In the rodent, GABAergic interneurons (INs) mainly emerge from the sub-pallial medial ganglionic eminences (MGEs) and caudal ganglionic eminence (CGE) (Butt et al., 2005). The majority of INs in primates are known to arise at the sub-pallial ventral cortex, whereas the dorsal forebrain origin of INs is an outstanding topic yet to be resolved. The field has become mired with a number of seemingly contradictory reports and these include the following: (1) more than half of the INs originate from the neocortical ventricular and subventricular zone of the dorsal cortex (Letinic et al., 2002), (2) human INs are primarily emigrants from the GE but also arise from dorsal cortex at a later stage (Zecevic et al., 2011), and (3) the vast majority of INs are derived from the GE (Hansen et al., 2013; Ma et al., 2013). In all cases, these conclusions were supported by immunohistochemistry against IN markers and retroviral labeling/tracing of INs in human fetal brain slices. However, there was no definitive proof for a ventral cortical origin for INs. Using fusion organoid models, we and others demonstrated that GABAergic INs arose from the MGE/sub-pallium and migrated into the cortex of hCOs, thus reproducing the tangential migration of INs in the developing cortex (Bagley et al., 2017; Birey et al., 2017; Xiang et al., 2017). Surprisingly, we noted that the hCOs generated without SHH agonists produced a substantial number of GABAergic INs that were distinct from INs of a MGE origin in that they did not express the canonical ventral ganglionic marker NKX2–1 (Xiang et al., 2017, 2019). Here, we addressed whether hCOs generated from other protocols contained INs. Regardless of the method of neuroectodermal initiation, guided or non-guided, or whether chemicals or cytokines were used, the majority of hCOs produced a significant number of the INs with the exception of the Birey et al. (2017) protocol (Figure 3H). None of hCOs displayed a ventral forebrain identity with no or negligible level of NKX2–1 expression detectable (Figure 3I). To address the Birey study and the lack of INs, which in part may have been a consequence of a small organoid sample size with repect to the limited scRNA-seq read counts, we further examined the presence of INs in the Birey organoids by bulk RNA-seq, which included data from both young and old brain organoids (Yoon et al., 2019). The GABAergic transporters (e.g., vGAT) were not detected at the early time point of their cortical organoids (<day 25), but these markers were highly expressed in older organoids (>day 50) (Figure S2C). Overall, the majority of hCO systems published so far appear to support the dorsal cortical origin of inter-neurogenesis. However, future research will be required to support these conclusions.
DISCUSSION
With the rapid advancement of single-cell-based technologies, enormous amounts of single-cell transcriptome datasets are readily accessible from the public domain, including scRNA-seq data from brain organoids. Our integrative analyses of the single-cell transcriptome of hCOs illustrated how the multiple “artificial’ culture systems remarkably reproduced both the developmental aspects and production of “de facto” brain tissue and defined the characteristics unique to brain organoids generated from each protocol. Our evaluation focused on transcriptional features of individual cells in the organoid. In future studies, combining the cell distribution and morphology, electrophysiological activities inside of organoids, and connectivity will be essential to assess functional aspects of brain organoids to understand human cortical development and to model brain diseases.
STAR★METHODS
LEAD CONTACT AND MATERIALS AVAILABILITY
Further information and requests for resources should be directed to and will be fulfilled by the Lead Contact, Dr. In-Hyun Park (inhyun.park@yale.edu). This study did not generate new unique reagents.
EXPERIMENTAL MODEL AND SUBJECT DETAILS
In this work, we studied single-cell transcriptome profiles of brain organoids, which were produced by different laboratories. The ages of the organoids are from one week up to six months.
METHOD DETAILS
Data Collection
The scRNA-seq datasets derived from microdroplet platforms were retrieved and collected from NCBI Short Read Archive. For 10x Genomics platform, either SRA or BAM-formatted files were downloaded and converted into fastq files by fastq-dump (v2.9.4) or bamtofastq (v1.1.2), respectively. Raw sequence files were mapped to the hg19 human genome and the latest Ensembl gene annotation by count function of CellRanger with default parameters (v2.1.0). Multiple sequencing runs from the same study were pooled using aggr function of CellRanger. For the other platforms of single-cell transcriptomes, gene-cell count matrices were obtained from NCBI Gene Expression Omnibus (GEO). We used PGP1 scRNA-seq datasets from Velasco et al. (2019) because PGP1 datasets include multiple batch replicates. Single-cell transcriptome profile from human fetal cortex was also obtained from NCBI GEO (Zhong et al., 2018). The count matrix table from bulk RNA-seq of hCOs by Birey et al. (2017) method (GSE120700) was downloaded from the NCBI GEO database (Yoon et al., 2019).
Preprocessing of scRNA-seq
All scRNA-seq libraries from hCOs and human fetal brains were integrated by Seurat (v3.0) under R (v3.5.0) environment. Briefly, as quality control, we removed cells, including less than 1,000 detected genes and genes expressed in less than 5 cells. For each organoid study, the feature counts were normalized to the total counts and multiplied by 10,000 scaling factor. Highly-variable features (genes) were then selected by Variance Stabilizing Transformation (VST). After prioritizing features by their variance across scRNA-seq libraries, top 2,000 features were retained for downstream analysis. Cell pairwise anchor correspondences between different single-cell transcriptome studies were identified with 30-dimensional spaces from canonical correlation analysis (CCA). Using these anchors, scRNA-seq datasets were integrated and transformed into a shared space. Gene expression values were scaled for each gene across all integrated cells and used for principal component analysis (PCA). Using 1st to 30th principal components (PCs), all cells were assigned into two-dimensional UMAP space. Cell clusters were identified with 1st to 30th PCs. Differentially-expressed genes in each cluster were identified with more than 1.25 average fold change and p < 0.05 by two-sided t test. Overrepresented GO terms were identified by GOstats (v2.24.0) (Falcon and Gentleman, 2007). False discovery rate (FDR) was estimated by Benjamini-Hochberg method with p.adjust function. FDR < 0.05 was defined as statistical significance.
Defining and Assigning Cell Types for Individual Cells
Cell types were assigned to the clusters as described previously with small modifications (Xiang et al., 2017, 2019). Briefly, the clusters were first separated by general neuronal markers (STMN2, GAP43, and DCX) and early neurogenesis genes (VIM, HES1, and SOX2) into two main groups: neuronal and non-neuronal group (Figure S1B). The neuronal group was further classified into the cortical neuron (CN) and interneuron (IN) according to the expression of cortical neuronal marker (TBR1) and amino acid synthetic enzymes and transporters (GAD1, GAD2, vGLUT1, and vGAT). Neuronal clusters without these specific genes were annotated as an immature neuron.
As shown previously (Xiang et al., 2019), human brain organoid and fetal brain include indeterminate cell types expressing biglycan and decorin. We allocated two clusters with high expression of these proteoglycans as the proteoglycan-expressing cell (PGC). Two clusters were annotated as a cilium-bearing cell (CBC) and BMP responsible cell (BRC) with the enrichment of genes related to “Cilium assembly (GO:0044458)” and “Response to BMP (GO:0030509),” respectively. Two non-neuronal clusters display the enrichment of genes related to “endoplasmic reticulum unfolded protein response (GO:0030968).” Four mitotic cell clusters were identified by high expression of cell cycle-related genes and assigned as proliferative neuroepithelial cell (NEC). A mesodermal cell cluster was identified with myosin (MYL1 and MYH3) and “myofibril (GO:0030016)” genes.
Five clusters showing a significant overrepresentation of “Glia cell differentiation (GO:0010001)” were categorized as glial cells and further annotated as oligodendrocyte (OL), and astrocyte (AS) by unique markers for each cell type (OLIG1/2, GFAP, SLC1A4 and S100B) and a GO term “Astrocyte differentiation (GO:0048708).” One glia cluster lacking these markers was labeled as glial progenitor cell (GPC). The rest cluster was labeled as intermediate. This annotation scheme was also drawn in Figure S1B.
The cell type annotation was verified in individual cells by gene signatures of the neuron, NEC, astrocyte, oligodendrocyte, microglia and endothelial cells, which were obtained as described previously (Xiang et al., 2017) from single-cell transcriptome in human fetal and adult brains (Darmanis et al., 2015) (Figure S1D). In each cell, genes are pre-ranked by relative expression to the average of all cells. The enrichment of the gene signature was evaluated by GSEAPY software (v0.9.3) with “–max-size 50000–min-size 0 -n 1000” options.
Glutamatergic and GABAergic neurons were defined by expression of their transporter genes (SLC17A7, SLC17A6, and SLC32A1).
Correlation analysis of organoid age with fetal brain stage
Transcriptome patterns in developing fetal brains (8, 9, 12, 13, 16, 17, 19, 21, 24 and 37 pcw) were downloaded from BrainSpan database (http://www.brainspan.org/). Differentially-expressed genes with 2 fold change and p < 0.05 with two-sided t test were defined as gene signatures of each developmental stage of brain. Subsequently, the enrichment of stage-specific gene signatures was evaluated by GSEA (v2.2.2) (Subramanian et al., 2005) with 1,000 permutations. For each single-cell RNA-seq in organoid, genes were preranked by relative expression to average of all single-cell RNA-seq datasets. The fetal brain stage with the most significant enrichment of its gene signature (FDR < 0.05) was determined as the corresponding stage of each brain organoid. Non-linear regression curve was drawn by Microsoft Excel.
Differentiation Trajectory Estimation of hCOs
Differentiation path of cells in hCOs was traced by shared-nearest-neighbors (SNN) graph based on PCA from Seurat analysis described above. SNN was constructed by buildSNNGraph function with default parameter in the scran Bionconductor package (Lun et al., 2016) and visualized with a force-directed algorithm. To draw the backbone of the differentiation trajectory, we used a graph embedding algorithm in Monocle (v2.99.3) package (Cao et al., 2019). Briefly, a monocle object was constructed from the UMI count matrix and preprocessed according to its instruction. We replaced data in “normalized_data_projection” and “reduced-DimW” slot with PCA and transposed PCA matrix, respectively. Transposed graph layout matrix was also replaced with data in “reducedDimS,” “reducedDimA” and “reducedDimK.” The principal graph was learned by learnGraph function with “RGE_method = ‘SimplePPT’, close_loop=T, prune_graph=T, euclidean_distance_ratio=5, geodestic_distance_ratio=0.1, minimal_branch_len = 0.1” options. Finally, pseudotime was calculated by selecting NEC1 cluster, which displays the highest expression of cell cycle genes, as a root node. Cells were then clustered by Louvain algorithm with “k=15” option and manually grouped according to the developmental bypass.
Genes with differential expression among bypasses were identified by > 1.25 fold and two-sided t test p value < 0.05.
Transcriptional comparison between organoid and fetal brain
For the analysis of transcriptional biases, we used the oldest organoid datasets in each study and compared them with the corresponding stage of fetal brain data. Differentially-expressed genes (DEGs) in each organoid method and human fetal brain were identified with > 1.5-fold change and p < 0.05 by two-sided t test. In each organoid experiment, unique DEGs were isolated and used for GO analysis. Potential disease-related genes were downloaded from DisGeNET database (Piñero et al., 2017). Genes with more than 0.25 confidence score were used for GSEA as described above. −log10(FDR) was used for evaluation of transcriptional bias of disease-associated genes.
QUANTIFICATION AND STATISTICAL ANALYSIS
Statistical details and software used for various types of data analyses in this work are cited in the appropriate sections in the STAR Methods. Briefly, I used rowttests() function for two-sided t test in the identification of differentially-expressed genes, p.adjust() for the multiple test correction, cor.test() for the calculation of Pearson correlation and the corresponding p value and hyperGTest() for the hypergeometic test in GO analysis in R software. Permutation test was performed in Gene Set Enrichment Analysis with GSEA software.
DATA AND CODE AVAILABILITY
The raw UMI count matrix combining all described single-cell transcriptome profiles is available at our Mendeley repository (https://data.mendeley.com/datasets/3wrtkk4w5v/1). OrganoidAtlas (https://cells-test.gi.ucsc.edu/?ds=organoidatlas) is available as an interactive web application to explore the composited scRNA-seq datasets. The accession numbers of public datasets used in this study are listed in Key Resources Table.
KEY RESOURCES TABLE.
Supplementary Material
Highlights.
Systematic comparison to uncover unique features in each brain organoid protocol
Similar cell compositions across protocols
Distinct preference of differentiation trajectories across protocols
Generation of interneurons from human cortical organoids
ACKNOWLEDGMENTS
I.-H. P. was partly supported by NIH (GM111667-01, R01MH118344-01A1, R01MH118554-01A1, R01AA025080-01, and R01CA203011-2), CSCRF (14-SCC-YALE-01 and 16-RMB-YALE-04), Kavli Foundation, and Simons Foundation. G.J.S. was partly supported by the Research Council of Norway through its Centres of Excellence funding scheme (project number 262613). Computation time was provided by Yale University Biomedical High Performance Computing Center.
Footnotes
DECLARATION OF INTERESTS
The authors declare no competing interests.
SUPPLEMENTAL INFORMATION
Supplemental Information can be found online at https://doi.org/10.1016/j.celrep.2020.01.038.
REFERENCES
- Amar D, Safer H, and Shamir R (2013). Dissection of regulatory networks that are altered in disease via differential co-expression. PLoS Comput. Biol. 9, e1002955. [DOI] [PMC free article] [PubMed] [Google Scholar]
- Bagley JA, Reumann D, Bian S, Lévi-Strauss J, and Knoblich JA (2017). Fused cerebral organoids model interactions between brain regions. Nat. Methods 14, 743–751. [DOI] [PMC free article] [PubMed] [Google Scholar]
- Birey F, Andersen J, Makinson CD, Islam S, Wei W, Huber N, Fan HC, Metzler KRC, Panagiotakos G, Thom N, et al. (2017). Assembly of functionally integrated human forebrain spheroids. Nature 545, 54–59. [DOI] [PMC free article] [PubMed] [Google Scholar]
- Butt SJ, Fuccillo M, Nery S, Noctor S, Kriegstein A, Corbin JG, and Fishell G (2005). The temporal and spatial origins of cortical interneurons predict their physiological subtype. Neuron 48, 591–604. [DOI] [PubMed] [Google Scholar]
- Cakir B, Xiang Y, Tanaka Y, Kural MH, Parent M, Kang YJ, Chapeton K, Patterson B, Yuan Y, He CS, et al. (2019). Engineering of human brain organoids with a functional vascular-like system. Nat. Methods 16, 1169–1175. [DOI] [PMC free article] [PubMed] [Google Scholar]
- Cao J, Spielmann M, Qiu X, Huang X, Ibrahim DM, Hill AJ, Zhang F, Mundlos S, Christiansen L, Steemers FJ, et al. (2019). The single-cell transcriptional landscape of mammalian organogenesis. Nature 566, 496–502. [DOI] [PMC free article] [PubMed] [Google Scholar]
- Chambers SM, Fasano CA, Papapetrou EP, Tomishima M, Sadelain M, and Studer L (2009). Highly efficient neural conversion of human ES and iPS cells by dual inhibition of SMAD signaling. Nat. Biotechnol. 27, 275–280. [DOI] [PMC free article] [PubMed] [Google Scholar]
- Darmanis S, Sloan SA, Zhang Y, Enge M, Caneda C, Shuer LM, Hayden Gephart MG, Barres BA, and Quake SR (2015). A survey of human brain transcriptome diversity at the single cell level. Proc. Natl. Acad. Sci. USA 112, 7285–7290. [DOI] [PMC free article] [PubMed] [Google Scholar]
- Eiraku M, Watanabe K, Matsuo-Takasaki M, Kawada M, Yonemura S, Matsumura M, Wataya T, Nishiyama A, Muguruma K, and Sasai Y (2008). Self-organized formation of polarized cortical tissues from ESCs and its active manipulation by extrinsic signals. Cell Stem Cell 3, 519–532. [DOI] [PubMed] [Google Scholar]
- Emdad L, D’Souza SL, Kothari HP, Qadeer ZA, and Germano IM (2012). Efficient differentiation of human embryonic and induced pluripotent stem cells into functional astrocytes. Stem Cells Dev. 21, 404–410. [DOI] [PubMed] [Google Scholar]
- Falcon S, and Gentleman R (2007). Using GOstats to test gene lists for GO term association. Bioinformatics 23, 257–258. [DOI] [PubMed] [Google Scholar]
- Fiddes IT, Lodewijk GA, Mooring M, Bosworth CM, Ewing AD, Mantalas GL, Novak AM, van den Bout A, Bishara A, Rosenkrantz JL, et al. (2018). Human-Specific NOTCH2NL Genes Affect Notch Signaling and Cortical Neurogenesis. Cell 173, 1356–1369.e22. [DOI] [PMC free article] [PubMed] [Google Scholar]
- Giandomenico SL, Mierau SB, Gibbons GM, Wenger LMD, Masullo L, Sit T, Sutcliffe M, Boulanger J, Tripodi M, Derivery E, et al. (2019). Cerebral organoids at the air-liquid interface generate diverse nerve tracts with functional output. Nat. Neurosci. 22, 669–679. [DOI] [PMC free article] [PubMed] [Google Scholar]
- Guemez-Gamboa A, Coufal NG, and Gleeson JG (2014). Primary cilia in the developing and mature brain. Neuron 82, 511–521. [DOI] [PMC free article] [PubMed] [Google Scholar]
- Hansen DV, Lui JH, Flandin P, Yoshikawa K, Rubenstein JL, Alvarez-Buylla A, and Kriegstein AR (2013). Non-epithelial stem cells and cortical interneuron production in the human ganglionic eminences. Nat. Neurosci. 16, 1576–1587. [DOI] [PMC free article] [PubMed] [Google Scholar]
- Hu BY, Du ZW, and Zhang SC (2009). Differentiation of human oligodendrocytes from pluripotent stem cells. Nat. Protoc. 4, 1614–1622. [DOI] [PMC free article] [PubMed] [Google Scholar]
- Kadoshima T, Sakaguchi H, Nakano T, Soen M, Ando S, Eiraku M, and Sasai Y (2013). Self-organization of axial polarity, inside-out layer pattern, and species-specific progenitor dynamics in human ES cell-derived neocortex. Proc. Natl. Acad. Sci. USA 110, 20284–20289. [DOI] [PMC free article] [PubMed] [Google Scholar]
- Kelava I, and Lancaster MA (2016). Stem Cell Models of Human Brain Development. Cell Stem Cell 18, 736–748. [DOI] [PubMed] [Google Scholar]
- Kessaris N, Fogarty M, Iannarelli P, Grist M, Wegner M, and Richardson WD (2006). Competing waves of oligodendrocytes in the forebrain and postnatal elimination of an embryonic lineage. Nat. Neurosci. 9, 173–179. [DOI] [PMC free article] [PubMed] [Google Scholar]
- Lancaster MA, and Knoblich JA (2014). Organogenesis in a dish: modeling development and disease using organoid technologies. Science 345, 1247125. [DOI] [PubMed] [Google Scholar]
- Lancaster MA, Renner M, Martin CA, Wenzel D, Bicknell LS, Hurles ME, Homfray T, Penninger JM, Jackson AP, and Knoblich JA (2013). Cerebral organoids model human brain development and microcephaly. Nature 501, 373–379. [DOI] [PMC free article] [PubMed] [Google Scholar]
- Letinic K, Zoncu R, and Rakic P (2002). Origin of GABAergic neurons in the human neocortex. Nature 417, 645–649. [DOI] [PubMed] [Google Scholar]
- Lun AT, McCarthy DJ, and Marioni JC (2016). A step-by-step workflow for low-level analysis of single-cell RNA-seq data with Bioconductor. F1000Res. 5, 2122. [DOI] [PMC free article] [PubMed] [Google Scholar]
- Ma T, Wang C, Wang L, Zhou X, Tian M, Zhang Q, Zhang Y, Li J, Liu Z, Cai Y, et al. (2013). Subcortical origins of human and monkey neocortical interneurons. Nat. Neurosci. 16, 1588–1597. [DOI] [PubMed] [Google Scholar]
- Macosko EZ, Basu A, Satija R, Nemesh J, Shekhar K, Goldman M, Tirosh I, Bialas AR, Kamitaki N, Martersteck EM, et al. (2015). Highly Parallel Genome-wide Expression Profiling of Individual Cells Using Nanoliter Droplets. Cell 161, 1202–1214. [DOI] [PMC free article] [PubMed] [Google Scholar]
- Madhavan M, Nevin ZS, Shick HE, Garrison E, Clarkson-Paredes C, Karl M, Clayton BLL, Factor DC, Allan KC, Barbar L, et al. (2018). Induction of myelinating oligodendrocytes in human cortical spheroids. Nat. Methods 15, 700–706. [DOI] [PMC free article] [PubMed] [Google Scholar]
- Paşca AM, Sloan SA, Clarke LE,Tian Y, Makinson CD, Huber N, Kim CH, Park JY, O’Rourke NA, Nguyen KD, et al. (2015). Functional cortical neurons and astrocytes from human pluripotent stem cells in 3D culture. Nat. Methods 12, 671–678. [DOI] [PMC free article] [PubMed] [Google Scholar]
- Piñero J, Bravo À, Queralt-Rosinach N, Gutiérrez-Sacristán A, Deu-Pons J, Centeno E, García-García J, Sanz F, and Furlong LI (2017). DisGeNET: a comprehensive platform integrating information on human disease-associated genes and variants. Nucleic Acids Res. 45 (D1), D833–D839. [DOI] [PMC free article] [PubMed] [Google Scholar]
- Pollen AA, Bhaduri A, Andrews MG, Nowakowski TJ, Meyerson OS, Mostajo-Radji MA, Di Lullo E, Alvarado B, Bedolli M, Dougherty ML, et al. (2019). Establishing Cerebral Organoids as Models of Human-Specific Brain Evolution. Cell 176, 743–756.e17. [DOI] [PMC free article] [PubMed] [Google Scholar]
- Quadrato G, Nguyen T, Macosko EZ, Sherwood JL, Min Yang S, Berger DR, Maria N, Scholvin J, Goldman M, Kinney JP, et al. (2017). Cell diversity and network dynamics in photosensitive human brain organoids. Nature 545, 48–53. [DOI] [PMC free article] [PubMed] [Google Scholar]
- Ramírez OA, and Couve A (2011). The endoplasmic reticulum and protein trafficking in dendrites and axons. Trends Cell Biol. 21, 219–227. [DOI] [PubMed] [Google Scholar]
- Subramanian A, Tamayo P, Mootha VK, Mukherjee S, Ebert BL, Gillette MA, Paulovich A, Pomeroy SL, Golub TR, Lander ES, and Mesirov JP (2005). Gene set enrichment analysis: a knowledge-based approach for interpreting genome-wide expression profiles. Proc. Natl. Acad. Sci. USA 102, 15545–15550. [DOI] [PMC free article] [PubMed] [Google Scholar]
- Trujillo CA, Gao R, Negraes PD, Gu J, Buchanan J, Preissl S, Wang A, Wu W, Haddad GG, Chaim IA, et al. (2019). Complex Oscillatory Waves Emerging from Cortical Organoids Model Early Human Brain Network Development. Cell Stem Cell 25, 558–569.e7. [DOI] [PMC free article] [PubMed] [Google Scholar]
- Velasco S, Kedaigle AJ, Simmons SK, Nash A, Rocha M, Quadrato G, Paulsen B, Nguyen L, Adiconis X, Regev A, et al. (2019). Individual brain organoids reproducibly form cell diversity of the human cerebral cortex. Nature 570, 523–527. [DOI] [PMC free article] [PubMed] [Google Scholar]
- Wurmser AE, Nakashima K, Summers RG, Toni N, D’Amour KA, Lie DC, and Gage FH (2004). Cell fusion-independent differentiation of neural stem cells to the endothelial lineage. Nature 430, 350–356. [DOI] [PubMed] [Google Scholar]
- Xiang Y, Tanaka Y, Patterson B, Kang YJ, Govindaiah G, Roselaar N, Cakir B, Kim KY, Lombroso AP, Hwang SM, et al. (2017). Fusion of Regionally Specified hPSC-Derived Organoids Models Human Brain Development and Interneuron Migration. Cell Stem Cell 21, 383–398.e7. [DOI] [PMC free article] [PubMed] [Google Scholar]
- Xiang Y, Tanaka Y, Cakir B, Patterson B, Kim KY, Sun P, Kang YJ, Zhong M, Liu X, Patra P, et al. (2019). hESC-Derived Thalamic Organoids Form Reciprocal Projections When Fused with Cortical Organoids. Cell Stem Cell 24, 487–497.e7. [DOI] [PMC free article] [PubMed] [Google Scholar]
- Yoon SJ, Elahi LS, Pasca AM, Marton RM, Gordon A, Revah O, Miura Y, Walczak EM, Holdgate GM, Fan HC, et al. (2019). Reliability of human cortical organoid generation. Nat. Methods 16, 75–78. [DOI] [PMC free article] [PubMed] [Google Scholar]
- Zecevic N, Hu F, and Jakovcevski I (2011). Interneurons in the developing human neocortex. Dev. Neurobiol. 71, 18–33. [DOI] [PMC free article] [PubMed] [Google Scholar]
- Zhang SC, Wernig M, Duncan ID, Brüstle O, and Thomson JA (2001). In vitro differentiation of transplantable neural precursors from human embryonic stem cells. Nat. Biotechnol. 19, 1129–1133. [DOI] [PubMed] [Google Scholar]
- Zhong S, Zhang S, Fan X, Wu Q, Yan L, Dong J, Zhang H, Li L, Sun L, Pan N, et al. (2018). A single-cell RNA-seq survey of the developmental landscape of the human prefrontal cortex. Nature 555, 524–528. [DOI] [PubMed] [Google Scholar]
Associated Data
This section collects any data citations, data availability statements, or supplementary materials included in this article.
Supplementary Materials
Data Availability Statement
The raw UMI count matrix combining all described single-cell transcriptome profiles is available at our Mendeley repository (https://data.mendeley.com/datasets/3wrtkk4w5v/1). OrganoidAtlas (https://cells-test.gi.ucsc.edu/?ds=organoidatlas) is available as an interactive web application to explore the composited scRNA-seq datasets. The accession numbers of public datasets used in this study are listed in Key Resources Table.